
The Lawson’s Test for Scientific Reasoning as a Predictor for University Formative Success: A Prospective Study

1
Department of Biology, Ecology and Earth Science, University of Calabria, Rende, 87036 Arcavacata (CS), Italy
2
AgoràLAB, Laboratory for the dissemination of technical-scientific culture, University of Calabria, 87036 Arcavacata (CS), Italy
*
Author to whom correspondence should be addressed.
Educ. Sci. 2022, 12(11), 814; https://doi.org/10.3390/educsci12110814
Submission received: 4 October 2022
/
Revised: 5 November 2022
/
Accepted: 9 November 2022
/
Published: 15 November 2022
(This article belongs to the Special Issue Innovation in Teaching Science and Student Learning Analytics)
Abstract
:Scientific Seasoning skills are crucial, both for successful learning in STEM areas and for the development of citizenship-oriented scientific literacy. The Lawson Test for Scientific Reasoning (LTSR) has been credited in the past for predicting the formative success of university students. In this context, we conducted a prospective study on a cohort (N = 1015) of university freshmen enrolled in science or engineering bachelor’s degrees, following them over three years. The freshmen were administered LTSR at the beginning of their university careers. At the end of the regular degree path duration, their formative achievement was measured. The descriptive statistical and correlational analysis of the collected data suggest a significant predictivity of the LTSR of formative success, in particular, for the people who scored highly in the test, while a low score performance does not seem correlated to a reduced formative success. Differentiated correlations are observed for the five conceptual dimensions that were explored by LTSR. The results presented could be useful in inspiring secondary school educational paths specifically aimed to promote students’ skills in the various conceptual dimensions of the Scientific Reasoning. Moreover, the possible predictivity for post-secondary educational success could make LTSR a useful operational tool for effective outgoing guidance actions in high schools.
1. Introduction
The development of Scientific Reasoning skills has long been a central goal of education in many countries. Many studies in the field of science education have been dedicated to investigating effective methodologies for promoting Scientific Reasoning skills at all school levels. In the United States, for example, the Educational Policies Commission [1] identified the development of the ability to think scientifically as the central objective of American education, defining it as “the essence of the ability to think” [2]. In this perspective, science and mathematics education were identified as fundamental vehicles for achieving a crucial goal [3,4,5]: the development of citizens “whose approach to life as a whole is that of a person who thinks—a rational person” [2] rather than the training of specific professionals (such as physicists, biologists, mathematicians, etc.). More generally, several research studies in education have reaffirmed that Scientific Reasoning skills and the acquisition of appropriate mental habits are the basis of scientific culture, articulated through (i) the development of mental skills and habits functional to knowledge building, (ii) understanding the fundamental concepts and unifying theories of science, as well as (iii) the communication ability necessary to inform and convince other people.
The need for a scientific culture is strictly linked to the development of a modern society. In fact, daily life is bombarded with a multitude of information that comes from different communication channels (internet, social, TV, YouTube, etc.). The ability to critically and consciously face this mess of information requires inclusive knowledge and skills of a scientific nature, not necessarily from a specific area, which allow everyone to develop critical ability to think and to participate actively and critically in social life. This context has been analyzed by an important number of studies, which sometimes have shown controversial aspects. The debate on this topic has led to the definition of Scientific Literacy, which has been defined as the amount of knowledge about science that everyone should know to consciously participate in social, civil and political issues [6,7]. This perspective has led to a new paradigm of science education, highlighting the value of the social dimension and of multidisciplinary discussions on issues related to scientific fields [8,9,10]. These studies showed that science is not strictly related to events that happen only in standard laboratories, which are completely detached from the rest of the world: they highlighted how science and technology represent social practices that allow us to construct the new society. In other words, considering the definition of Turrini et al. [11], it is necessary to introduce a Citizen Science that offers the opportunity to innovate science and to make it part of the innovation process of the contemporary society (see also [12]). Therefore, the concept of scientific literacy comes back and plays a crucial role, since it includes a much broader meaning when it is compared to what science teaching should offer to society [13]. In fact, scientific literacy should include the analysis of the social implications that are introduced by science [14]. Harlen [15] noted that the scientifically literate citizen should: (i) be able to appreciate and understand the impact of science and technology on daily life, evaluating the risks and benefits; (ii) be able to evaluate the impact of scientific ideas, concepts and processes in the decision-making processes (see also [16,17]); (iii) have an open mind to accept alternative points of view based on scientific evidence. Likewise, Hofstein, Eilks and Bybee underlined the role of learning science and technology in the school environment in order to reach a greater inclusion and participation of students/citizens in social issues [18].
A considerable number of studies have been devoted, in the psychometric field, to develop and validate adequate diagnostic tools for monitoring different segments and phases of the educational processes.
In a different perspective, various actions have been dedicated in the university context to monitor the training processes and the system’s evaluation, starting from the very early years of the current century. The main goal of these actions is oriented towards the pursuit of having a good quality of education, in the context of the European Higher Education Area, which has been initiated with the Bologna Declaration of 1999 [19].
The research described in this paper represents the synthesis of the two perspectives introduced above. In fact, the implementation of effective guidance actions depends also on the availability of reliable diagnostic tools that are capable of providing important information on the students’ attitudes and propensities in order to effectively guide their choices as well as to design effective and efficient training courses. Among these tools, psychometric tests are particularly relevant for assessing the aptitude for Scientific Reasoning, especially if they demonstrate a good degree of predictivity towards university educational success. The research described in this paper was carried out in this context, with the aim of evaluating the degree of predictivity of university educational success in the technical/scientific field for one of the best-known tests for measuring the aptitude for Scientific Reasoning: the Lawson’s test [20]. The main goal of this paper is to study the predictivity of the Lawson’s test in order to verify if (and to what extent) the performance in this test correlates with educational success. This kind of information could be useful for guidance process of secondary school students.
The paper is organized as follow: Section 2 introduces, in detail, the specific test that was used in our study and describes the methodology that was used in our research, the context of research, the materials/tools that were used and the methods of data acquisition and processing; Section 3 describes the experimental results and their discussion; finally, Section 4 illustrates the conclusions of our study in relation to the context in which it took place.
2. Materials and Methods
Scientific Reasoning (SR) (i.e., “evidence-based” reasoning) is the basis for the production of scientific knowledge. It represents the method that offers the opportunity both to collect/analyze experimental evidence and to create links between concepts and theories. This type of reasoning is characterized by two general aspects: deduction and induction. Science has always used deductive logic to test hypotheses in order to remain objective and gather evidence to support (or refute) the hypotheses themselves. An important supporter of this viewpoint on science, Karl Popper, believed that the hypothetical-deductive reasoning is the obligatory way to conduct science: once a theory is confuted, it is no longer useful in that given form, thus giving rise to a dialectical process that is aimed at obtaining increasingly faithful approximations of “reality” [21]. However, as science has been increasingly seen in its social perspective, the role of induction has been implicitly legitimized by philosophers such as Thomas Kuhn [22]. While this new vision of science has recognized the crucial role that is played by the collection of experimental evidence through traditional hypothetical-deductive methods, on the other hand, it has established the importance of the joint use of the confirmation–confutation binomial approaches in order to guide and modify theory-inspired research programs and paradigms.
These reasoning models, i.e., the mental strategies that are used to process information in order to reach conclusions, are an integral part of procedural (or operational) knowledge, which are strictly connected to a performance.
SR is a multidimensional construct [23], based on different models, among which a crucial role is played by those who are inspired according to the framework given by Inhelder and Piaget. In particular, this framework inspired a well-known tool for measuring the scientific reasoning skills (i.e., the Lawson’s test [20]) based on a hypothetical-deductive scheme, with several sub-schemes that are defined as “formal-operational schemes” [24]. These sub-schemes (e.g., the combinatorial scheme, cause-effect proportionality scheme, and so on) can be classified as argumentative “modalities” or “forms”, such as argumentation by analogies, argumentation by concomitant variation, argumentation by agreement, etc. [25].
2.1. Dimensions of Intelligence and Predictors of Educational Success
General intelligence is considered a good predictor of educational success in school and academia [26,27,28,29]. However, it does not reflect any explicit theoretical concept, and therefore, there is no procedure to measure it [30]. Consequently, there is a copious amount of experimental researches that is aimed at investigating a more direct correlation between educational success and a series of skills specifically related to working memory [31], rather than to general intelligence (see [32] and the references provided there; [26]). In fact, the type of intelligence that is referable to skills that are related to the working memory allows to face fundamental and concrete processes that can be framed within the interpretative theories of this type of memory [26,33].
A relevant set of skills related to the working memory can be associated to the structure of reasoning known as SR. With this expression, we mean in a broad sense, the ability to apply methodologies and principles of scientific investigation to reasoning, specifically, those concerning problem-solving situations (in particular, the skills necessary to formulate, test and revise theories, as well as at a higher level, those necessary to reflect on the process of acquiring empirical knowledge) [34,35,36]. In fact, the working memory represents a central hub of the feedback process through which the incremental processing of sensory information takes place [31]: this process (implicit and instinctive) is substantially corresponding from the viewpoint of its logical structuring to the various phases of knowledge acquisition and elaboration that are typical of modern science.
In this context, it is clear why the diagnostic tools of SR assume a particular importance as predictors of the educational success. Several studies have been conducted on the connection between educational success and performance in various psychometric tests concerning reasoning skills. However, most of these studies concern tests that are aimed at measuring skills which are specifically related to the working memory [30,33,37], rather than the set of skills in relation to which the working memory constitutes an element of a complex feedback process.
The experimental work illustrated in this paper was planned in this framework with the aim of answering the following research question:
RQ: which are the correlations that exist between academic success and performance in a test—the Lawson’s test [38]—specifically developed to measure the broad set of reasoning skills belonging to the category of SR?
2.2. Lawson’s Test for Aptitude for Scientific Reasoning
The Lawson’s test used in this study measures the student’s ability to apply the reasoning schemes that are used to verify hypotheses.
The first version of the test was published in 1978 [20], then it was slightly modified in 1992 [39], and most recently in 2000 [38]. It was validated by numerous studies [20,38,39]. We used the latter version, which had been translated into Italian on written worksheets. It takes 60 min to complete, and it consists of 24 items that are organized in 12 pairs. In each pair, the first item (odd numbered) proposes a problematic situation and requires an answer regarding its interpretation; the second item (even numbered, which is consecutive to the previous odd one) proposes different alternative reasons for the answer given in the odd item, among which it is necessary to choose the reason that is considered to be correct. For each of the 24, there are multi-choice answers with 3, 4 or 5 possibilities (depending on the item). A score equal to 1 is assigned (to a given couple) if both of the answers are correct, and so that the maximum achievable score is equal to 12. The score obtained can then be converted into 100ths (by multiplying it by 25/3).
The version of the test that was used in the present study contains 10 pairs of items from the original 1978 test, and two new pairs (items 21–22 and 23–24) concerning, respectively, a conceptual experiment on a lit candle and another one on red blood cells. Each of these new elements of the test requires [38,40] the use of hypothetical/deductive reasoning to verify hypotheses involving the not-observable entities.
The reasoning skills investigated by the test (test dimensions) are indicated in Table 1, together with the corresponding pairs of items.
Table 2 illustrates the score ranges achievable in the Lawson’s test, which have been categorized by empirical studies and interpreted in the literature [38,41,42] in terms of some types of reasoning that are summarized in Table 2.
Extensive statistical studies [38] demonstrated that the differences in the performance observed for each item depend (statistically) only on the differences between the formal operational schemes used to answer the questions, and not on the difference in their degree of specific declarative knowledge of the area to which each item refers.
2.3. Context
In order to investigate the correlations between the performance in the Lawson’s test for SR and university educational success in the technical-scientific field, we enrolled a sample of university students in September 2016 at the beginning of their university career. After three years, i.e., at the end of their three-year degree, in February 2020 (just before the beginning of the pandemic), we obtained the data related to their university career from the administrative office of the University of Calabria.
More specifically, we involved 1140 students who were enrolled in the 2016/17 academic year: 577 of them belonged to various degree courses in the scientific area (physics, mathematics, chemistry, biology, earth sciences, ecology) and 563 of them belonged to the engineering area. After applying the protocol of the data analysis, which is described in the next subsection, we analyzed only 1015 tests; 492 of them belonged to the scientific area (in the following “science subset”), and 523 of them belonged to the engineering area (“engineering subset”). Table 3 summarizes the classification of students in terms of gender and of area.
Students were also classified according to the kind of high schools they attended. Figure 1 shows a clear prevalence of high schools (more than 50% of the students were in the science subset, and more than 55% of the students were in engineering subset). Technical institutes represent the second group of schools of which the students of our sample attended (about 36–37% for both of the fields).
In compliance with privacy laws, the students were only followed through their identification number. Table 4 summarizes the data obtained from the administrative offices (there are no names, nor are there birthplaces and residences).
Finally, Figure 2 summarizes the distribution of the enrolled students obtained after the application of Lawson’s test, which is described in the previous section.
2.4. Methods
This section illustrates the methods of the administration of Lawson’s test, the acquisition of the data of the students’ careers and the criteria and procedures that were used for the analysis of these data.
2.4.1. Methods of Administration of Lawson’s Test and Acquisition of Careers Data
The Lawson’s test was administered during the last week of September 2016 and the first week of October 2016 (more precisely, from 26 September to 8 October 2016). During this period, the students of the various degree courses in both areas (scientific and engineering area) were organized in very large classes (from 80 to 200 students) to follow basic teaching modules (i.e., “Introduction to the experimental methods”, “Introduction to computer science”, etc.). This circumstance made it possible to involve, in a very short period (only two weeks), a large number of students, whose participation was on a voluntary basis. The students were asked to indicate only their identification number; they were explicitly assured that their personal data (in particular, their names) would not be obtained/monitored during the research. They were also ensured that the data related to their career (the exams that they passed with a corresponding ECTS awarded at the end of their third year, more precisely, at the beginning of February 2020) would be provided by the respective didactic secretariats; such data were associated, exclusively, to their identification number, and in this way, we ignored their corresponding names.
2.4.2. Criteria and Methods of Data Analysis
As aforementioned, only 1015 of the 1140 students that were involved in the Lawson’s test were considered to be valid for our study. In fact, 36 participants were excluded from our analysis for one or more of the following reasons:
- (i)
- They chose more answers to one or more questions;
- (ii)
- They wrote unsolicited and inappropriate comments;
- (iii)
- They did not write the identification number.
The personal and career data described above were acquired for the remaining 1104 students. Among the remaining 1104 students, 89 of them were excluded because they gave up their studies within the first year of their course or because their careers data were incomplete. In this way, we analyzed the data of 1015 students (see Table 5).
A crucial point in the analysis of the careers data is the adequate definition of “educational success”. In fact, this concept can be given various meanings (for example, considering only educational goals belonging to the training course or other external social goals like their insertion into the world of work). Consequently, also the adoption of appropriate quantitative indicators of this parameter is affected by the same variability (see, for example, the following papers and the references that are present in: [32,43,44,45]). In this context, considering the nature of our study based only on the elements that are internal to the university courses, we decided to take the following global parameter as a quantitative indicator of educational success:
where is the total number of exams that the student is required to take by the study plan for each degree course, while and are, respectively, the passing mark (out of thirty) and the number of ECTS credits assigned to the i-th exam at the end of the three-year period. This parameter, of course, considers also the not-yet-passed exams at the end of the three-year period by attributing the value “zero” to the marks corresponding to the not-yet-passed exams. For completeness of information, it should be noted that the Italian scoring system for university exams ranges from zero to thirty. An additional score (i.e., thirty cum laude) is attributed only to very brilliant performances in the examinations. In order to simplify the analysis of data, the maximum ordinary score (i.e., thirty) and the additional score (i.e., thirty cum laude) were both considered to be equal to thirty in our investigation. Just to give an example, the value corresponds to the case of a student who passed all of the required exams within the three-year period with a mark of 30 (or 30 cum laude) in each exam.
Another relevant aspect of the methodology of processing the experimental data is represented by the method of the evaluation of the Lawson’s test. In particular, it is possible to evaluate it in a global way, without taking into account the analytical differentiation of the various investigated conceptual dimensions, or it could be evaluated considering the kind of analytical differentiation. In regard to the global evaluation of the test, the score assigned takes into account the structure of the Lawson’s test (described in Section 2.2), characterized by 12 pairs of items: in each pair (1–2; 3–4, etc.), the odd item proposes a physics situation with alternative answers, while the subsequent even item proposes different motivations for the answer that were given to the corresponding odd item. In this way, the correct answer that was provided for a given situation (odd item) corresponds to a score only if the corresponding motivation (answer to the even item) is also correct. This particular method of scoring the Lawson’s test () is achieved efficiently through the simple formula:
where is the score attributed to the n-th item (it can be 0 or 1). It is easy to verify that with the adopted normalization, can vary between 0 and 100. In particular, corresponds to a test in which all of the answers (to odd items) and the related motivations (even items) are correct.
Regarding the evaluation of the Lawson’s test in relation to the five dimensions in which it is divided, it was carried out with formulas that are similar to (2), in which the sums concern only the number of pairs of the items referring to the specific dimension, instead of 12 pairs of items. Furthermore, in each of the five cases, the numerical coefficient preceding the total sum of Formula (2) was replaced by a suitable constant that allowed the student to reach the maximum score (100) that was achievable for that given dimension. For example, for the conceptual dimension, the “Control of variables”, the corresponding pairs of items were three: 9–10, 11–12 and 13–14. Consequently, to obtain the score related to this dimension, the total sum had to be performed only on these three pairs and the coefficient would be 100/3 instead of 25/3.
3. Results
In this section, we discuss the analysis of the collected data with the aim of answering the research question that was introduced at the beginning of the paper, i.e., the possible correlations between the educational success of students, expressed through the parameter defined by Equation (1), and the performance of each student in the Lawson’s test. In particular, in the next subsections, we discuss the analysis of the data (a) considering the global value defined in Equation (2) without considering the individual dimensions investigated by the Lawson’s test, and (b) distinguishing the different classes of skills explored by the Lawson’s test.
3.1. Correlation with Global Performance
Figure 3 shows the score distribution of to the global performance in the Lawson’s test for the two subsets of students (the scientific and engineering areas).
A first comparison between the two subsets of students shows that the engineering students reached a better level of performance than the students in the scientific area. Moreover, the distribution of the score of the engineering subset is closer to a normal distribution than the distribution of the score of the scientific subset, which appears to be shifted towards the low range of scores. These qualitative observations are confirmed by the mean values and the standard deviation of that were obtained for the two subsets, which are 38 (mean value) and 21 (standard deviation) for the science subset and 61 (mean value) and 16 (standard deviation) for the engineering subset, respectively.
Figure 4 shows the score distribution of the global educational success, distinguishing the results obtained by the students belonging to the two different areas (scientific and engineering). Although the two distributions appear to be quite similar, a slightly higher levels of can be observed for the students of the science subset. However, this difference is not very meaningful from a quantitative point of view since the mean values of for the two subsets of students are 56 and 50, respectively, while the deviation in both of the cases is equal to 27.
The qualitative comparison between Figure 3 and Figure 4 suggested to us that we should perform a comparison between the score distribution of the two parameters ( and ) within each of the two subsets. This comparison is shown in Figure 5: part (a) compares the and distributions for the engineering subset, while part (b) shows the same comparison for the science subset. Apparently, none of the results in Figure 5 suggest that there is a correlation between the two parameters of interest ( and ). Moreover, they do not suggest a positive correlation; in fact, a careful examination of Figure 5b highlights a kind of “inversion of population” between the distributions of and : for the first parameter (red bars), the mean/low-score classes are more populated than the high-score classes, while the opposite trend can be observed for the second parameter (green bars).
This qualitative analysis is compatible with a possible negative correlation between the two parameters ( and ), at least for the group of students of the science subset. However, this hypothesis was refused by the following observation: considering the same score classes for both of the parameters, it was not possible to decide if the students belonging to such classes were the same or not for the two parameters. An explicit example can help to clarify this observation. If we consider the 70–80 score class for the science subset (Figure 5b), we can observe that it comprises 3% of the subset (corresponding to 15 students) in terms of the performance in the Lawson’s test and the 11% of the same subset (corresponding to 54 students) for the educational success parameter. However, these data do not imply that the two groups are necessarily constituted by the same students.
Therefore, this qualitative discussion suggested further representations and analyses of the data, starting from the dispersion in the Cartesian plane . Such a representation is shown in Figure 6 for the students of the engineering subset and in Figure 7 for those of the science subset in two different configurations: the usual two-dimensional form (Figure 6a and Figure 7a) and a meaningful three-dimensional elaboration (Figure 6b and Figure 7b). In such graphical representations, the correlation between the parameters represented on the two axes is visually encoded by the (more or less) marked distribution of the population along the diagonal of the plane . Comparing Figure 6 and Figure 7, we can observe that this correlation appears to be more evident for the subset belonging in the engineering area.
Figure 8 shows the dispersion of the total sample of students (engineering subset + science subset) in the plane . In this different representation, the score for the Lawson’s test is classified into 13 classes (12 pairs of items + 1 class corresponding to the score equal to zero), but it is represented again from 1 to 100 to facilitate the comparison with the other representations. For each score class, the vertically aligned dots represent the students that achieved such an score, which are distributed (vertically) according to the educational success scores achieved by each student. The black rectangles, instead, indicate the mean value (over the scores) of the fixed score class , and the corresponding black vertical bars indicate the respective deviations from that mean value.
Figure 8 puts in evidence the existence of a positive correlation between the two parameters and suggests estimating the values by also employing the angular coefficient of the best-fit line evidenced in the figure. In order to obtain a quantitative value of the correlation, we used the Pearson’s correlation coefficient [46], determined separately for (i) the science subsets, (ii) the engineering subset and (iii) the total sample of students. We determined, also, the corresponding significance index and the angular coefficient of the best-fit line for each group. The results are shown in Table 6.
These data indicate the existence of a clear positive correlation between the educational success and the performance in the Lawson’s test for the entire group of students (, ), with a probability of null hypothesis rejection of 99.2%. However, the analysis of the correlations for the two subsets (science and engineering) shows a marked heterogeneity between them. The engineering subset reached a higher and more reliable degree of correlation than the whole sample ( and , and a probability of null hypothesis rejection of 99.8%). The science subset was characterized by a lower correlation coefficient () with a degree of reliability close to 90%.
The former discussion seems to give a positive answer to our research question. However, the differences between the two subsets suggested that we should conduct a further in-depth analysis. To this end, it was useful reconsidering the data in Figure 3, taking into account that the students of the engineering subset presented a better performance in the Lawson’s test (mean value score ) than the performance of the students of the science subset (mean value score ).
This suggested that we should carry out separate analyses for the different quartiles (instead of distinguishing between the two subsets) of the performance distribution in the Lawson’s test. The results of this quartile analysis are summarized in Figure 9, which shows a clear correlation between the performance in the Lawson’s test and the formative success in the upper two quartiles. Conversely, for the first quartile the correlation is very poor, and it becomes significant for the second quartile.
This analysis suggests that the Lawson’s test could be a good predictor of educational success only “in positive”, i.e., when the score gained by students is higher than 65/100. Conversely, a low score in the Lawson’s test does not allow us to predict a reduced educational success.
We conclude this section by pointing out that the statistical analysis that was performed separately for the two genders (female and male) of the total sample (divided by quartiles within each gender) showed similar correlation coefficients obtained for the females and males. Therefore, the predictive characteristics of the Lawson’s test are undifferentiated concerning the gender.
3.2. Correlation Analysis with the Individual Dimensions of the Lawson’s Test
In the previous subsection, we analyzed the students’ career data in terms of their possible correlation with the global score achieved in the Lawson’s test. However, the test investigates five distinct dimensions in which the attitude to SR can be articulated (see Table 1 in Section 2.2). This structure of the Lawson’s test suggested that we should explore the possible differences in the analysis of the correlations between the educational success score and the Lawson’s test score considering its five dimensions.
Figure 10 shows the mean value of the achieved by the whole sample, which is related to the individual dimensions that were investigated by the Lawson’s test. The percentage indicated for each dimension refers to the score obtained in the items of the test associated to that specific dimension, compared with the maximum score that was achievable on those specific items. The dimensions of the reasoning in which the students showed deficiencies are hypothetical-deductive and proportional reasoning; conversely, the dimensions inherent to the conservation and to the probabilistic reasoning showed higher performances. It is important to highlight that we discuss the correlation analysis for each dimension only for the upper two Lawson’s quartiles of the total sample. It is worth observing that a similar analysis can be carried out for the lower quartiles, however, the weakness () of the observed correlation for the first two quartiles does not allow us to evidence an association between and .
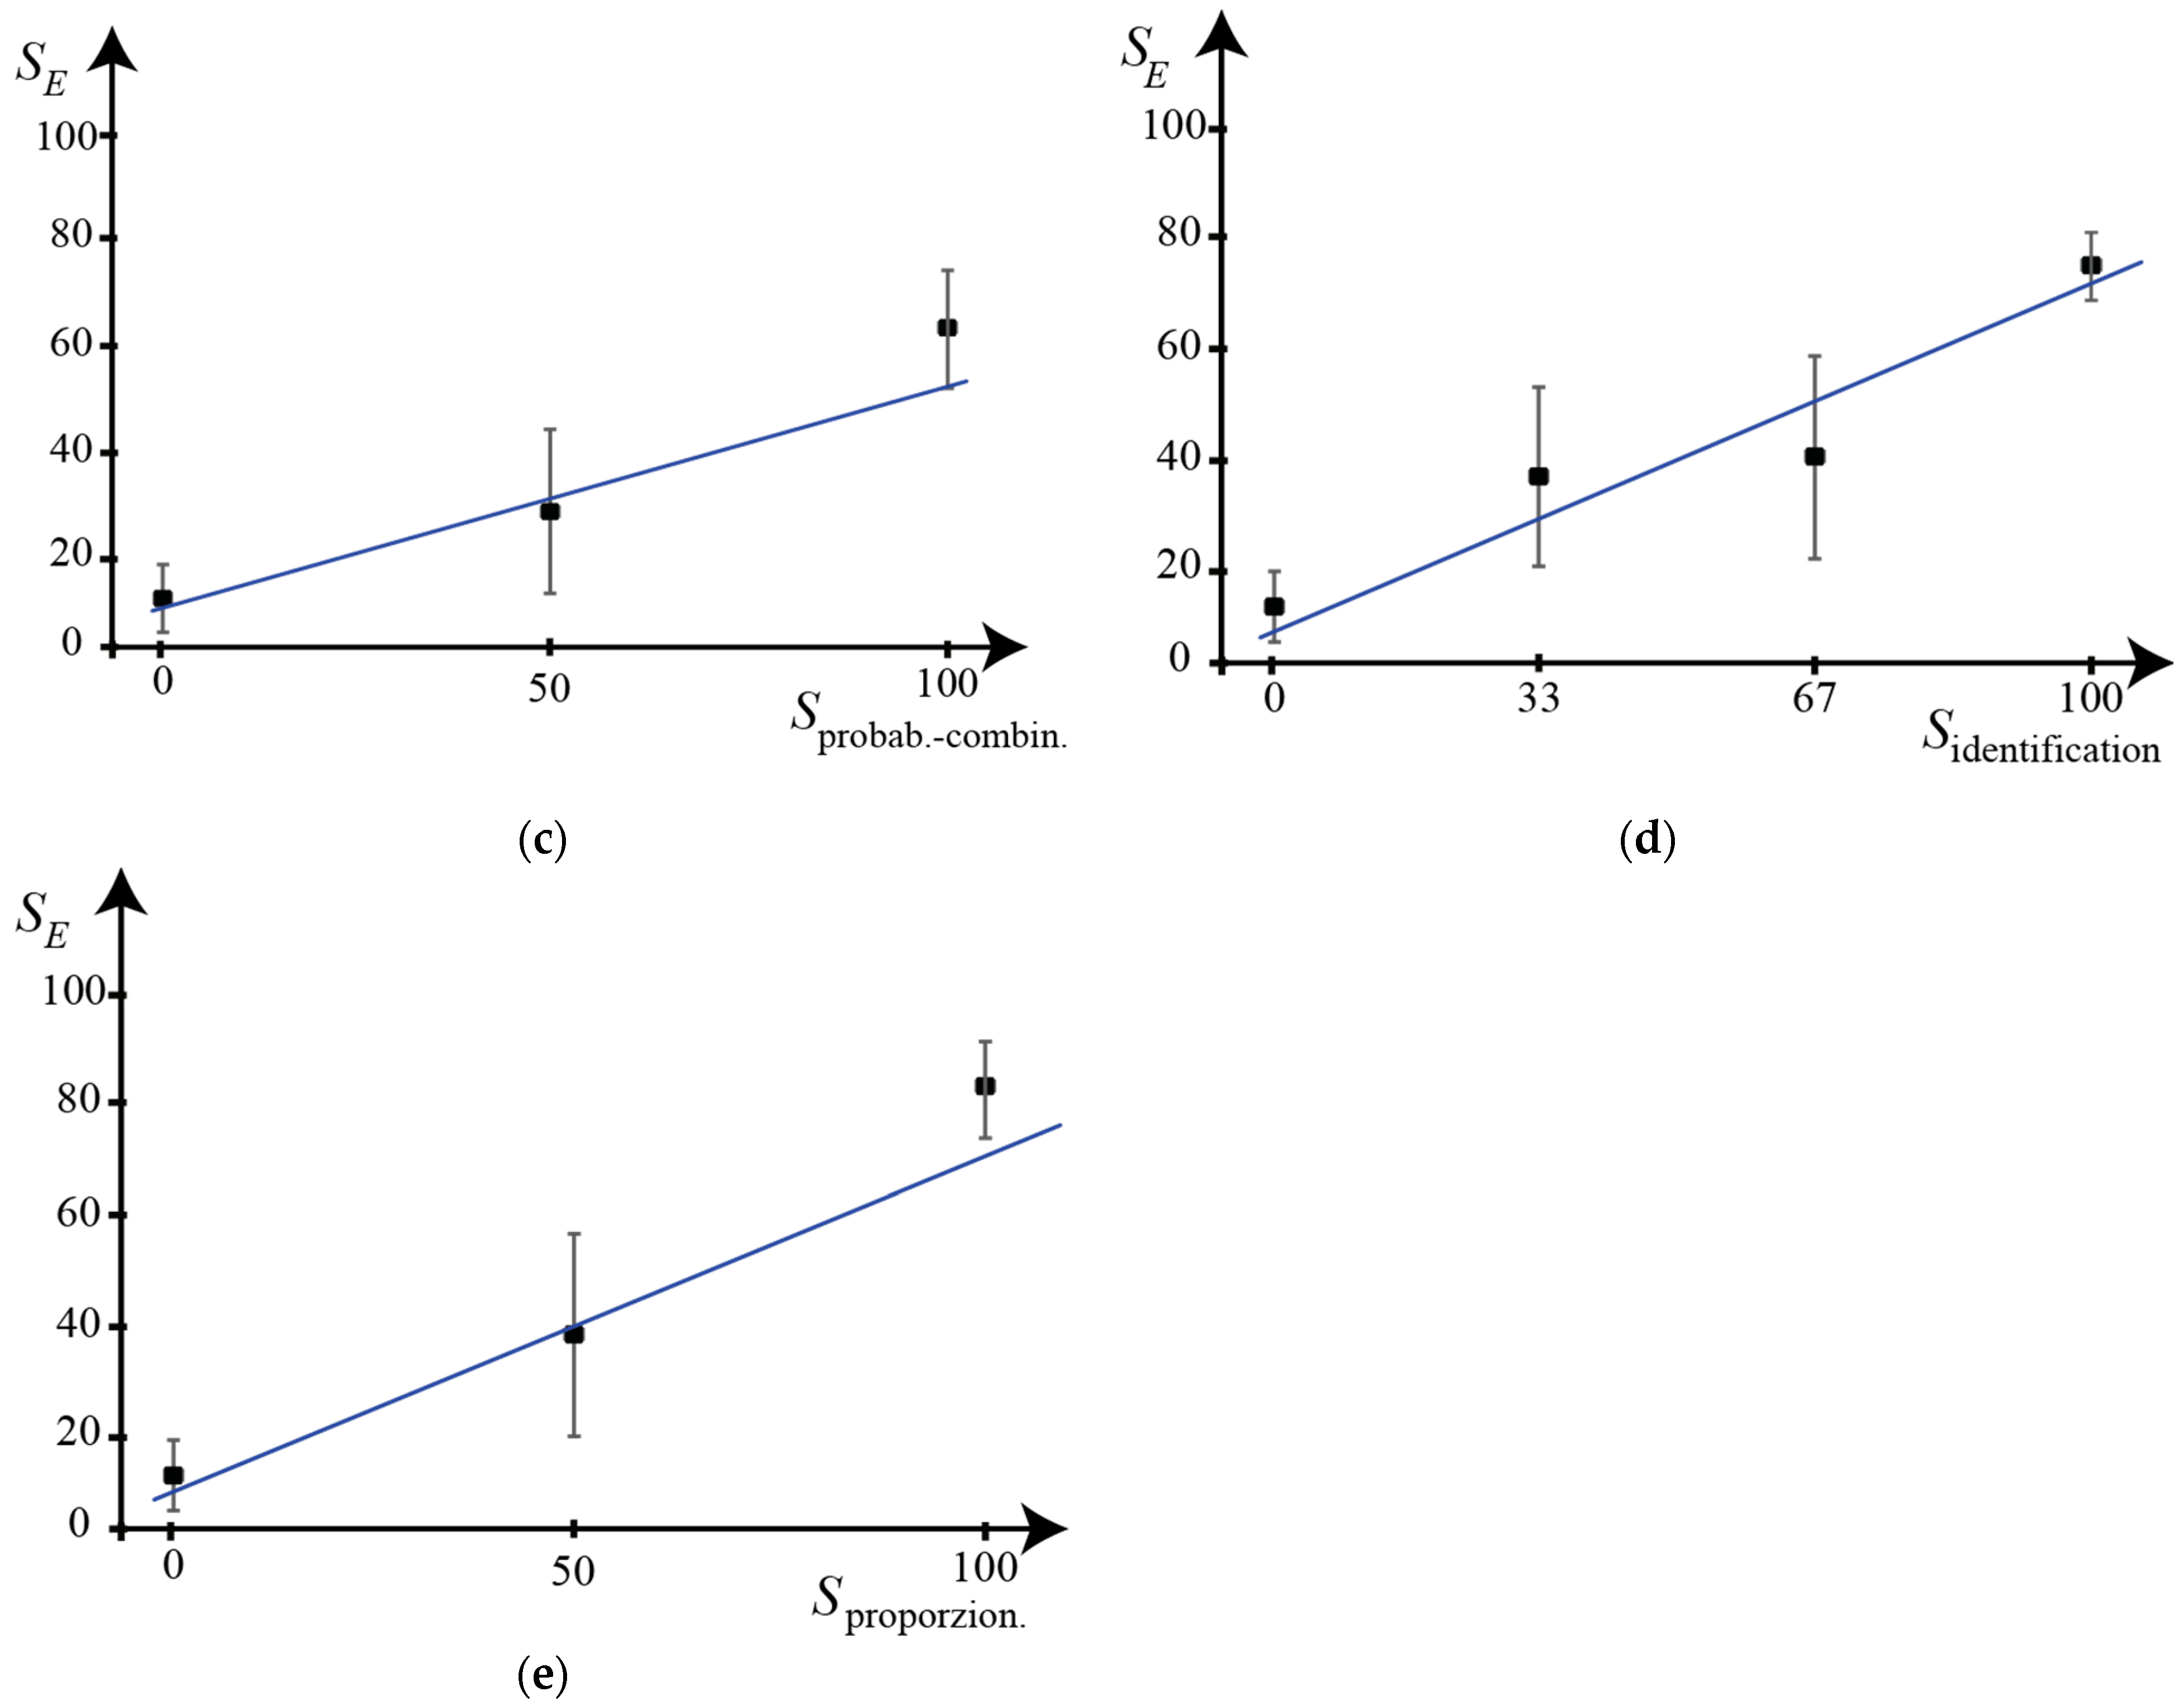
Another interesting analysis was the construction of the dispersion of students in the plane, where represents the score obtained only with the items related to the dimension of the Lawson’s test (Table 1 in Section 2.2). We observe that the score classes for a given dimension are equal to the number of pairs of items for that dimension plus one. For example, the dimension “Identification and control of variables” includes three pairs of items, and consequently, the score that is achievable for this dimension can assume one of the values from zero to three (i.e., 0, 1, 2 and 3). Converting this range of values into 100ths (for uniformity with the other representations), the score that is achievable for the considered example can be 0, 33, 67 or 100.
Figure 11 shows the five scatter plots versus the partial scores, which were obtained for the two upper Lawson’s quartiles of the total sample (the students of the engineering and science subsets). We avoided the representation points of the single clusters of students corresponding to a specific couple of values (i.e., the equivalent of the orange dots in Figure 8) because in this case, they would not provide any concrete information on the characteristics of the sample.
The angular coefficient of each best-fit line was determined from the raw data, and it was related to the corresponding reasoning dimension, rather than from the representative points of the mean value of the single class of partial scores (i.e., the points represented on the graphs by full squares and by the vertical bars indicating their deviations).
Table 7 gives the values of the correlation coefficients, the angular coefficients of best-fit lines and the significance coefficients for each graph in Figure 11. These data show that the reasoning ability with the higher correlation with the educational success is related to the hypothetical-deductive reasoning (in particular, aimed to test the existence of not-observable entities). In this case, the correlation is most significant, with a degree of significance greater than 99.9%. Conversely, the reasoning ability with the lower correlation with the educational success is that related to mass and volume conservation: in fact, the correlation coefficient is reduced () with a good significance level ().
4. Conclusions
The experimental research described in this paper was aimed at investigating the validity of the Lawson test for SR as a predictor of university educational success in the technical/scientific area. This represents a crucial aspect for effective guidance actions that are implemented by the universities to optimize the choices of their stakeholders to improve the effectiveness and efficiency of the training activities. To this end, it is necessary to have adequate tools for monitoring the different segments and phases of the educational processes.
Among these tools, particular relevance is given by those who are able to provide stakeholders with useful feedback (a) to guide the choices of students entering the university, and (b) to give information useful to design appropriate training paths that can be able to combine the expectations and needs of the incoming stakeholders (students) and outgoing stakeholders (in particular, companies and the world of work).
In this context, we used a specific diagnostic tool—the Lawson’s test for detecting the aptitude for SR—in a three-year experimental study aimed at verifying its effectiveness as a predictor of academic success.
We administered it at the beginning of the academic year 2016/2017 to a sample of 1015 students who were enrolled in the different degree courses in the scientific area (physics, mathematics, chemistry, biology, earth sciences and ecology) and the engineering area of the University of Calabria. After three years, we acquired and analyzed the career data of the enrolled students.
The statistical analysis of the correlation between the two sets of data made it possible to highlight that the Lawson’s test could be a good predictor of educational success, but limited to the “positive” prediction. In other words, a good performance on the test (score above 65%) can be considered to be predictive of a high level of university educational success, conversely, a test performance that is below this threshold is not significantly correlated to low levels of educational success.
As far as we know, this represents a new and particularly relevant result. In fact, similar surveys have been centered on pre-university educational success [26,27,28,29,44,47,48,49]. Instead, at the university level, some studies concerned partial and very specific aspects of educational success [37,41,42,50,51,52,53]. The correlation discussed in our paper between the positive performance in the Lawson’s test and high values of educational success confirms previous partial results [37,41,51,52,53], which did not analyze the students’ success at the end of a whole course of study. On the other hand, from almost all of the cited studies, a correlation emerges also “in negative” cases, i.e., low levels of performance in the tests correspond to reduced levels of results in the specific formative dimensions investigated in the various works. Our analysis does not confirm this kind of correlation. This diversity of results suggests that there is an opportunity to study in depth the correlation between the low levels of performance achieved in the assessment tests of reasoning aptitudes (different from the Lawson’s test) and reduced academic educational success values.
Another interesting aspect that emerges comparing our results with those of previous studies concerns the role of the individual dimensions in which SR is articulated. We have highlighted that the dimensions more correlated to the formative success are, in decreasing order: the hypothetical-deductive one ( and ) and those related to the proportional reasoning one and to the control of the variables ( and ). The relevance of these three dimensions of reasoning confirms the outcomes of Moore and Rubbo [41]. Conversely, our study showed a reduced relevance of the probabilistic and combinatorial dimensions compared to previous experimental investigations. Finally, the dimension of conservation was less correlated to educational success ( and ), which is in agreement with the other studies that have been mentioned. The relevance of this dimension of reasoning in the well-established models in the international literature [24] is not in contradiction with our results since the age groups under investigation are different, and consequently, are the respective steps of the cognitive development of the students. This consideration suggests the possibility of extending and adapting to the university level some studies carried out in the past involving younger students, in particular, those aimed at the comparative evaluation of the predictive effectiveness of different tests in terms of reasoning skills [27].
Finally, in our opinion, our results are particularly interesting for secondary school teachers. In particular, our results could inspire the design and implementation of educational paths specifically aimed to foster students’ skills related to the reasoning dimensions of the Lawson’s test. Moreover, the validation of the test as a predictive tool of post-secondary educational success provides a useful operational tool for effective outgoing guidance actions in high schools.
Author Contributions
Conceptualization, P.S.; Formal analysis, P.S.; Methodology, P.S. and G.B.; Project administration, P.S.; Resources, P.S. and G.B.; Validation, P.S. and G.B.; Writing—original draft, G.B.; Writing—review and editing, F.N. and G.B. All authors have read and agreed to the published version of the manuscript.
Funding
This research was partially funded by the Italian Ministry of University (MUR), within the “AgoràLAB” project, grant number CUP: H23D21001790001.
Institutional Review Board Statement
This study does not require ethical review and approval, since it involves properly anonymized data (not including sensitive data under the Italian data protection law) and the informed consent was obtained at the time of original data collection.
Informed Consent Statement
Informed consent was obtained from all subjects involved in the study.
Data Availability Statement
The data are kept by the authors in the form of spreadsheet files. Those interested can access data from the authors.
Conflicts of Interest
The authors declare no conflict of interest.
References
- EPC. Educational Policies Commission: The Central Purpose of American Education; National Education Association: Washington, DC, USA, 1961. [Google Scholar]
- Lawson, A.E. The nature and development of scientific reasoning: A synthetic view. Int. J. Sci. Math. Educ. 2004, 2, 307–338. [Google Scholar] [CrossRef]
- EPC. Educational Policies Commission: Education and the Spirit of Science; National Education Association: Washington, DC, USA, 1966. [Google Scholar]
- EURYDICE. Mathematics Education in Europe: Common Challenges and National Policies; Education, Audiovisual and Culture Executive Agency: Brussels, Belgium, 2011. [Google Scholar]
- EURYDICE. Science Education in Europe: National Policies, Practices and Research; Education, Audiovisual and Culture Executive Agency: Brussels, Belgium, 2011. [Google Scholar]
- Laugksch, R.C. Scientific Literacy: A Conceptual Overview. Sci. Educ. 2000, 84, 71–94. [Google Scholar] [CrossRef]
- Durant, J. What is scientific literacy? Eur. Rev. 1994, 2, 83–89. [Google Scholar] [CrossRef]
- Roth, W.M.; Désautels, J. Educatingfor citizenship: Reappraising the role of science education. Can. J. Sci. Math. Technol. Educ. 2004, 4, 149–168. [Google Scholar] [CrossRef]
- Pinch, T. The sociology of the scientific community. In Companion to the History of Modern Science; Olby, R.C., Cantor, G.N., Christie, J.R.R., Hodge, M.J.S., Eds.; Routledge: London, UK, 1990; pp. 87–99. [Google Scholar] [CrossRef]
- Lenoir, T. The discipline of nature and the nature of disciplines. In Knowledges: Historical and Critical Studies in Disciplinarity; Messer-Davidov, E., Shumway, D.R., Sylvan, D.J., Eds.; University Press of Virginia: Charlottesville, VA, USA, 1993; pp. 70–102. [Google Scholar]
- Turrini, T.; Dörler, D.; Richter, A.; Heigl, F.; Bonn, A. The threefold potential of environmental citizen science—Generating knowledge, creating learning opportunities and enabling civic participation. Biol. Conserv. 2018, 225, 176–186. [Google Scholar] [CrossRef]
- Forrester, T.D.; Baker, M.; Costello, R.; Kays, R.; Parsons, A.W.; McShea, W.J. Creating advocates for mammal conservation through citizen science. Biol. Conserv. 2017, 208, 98–105. [Google Scholar] [CrossRef] [Green Version]
- Sapia, P. Educazione civica e alfabetizzazione scientifica. L’Eco della Scuola Nuova 2019, LXXIV, 12–14. [Google Scholar]
- Kolstø, S.D. Consensus projects: Teaching science for citizenship. Int. J. Sci. Educ. 2000, 22, 645–664. [Google Scholar] [CrossRef]
- Harlen, W. ASE Guide to Primary Science Education; Association for Science Education: Hatfield, UK, 2006. [Google Scholar]
- Lin, S.S. Science and non-science undergraduate students’ critical thinking and argumentation performance in reading a science news report. Int. J. Sci. Math. Educ. 2014, 12, 1023–1046. [Google Scholar] [CrossRef]
- Yacoubian, H.A. Scientific literacy for democratic decision-making. Int. J. Sci. Educ. 2018, 40, 308–327. [Google Scholar] [CrossRef]
- Hofstein, A.; Eilks, I.; Bybee, R. Societal issues and their importance for contemporary science education—A pedagogical justification and the state-of-the-art in Israel, Germany, and the USA. Int. J. Sci. Math. Educ. 2011, 9, 1459–1483. [Google Scholar] [CrossRef]
- Ministerial Conference of Bologna. 1999. Available online: http://www.ehea.info/page-ministerial-conference-bologna-1999 (accessed on 1 October 2022).
- Lawson, A.E. The development and validation of a classroom test of formal reasoning. J. Res. Sci. Teach. 1978, 15, 11–24. [Google Scholar] [CrossRef]
- Popper, K.R. Conjectures and refutations. The Growth of Scientific Knowledge; Routledge: London, UK, 1962. [Google Scholar]
- Kuhn, T.S. The Structure of Scientific Revolutions, 2nd ed.; The University of Chicago Press: Chicago, IL, USA, 1970. [Google Scholar]
- Reckase, M.D.; Ackerman, T.A.; Carlson, J.E. Building a Unidimensional Test Using Multidimensional Items. J. Educ. Meas. 1998, 25, 193–203. [Google Scholar] [CrossRef]
- Inhelder, B.; Piaget, J. The Growth of Logical Thinking: From Childhood to Adolescence; Routledge: London, UK, 1958. [Google Scholar] [CrossRef]
- Tidman, P.; Kahane, H. Logic and Philosophy: A Modern Introduction; Thomson/Wadsworth: Belmont, CA, USA, 2003. [Google Scholar]
- Krumm, S.; Ziegler, M.; Buehner, M. Reasoning and working memory as predictors of school grades. Learn. Individ. Differ. 2008, 18, 248–257. [Google Scholar] [CrossRef]
- Strand, S. Comparing the predictive validity of reasoning tests and national end of Key Stage 2 tests: Which tests are the ‘best’? Br. Educ. Res. J. 2006, 32, 209–225. [Google Scholar] [CrossRef]
- Titcombe, R. Cognitive ability and school improvement. Pract. Res. Educ. 2006, 36, 27–34. [Google Scholar] [CrossRef]
- Schagen, I. Comments on “Cognitive ability and school improvement”. Pract. Res. Educ. 2007, 35, 83–92. Available online: https://eraexperts.wordpress.com/2013/10/29/ian-schagen-cv/ (accessed on 1 October 2022).
- Oberauer, K.; Süß, H.-M.; Wilhelm, O.; Wittman, W.W. The multiple faces of working memory: Storage, processing, supervision, and coordination. Intelligence 2003, 31, 167–193. [Google Scholar] [CrossRef] [Green Version]
- Kosslyn, S.M.; Koenig, O. Wet Mind. The New Cognitive Neuroscience; The Free Press: New York, NY, USA, 1995. [Google Scholar]
- St Clair-Thompson, H.L.; Gathercole, S.E. Executive functions and achievements in school: Shifting, updating, inhibition, and working memory. Q. J. Exp. Psychol. 2006, 59, 745–759. [Google Scholar] [CrossRef]
- Luo, D.; Thompson, L.A.; Detterman, D.K. The criterion validity of tasks of basic cognitive processes. Intelligence 2006, 34, 79–120. [Google Scholar] [CrossRef]
- Kuhn, D.; Franklin, S. The Second Decade: What Develops (and How). In Handbook of Child Psychology, Volume 2: Cognition, Perception and Language, 6th ed.; Kuhn, D., Siegler, R.S., Eds.; John Wiley & Sons: Hoboken, NJ, USA, 2006. [Google Scholar]
- Zimmerman, C. The development of scientific thinking skills in elementary and middle school. Dev. Rev. 2007, 27, 172–223. [Google Scholar] [CrossRef]
- Wilkening, F.; Sodian, B. Scientific, reasoning in young children: Introduction. Swiss J. Psychol. 2005, 64, 137–139. [Google Scholar] [CrossRef]
- Rohde, T.E.; Thompson, L.A. Predicting academic achievement with cognitive ability. Intelligence 2007, 35, 83–92. [Google Scholar] [CrossRef]
- Lawson, A.E.; Clark, B.; Cramer-Meldrum, E.; Falconer, K.A.; Sequist, J.M.; Kwon, Y.-J. Development of Scientific Reasoning in College Biology: Do Two Levels of General Hypothesis-Testing Skills Exist? J. Res. Sci. Teach. 2000, 37, 81–101. [Google Scholar] [CrossRef]
- Lawson, A.E. What do tests of ‘formal’ reasoning actually measure? J. Res. Sci. Teach. 1992, 29, 965–983. [Google Scholar] [CrossRef]
- Lawson, A.E.; Oehrtman, M.; Jensen, J. Connecting science and mathematics: The nature of scientific and statistical hypotheses testing. Int. J. Sci. Math. Educ. 2008, 6, 405–416. [Google Scholar] [CrossRef]
- Moore, J.C.; Rubbo, L.J. Scientific reasoning abilities of nonscience majors in physics-based courses. Phys. Rev. ST Phys. Educ Res. 2012, 8, 010106. [Google Scholar] [CrossRef] [Green Version]
- Lawson, A.E.; Banks, D.L.; Logvin, M. Self-efficacy, reasoning ability, and achievement in college biology. J. Res. Sci. Teach. 2007, 44, 706–724. [Google Scholar] [CrossRef]
- Horst, S.J.; Finney, S.J.; Barron, K.E. Moving beyond academic achievement goal measures: A study of social achievement goals. Contemp. Educ. Psychol. 2007, 32, 667–698. [Google Scholar] [CrossRef]
- Deary, I.J.; Strand, S.; Smith, P.; Fernandes, C. Intelligence and educational achievement. Intelligence 2007, 35, 13–21. [Google Scholar] [CrossRef]
- Hong, E. Homework style, homework environment and academic achievement. Learn. Environ. Res. 2001, 4, 7–23. [Google Scholar] [CrossRef]
- McKillup, S. Statistics Explained: An Introductory Guide for Life Sciences; Cambridge University Press: Cambridge, UK, 2012. [Google Scholar]
- Stephens, A.L.; Clement, J.J. Documenting the use of expert scientific reasoning processes by high school physics students. Phys. Rev. ST Phys. Educ Res. 2010, 6, 020122. [Google Scholar] [CrossRef]
- Spinath, B.; Spinath, F.M.; Harlaar, N.; Plomin, R. Predicting school achievement from general cognitive ability, self-perceived ability, and intrinsic value. Intelligence 2006, 34, 363–374. [Google Scholar] [CrossRef]
- Valanides, N. Formal reasoning abilities and school achievement. Stud. Educ. Eval. 1997, 23, 169–185. [Google Scholar] [CrossRef]
- Steinberg, R.; Cormier, S. Understanding and affecting science teacher candidates’ scientific reasoning in introductory astrophysics. Phys. Rev. ST Phys. Educ Res. 2013, 9, 020111. [Google Scholar] [CrossRef] [Green Version]
- Ates, S.; Cataloglu, E. The effects of students’ reasoning abilities on conceptual understandings and problem-solving skills in introductory mechanics. Eur. J. Phys. 2007, 28, 1161–1171. [Google Scholar] [CrossRef]
- Coletta, V.P.; Phillips, J.A. Interpreting FCI scores: Normalized gain, preinstruction scores, and scientific reasoning ability. Am. J. Phys. 2005, 73, 1172–1182. [Google Scholar] [CrossRef] [Green Version]
- Furnham, A.; Chamorro-Premuzic, T. Personality and intelligence as predictors of statistics examination grades. Pers. Individ. Dif. 2004, 37, 943–955. [Google Scholar] [CrossRef]
Figure 1.
Classification of the enrolled students on the basis of the provenance school kind.

Figure 2.
Classification of the enrolled students which were obtained with the Lawson’s test.
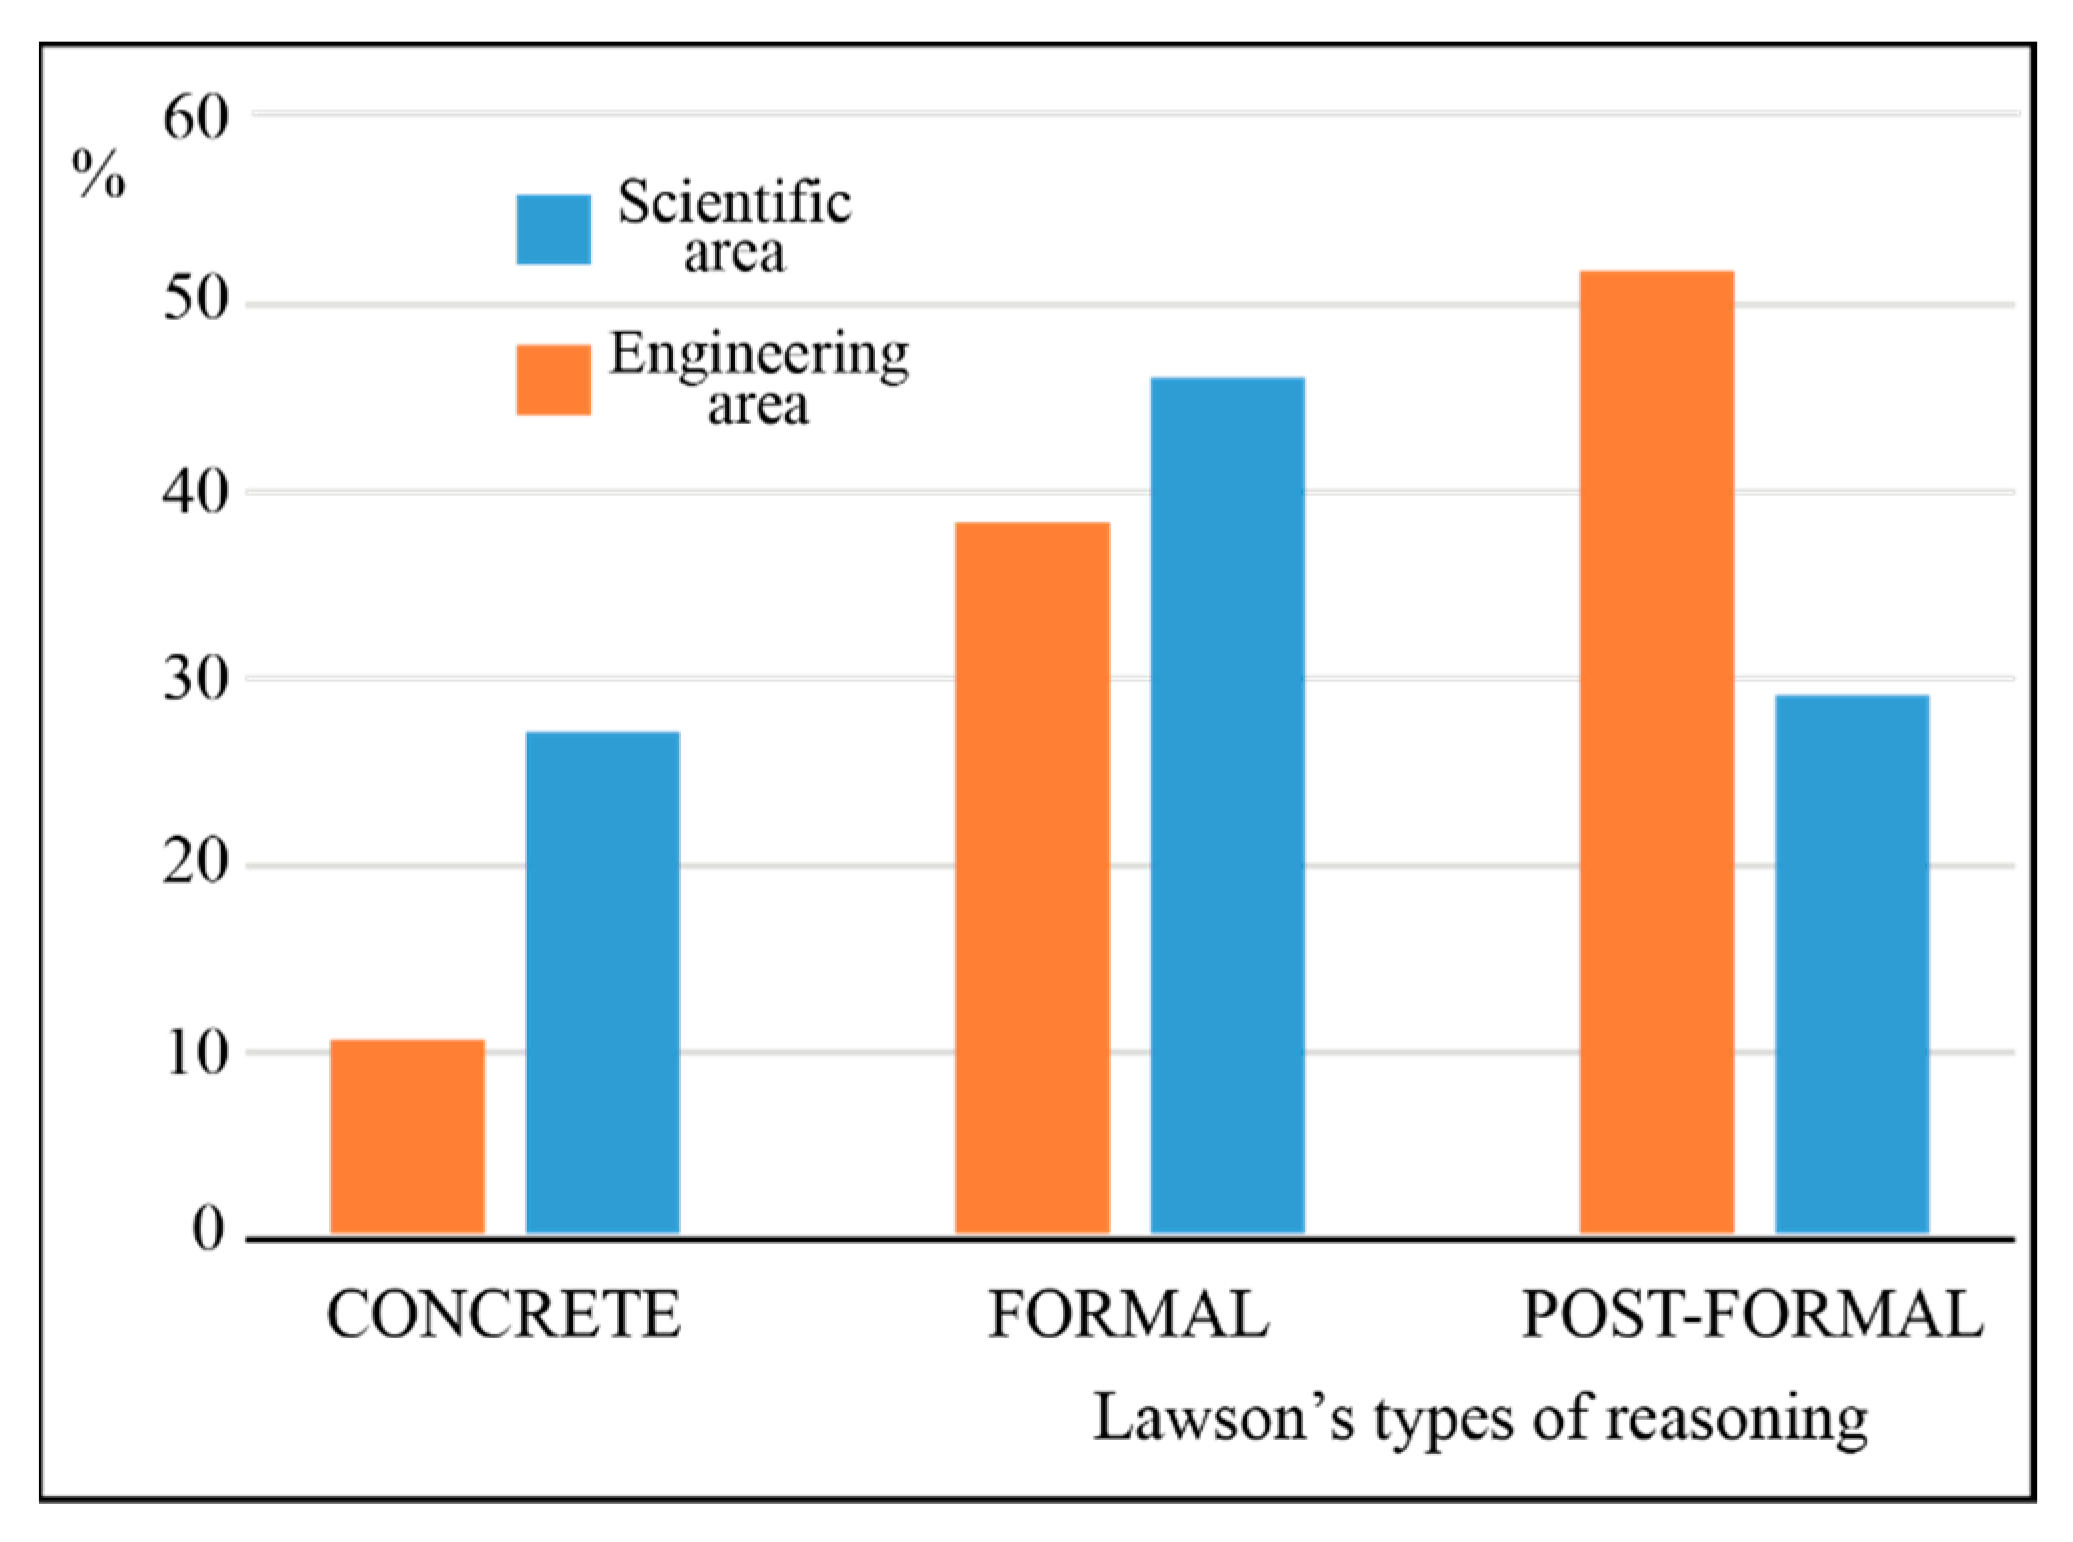
Figure 3.
Distributions of the global performance in the Lawson’s test for the students in the scientific and engineering areas. The height of the bars indicates the percentage of students for the two areas in the corresponding score class.
Figure 3.
Distributions of the global performance in the Lawson’s test for the students in the scientific and engineering areas. The height of the bars indicates the percentage of students for the two areas in the corresponding score class.

Figure 4.
Distributions of educational success for the students of scientific and engineering areas. The height of the bars indicates the percentage of students in the two areas in the corresponding score class.
Figure 4.
Distributions of educational success for the students of scientific and engineering areas. The height of the bars indicates the percentage of students in the two areas in the corresponding score class.
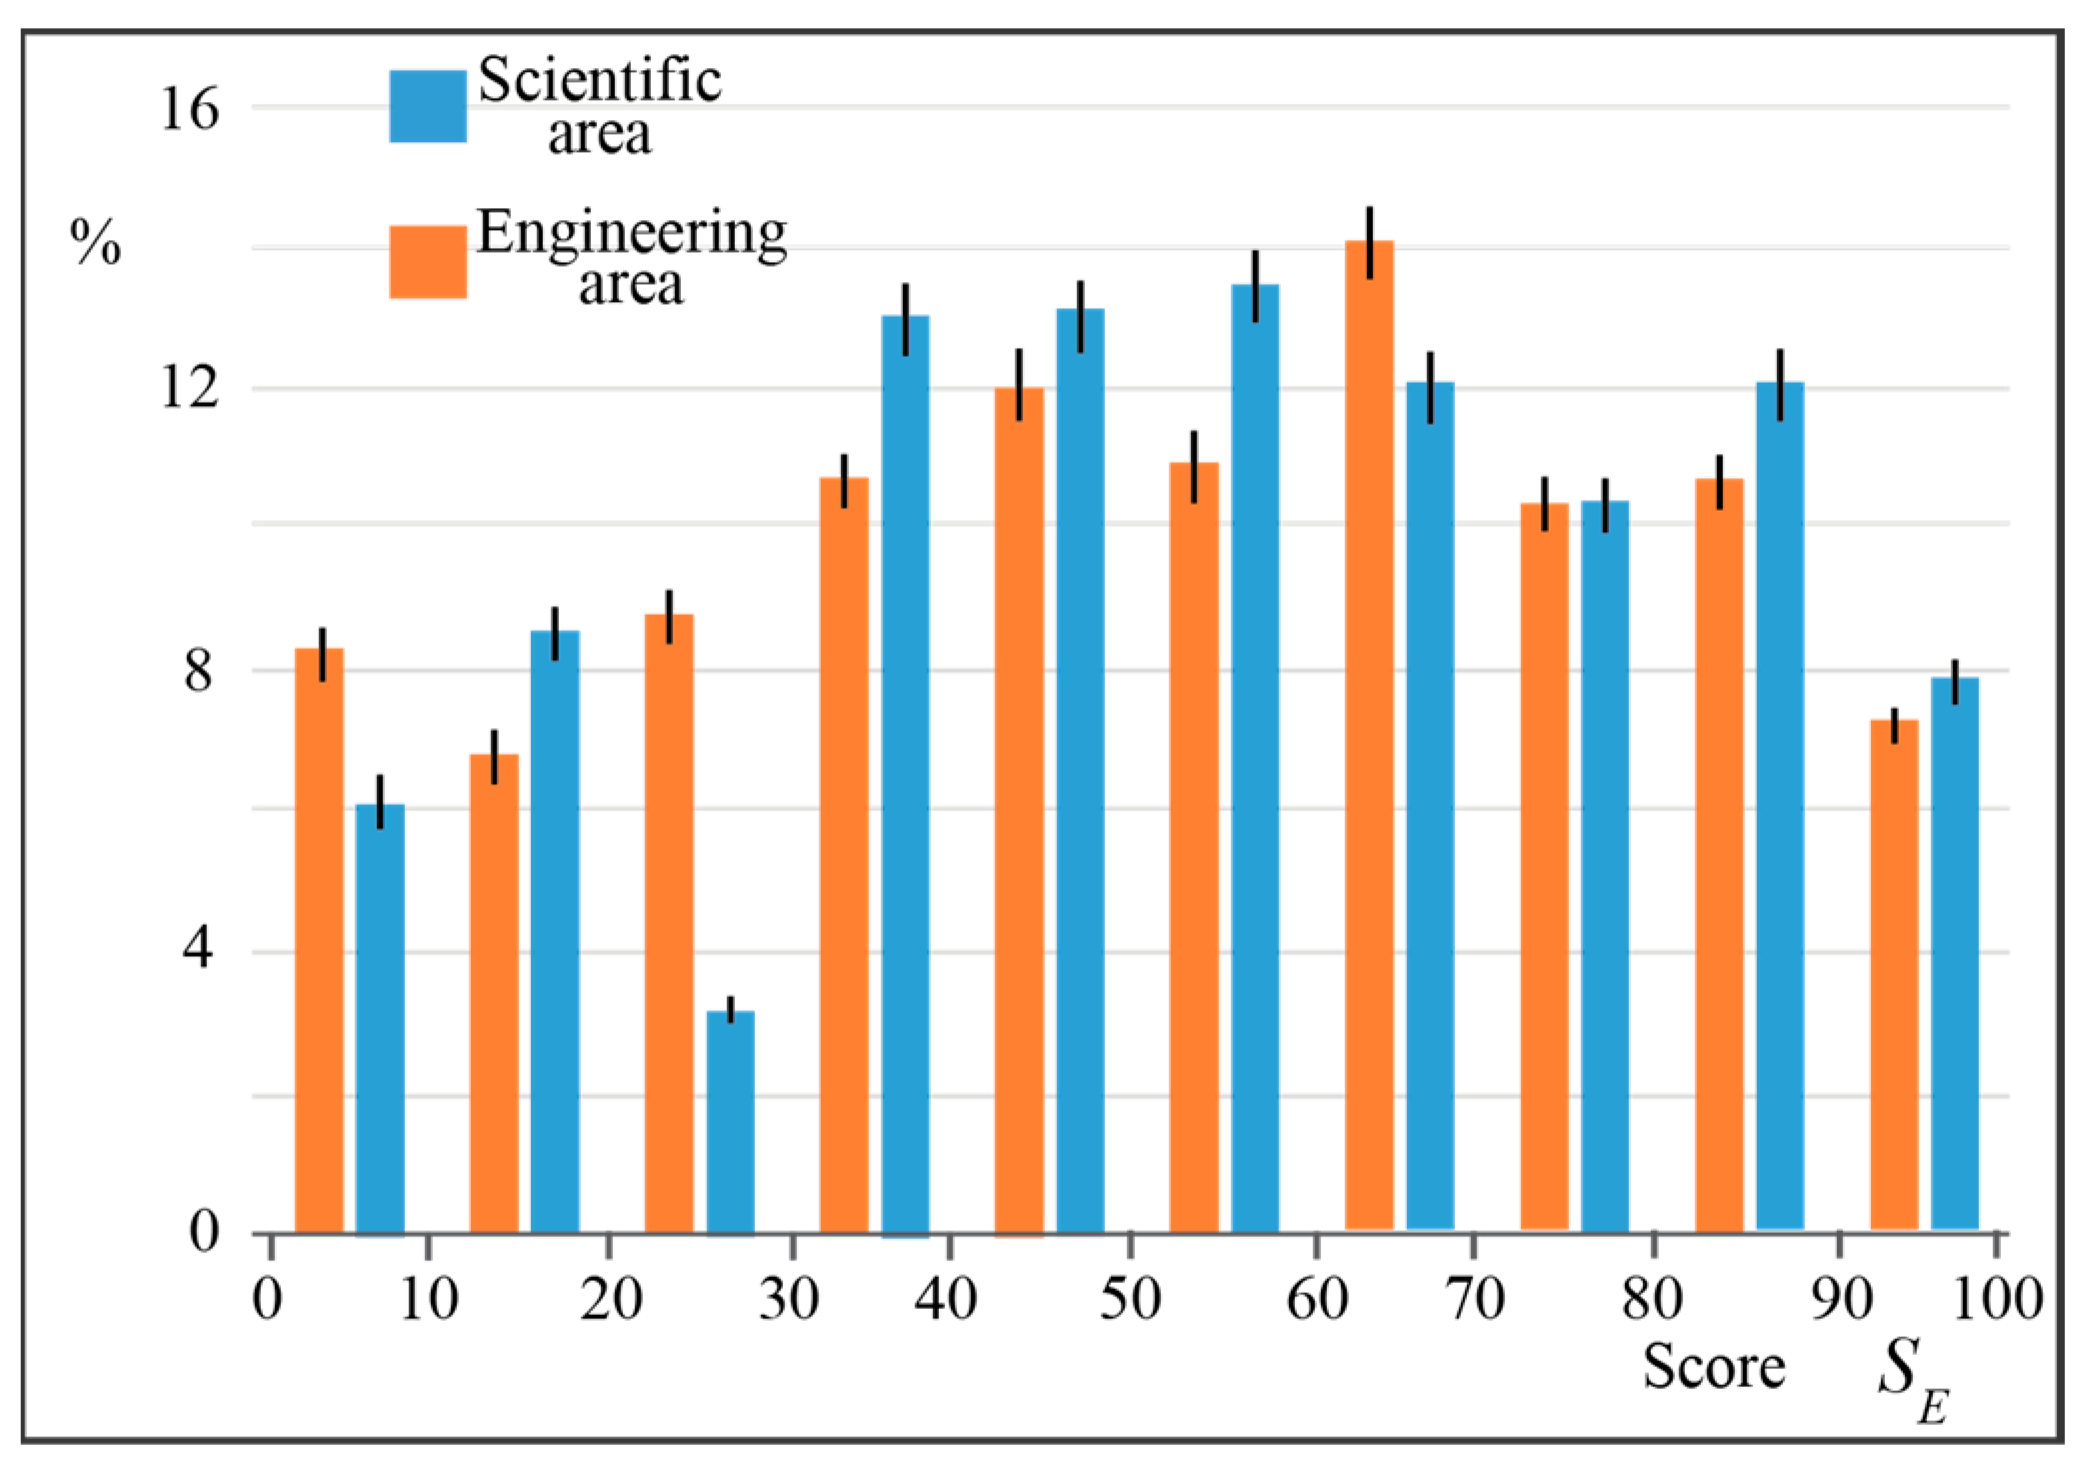
Figure 5.
The population of score classes for global performance in the Lawson’s test and educational success for the students of the (a) engineering subset and (b) science subset, respectively.
Figure 5.
The population of score classes for global performance in the Lawson’s test and educational success for the students of the (a) engineering subset and (b) science subset, respectively.

Figure 6.
(a) Dispersion of students of engineering subset in the plane . The color intensity of a given region of the plane is proportional to the density of students that obtained the corresponding scores. The red and green bars (below the horizontal axis and on the left of the vertical axis, respectively) represent the population projections on the two parameters. In other words, they are the two components of the histograms of Figure 5a; (b) three-dimensional representation of the data represented in Figure 6a: the height of the surface in correspondence of a given point in the plane indicates the density of students population around the same point.
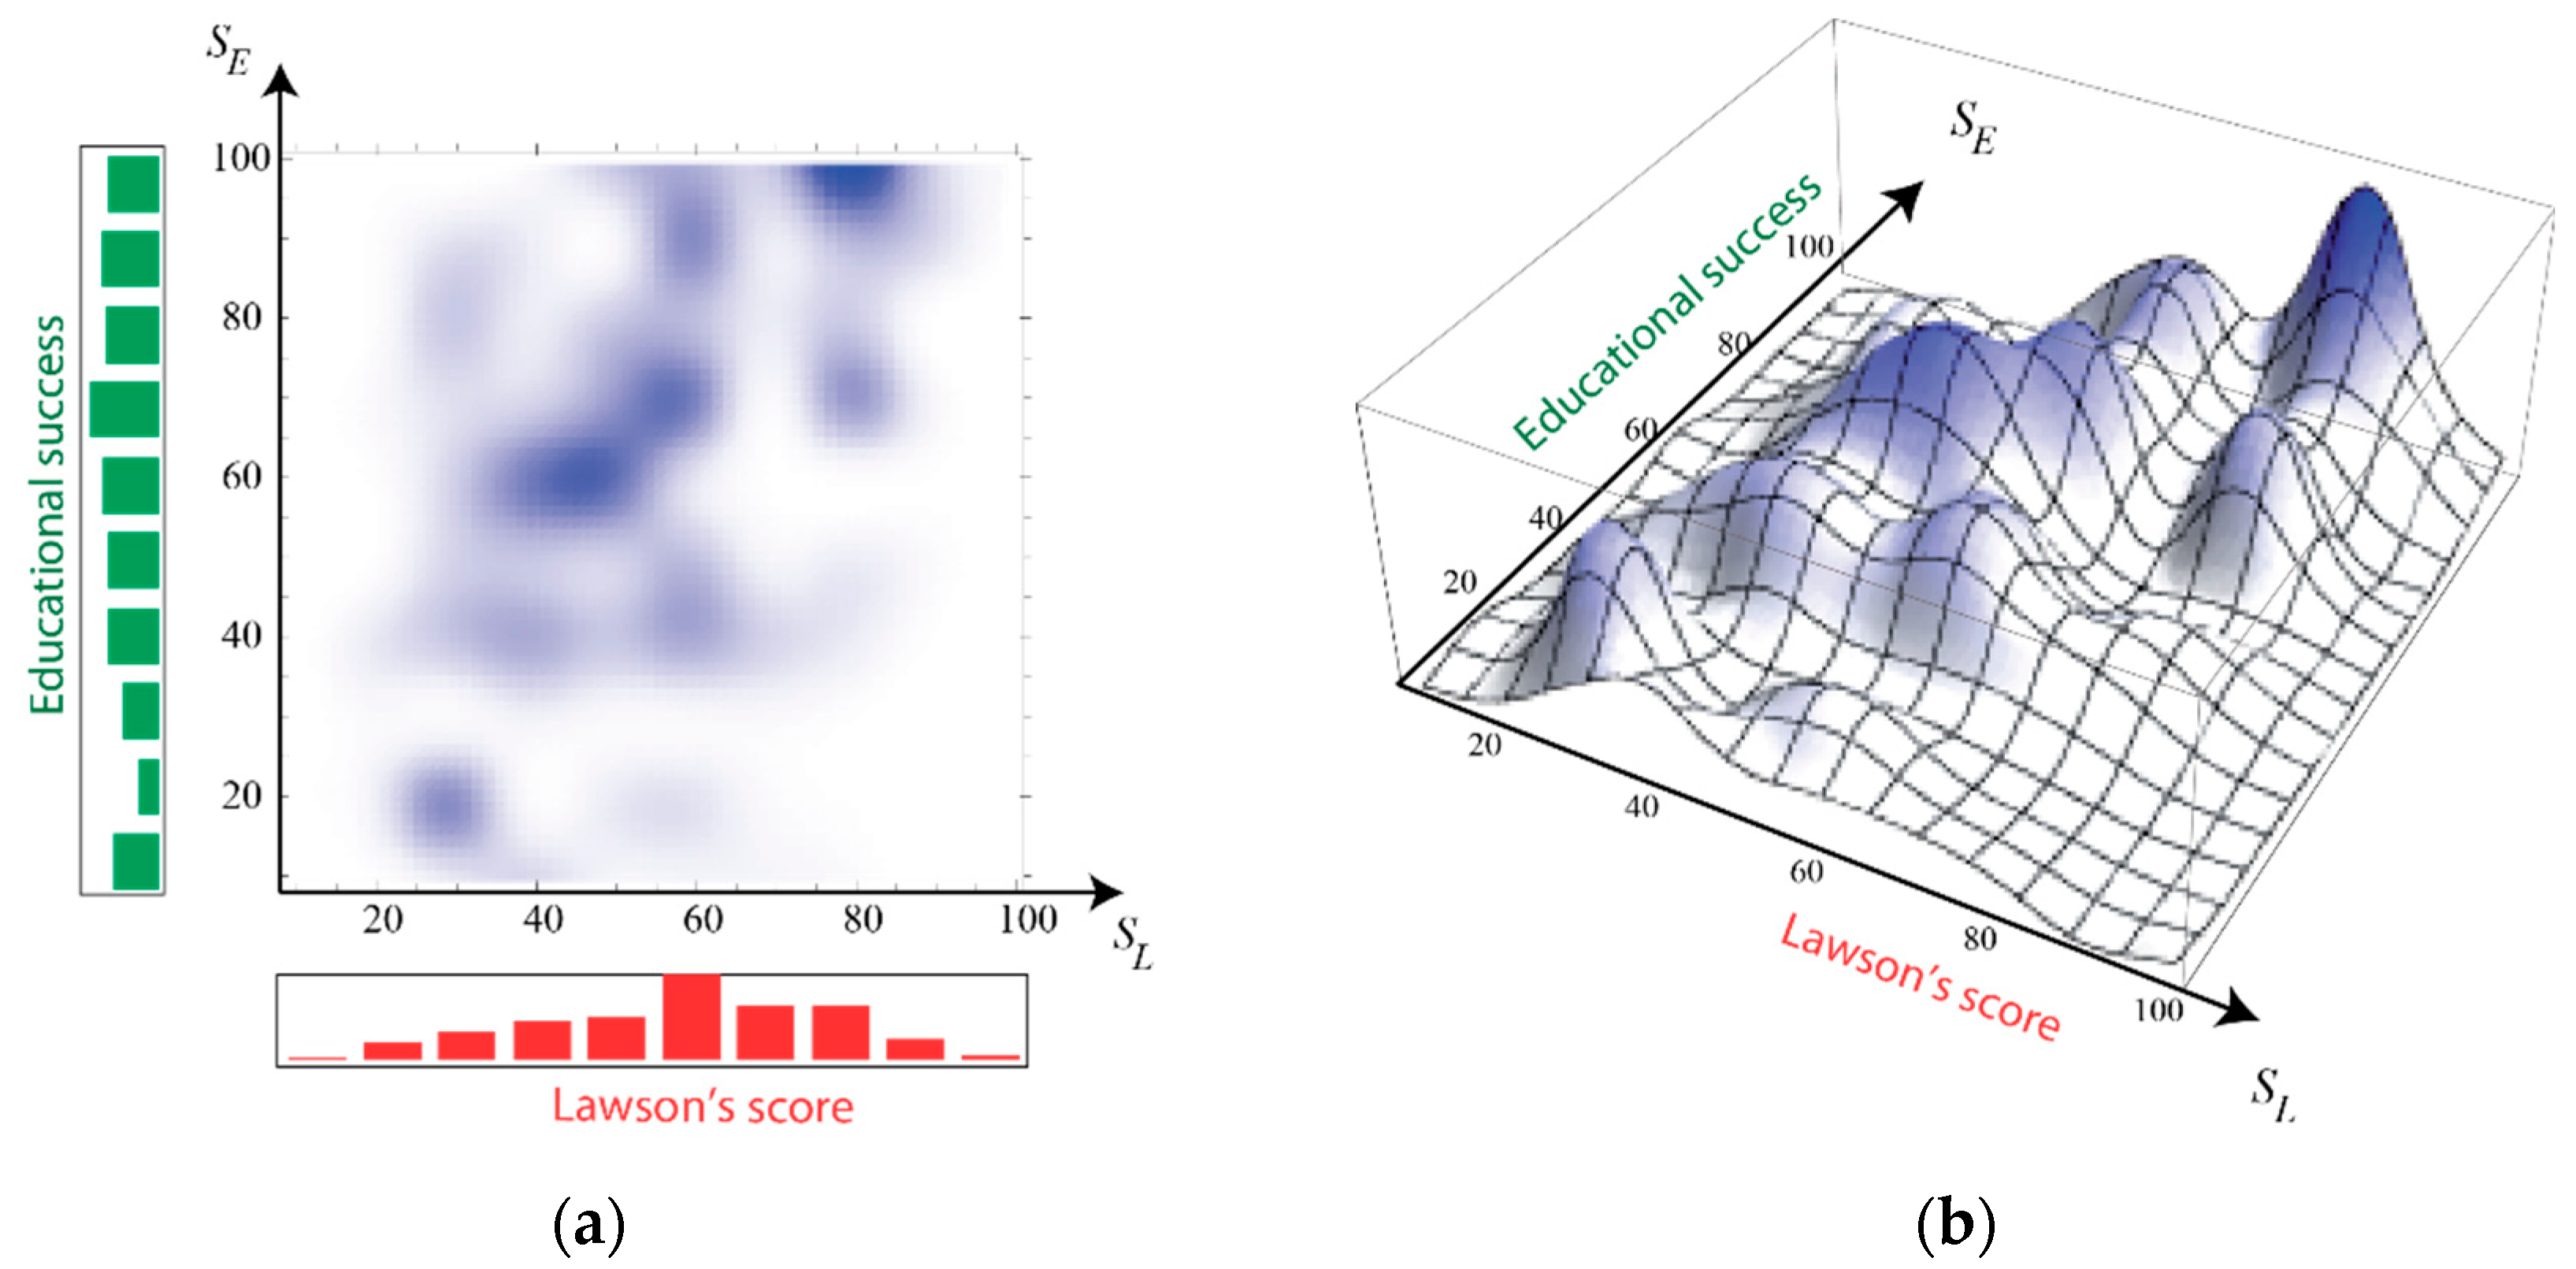
Figure 7.
(a) Dispersion of students of the science subset in the plane . The color intensity of a given region of the plane is proportional to the density of students that obtained the corresponding scores. The red and green bars (below the horizontal axis and on the left of the vertical axis, respectively) represent the population projections on the two parameters. In other words, they are the two components of the histograms of Figure 5b; (b) three-dimensional representation of the data represented in Figure 7a: the height of the surface in correspondence of a given point in the plane indicates the density of students population around the same point.
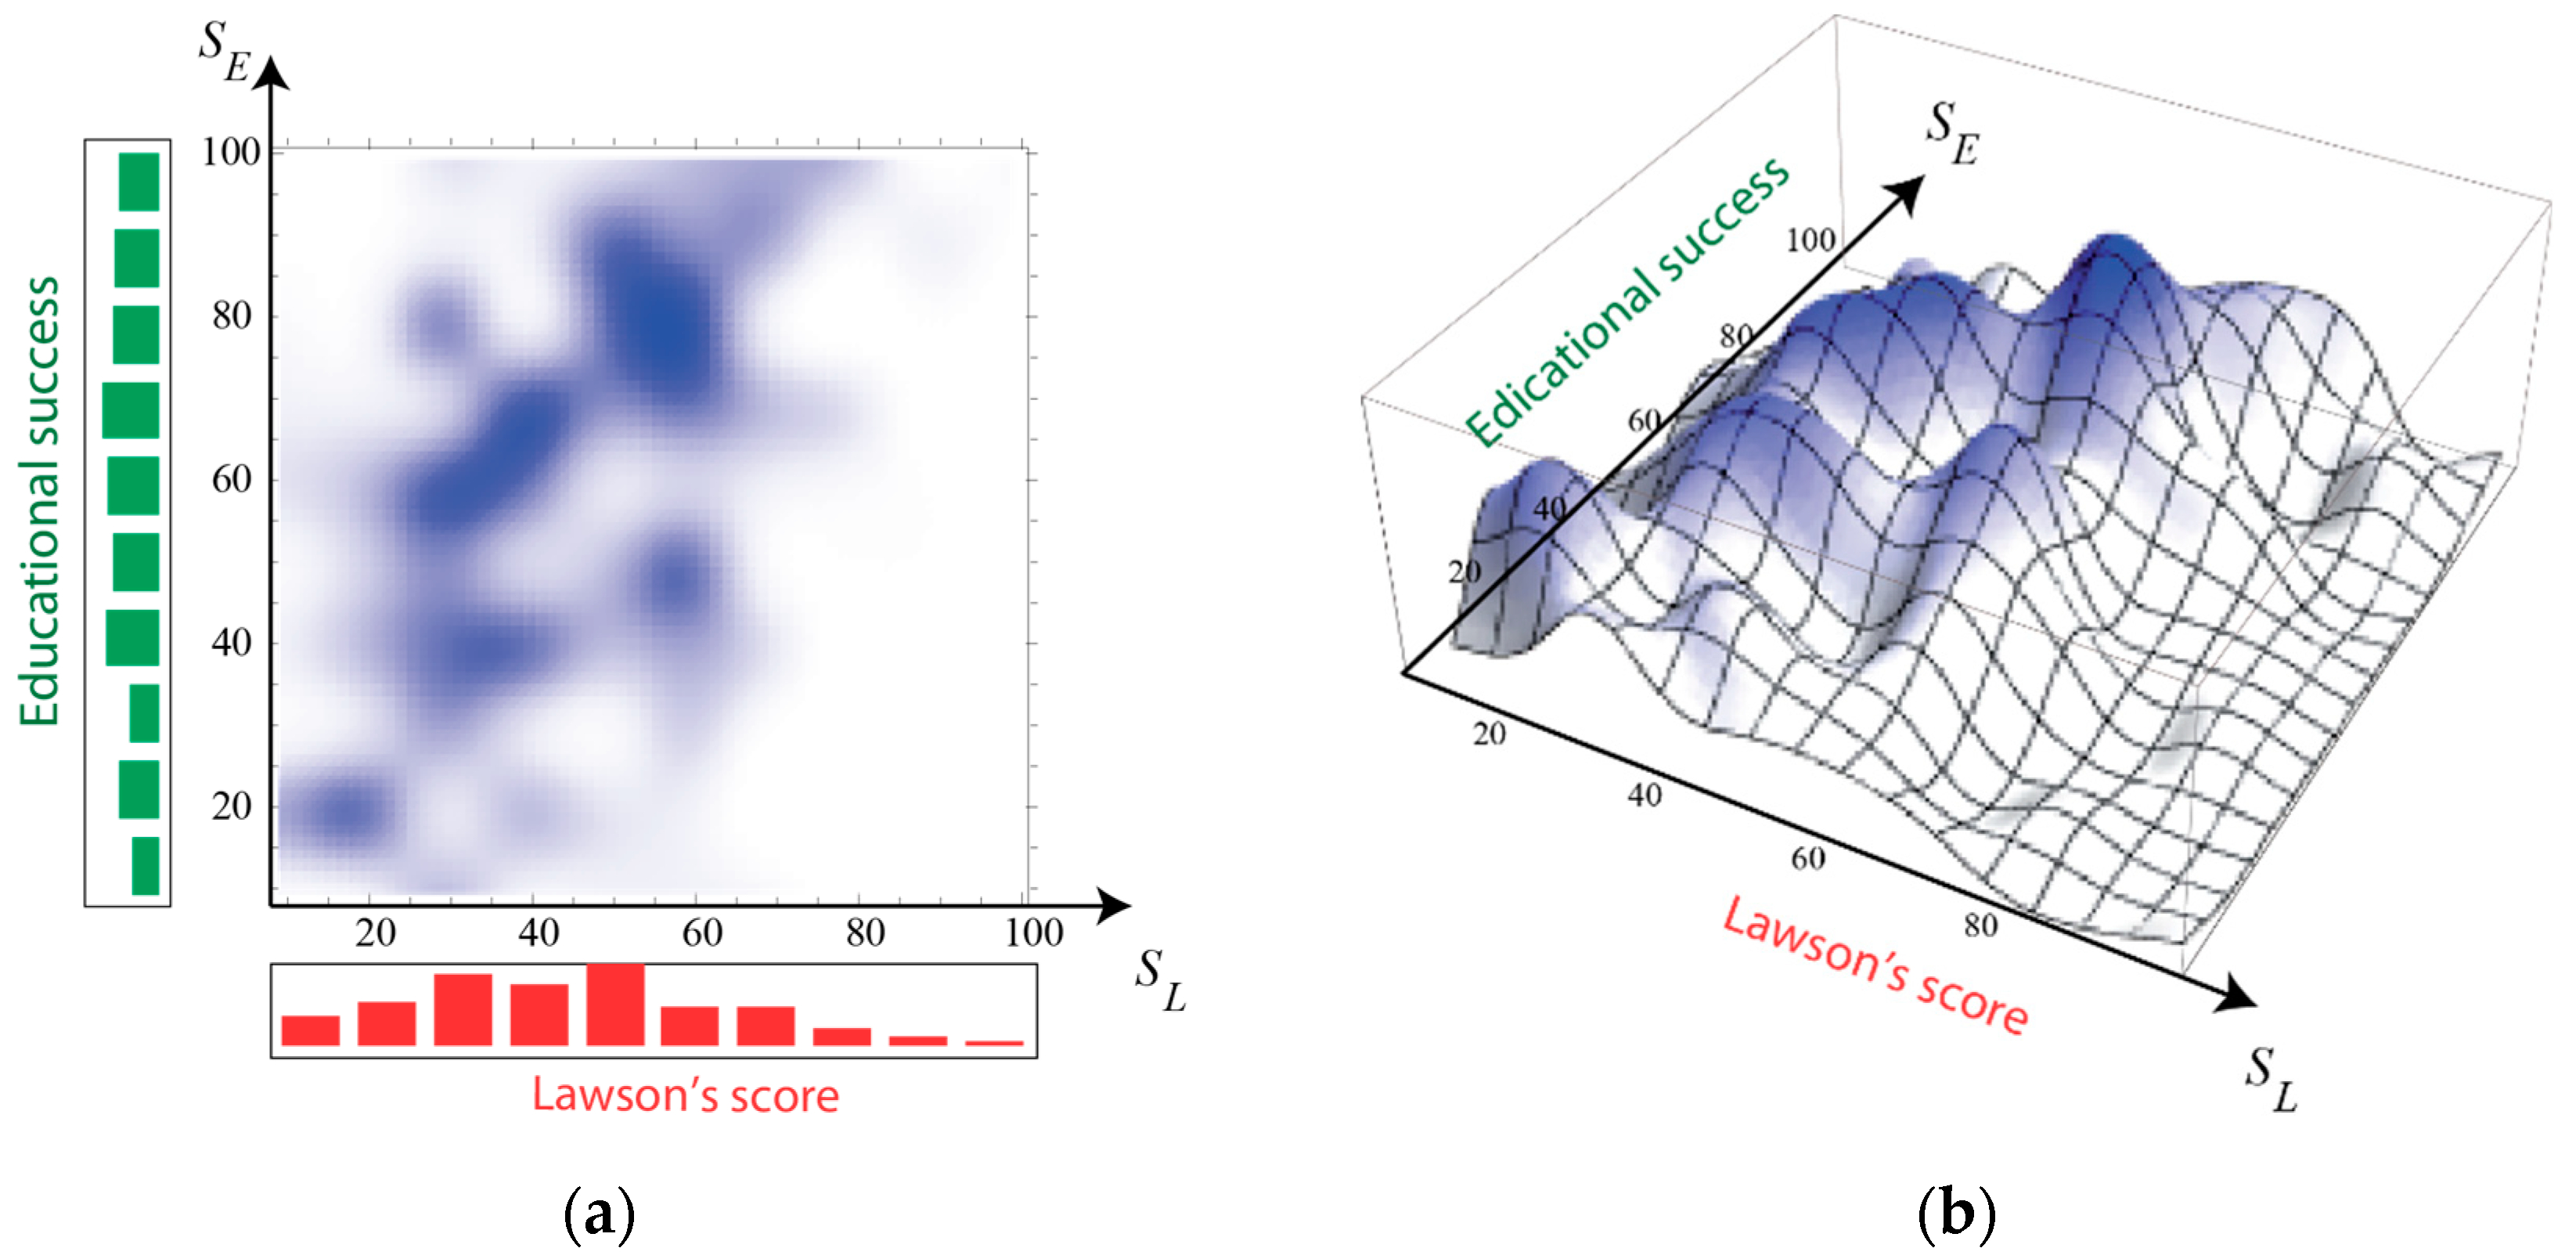
Figure 8.
A different representation of the score for the Lawson’s test classified into 13 classes (12 pairs of items + 1 class corresponding to the score equal to zero). It is represented again from 1 to 100 to facilitate the comparison with the other representations. For each score class, the vertical aligned dots represent the students that achieved such an score, which are distributed (vertically) according to the educational success scores achieved by each student. The black rectangles, instead, indicate the mean value (over the scores) of the fixed score class , while the corresponding black vertical bars indicate the respective deviations from the average.

Figure 9.
Correlation analysis performed separately for the different quartiles of the Lawson’s score (obtained by the total number of students). The numerical values given at each pair of columns indicate the average value of the Lawson’s score and the correlation coefficient calculated within the single quartile.
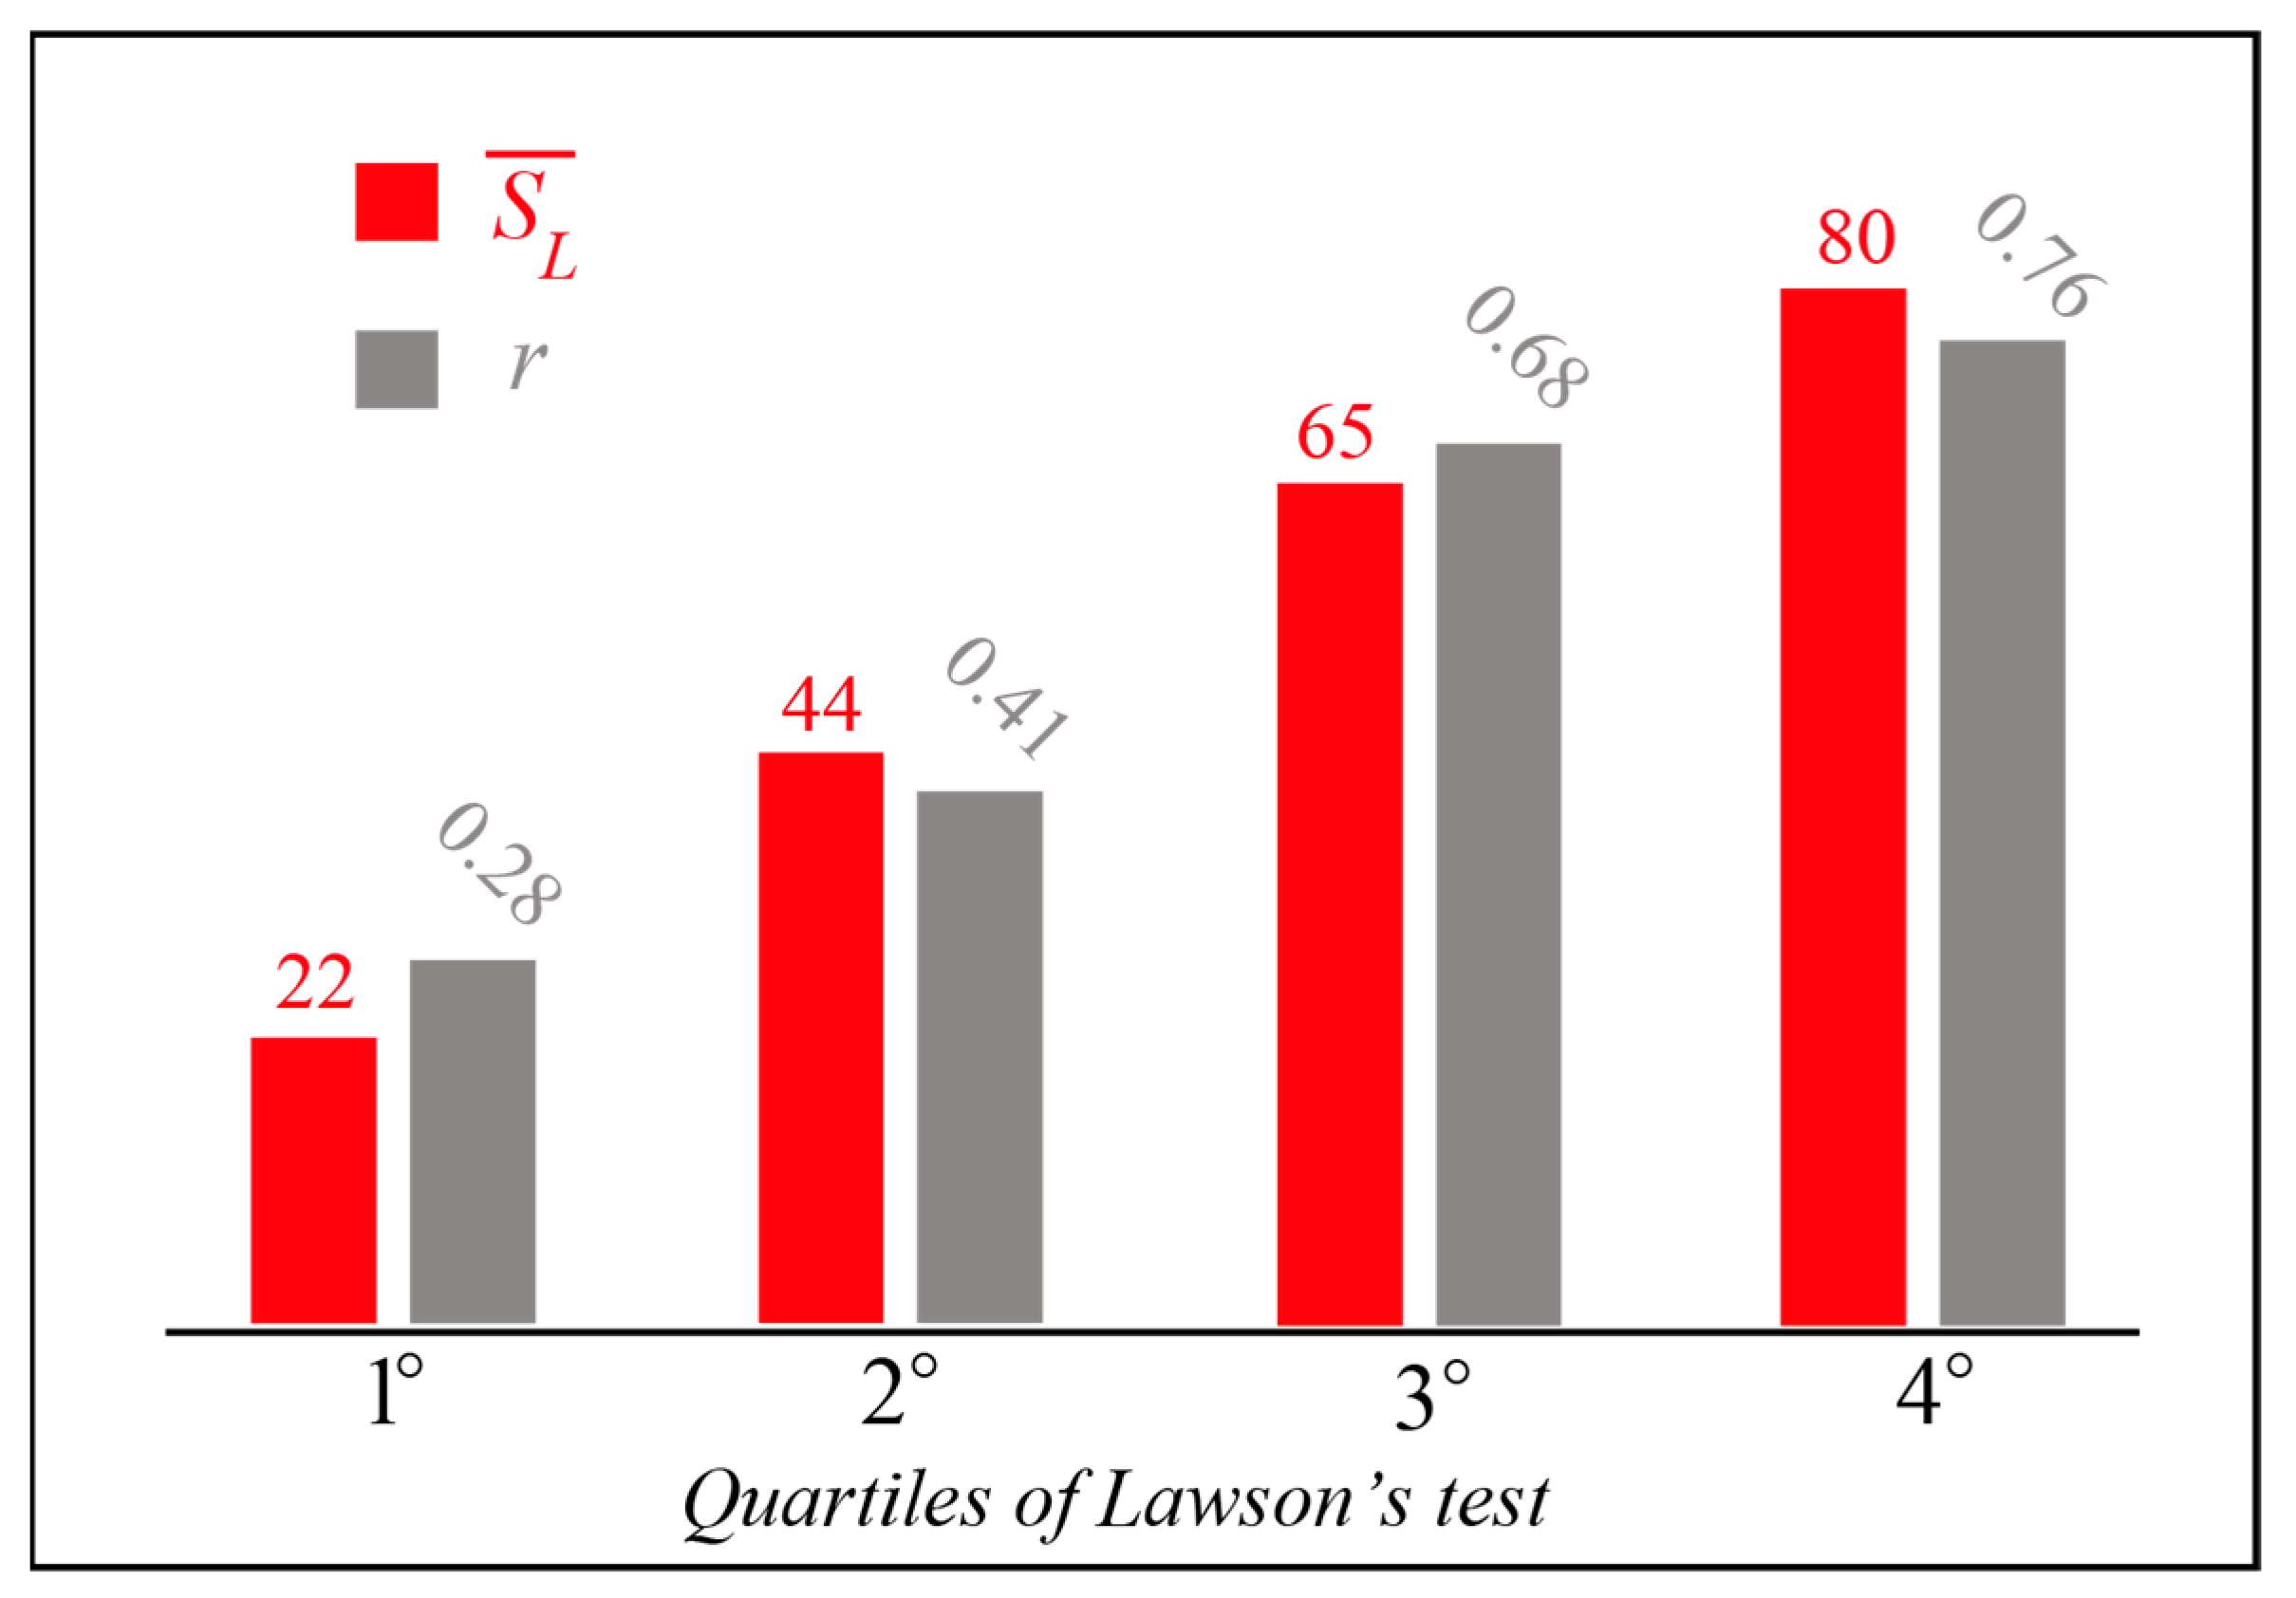
Figure 10.
Mean values of Lawson’s test score achieved by the whole group students, divided for the 5 dimensions of analysis.
Figure 10.
Mean values of Lawson’s test score achieved by the whole group students, divided for the 5 dimensions of analysis.
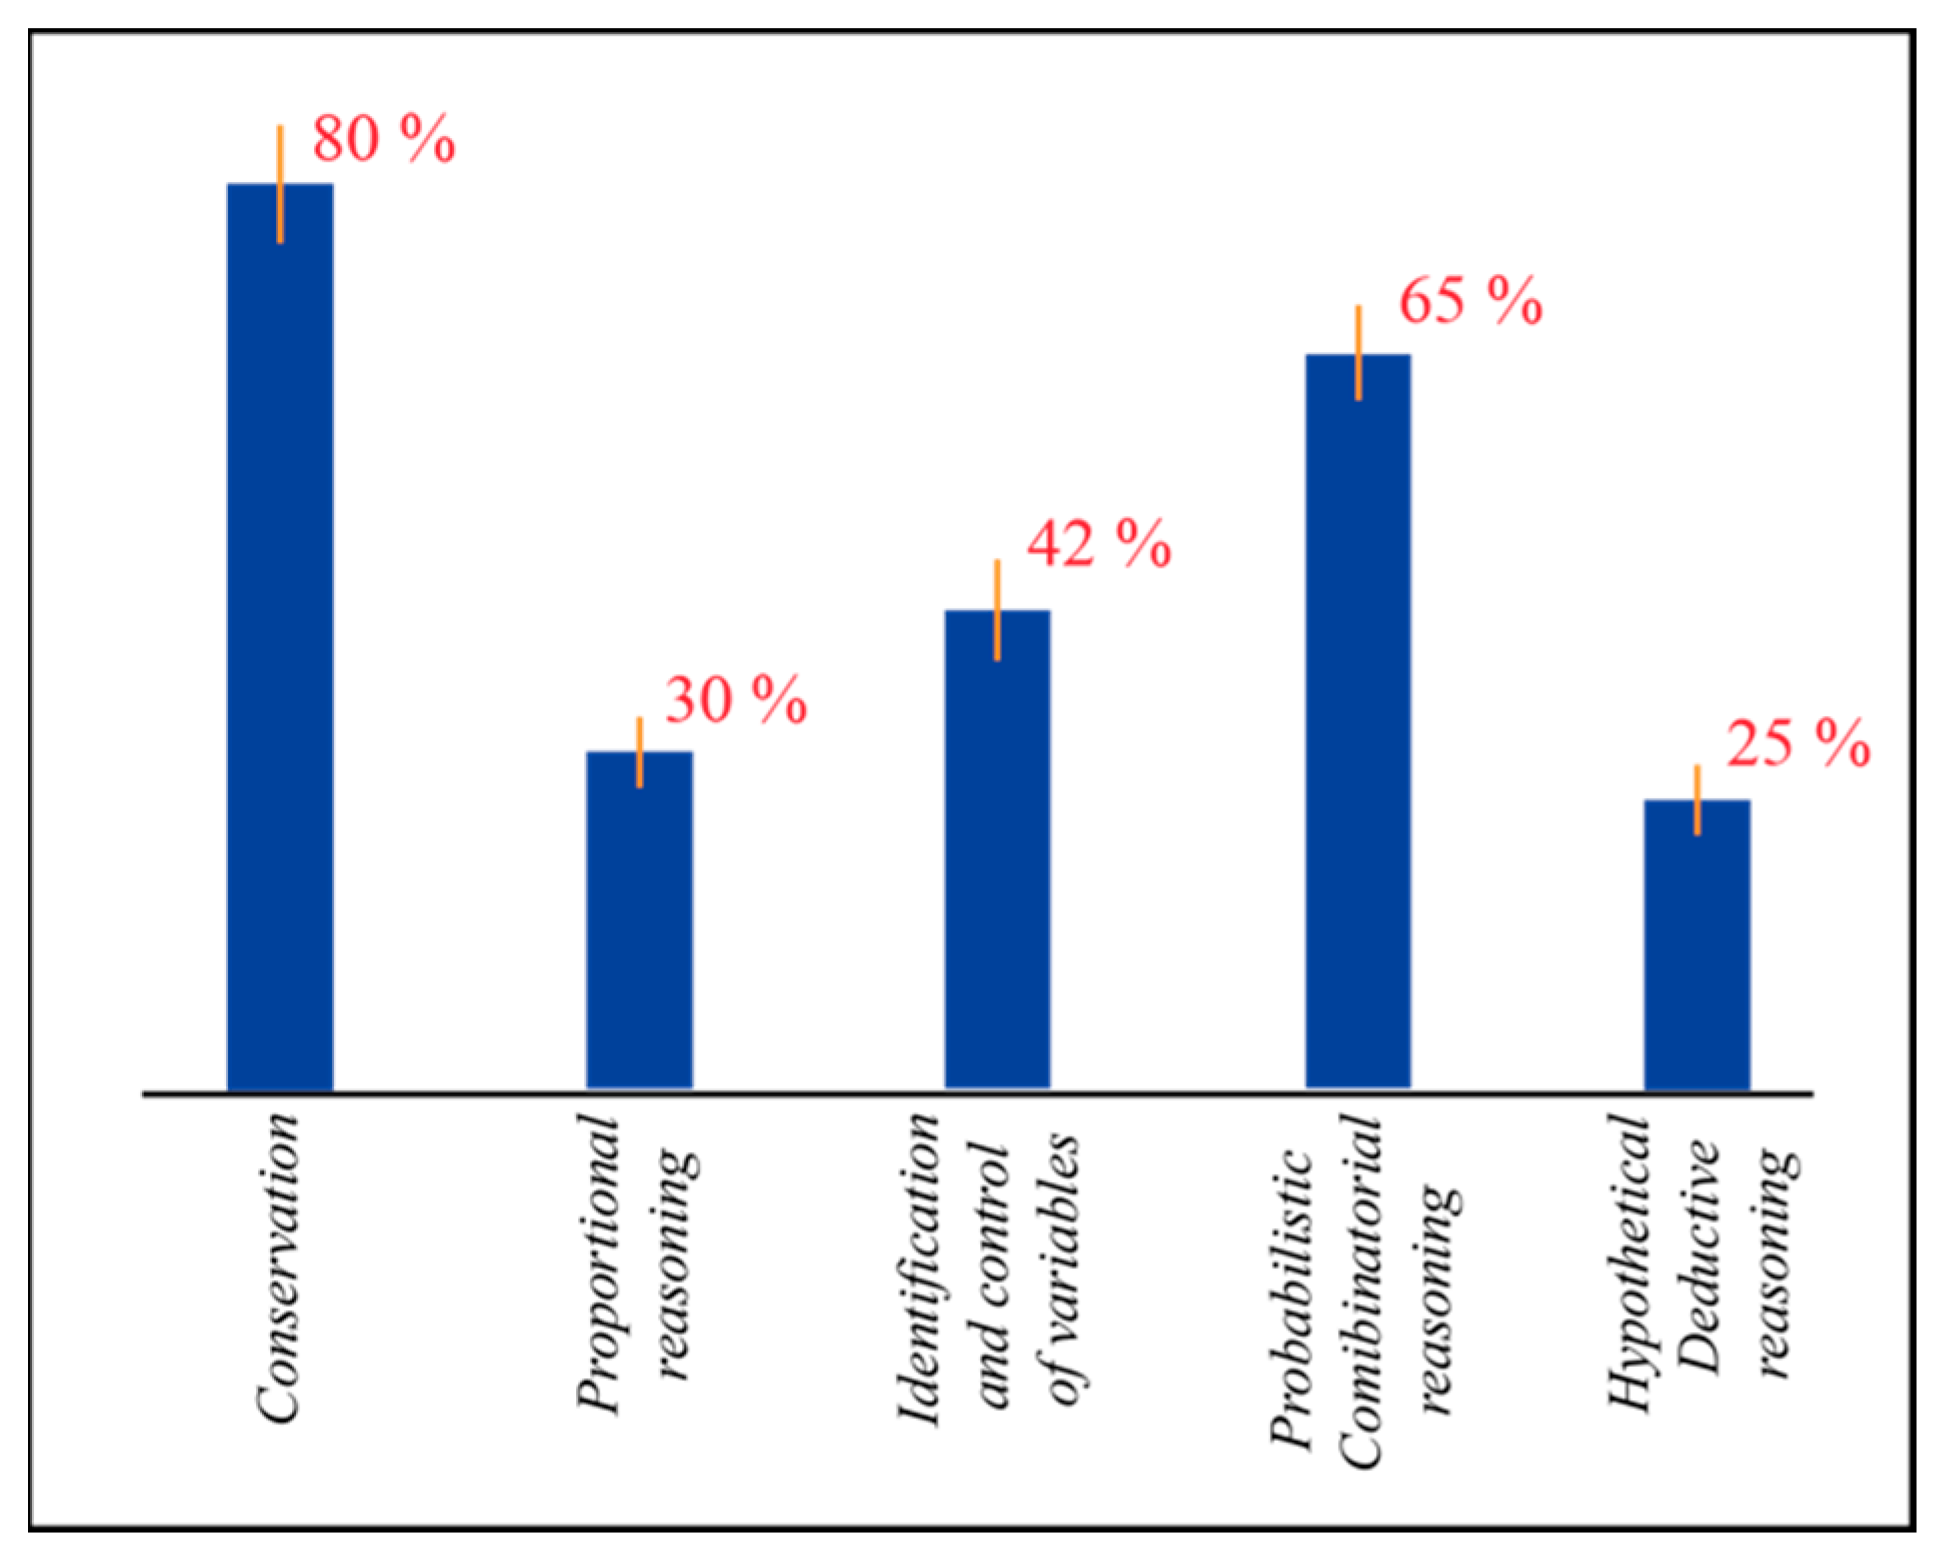
Figure 11.
Scatter diagrams of the educational success versus partial scores for each of the five dimensions of the Lawson’s test. Only the upper two quartiles (of total Lawson’s score) reached by the total sample (the students of the engineering and science subsets) were considered for the five dimensions: (a) conservation (mass and volume); (b) hypothetical-deductive reasoning; (c) probabilistic and combinatorial reasoning; (d) identification and control of variables; (e) proportional reasoning.


Table 1.
The reasoning skills investigated by the test and the corresponding pairs of items.
| Investigated Dimension | Pairs of Items |
|---|---|
| Conservation (mass and volume) | (1,2)–(3,4) |
| Proportional reasoning | (5,6)–(7,8) |
| Identification and control of variables | (9,10)–(11,12)–(13,14) |
| Probabilistic and combinatorial reasoning | (15,16)–(17,18) |
| Hypothetical-deductive reasoning (in particular, aimed at testing the existence of not-observable entities) | (19,20)–(21,22)–(23,24) |
Table 2.
Classification of the types of reasoning with respect to score ranges achievable in the Lawson’s test.
Table 2.
Classification of the types of reasoning with respect to score ranges achievable in the Lawson’s test.
| Score Range | Type of Reasoning |
|---|---|
| <25 | CONCRETE: subjects unable to test hypotheses involving observable causal agents. |
| 26 ÷ 58 | FORMAL: subjects able to test hypotheses involving observable causal agents, but in an incoherent way. |
| >58 | POST-FORMAL: subjects able to coherently test hypotheses involving observable causal agents, or even hypotheses involving unobservable causal agents. |
Table 3.
Classification of the enrolled students with respect to the gender and to the area of study.
Table 3.
Classification of the enrolled students with respect to the gender and to the area of study.
| Area | Female | Male | Total |
|---|---|---|---|
| Science | 275 | 217 | 492 |
| Engineering | 143 | 380 | 523 |
| Total | 418 | 597 | 1015 |
Table 4.
Data that were used to follow the evolution of students’ career.
| Type of Data | Description |
|---|---|
| Personal data | School of origin. |
| Gender. | |
| Career data | Degree course. |
| Exams passed at the end of the three-year period, with the grade, number of credits and date for each exam. | |
| Exams included in the study plan. |
Table 5.
Summary of the sample enrolled in our research.
| Area | Starting Number of Students | Among which | Number of Valid Questionnaires | Among which | Valid Career Data |
| Science | 577 | 564 | 492 | ||
| Engineering | 563 | 540 | 523 | ||
| Total | 1140 | 1104 | 1015 |
Table 6.
The Pearson’s correlation coefficients , the angular coefficient of the best-fit line and the significance index for the two students subsets (science engineering) and for the whole sample of students.
Table 6.
The Pearson’s correlation coefficients , the angular coefficient of the best-fit line and the significance index for the two students subsets (science engineering) and for the whole sample of students.
| Group | r Correlation Coefficient | m Angular Coefficient of the Best-Fit Line | p Significance Index |
|---|---|---|---|
| Science subset | 0.38 | 1.15 | 0.08 |
| Engineering subset | 0.68 | 0.59 | 0.002 |
| Whole sample | 0.52 | 0.43 | 0.008 |
Table 7.
Correlation parameters related to the five plots of Figure 11 for the different dimensions investigated by the Lawson’s test.
Table 7.
Correlation parameters related to the five plots of Figure 11 for the different dimensions investigated by the Lawson’s test.
| Dimension Investigated | r Correlation Coefficient | m Angular Coefficient of the Best-Fit Line | p Significance Index |
|---|---|---|---|
| Conservation (mass and volume) | 0.15 | 0.35 | 0.004 |
| Proportional reasoning | 0.59 | 0.64 | 0.002 |
| Identification and control of variables | 0.58 | 0.65 | 0.004 |
| Probabilistic and combinatorial reasoning | 0.50 | 0.45 | 0.002 |
| Hypothetical-deductive reasoning (to test the existence of not-observable entities) | 0.73 | 0.95 | 0.0008 |
Publisher’s Note: MDPI stays neutral with regard to jurisdictional claims in published maps and institutional affiliations. |
© 2022 by the authors. Licensee MDPI, Basel, Switzerland. This article is an open access article distributed under the terms and conditions of the Creative Commons Attribution (CC BY) license (https://creativecommons.org/licenses/by/4.0/).
Share and Cite
MDPI and ACS Style
Sapia, P.; Napoli, F.; Bozzo, G. The Lawson’s Test for Scientific Reasoning as a Predictor for University Formative Success: A Prospective Study. Educ. Sci. 2022, 12, 814. https://doi.org/10.3390/educsci12110814
AMA Style
Sapia P, Napoli F, Bozzo G. The Lawson’s Test for Scientific Reasoning as a Predictor for University Formative Success: A Prospective Study. Education Sciences. 2022; 12(11):814. https://doi.org/10.3390/educsci12110814
Chicago/Turabian StyleSapia, Peppino, Federica Napoli, and Giacomo Bozzo. 2022. "The Lawson’s Test for Scientific Reasoning as a Predictor for University Formative Success: A Prospective Study" Education Sciences 12, no. 11: 814. https://doi.org/10.3390/educsci12110814
Note that from the first issue of 2016, this journal uses article numbers instead of page numbers. See further details here.