
Math Instrument Development for Examining the Relationship between Spatial and Mathematical Problem-Solving Skills

1
Department of Engineering and Computing Education, University of Cincinnati, Cincinnati, OH 45221, USA
2
School of Electrical and Electronic Engineering, Technological University Dublin, D07 ADY7 Dublin, Ireland
*
Author to whom correspondence should be addressed.
Educ. Sci. 2022, 12(11), 828; https://doi.org/10.3390/educsci12110828
Submission received: 9 July 2022
/
Revised: 26 October 2022
/
Accepted: 31 October 2022
/
Published: 17 November 2022
(This article belongs to the Special Issue STEAM Education and Problem Solving)
Abstract
:Spatial cognition involves the ability to acquire, organize, and use spatial information in the “mind’s eye.” Numerous correlational studies have demonstrated the strong relationship between spatial cognition and skill in problem-solving in mathematics. Educational researchers across the globe aim to improve students’ mathematics problem-solving ability since these skills are often viewed as the gateway to further study in the Science, Technology, Engineering, and Mathematics (STEM) careers of the future. As a result, causal studies showing that spatial cognition interventions can improve mathematics problem-solving skills have begun to appear with increasing frequency. In order to determine if a spatial intervention is effective in improving mathematics problem-solving skills, it is important to identify the type of problem that is likely to respond to improvements in spatial cognition. A large study was conducted in the United States, where a spatial skills intervention was implemented in 7th grade classrooms across the country to determine its impact on mathematics problem-solving skills through four waves of testing. Mathematics instruments for 7th to 9th grades were developed with items compared to the spatial scores of the individual students. In this paper, the instrument development process along with lessons learned are presented. Data are provided showing each item’s correlation with spatial skills test scores, difficulty level, and discrimination index, along with overall instrument reliability. Complete final instruments for each wave of testing are included in an Appendix. General guidelines are also presented discussing the type of math problems likely to be correlated with spatial ability.
1. Introduction
In the National Science Board (NSB) report, Preparing the Next Generation of STEM Innovators [1], the case was made for changing the way that we seek STEM talent. According to the report, the STEM community has traditionally sought STEM talent among those with high verbal and mathematics skills; this report advocates that we should expand our search to include those with high spatial skill levels [2]. However, the report does not advocate for formal training in spatial skills development. The research cited in the NSB report includes several correlational studies showing the strong relationship between STEM success and spatial skills—high STEM achievers typically possess high spatial skill levels; however, causal studies demonstrating a relationship between spatial skills instruction and eventual STEM accomplishment represent a significant gap in our understanding of the relationship between spatial ability and STEM achievement.
There is strong correlational evidence linking spatial skills to success in STEM [2,3,4]. More recent work links spatial skills to creativity and technical innovation [5] and to success in computer programming [6]. A longitudinal study following 400,000 U.S. high school students 11+ years later, investigated both their choice of college major and career, and found that adolescent spatial reasoning skills were predictive of choice of STEM majors and careers, above and beyond the effects of verbal and math abilities [2]. The researchers analyzed longitudinal data for predictors of achievement and attainment in STEM fields using nationally representative samples that included a total of over 100,000 participants. Spatial ability emerged as a consistent and statistically independent predictor of selecting STEM-related courses, graduate study, and other measures of STEM attainment.
The role of spatial ability in mathematics is of particular interest as mathematics is fundamental to many STEM subjects. As argued by Mix and Cheng [7], research should now move on from measuring the strength of the relation between spatial ability and mathematics to determining the nature of this relationship and explaining “the causal mechanisms and shared processes” within this relationship. In order to do this, researchers need tests to measure both spatial and mathematical ability. It is relatively easy to obtain tests of spatial ability that are widely accepted by the research community, have high levels of internal consistency, and have been thoroughly tested within certain age groups. In our experience, however, it is much more difficult for a researcher to conveniently obtain tests of mathematical problem-solving ability that satisfy all these criteria and are specifically related to spatial ability. We believe that many researchers spend significant time finding and collating a set of questions and/or problems to form a suitable test of mathematical problem-solving ability that can provide useful insights into the nature of the relationship between spatial and mathematical abilities. In this paper, we document the development of mathematics instruments for the middle grades (~12 to 14 years old, grades 7 to 9 in the U.S.) where spatial skills would appear to be necessary for successful problem solutions.
In their review paper, Hawes and Ansari [8] posit that there are four possible explanations for the link between spatial and mathematical skills:
- Individuals inherently represent numbers spatially, (i.e., the number line), meaning that people with higher levels of spatial reasoning skills are more adept at mathematical processing
- Spatial and numerical processing rely on a shared region in the brain, particularly the intraparietal sulcus
- Spatial visualization plays an important role in a person’s ability to think about and to model complex and novel problems they have not encountered previously
- Spatial visualization is a proxy for other cognitively demanding skills, such as working memory or general intelligence, meaning that individuals with high levels of spatial skills are generally more likely to have higher numerical skills through these other mechanisms
Hawes and Ansari [8] do acknowledge that there is overlap between these four possible explanations of the link between spatial and math skills; however, these explanations do provide a potential way of thinking about how spatial and mathematical skills are related to one another.
In further examination of the role of spatial ability in solving non-routine problems (explanation #3 from Hawes and Ansari [8]), van Garderen [9] conducted a study with 6th grade students in the U.S. and found that spatial skills contributed to students’ ability to solve word problems. In particular, when presented with a novel, non-routine problem, high visualizing students were more likely to create a sketch that helped them visualize and solve the problem compared to low visualizing students. Casey et al. [10] conducted a study with 4th grade students and found a link between spatial skills and skill in performing measurement tasks. Verdine et al. [11] examined spatial skill levels as demonstrated by a child’s ability to correctly build block figures and found that spatial skills were correlated with mathematical performance for children as young as three years’ old.
What emerges from the literature is that spatial ability is important to math ability in two ways. First, geometry and measurement problems are concerned with space and shape where students have to reason about shapes, area, volume and many other tasks that are clearly spatial in nature. The ability to visualize, create mental images of these shapes and manipulate them requires spatial ability. The space and shape category of The Program for International Student Assessment (PISA) contains problems that fit this description. An analysis of data from Trends in International Mathematics and Science Study (TIMSS) [10] found that performance on questions that had high imagery ratings had larger correlations than questions with low imagery ratings, where imagery rating was based on the need to refer to or mentally manipulate pictures when answering the question.
Second, spatial ability has been shown to play an important role in forming mental representations in problem solving, a task that cuts across all content areas. When solving a problem, the student is confronted with a novel situation or scenario they have not seen before and must first form a mental representation of the problem which then guides how they approach the problem solution. In the problem solution phase, they draw on various bits of procedural knowledge they have learnt throughout their mathematics education but which bits of procedural knowledge they decide to draw on depends on how they have represented the problem. Those who form inaccurate representations that lack a coherent schema are unlikely to solve the problem [12] even if they have a correct understanding of and ability to apply the required procedural knowledge [13].
An interesting finding from one study was that when a problem could be solved through guess and check the relationship with spatial ability disappeared [13]. Those who took a guess and check approach successfully solved the problem but avoided the need for the problem to be represented. This highlights the fickle nature of the relationship between spatial and math abilities. Spatial ability is not always related to success in problem solving. A problem representation step is required in order for spatial ability to play a role. Math problems that have a fixed-choice response may allow participants to avoid creating their own representations of the problem. Working backwards from each of the response choices is not the same as forming a representation of a problem that is open-ended or has no fixed-choice responses. If the fixed-choice response format reduces the need to independently form a mental representation then the role of spatial ability may be diminished.
Judd and Klingberg [14] report on the results from a large Randomized Control Trial (RCT) (n = 17,648) conducted among 6 to 8-year-old students. The main finding from this study was that training for spatial cognition enhanced mathematical learning, with spatial working memory training outperforming mental rotation training by a significant amount. They concluded that “reasoning ability and maintenance of spatial information is relevant for mathematics learning in young children”.
1.1. Spatial/Mathematics Studies in the Middle Grades
The middle grades, in particular, appear to be a crucial time in developing student interest in STEM [15,16]; students’ middle school experiences influence the scholastic pathways they will take in the future [17]. Specifically, students’ beliefs in middle school of whether they will pursue future STEM careers influence later educational and occupational choices; eighth graders with expectations for a STEM-related career were 3.4 times more likely to earn science and engineering degrees than students without similar expectations [18]. For females, the middle grades are the time when STEM interest drops precipitously for many and never recovers [19]. At the same time, from a study conducted in Ireland, significant gender differences in spatial skills also start to grow at around 8th or 9th grade [20]. It is important that we study the various factors that determine achievement in math with this age demographic.
However, only a minority of studies have recruited participants from this age group to examine the role of spatial ability in math learning. In their comprehensive review of the spatial/math literature, Mix and Cheng [7] describe several studies from primary school in the section on developmental change but cite few studies of adolescent or adult samples. In fact, one of the few examples they provide to demonstrate the spatial-math relationship at the post-primary level comes from the data collected during Project Talent among high school students; however, Project Talent wasn’t actually a study of the spatial-math relationship but was concerned with how trends in the subject and career choice are related to spatial ability and participants were recruited from high school only. Mix and Cheng also provide evidence that the spatial-math relationship becomes stronger in adolescence than at the primary school level.
In a recent meta-analysis [21] of the literature on spatial ability and mathematics, only 9 of the 73 studies included in the review were concerned with the middle school population, i.e., grades 6 to 8, age range 12 to 14 years old. Approximately, 80% of the correlations were measured among samples of children younger than 13 years old (210 correlations), 13.5% were associated with samples of adolescents (13 to 18 years: 35 correlations), and 6.5% with samples of adults (17 correlations). In this meta-analysis, the literature search was limited to studies published between 2008 and 2018 in which participants ranged in age from 3 to 25 years. Findings from this meta-analysis showed the mean effect size for the relationship between spatial ability and mathematics was significant for children and adolescents but not adults with the authors concluding that age does not moderate the relationship between spatial ability and mathematics.
The categorization of spatial abilities used in the meta-analysis was based on the 2 × 2 typology put forward by Uttal et al. [22] with the addition of visual-spatial memory. In other words, spatial ability was divided into five categories: intrinsic-static (e.g., embedded figures tasks), intrinsic-dynamic (e.g., mental rotation tasks), extrinsic-static (e.g., map reading tasks), extrinsic-dynamic (e.g., perspective taking tasks), and visual-spatial memory (e.g., Raven’s progressive matrices tasks). With regard to mathematics, it was divided into four categories of ability: Numerical ability (e.g., counting, number sense, number line tasks), Arithmetical ability (e.g., fraction, algebra, calculus tasks), Geometric ability (e.g., geometry tasks) and Logical reasoning (e.g., word problem-solving, mathematical reasoning tasks). Significant correlations with spatial ability were found across all domains of math. Logical reasoning was found to have a stronger association with spatial ability than numerical ability and arithmetical ability. The correlation of spatial ability with geometry was found to be equal to correlations with numerical and arithmetical ability. Mean effect sizes for the different age groups were not significantly different but middle school age groups were included in the larger age range of 13 to 18 years old.
Difficulties understanding or reasoning about spatially demanding STEM content and engaging in spatially-demanding STEM activities may be a contributor to females’ waning interest in STEM. Given the paucity of studies in the spatial/mathematics domain at the middle school level, the instruments described here should be of interest to researchers and others who are attempting to improve mathematics outcomes through spatial skills intervention.
The data presented in this paper were collected as part of a larger study in the U.S. across multiple states. The purpose of the larger study was to implement a spatial skills intervention in 7th grade classrooms to determine the impact of the instruction on student performance in and motivation for mathematics. Since the purpose of the larger study was to determine the impact of the spatial skills intervention on mathematics performance, we desired to identify problems where spatial thinking likely played a role in their solution, i.e., we were not interested in mathematics performance in general but in “spatial math” performance specifically. Therefore, we purposefully sought mathematics problems that were likely to rely on spatial thinking in their solution. In some cases, we based our judgements on what had been reported in the literature; however, given the dearth of studies in the middle grades, there were not always adequate types of problems to choose from. In other cases, we based our decisions on our own intuitions; sometimes we chose correctly and other times we did not.
1.2. Categories of Mathematics Problems
For the purpose of this paper, we employed the mathematics taxonomy developed by the National Council of Teachers of Mathematics in the U.S. to categorize the problems we included on our instruments. While we employed this taxonomy in our study, we accept that this is not a definitive way to organize mathematical tasks and that it categorizes tasks by content area rather than the type of thinking required when engaging with mathematics. However, it does provide a clear taxonomy that overlaps with the curriculum followed by the population of interest in this study–middle school students–and covers the range of problems and questions found on standardized tests, such as state assessments and the mathematical strand of The Program for International Student Assessment (PISA).
Children engage with a range of mathematical topics throughout school and these topics can be categorized in various different ways. The NCTM is a U.S. organization that advocates policy in mathematics teaching and learning and provides a comprehensive and detailed set of guidelines on standards and principles in mathematics education. In the context of K12 education, the NCTM divides mathematics into five content standards which are listed and briefly defined as follows [23]:
- Number and Operations
- (1)
- Understand numbers, ways of representing numbers, relationships among numbers, and number systems
- (2)
- Understand meanings of operations and how they relate to one another
- (3)
- Compute fluently and make reasonable estimates
- Algebra
- (1)
- Understand patterns, relations, and functions
- (2)
- Represent and analyze mathematical situations and structures using algebraic symbols
- (3)
- Use mathematical models to represent and understand quantitative relationships
- (4)
- Analyze change in various contexts
- Geometry
- (1)
- Analyze characteristics and properties of two- and three-dimensional geometric shapes and develop mathematical arguments about geometric relationships
- (2)
- Specify locations and describe spatial relationships using coordinate geometry and other representational systems
- (3)
- Apply transformations and use symmetry to analyze mathematical situations
- (4)
- Use visualization, spatial reasoning, and geometric modeling to solve problems
- Measurement
- (1)
- Understand measurable attributes of objects and the units, systems, and processes of measurement
- (2)
- Apply appropriate techniques, tools, and formulas to determine measurements
- Data Analysis and Probability
- (1)
- Formulate questions that can be addressed with data and collect, organize, and display relevant data to answer them
- (2)
- Select and use appropriate statistical methods to analyze data
- (3)
- Develop and evaluate inferences and predictions that are based on data
- (4)
- Understand and apply basic concepts of probability
Education policy in the U.S. is developed at the state level, meaning that there are at least 51 different sets of standards in place for mathematics instruction across the country. Although NCTM standards are not mandated nationally in the U.S., they are typically referenced in state-level standards and form the basis for mathematics teaching and learning across the nation. In this paper, we employ the NCTM standards for the categorization of the items on the mathematics instruments under consideration.
2. Research Questions
The following research questions guided this study:
- What are the characteristics of math problems that correlate with spatial skills?
- Are correlations impacted by math problems’ characteristics, such as inclusion of a figure, formatting the questions as fixed choice or open-ended responses, etc.?
- What are the lessons learned for educators and researchers to consider during the development and selection process of items for a math instrument for use in spatial skills research?
3. Methods
3.1. Setting
As stated previously, the data presented and analyzed here were collected as part of a larger study in the U.S. among multiple school districts across several states. In the larger project, we examined the impact of a spatial skills intervention on mathematics performance. The intervention was administered during regular class time for 7th grade students (approximate age = 12 years old). In all, there were 5 cohorts of students in this study as outlined in Table 1.
Each cohort experienced four waves of testing in total. Wave 1 occurred at the beginning of 7th grade; Wave 2 occurred towards the end of 7th grade; Wave 3 occurred towards the end of 8th grade; and Wave 4 occurred towards the end of 9th grade. Between Waves 1 and 2, there was some attrition, but not a significant amount; however, between waves 2 and 3 attrition was larger. The attrition rate between Waves 3 and 4 was significant because in many of the participating districts either (a) there were multiple possible high schools for matriculation for the students and thus no way of connecting with teachers willing and/or able to administer the instruments to the students in the study or (b) 9th grade teachers were simply unwilling to administer the instruments due to scheduling pressures. As a result, there is a large variability in the sample size for each wave of testing.
In the larger study, the intervention was delivered to some of the students in Cohorts 2–5. In Cohort 2, there was random assignment between treatment and experimental groups. Cohorts 3 and 4 were quasi-randomly assigned. In the 2019–2020 academic year, all previous control group teachers were invited to implement the intervention, meaning there was no control group during that year. Further, the data collection in the 2019–2020 academic year was sporadic, due to the emergence of the COVID-19 pandemic.
3.2. Participants
In this study, only data from the baseline group in Cohort 1 and the control groups in Cohorts 2–4 were examined. Students in the treatment group for Cohorts 2–4 were excluded in order to minimize potential confounding factors that might be introduced due to the spatial skills intervention. Data were also excluded if a given student did not complete all of the instruments (described subsequently) in a given wave of testing. Table 2 includes the sample sizes for each wave of testing used in this analysis.
3.3. Instruments
A number of instruments were utilized in the larger study; however, here we focus on the results from only those described in the following paragraphs. A decision was made early in the project that all instruments would be delivered in paper-and-pencil format, to reduce reliance on technology in participating districts: some districts had technology readily available, others did not.
3.3.1. Spatial Instruments
Two spatial instruments were administered across all four waves of testing. The first spatial instrument was a test of 3D mental rotations and consisted of 10-items from the Purdue Spatial Visualization Test: Rotations [24]. The second spatial instrument consisted of 10 items from the Differential Aptitude Test: Space Relations [25]. The participating teachers were given instructions for test administration; however, since all tests were administered in paper-and-pencil format, there was no feasible way for researchers to control or enforce time limits. It should be noted, though, that most teachers in the U.S. routinely administer tests with strict time limits, so the instructions were likely to have been adhered to by the teachers in the study. Teachers were asked to allow up to 7 min for each of the spatial instruments.
Table 3 shows the internal consistency reliability evidence (Cronbach’s α coefficients) from the baseline cohort (i.e., Cohort 1) for student responses on the DAT:SR and PSVT:R, respectively and as a whole. Overall, the PSVT:R had slightly better reliability evidence than the DAT:SR (except for Wave 4), and the reliability coefficients increased as students got older. Cronbach’s α coefficients from the combined spatial test (DAT:SR + PSVT:R) were in the acceptable range of reliability evidence. The correlation coefficients between DAT:SR and PSVT:R were all positive and relatively large, providing further justification for combining them into one score.
3.3.2. Math Instruments
In addition to the spatial instruments, students completed a mathematics assessment at each wave of testing. The math instruments varied by wave; the four final instruments are included in the Appendix A. In developing each of the four instruments, we attempted to select problems based on the following parameters:
- The problems were grade-level appropriate for the age of the students at the time they were being tested
- The problems represented a range of difficulties with an average % correct on the instrument overall targeted at 50%
- A total testing time of around 15–20 min, since teachers were hesitant to give up too much class time for testing
- The problems were likely to exhibit a correlation with spatial skills (according to the insights of the researchers and results reported in the literature).
In order to satisfy the criterion that items were grade-level appropriate for the age of the students, we first examined released items from various large-scale testing programs. For Waves 1 and 2, we used released items from the Colorado State Assessment Program for grades 6 and 7; for Wave 3, we used items released by the state of Georgia for their high stakes testing at the 8th grade level; for Wave 4, we used released items from the OECD mathematics PISA test. PISA testing is aimed at 15-year-olds across the globe, which was the approximate age of our participants when they were completing Wave 4 testing.
We selected problems we thought would have a “spatial component” (based on our own experiences or the literature) and then showed the problems to math teachers who had experience in teaching at that particular grade level. We asked them if they thought the problems were appropriate for that grade and we also asked about their perception of the level of difficulty of each item. Based on these teacher recommendations, we selected 6–10 problems for use on each given instrument.
Since our Cohort 1 students were baseline students and not a part of the official Randomized Control Trial in the main study, we pilot-tested each instrument with the baseline group of students for each wave. Based on the results from the pilot-testing, we revised each math instrument, eliminating problems that were too difficult or too easy for the students or that were confusing or difficult to grade/assess. The resulting instruments were then administered by our participating teachers at roughly the same time as the spatial skills testing. No time limits for the math instruments were specified for the teachers; however, most teachers reported spending 15–20 min on math testing in their classrooms.
Complete, final instruments for each wave of testing are included in the Appendix A for this paper. In the following sections of this paper, we will discuss specifics for problems on each wave.
3.3.3. Verbal Instruments
State standardized English language arts (ELA) scores were collected at each wave (i.e., Grades 6 to 9 state ELA scores), which were usually administered toward the end of the academic school year. We considered the state ELA scores as an indicator of student verbal ability and utilized them to provide discriminant validity evidence of spatial ability instruments and spatial math performance.
4. Results
4.1. Correlations of the Math Instruments with Spatial and Verbal Ability
Table 4 includes data from our analysis of the math instruments and their correlation with the spatial and verbal measures. As it can be seen from the data presented in Table 4, the team improved its performance in designing the math instruments over time. In each case, the final instrument demonstrated a larger correlation with the spatial test, when compared to the draft version. We also got closer to our target of an average score of 50% on the final instruments. We then examined each item on each final instrument to determine which, if any, were better correlated with spatial skill levels than others.
The correlation coefficients between spatial tests and verbal tests were 0.366 at Wave 1, 0.434 at Wave 2, 0.506 at Wave 3, and 0.535 at Wave 4 and they were all statistically significant at * p < 0.01. These small to medium correlations present the discriminant validity evidence of spatial tests different from verbal tests, which do not assess the same ability. At Waves 1, 2 and 3, the correlation coefficients of math instruments with verbal tests were higher than the correlation coefficients of math instruments with spatial tests, but at Wave 4, the trend was reversed.
4.2. Item Analyses of Math Instruments
Table 5, Table 6, Table 7 and Table 8 show the individual item analysis for each question on the final version of the instruments for the four waves of testing [Refer to the Appendix A for final instruments]. In these tables, Item Difficulty is the percentage of students who answered the question correctly (i.e., low numbers signify high difficulty), Item Discrimination is the point-biserial correlation between the item score and the overall score. The Correlation with Spatial is the correlation of that item with a student’s score on the combined spatial instrument (items from the PSVT:R and the DAT:SR). The Correlation with verbal is the correlation of that item with a student’s score on the state standardized ELA score. Due to the relatively large sample sizes, nearly all correlations are statistically significant.
4.3. Unanticipated Difficulties
Given the nature of the “Stack of Logs” problem, and its seeming similarity with the items on the DAT:SR, we anticipated that it would be highly correlated with spatial skills, and hence, included it on both Wave 1 and Wave 2 instruments. The item difficulty and discrimination appeared to be acceptable, but the correlation with spatial was surprisingly small. In examining the data for the preparation of this paper, we discovered that there were several students who got the correct answer to the problem by going about it in an incorrect manner. Figure 1 shows the final figure used for the stack of logs problem.
Students are to solve for the area of a sheet of plastic that could completely cover this stack of logs, i.e., the surface area of the exposed parts (note that the bottom of the stack needs no cover). To solve this, one takes the surface area of the top (8 × 4), plus two times the area of the side (4 × 4), plus two times the area of the front (8 × 4), giving a correct response of 128 square feet (32 + 32 + 64). Unfortunately, 128 is also the volume of this stack of wood (8 × 4 × 4 = 128 cubic feet) and we discovered that a not insignificant number of students solved the problem this way. It appeared that the strategy employed for some students in solving math problems was merely to multiply all numbers appearing on the page by one another. Further evidence of multiplying all numbers on a page as a problem-solving strategy was found in students’ solutions to the problem where they were to determine the area of the T-shaped poster for spirit day (see Figure 4). For the spirit day poster problem, there were several students who simply multiplied all of the numbers together (3 × 3 × 3 × 3 × 3 × 9), arriving at an improbably high answer of 2187 square cm instead of the correct answer of 36 square cm. This type of approach to solving the problem can be described as ‘plug and chug’, i.e., put the numbers provided in the problem through some mathematical operation and see what comes out.
The stack of logs problem could be fixed by merely changing one of the dimensions on it, so that the number associated with the exposed surface area does not equal the volume. For example, if the width was changed to 5 feet, the correct exposed surface area would be 144 square feet and the volume would be 160 cubic feet. Given the difficulties with this problem, the data regarding difficulty, discrimination, and correlation with spatial should be viewed with skepticism; however, we believe that this problem would be a good choice for this age group with a slight modification.
4.4. Analysis by NCTM Content Strand
In this study, each problem for each wave was carefully examined and assigned to one of the five NCTM content standards (a few problems were assigned to two content strands). Given the direct reference to visualization and spatial reasoning in the NCTM geometry category, one would expect math tasks that fall under this heading to have the strongest relationship with spatial ability. It’s not immediately clear which other category/categories would also demonstrate a strong relationship with spatial ability. Perhaps, given the importance of patterns, algebra tasks might also draw heavily on spatial ability. The problems for each instrument were grouped by NCTM category (see Table 5, Table 6, Table 7 and Table 8) and the mean item difficulty for the problems within each of these categories was determined with the results presented in Table 9. Both Algebra and Geometry questions had a mean item difficulty of more than 0.6, so questions from these categories were found to be the easiest for the students (recall that item difficulty is the percent of students who answered the problem correctly, so lower numbers = greater difficulty). Questions from the Analysis and Probability category were not far behind in terms of difficulty with a mean of 0.57, followed by the Number category with a mean of 0.48. The most difficult questions belonged to the Measurement category.
Correlations between performance on each problem and score on the combined spatial measure were then grouped by content standard and the mean of these correlations determined. These results are also found in Table 9. Compared to the data presented regarding item difficulty, a different trend is observed in correlations with spatial scores where Geometry, but not Algebra, is ranked highly in terms of correlation with spatial ability. This is consistent with the NCTM description of the Geometry category that includes a direct reference to spatial reasoning. What is perhaps surprising, however, is that the Analysis and Probability category has the highest correlation with spatial ability, albeit very similar to that found for Geometry, even though it had the smallest number of overall items in the instruments. It is also surprising that Algebra has the lowest correlation with spatial ability based on the NCTM definition of Algebra as including pattern representation. However, the differences between the correlation coefficients by the NCTM contents were not statistically significant.
Of the 36 math problems used across the four waves in this study, only three were categorized as Analysis and Probability. One of these required the interpretation of a graph of a linear relationship while the other two questions required interpretation of a graph of a non-linear relationship of velocity versus displacement for a car on a racetrack with turns. Interpreting graphs was common to these problems so the aspect of the Analysis and Probability category was limited to only a portion of the content standard, i.e., “Formulate questions that can be addressed with data and collect, organize, and display relevant data to answer them” (refer to the categories of mathematics problems). The interpretation of graphs likely draws on spatial ability in a number of ways.
4.5. Construct Validity and Reliablity Evidence of Math Instruments
To explore construct validity evidence on the Waves 1–4 math instruments, we conducted exploratory and confirmatory factor analyses by randomly splitting the data in half from Cohorts 1 to 4 for each analysis. Student responses were coded 0 and 1, which is categorical in nature. Therefore, robust weighted least squares (WLSMV) employed in Mplus 8.4 [26] was utilized to obtain parameter estimates for factor analyses with categorical data. Exploratory analyses confirmed one latent factor and items with non-significant factor loadings for each wave of the spatial math instrument.
Table 10 provides results from exploratory and confirmatory factor modeling for the best model for each wave of the math instruments. The model fit indexes were all in the acceptable fit ranges. The recommended good fit indexes are ranged in that RMSEA is close to 0.06 or below, CFI and TLI values are close to 0.95 or greater, and SRMR is close to 0.08 or below [27]. According to the cutoff for the good fit indexes, some fit indexes (i.e., CFI, TLI, and SRMR) are not good but acceptable, so we decided to keep the current model. Factor analyses results showed that two items on the Wave 1 spatial math instrument, one item on Wave 2, and two items on Wave 4 are not valid, or are not good indicators of spatial/math ability. While the factor analysis was conducted separately and has no relationship to the spatial ability test scores, interestingly, the questions with poor factor loadings were the also the ones with low correlations with spatial ability test scores.
Table 10 also presents internal consistency reliability coefficients (Cronbach’s αs) from the final CFA models of the four spatial math instruments. The reliability coefficients from Waves 1 to 3 of the spatial math instruments were not in the range of the commonly accepted cut-off of over 0.70 to form a reliable measure [28]. Considering that internal consistency reliability may be low if a test has few items [29], the low reliability coefficients might be due to the small number of items, such as four questions on Wave 1, six questions on Wave 2, and 8 questions on Wave 3.
4.6. Figure versus No Figure Included in the Problem Statement
One of the questions regarding item characteristics of the spatial math instruments was: How does performance, as defined by item difficulty, and correlations between solving the problem and spatial ability vary between problems that have or do not have a figure accompany the problem statement? Table 11 shows the results from the statistical analyses comparing item characteristics of the problems based on the visual aids. When problems were grouped into two categories of Figure and No Figure, there was no significant difference in the mean Item Difficulty for problems that did and did not have a figure accompanying the problem statement. Likewise, for Correlation with Spatial Ability, the inclusion of a figure with the problem did not reveal a significant difference in mean values.
The results from this analysis show that just because an item has a figure, it is not automatically “spatial.” For example, let us examine two problems from the Wave 1 testing. The triangles problem shown in Figure 2, was universally viewed by members of the development team as being a “high-spatial” problem.
Although the Triangles problem had acceptable Difficulty (0.440) and Item Discrimination (0.456), its correlation with spatial was among the lowest (0.085) of all problems used in the study. If we contrast the testing results from the Triangles problem with those from the Pancakes problem (shown in Figure 3), which did not have a figure, we find that the two problems had similar Difficulty ratings (0.440 vs. 0.411); however, not only was the Pancakes problem more discriminating (0.688 vs. 0.456) but it also exhibited a significantly higher correlation with spatial skills (0.424 vs. 0.085). The statistical comparison of the correlations from the dependent samples revealed that the correlation of the Pancakes problem (#4) with spatial skill level was significantly higher than the Triangles problem (#3) for Wave 1 (n = 1923, z = 11.769, p < 0.001).
Upon further examination of the Triangles problem, it appears to be a problem testing logical reasoning and not spatial thinking; however, at first glance, it appeared to be a highly spatial problem. Data obtained here show that performance on the problem is not significantly related to spatial ability. In selecting problems for spatial/mathematics studies, researchers should take care to thoroughly examine what a problem is actually testing and not assume that because there is a figure, that the problem is automatically spatial.
4.7. Open-Ended or Fixed-Choice Response When Answering the Problem
How does performance, as defined by item difficulty, and correlation between solving problem and spatial ability, vary between problems that have and do not have a selection of answers to choose from? Table 12 shows the results from the statistical analyses comparing item characteristics of the problems based on the response types. When problems were grouped into two categories of Open-Ended (OE) and Fixed-Choice (FC) formats, independent samples t-tests showed that, on average, OE problems were more difficult, had better discrimination, and higher correlations with spatial scores than the FC format problems. The effect sizes of the differences were all large.
Some of the Open-Ended problems that we selected were among the highest, in terms of correlation with spatial skills, compared to Fixed-Choice problems. For example, if we examine the two Spirit Day poster problems found on Wave 1 and Wave 2 instruments (shown in Figure 4). The Open-Ended version of the problem appears to be more highly correlated with spatial skills compared to the Fixed-Choice version (0.393 vs. 0.323). The statistical comparison of the correlations from the dependent samples revealed that the correlation of the T-Shaped Spirit Day poster open-ended problem with spatial skill level was significantly higher than the I-Shaped Spirit Day poster fixed-choice problem (n = 1686, z = 2.962, p < 0.002); however, the T-Shaped Spirit Day poster open-ended problem also appears to be much more difficult (Difficulty of 0.190 vs. 0.430). Similarly, on the Wave 4 instrument, the open-ended Cost of Apartment problem was more difficult but was also better correlated with spatial than the Fixed-Choice problems concerning the Cost of the Apartment. In fact, two of the Fixed-Choice problems in this series (III and IV) did not correlate with spatial at all.
While Open-Ended problems appear to rely on spatial thinking more than Fixed-Choice problems, there are some cautionary lessons learned from this study. Since this study was ongoing over several years, there were multiple graduate assistants who scored the math instruments. In the final year of the study, we determined that there were significant inconsistencies in how these problems were scored from year to year, even when the same grader scored them in two consecutive years. This necessitated that we re-score all of the math papers in the final months of the project, meaning that grant funds were expended twice for the same thing. The second issue arising from using Open-Ended problems on instruments, such as these was in the sheer volume of data generated. We believe that there is likely some rich data that could be examined by looking at problem solution methods, sketches (if any) produced by students as they solved the problems, or common errors; however, with more than 2000 students who completed the Wave 1 instrument and nearly the same number completing the Wave 2 instrument, qualitative analysis of this data would be daunting. We could sample student work for qualitative analysis; however, this would also add a layer of complexity, in terms of developing and implementing a sampling protocol to answer specific research questions, so the study and may not be entirely feasible.
4.8. Term Location Matters
For algebra problems, it appears that straightforward, basic problems have a lower correlation with spatial skill levels compared to those where the solution is found “backwards.” For example, consider the two algebra problems found on Wave 1 and Wave 2 testing:
- The cost to rent a boat is $10. There is also a charge of $2 for each person. Which expression represents the total cost to rent a boat for p persons?
- A.
- 10 + 2p
- B.
- 10 − 2p
- C.
- 2 + 10p
- D.
- 2 − 10p
- Joan needs $60 for a class trip. She has $32. She can earn $4 an hour mowing lawns. If the equation shows this relationship, how many hours must Joan work to have the money she needs?4h + 32 = 60
- A.
- 7 h
- B.
- 17 h
- C.
- 23 h
- D.
- 28 h
The first of these problems is straightforward in that what you are solving for, i.e., the total cost to rent the boat, is on the opposite side of the equal sign from the algebraic expression. The correct answer to this one is 10 + 2p = cost. For the second problem, you are given the total cost ($60) and must rearrange terms to find the correct solution, i.e., h = (60 − 32)/4.
For each wave of testing, the correlation with spatial skill level was higher for problem #2 than for problem #1 (Wave 1: 0.265 versus 0.138 and Wave 2: 0.282 versus 0.218). The statistical comparison of the correlations from the dependent samples revealed that the correlation of problem #2 with spatial skill level was significantly higher than problem #1 for both Wave 1 and Wave 2 (n = 2053, z = 4.423, p < 0.001 for Wave 1, n = 1917, z = 2.421, p = 0.008 for Wave 2). This finding is similar to the research by Cheng and Mix [30], who found that spatial training improved children’s ability to solve what they referred to as “missing term problems,”, e.g., 7 + ___ = 12. Children who did not experience the spatial training could solve straightforward problems, such as 7 + 5 = ___, but were less likely to solve the problems correctly when they had been rearranged so that they were missing term problems.
5. Discussion
Based on the findings from the item and test level analyses, we outline our lessons learned through the development of these spatial math instruments and include guidelines for the design of similar instruments for large-scale testing in the spatial/mathematics domain. In this section, we also reflect on a number of problems we noticed can occur in the design and selection of problems and suggest how these can be avoided in future work. Finally, we discuss some limitations of the study.
5.1. Lessons Learned
In hindsight, there are several things to consider when selecting math problems for inclusion on instruments for studies examining the link between spatial thinking and mathematics success or for examining the impact of a spatial intervention on subsequent mathematics performance.
Including a figure does not of itself lead to a change in the level of spatial cognition that is required to solve the problem. One might think that a figure provides an advantage to a participant who has difficulty in creating their own visualizations of the problem context thereby diminishing a correlation with spatial ability, but this was not observed in our study. However, the problems that contained figures differed in other ways to the problems that did not have figures and further work would be needed to isolate the presence of a figure as the only difference. What we did observe is a correlation with spatial ability can be found when figures accompany the problem statement. Problems with figures do not have to be excluded.
Another lesson we learned was to avoid fixed-choice problems where possible.
Although there were some inconsistencies in the findings, the overall trend was towards higher correlations with spatial ability for open-ended than fixed-choice problems. This suggests a greater demand is placed on spatial cognition when participants solve an open-ended problem compared to one with a set of choices. However, scoring open-ended problems can be much more challenging and time consuming; fixed-choice responses have obvious advantages in this regard and correlations with spatial ability can still be found. Both place demands on spatial cognition but the open-ended approach appears to expose spatial thinking to a greater extent.
Although not part of our findings, as we did not collect sufficient data to test these observations, we did observe some other issues. First, to ensure performance in problem-solving exposes the student’s ability to conceptualize or mentally represent the problem, it is advisable to keep the procedural or rote mathematics content as simple as possible. Considering problem solving as having two stages—representation and solution—it is important to choose problems for which the students have sufficient prior knowledge of the mathematical procedures required for the solution phase. Performance would then be mostly determined by success in representation.
For example, in the pancakes problem (Figure 3), some of the fractions used are more difficult than others, meaning that some students may have conceptually understood that they were to multiply amounts in the Ingredients column by 5, but may have made a mistake in reducing the fraction, and would thus be marked incorrect. Similarly, in the Falling Dominoes problem (Figure 5), the distance between dominoes was given as 7/8 inch, and in the draft version of this problem, students were given a length of 29 feet for the line of dominoes. Thus, not only did students need to work with the fractional distance between dominoes but they also needed to be able to correctly convert between feet and inches. A not insignificant number of students may have understood how to solve these problems, but made relatively minor mathematics errors in their solutions, meaning they were marked as incorrect. Simplifying the mathematics in these problems may have allowed us to determine which students understood the underlying concepts and which did not.
Another issue we observed, which is related to the way a problem is presented to students, was not to include multi-part problems on the instrument, unless the parts were independent from one another, i.e., in order to get part B correct, you need to have answered part A correctly. The multi-part questions where answers depended on previous responses were problematic because it was difficult to determine if a student missed part B because they did not know how to do that or if they missed it because they had missed part A. Including a problem with multiple parts like the Dice problem from Wave 4 testing (see Figure 6) were deemed satisfactory, since answers on all parts were independent from one another.
Finally, it is important to be less trusting and to verify and double-check problems for coherency and correctness. For example, one problem was a released item from the Colorado State Assessment Program test and was included on the draft version of the Wave 1 instrument. However, in the process of scoring the problem, we determined that the correct answer was not included among the choices given. We did include this problem on the Wave 2 instrument (with the correct answer included); fortunately, since our study included several waves of testing across multiple years, we were able to recover from our initial mistake. In some other studies, with shorter timeframes, this might not be feasible.
Another instance where we needed to be less trusting occurred in Wave 2 testing. When administering the Wave 2 instrument, teachers were given written instructions to make sure their students had a centimeter ruler in order to solve the test. [A ruler was needed for the Height and Circumference of the Vase problem]. In scoring this problem, it became apparent that several students did not have rulers at all and others had inch rulers. Solutions completed with an inch ruler were initially scored as incorrect, even though the students had correctly done their work. When math tests were re-scored towards the end of the project, we were able to account for the fact that some students appeared to be working in inches; however, since we think that some students did not have access to a ruler at all during their testing, some of the data regarding difficulty, discrimination, and correlation with spatial may be a bit suspect for this problem. In the future, we would double-check to be certain that the teachers clearly understood what was expected of them to avoid problems such as this (their instructions were written, but we suspect some teachers may not have carefully read the instructions).
5.2. Limitations of the Study
There were several limitations identified for this study. This study involved a large number of teachers across several states in the U.S. In America, each state has its own education system, its own requirements for teacher certification, and its own methods/instruments for high-stakes testing. Schedules vary greatly within and between states. For example, schools in Georgia and Colorado typically begin their school year in early August, but in Michigan, state law prevents most schools from starting prior to Labor Day (the first Monday in September). Some states conduct high-stakes testing in the fall; others conduct this testing towards the end of the academic year. A large number of the schools participating in this study were from Michigan; however, schools in Georgia, Tennessee, Texas, Louisiana, Colorado, and Ohio also participated in the project. In addition, a small number of schools in this study were private schools, meaning that they were not required to participate in the high-stakes testing for their respective states. While there were some urban and suburban districts participating in this study, the preponderance of schools was small, rural, nearly all-White districts in the state of Michigan. While the large diversity in districts should be a strength in terms of generalizability, this variety could also have led to unknown confounding factors that impacted our results.
Another limitation of the study was that while teachers were given explicit instructions for test administration, it was not feasible for the researchers to be present for the testing, meaning that we do not really know how well our instructions were followed or if they were followed at all. Most teachers in the U.S. are conversant with administering standardized tests that have strict rules, so we assumed that participants would follow our instructions; however, we have no way of knowing if they did, indeed, follow them.
Given school curriculum and scheduling constraints, we were unable to conduct comprehensive testing among the student participants. Thus, we were limited to only two spatial instruments, and we selected tests measuring mental rotation and paper folding skills, two common types of spatial tests from the literature. It could be that other types of spatial tests would have revealed larger (or smaller) correlations for the various types of math problems we employed; however, our selection was guided by the literature regarding the relationship between math and spatial ability. In our very first wave of testing, we employed two additional tests of spatial ability (mental cutting and isometric/orthographic views); however, teachers complained about the length of time taken by the testing and the reliability of those instruments was extremely low within our sample, so we eliminated those two tests for further waves. Time limitations in the schools also resulted in creating math instruments with only a few problems on them, which could have also impacted our results, including limiting our test reliabilities due to the low number of items.
American students undergo significant testing throughout the school year, but primarily in the spring (towards the end of the year). Further, students in this study were told that their results on the spatial/math instruments would not “count” for anything in their marks for the course, meaning that test reliability for Waves 2, 3, and 4 (conducted in the spring) could have been somewhat lower because children were burned out and did not take the tests seriously. We attempted to mitigate this by offering pizza parties for classes if they “tried their best” on the tests; however, test fatigue could have impacted our results nonetheless.
Teacher burnout in administering tests could also have been a factor impacting reliabilities. This was particularly true for control group teachers who likely did not feel a “connection” to the project and were only administering the tests because their principal asked them to. Wave 4 testing was particularly problematic in this regard, except for in our small rural districts where there is typically a large degree of cooperation between high schools and middle schools. This was mitigated somewhat after we instituted $100 gift cards for teachers who administered tests for us (Cohort 3 and later—for initial cohorts we did not provide this incentive).
Our use of the NCTM scheme for categorizing problems could also be a limitation of the study. There are certainly other schemas in existence and these other schemas may have produced different results. Other choices for categorizing problems might have been to look at the type of “thinking” required for problem solution or to examine if each item was novel problem solving versus recollection of procedural knowledge. It does not appear that there is universal agreement on how math problems should be categorized; different schema may have produced more interesting results compared to the results obtained here.
Finally, differences in grading (in some cases 2000+) open-ended problems could have impacted our results. In our initial analysis for this paper we did, indeed, find significant disparities in scoring items and employed undergraduate students to re-score each open-ended problem; however, given the sheer volume of data, there could have been differences in grading even with a single person grading the item. As faculty, we realize that sometimes our grading changes as we work our way through a stack of 100 papers and these student graders were working their way through 2000+ papers. Further, in some cases, a student might get the correct answer with no work shown on the page (e.g., the stack of logs problem discussed previously), so it was unclear if they somehow got the correct answer by an incorrect method, or perhaps they looked at their neighbor’s page. In addition, for students who did not show their work, they may have made a small mental error and got the problem wrong, even though procedurally they were on the right track.
6. Conclusions
When developing a set of problems to examine the relationship between math and spatial ability, there are many pitfalls that need to be carefully considered and avoided so that useful data are collected. It is too easy to assume participants will attempt to solve the problem in the mathematical way you intended; the same problem can be conceptualized or represented in different ways by different people. As the findings from this study have shown, there is a real possibility that many participants will solve a problem using one of several inappropriate representations including guess and check (e.g., the height and circumference of vase problem), reverse-engineering (e.g., fixed-choice problems), and plug and chug (e.g., the stack of logs problem). At least two consequences arise from this behavior. First, if your intention was to examine the ability of participants to represent the problem in the way you intended, the data may be only partially complete if many did not adopt or try to adopt the correct representation and it’s not clear whether the participants who formed inappropriate representations were incapable of forming the correct representation or just saw another option and went for that. Second, you can inadvertently set the problem up for participants to arrive at the correct answer through an inappropriate representation—correct solutions from incorrect problem-solving—and correlations measured using these data may be misleading. It is arguably more straightforward to resolve the second issue, but in both cases, the researcher is well-advised to brainstorm the multiple ways a problem might be represented and then solved by different participants and adjust the problem statement to minimize the possibility of prompting inappropriate representations.
It is sometimes helpful to think about problem solving as consisting of two phases—representation and solution—and to consider these phases as cognitively distinct. Then, consider the cognitive effort required to form a mathematical and schematic representation of the problem versus the reduced cognitive effort needed for guess and check, for example. Participants need to be forced as much as possible into the cognitively challenging realm of the representation phase as many will avoid this if possible. Guess and check is one approach that can be used to avoid developing a schematic representation of the problem and if the problem can be easily solved through guess and check, then a relationship with spatial ability may not be revealed [13]. Yet, guess and check is a very attractive approach to many participants and is often a very sensible strategy to adopt, especially for fixed choice problems. We cannot tell if a participant adopted guess and check because they could not develop the correct representation. Reverse-engineering the solution by examining each of the answers in a fixed choice problem and working backwards may also be a way to avoid schematic representations. Another approach that can be attractive is plug and chug—put the numbers together in some way, maybe using an equation that is vaguely related to the topic, and see what happens. There are multiple ways for problems to be inappropriately represented and the challenge is to account for these when selecting and designing the set of problems.
It is also helpful to think of problem representation as requiring three types of knowledge [31]:
- linguistic, needed to transcribe statements that assign values to parameters or describe relations between parameters,
- semantic, needed to comprehend the context of the problem and
- schematic, needed to develop or select the correct mathematical schema for the problem.
According to this view, the representation phase is then followed by the solution phase which requires two further types of knowledge:
- procedural, needed to implement the correct mathematical procedures to solve the mathematical representation of the problem and
- strategic, needed to adopt the correct strategy and order of operations in the solution
Breaking it down like this allows a closer examination of potential problems that may arise during data collection in terms of the types of representation that will be formed and the prior knowledge required to solve the problem. Do not assume all participants possess the required semantic and procedural knowledge in particular. If many participants make errors converting from inches to feet, for example, then (i) success in the representation phase will decrease even if the participants have formed correct linguistic and schematic representations, and (ii) the number of correct answers will decrease. To mitigate inconsistencies in the data due to lack of prior knowledge, consider including another instrument to measure semantic and procedural knowledge levels. This instrument would consist of a set of simple questions, not more problems. For example, this knowledge check could include the following question: ‘Convert 31 inches to feet and inches’, or ‘What is the equation for the area of a circle?’. Data from this instrument can then be used to rule out errors due to a lack of prior knowledge rather than representation in the solutions provided by participants.
Relations between spatial ability and math are often hypothesized based on the overlap between the content of the spatial ability test and the content of the math topic with this content defined in terms of its spatial content—does the math topic describe a space or spatial relation? is an image included that must be manipulated or transformed? are the spatial characteristics embedded in the spatial test evident in the math problem? While these hypotheses are supported by the findings from this study—the correlation between spatial ability and geometry questions was the second highest of the five NCTM content strands and just below the highest—it is also contradicted to some extent as the lowest correlation was with algebra even though this topic includes spatial components.
In addition, findings from this study showed the presence or absence of a figure is not a determining factor in exposing a relationship between mathematics and spatial ability. We conclude the above hypotheses are not incorrect but too limited. Performance on a spatial test such as mental rotation also provides some indication of how participants will perform in solving problems that are not overtly spatial in nature and the reason for this lies in the type of thinking that occurs during the representation phase. Spatial ability appears to play a role in facilitating complete, error-free, schematic representations of different types of problems from different math content strands. Further research on how this happens among middle grade students is needed.
Author Contributions
Conceptualization, S.A.S. and G.D.; methodology, S.A.S.; validation, S.A.S., G.D. and S.Y.Y.; formal analysis, S.Y.Y.; investigation, S.A.S.; resources, S.A.S.; data curation, S.Y.Y.; writing—original draft preparation, S.A.S., G.D.; writing—review and editing, S.Y.Y.; supervision, S.A.S.; project administration, S.A.S.; funding acquisition, S.A.S. All authors have read and agreed to the published version of the manuscript.
Funding
This research was funded by the Department of Education in the U.S. through the Institute for Education Science. Grant number R305A170640.
Institutional Review Board Statement
This study was approved by the Institutional Review Board of the University of Cincinnati (Protocol 2017-4822, initial approval 24 October 2017).
Informed Consent Statement
This study involved the use of a passive parental (opt out) consent process.
Data Availability Statement
The data from this study will be made available in the future.
Acknowledgments
The authors gratefully acknowledge the IES for their support of this work through grant number R305A170640. The data presented in this paper was gathered during the course of this project. The PI of the project is Sheryl Sorby (University of Cincinnati) and coPIs are Logan Fiorella (University of Georgia) and David Uttal (Northwestern University). Other collaborators on the project include Norma Veurink, Jason Powers, Camille Msall, Vivian Wong, Kinnari Atit, Grace Panther, So Yoon Yoon and Kylie Anglin. The late Martha Carr was an early collaborator on the project and developer of several draft instruments described in this paper.
Conflicts of Interest
The authors declare no conflict of interest for this study.
Appendix A
- Wave 1 Final Mathematics Instrument
Do your best to solve the problems below. Thanks for helping!
- The cost to rent a boat is $10. There is also a charge of $2 for each person. Which expression represents the total cost to rent a boat for p persons?
- A.
- 10 + 2p
- B.
- 10 − 2p
- C.
- 2 + 10p
- D.
- 2 − 10p
Answer: ________ - Joan needs $60 for a class trip. She has $32. She can earn $4 an hour mowing lawns. If the equation shows this relationship, how many hours must Joan work to have the money she needs?4h + 32 = 60
- A.
- 7 h
- B.
- 17 h
- C.
- 23 h
- Study the pattern of triangles below.
![Education 12 00828 i001]() What triangle will continue the pattern?
What triangle will continue the pattern?- A.
![Education 12 00828 i002]()
- B.
![Education 12 00828 i003]()
- C.
![Education 12 00828 i004]()
- D.
![Education 12 00828 i005]()
Answer: ________ - Bill will make pancakes for 20 members of his Boy Scout troop He will use the pancake recipe that serves 4 people, shown in the table below. Complete the table to show the amount of each ingredient Bill will use to make pancakes to serve 20 people.
Ingredient Amount to Serve 4 People Amount to Serve 20 People Flour 1 ⅓ cups Sugar 2 ½ tablespoons Eggs 1 Melted butter 3 tablespoons Milk ¾ cup - Edgar drew the shape on his Spirit Day poster.
![Education 12 00828 i006]() What is the area of this shape? ________
What is the area of this shape? ________ - Carl has a stack of wood with the measurements shown below. He will cover the top and all 4 sides of the stack with a plastic sheet.
![Education 12 00828 i007]()


What is the total surface area the plastic sheet must cover? In the space below, show your work and write your answer on the line.
________ square feet
- Wave 2 Final Mathematics Instrument
- 1.
- Jeff wants to wrap ribbon around a package, as shown below. He also needs 10 more inches of ribbon to tie a bow.
![Education 12 00828 i008]() How much ribbon does he need to wrap the package and to tie the bow?
How much ribbon does he need to wrap the package and to tie the bow?- A.
- 34 inches
- B.
- 48 inches
- C.
- 50 inches
- D.
- 58 inches
Answer: ________ - 2.
- Joan needs $60 for a class trip. She has $32. She can earn $4 an hour mowing lawns. If the equation shows this relationship, how many hours must Joan work to have the money she needs?4h + 32 = 60
- A.
- 7 h
- B.
- 17 h
- C.
- 23 h
- D.
- 28 h
Answer: ________ - 3.
- The cost to rent a boat is $10. There is also a charge of $2 for each person. Which expression represents the total cost to rent a boat for p persons?
- A.
- 10 + 2p
- B.
- 10 − 2p
- C.
- 2 + 10p
- D.
- 2 − 10p
Answer: ________ - 4.
- Edgar drew the shape on his Spirit Day poster.
![Education 12 00828 i009]() What is the area of this shape?
What is the area of this shape?- A.
- 21 cm2
- B.
- 54 cm2
- C.
- 63 cm2
- D.
- 81 cm2
- 5.
- Carl has a stack of wood with the measurements shown below. He will cover the top and all 4 sides of the stack with a plastic sheet.
![Education 12 00828 i010]()


What is the total surface area the plastic sheet must cover? In the space below, show your work and write your answer on the line.
________ square feet
- 6.
- Madeline is setting up dominoes in a line, as shown below. Each domino requires 7/8 inch of space in the line.
![Education 12 00828 i011]()

Part A. The line of dominoes will be 348 inches long. A box of dominoes contains 28 dominoes. Estimate the number of boxes Madeline will need. In the space below, show your work and write your estimate on the line.
timate ________ Boxes
- 7.
- Which is bigger? This problem gives you the chance to take measurements from a scale drawing and calculate the circumference of a circle from the diameter.Below is a diagram showing a side view and a top view of a glass vase.Both views of the glass vase are drawn accurately and are ½ of the real size.
![Education 12 00828 i012]()

Your job is to find the height and the circumference of the real vase. Make sure that you show all of your work. You should make your measurements in centimeters.
Height of real vase _______________
Circumference of real vase ________
- Wave 3 Final Mathematics Instrument
Do your best to solve the problems below. Thanks for helping!
- 1.
- Mr. Craig made a scale drawing of his office.
![Education 12 00828 i013]() The width of the scale drawing of the office is 2 inches. What is the actual width, in feet, of Mr. Craig’s office?
The width of the scale drawing of the office is 2 inches. What is the actual width, in feet, of Mr. Craig’s office?- A.
- 3 ft
- B.
- 6 ft
- C.
- 9 ft
- D.
- 12 ft
- 2.
- Maria bought wood, paper, and string to make one kite. The list shows the amount and the unit cost of each item she bought.
- 12 square feet of paper at $1 per square foot
- 4 feet of wood at $3 per foot
- 14 yards of string at $2 per yard

Part A What was the total cost of the items Maria bought? Show all the steps you took to find your answer. Be sure to label your answer.
Part B Maria will make 4 more kites for her friends. Determine how much paper, wood, and string are needed and the total cost to make the 4 kites. Show all the steps you took to find your answer. Be sure to label your answer.
- 3.
- Jordan’s dog weighs p pounds. Emmett’s dog weights 25% more than Jordan’s dog. Which expressions represent the weight, in pounds, of Emmett’s dog? Select each correct answer.
- A.
- 0.25p
- B.
- 1.25p
- C.
- p + 0.25
- D.
- p + 1.25
- E.
- p + 0.25p
- 4.
- The graph shows the amount of protein contained in certain brand of peanut butter.
![Education 12 00828 i014]() Which statement describes the meaning of the point (6, 30) on the graph?
Which statement describes the meaning of the point (6, 30) on the graph?- A.
- There are 6 g of protein per tablespoon of peanut butter
- B.
- There are 30 g of protein per tablespoon of peanut butter
- C.
- There are 6 g of protein in 30 tablespoons of peanut butter
- D.
- There are 30 g of protein in 6 tablespoons of peanut butter
- 5.
- Which situation can be represented by the equation 1 ¼ x 6 = 7 ½?
- It took Calvin 1 ¼ hours to run 6 miles. He ran 7 ½ miles per hour
- Sara read for 1 ¼ hours every day for 6 days. She read for a total of 7 ½ hours
- Matthew addressed 1 ¼ envelopes in 6 min. He addressed 7 ½ envelopes per minute.
- It took Beth 1 ¼ minutes to paint 6 feet of a board. She painted a total of 7 ½ feet of the board.
- 6.
- The amount Troy charges to mow a lawn is proportional to the time it takes him to mow the lawn. Troy charges $30 to mow a lawn that took him 1.5 h to mow.Which equation models the amount of dollars, d, Troy charges when it takes him h hours to mow a lawn?
- A.
- d = 20h
- B.
- h = 20d
- C.
- d = 45h
- D.
- h = 45d
- 7.
- Angle PQR and angle TQV are vertical angles. The measure of the two angles have a sum of 100 degrees. Write and solve an equation to find x, the measure of angle TQV is ________ degrees.
![Education 12 00828 i015]() Put your equation and solution below.
Put your equation and solution below.


- Wave 4 Final Mathematics Instrument
- 1.
- This is the plan of the apartment that George’s parents want to purchase from a real estate agency.
![Education 12 00828 i016]()

To estimate the total floor area of the apartment (including the terrace and walls), you can measure the size of each room, calculate the area of each one and add all the areas together.
However, there is a more efficient method to estimate the total floor area where you only need to measure 4 lengths. Mark on the plan above the four lengths that are needed to estimate the total floor area of the apartment.
- 2.
- Here, you see a photograph of a farmhouse with a roof in the shape of a pyramid. Below is a student’s mathematical model of the farmhouse roof with measurements added.
![Education 12 00828 i017]() The attic floor, ABCD in the model, is a square. The beams that support the roof are the edges of a block (rectangular prism) EFGHKLMN. E is the middle of AT, F is the middle of BT, G is the middle of CT and H is the middle of DT. All the edges of the pyramid in the model have length 12 m.
The attic floor, ABCD in the model, is a square. The beams that support the roof are the edges of a block (rectangular prism) EFGHKLMN. E is the middle of AT, F is the middle of BT, G is the middle of CT and H is the middle of DT. All the edges of the pyramid in the model have length 12 m.![Education 12 00828 i018]() Part A: Calculate the area of the attic floor ABCD.The area of the attic floor ABCD = ________ m²Part B: Calculate the length of EF, one of the horizontal edges of the block.The length of EF = ________ m.
Part A: Calculate the area of the attic floor ABCD.The area of the attic floor ABCD = ________ m²Part B: Calculate the length of EF, one of the horizontal edges of the block.The length of EF = ________ m. - 3.
- On the right, there is a picture of two dice.Dice are special number cubes for which the following rule applies:
![Education 12 00828 i019]()


The total number of dots on two opposite faces is always seven.
You can make a simple number cube by cutting, folding, and gluing carboard. This can be done in many ways. In the figure below you can see three cuttings that can be used to make cubes, with dots on the sides.
Which of the following shapes can be folded together to form a cube that obeys the rule that the sum of opposite faces is 7? For each shape, circle either “Yes” or “No” in the table below.
![Education 12 00828 i020]()

| Shape | Obeys the Rule that the Sum of Opposite Faces is 7? |
| | | Yes/No |
| || | Yes/No |
| ||| | Yes/No |
- 4.
- SPEED OF RACING CARThis graph shows how the speed of a racing car varies along a flat 3 km track during its second lap.
![Education 12 00828 i021]() Part A: What is the approximate distance from the starting line to the beginning of the longest straight section of the track?
Part A: What is the approximate distance from the starting line to the beginning of the longest straight section of the track?- A.
- 0.5 km
- B.
- 1.5 km
- C.
- 2.3 km
- D.
- 2.6 km
Part B: Here are pictures of five tracks: Along which one of these tracks was the car driven to produce the speed graph shown above? Circle the correct answer.![Education 12 00828 i022]()
- 5.
- People living in an apartment building decide to buy the building. They will put their money together in such a way that each will pay an amount that is proportional to the size of their apartment.


For example, a man living in an apartment that occupies one fifth of the floor area of all apartments will pay one fifth of the total price of the building.
Part A:
Circle Correct or Incorrect for each of the following statements.
| Statement | Correct/Incorrect |
| A person living in the largest apartment will pay more money for each square meter of his apartment than the person living in the smallest apartment. | Correct/Incorrect |
| If we know the areas of two apartments and the price of one of them, we can calculate the price of the second. | Correct/Incorrect |
| If we know the price of the building and how much each owner will pay, then the total area of all apartments can be calculated. | Correct/Incorrect |
| If the total price of the building were reduced by 10%, each of the owners would pay 10% less. | Correct/Incorrect |
Part B:
There are three apartments in the building. The largest, apartment 1, has a total area of 95 m2. Apartments 2 and 3 have areas of 85 m2 and 70 m2, respectively. The selling price for the building is 300,000 zeds.
How much should the owner of apartment 2 pay? Show your work.
- 6.
- Susan likes to build blocks from small cubes like the one shown in the following diagram:

Susan has a lot of small cubes like this one. She uses glue to join cubes together to make other blocks.
First, Susan glues eight of the cubes together to make the block shown in Diagram A:

Then, Susan makes the solid blocks shown in Diagram B and Diagram C below:

Part A:
Susan realizes that she used more small cubes than she really needed to make a block like the one shown in Diagram C. She realizes that she could have glued small cubes together to look like Diagram C, but the block could have been hollow on the inside.
What is the minimum number of cubes she needs to make a block that looks like the one shown in Diagram C, but is hollow?
Answer: ________
Part B:
Now Susan wants to make a block that looks like a solid block that is 6 small cubes long, 5 small cubes wide, and 4 small cubes high. She wants to use the smallest number of cubes possible, by leaving the largest possible hollow space inside the block.
What is the minimum number of cubes Susan will need to make this block?
Answer: ________
References
- National Science Board. Preparing the Next Generation of Stem Innovators: Identifying and Developing our Nation’s Human Capital; National Science Foundation: Alexandria, VA, USA, 2010.
- Wai, J.; Lubinski, D.; Benbow, C.P. Spatial ability for STEM domains: Aligning over 50 years of cumulative psychological knowledge solidifies its importance. J. Educ. Psychol. 2009, 101, 817–835. [Google Scholar] [CrossRef]
- Shea, D.L.; Lubinski, D.; Benbow, C.P. Importance of assessing spatial ability in intellectually talented young adolescents: A 20-year longitudinal study. J. Educ. Psychol. 2001, 93, 604. [Google Scholar] [CrossRef]
- Smith, I.M. Spatial Ability: Its Educational and Social Significance; University of London Press Ltd.: London, UK, 1964. [Google Scholar]
- Kell, H.J.; Lubinski, D.; Benbow, C.P.; Steiger, J.H. Creativity and technical innovation: Spatial ability’s unique role. Psychol. Sci. 2013, 24, 1831–1836. [Google Scholar] [CrossRef] [PubMed] [Green Version]
- Jones, S.; Burnett, G. Spatial ability and learning to program. Hum. Technol. Interdiscip. J. Hum. ICT Environ. 2008, 4. [Google Scholar] [CrossRef]
- Mix, K.S.; Cheng, Y.-L. Chapter 6—The Relation Between Space and Math: Developmental and Educational Implications. In Advances in Child Development and Behavior; Benson, J.B., Ed.; JAI Academic Press: San Diego, CA, USA, 2012; Volume 42, pp. 197–243. [Google Scholar] [CrossRef]
- Hawes, Z.; Ansari, D. What explains the relationship between spatial and mathematical skills? A review of evidence from brain and behavior . Psychon. Bull. Rev. 2020, 27, 465–482. [Google Scholar] [CrossRef] [PubMed]
- van Garderen, D. Spatial Visualization, Visual Imagery, and Mathematical Problem Solving of Students with Varying Abilities. J. Learn. Disabil. 2006, 39, 496–506. [Google Scholar] [CrossRef] [PubMed]
- Casey, M.B.; Nuttall, R.L.; Pezaris, E. Spatial-Mechanical Reasoning Skills versus Mathematics Self-Confidence as Mediators of Gender Differences on Mathematics Subtests Using Cross-National Gender-Based Items. J. Res. Math. Educ. 2001, 32, 28. [Google Scholar] [CrossRef]
- Verdine, B.N.; Golinkoff, R.M.; Hirsh-Pasek, K.; Newcombe, N.S.; Filipowicz, A.T.; Chang, A. Deconstructing Building Blocks: Preschoolers’ Spatial Assembly Performance Relates to Early Mathematical Skills. Child Dev. 2013, 85, 1062–1076. [Google Scholar] [CrossRef] [PubMed] [Green Version]
- Hegarty, M.; Kozhevnikov, M. Types of visual–spatial representations and mathematical problem solving. J. Educ. Psychol. 1999, 91, 684–689. [Google Scholar] [CrossRef]
- Duffy, G.; Sorby, S.; Bowe, B. Spatial ability is a key cognitive factor in the representation of word problems in mathematics among engineering students. J. Eng. Educ. 2020, 109, 424–442. [Google Scholar] [CrossRef]
- Judd, N.; Klingberg, T. Training spatial cognition enhances mathematical learning in a randomized study of 17,000 children. Nat. Hum. Behav. 2021, 5, 1548–1554. [Google Scholar] [CrossRef] [PubMed]
- Bulunuz, N.; Jarrett, O.S. The Effects of Hands-on Learning Stations on Building American Elementary Teachers’ Understanding about Earth and Space Science Concepts. Eurasia J. Math. Sci. Technol. Educ. 2010, 6, 85–99. [Google Scholar] [CrossRef]
- Harmer, A.J.; Columba, L. Engaging Middle School Students in Nanoscale Science, Nanotechnology, and Electron Microscopy. J. Nano Educ. 2010, 2, 91–101. [Google Scholar] [CrossRef]
- Lanzilotti, R.; Montinaro, F.; Ardito, C. Influence of Students’ Motivation on Their Experience with E-Learning Systems: An Experimental Study. In Proceedings of the International Conference on Universal Access in Human-Computer Interaction, San Diego, CA, USA, 2 July 2009; pp. 63–72. [Google Scholar] [CrossRef]
- Tai, R.H.; Liu, C.Q.; Maltese, A.V.; Fan, X. Planning Early for Careers in Science. Science 2006, 312, 1143–1144. [Google Scholar] [CrossRef] [PubMed] [Green Version]
- Microsoft. Why Europe’s Girls Aren’t Studying STEM. 2017. Available online: https://news.microsoft.com/uploads/2017/03/ms_stem_whitepaper.pdf (accessed on 6 October 2018).
- Bowe, B.; Harding, R.; Hedderman, T.; Sorby, S. A National Spatial Skills Research & Development Project. In Proceedings of the 36th International Pupils’ Attitudes towards Technology Conference, Westmeath, Ireland, 18–21 June 2018; p. 333. [Google Scholar]
- Xie, F.; Zhang, L.; Chen, X.; Xin, Z. Is Spatial Ability Related to Mathematical Ability: A Meta-analysis. Educ. Psychol. Rev. 2019, 32, 113–155. [Google Scholar] [CrossRef]
- Uttal, D.H.; Meadow, N.G.; Tipton, E.; Hand, L.L.; Alden, A.R.; Warren, C.; Newcombe, N.S. The malleability of spatial skills: A meta-analysis of training studies. Psychol. Bull. 2013, 139, 352–402. [Google Scholar] [CrossRef] [PubMed] [Green Version]
- NCTM. Principles and Standards for School Mathematics; National Council of Teachers of Mathematics: Reston, VA, USA, 2000; Volume 1. [Google Scholar]
- Guay, R.B. Purdue Spatial Visualization Test; Purdue Research Foundation: West Lafayette, IN, USA, 1976. [Google Scholar]
- Bennett, G.K.; Seashore, H.G.; Wesman, A.G. Differential Aptitude Tests: Forms S and T: Psychological Corporation; The Psychological Corporation: New York, NY, USA, 1973. [Google Scholar]
- Muthén, L.K.; Muthén, B.O. Mplus User’s Guide, 8th ed.; Muthén & Muthén: Los Angeles, CA, USA, 2017. [Google Scholar]
- Brown, T.A. Confirmatory Factor Analysis for Applied Research, 2nd ed.; Guilford Press: New York, NY, USA, 2015. [Google Scholar]
- George, D.; Mallery, P. SPSS for Windows Step by Step: A Simple Guide and Reference, 11.0 Update, 4th ed.; Allyn & Bacon: Boston, MA, USA, 2003. [Google Scholar]
- Gliem, J.A.; Gliem, R.R. Calculating, interpreting, and reporting Cronbach’s alpha reliability coefficient for Likert-type scales. In Proceedings of the 2003 Midwest Research-to-Practice Conference in Adult, Continuing and Community Education, Columbus, OH, USA, 8–10 October 2003. [Google Scholar]
- Cheng, Y.-L.; Mix, K.S. Spatial Training Improves Children’s Mathematics Ability. J. Cogn. Dev. 2013, 15, 2–11. [Google Scholar] [CrossRef]
- Mayer, R.E. Thinking, Problem Solving, Cognition; W.H. Freeman: New York, NY, USA, 1992. [Google Scholar]
Figure 1.
Figure from the Stack of Logs Problem.

Figure 2.
Triangles Problem from Wave 1 Testing.

Figure 3.
Problem #4 (Pancakes problem) from Wave 1 Instrument.

Figure 4.
Spirit Day Poster Problems Modified from Wave 1 for use in Wave 2.

Figure 5.
The Dominoes Problem from Wave 2 Testing.

Figure 6.
The Dice Problem from Wave 4 Testing.


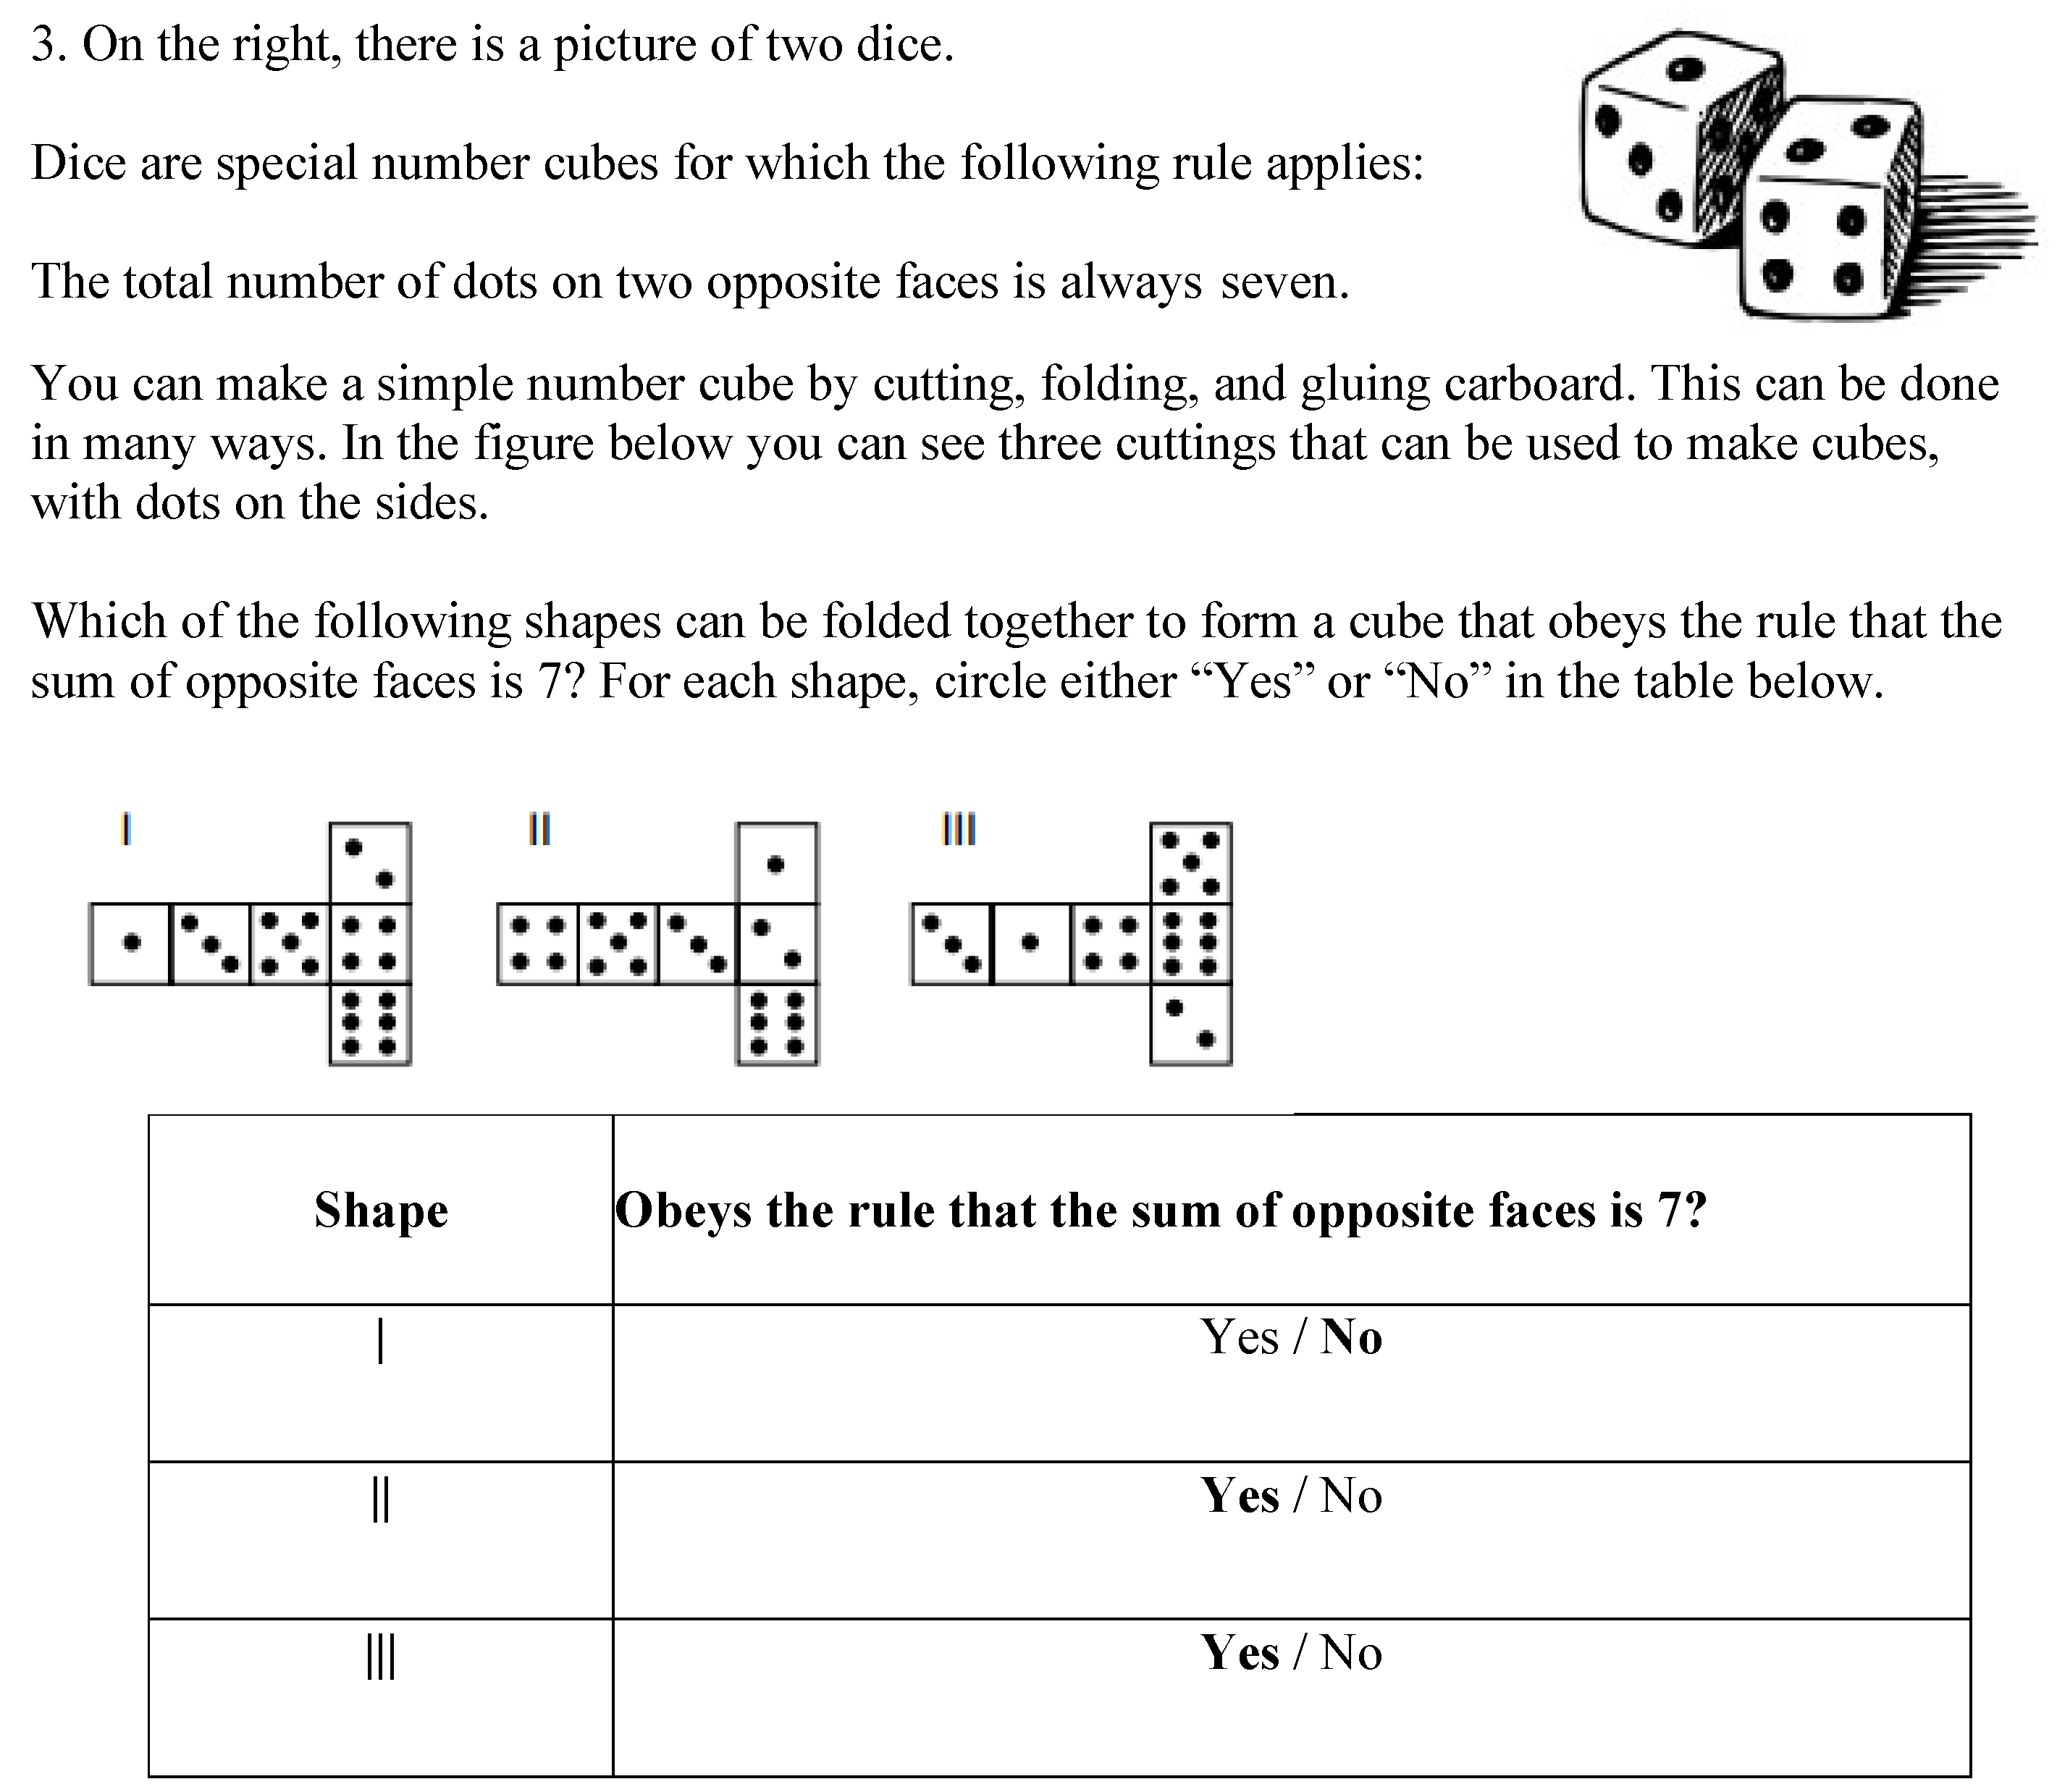
Table 1.
Student Cohorts.
| Cohort | 2015–16 | 2016–17 | 2017–18 | 2018–19 | 2019–20 |
|---|---|---|---|---|---|
| Baseline (1) | 7th Grade | 8th Grade | 9th Grade | ||
| Cohort 2 | 7th Grade | 8th Grade | 9th Grade | ||
| Cohort 3 | 7th Grade | 8th Grade | 9th Grade | ||
| Cohort 4 | 7th Grade | 8th Grade | |||
| Cohort 5 | 7th Grade |
Table 2.
Sample size for each testing wave.
| Wave 1 | Wave 2 | Wave 3 | Wave 4 | |
|---|---|---|---|---|
| Sample Size | 3217 | 3823 | 2417 | 1031 |
Table 3.
Internal Consistency Reliability Evidence of the Spatial Tests.
| Wave | Grade | DAT:SR | PSVT:R | DAT:SR + PSVT:R | Correlation | |||
|---|---|---|---|---|---|---|---|---|
| n | Cronbach’s α | n | Cronbach’s α | n | Cronbach’s α | R | ||
| 1 | 7 | 1691 | 0.550 | 1775 | 0.579 | 1579 | 0.690 | 0.405 * |
| 2 | 7 | 2505 | 0.619 | 2608 | 0.645 | 2388 | 0.743 | 0.452 * |
| 3 | 8 | 2274 | 0.667 | 2315 | 0.675 | 2180 | 0.778 | 0.482 * |
| 4 | 9 | 1469 | 0.712 | 1482 | 0.688 | 1427 | 0.806 | 0.610 * |
Note. * p < 0.01.
Table 4.
Correlations of Draft and Final Math Instruments with Spatial Ability tests.
| Draft Instrument (Cohort 1) | Final Instrument (Cohorts 2–5) | |||||
|---|---|---|---|---|---|---|
| n | Average Score (% correct) | Correlation with Spatial Test | n | Average Score (% correct) | Correlation with Spatial Test | |
| Wave 1 | 1164 | 13.6 | 0.277 * | 2053 | 49.7 | 0.443 * |
| Wave 2 | 1901 | 37.3 | 0.370 * | 1918 | 47.9 | 0.482 * |
| Wave 3 | 1420 | 53.6 | 0.518 * | 997 | 58.0 | 0.541 * |
| Wave 4 | 693 | 45.7 | 0.485 * | 338 | 44.4 | 0.623 * |
Note. * p < 0.01.
Table 5.
Individual Item Analysis for the Wave 1 Instrument (valid sample size, n = 2053).
| Problem | Figure Y/N | Fixed Choice (FC) or Open Ended (OE) | NCTM Category | Item Difficulty | Item Discrimination | Correlation with Spatial |
|---|---|---|---|---|---|---|
| Cost of Boat Rental | N | FC | Algebra | 0.910 | 0.359 | 0.138 * |
| Earning Money for a Class Trip | N | FC | Algebra | 0.670 | 0.606 | 0.265 * |
| 2-D Rotation of Triangle-Pattern Recognition | Y | FC | Algebra | 0.440 | 0.456 | 0.085 * |
| Quantity of Ingredients for Pancakes | N | OE | Number | 0.411 | 0.688 | 0.424 * |
| T-shaped Spirit Day Poster | Y | OE | Measure | 0.190 | 0.580 | 0.393 * |
| Cover for Stack of Logs | Y | OE | Measure | 0.430 | 0.533 | 0.174 * |
Note. * p < 0.01.
Table 6.
Individual Item Analysis for the Wave 2 Instrument (valid sample size, n = 1922).
| Problem | Figure Y/N | Fixed Choice (FC) or Open Ended (OE) | NCTM Category | Item Difficulty | Item Discrimination | Correlation with Spatial |
|---|---|---|---|---|---|---|
| Ribbon to Wrap Package | Y | FC | Measure & Geometry | 0.200 | 0.481 | 0.270 * |
| Earning Money for a Class Trip | N | FC | Algebra | 0.770 | 0.562 | 0.282 * |
| Cost of Boat Rental | N | FC | Algebra | 0.870 | 0.489 | 0.218 * |
| I-shaped Spirit Day Poster | Y | FC | Measure | 0.430 | 0.578 | 0.323 * |
| Cover for Stack of Logs | Y | OE | Measure | 0.430 | 0.512 | 0.181 * |
| Falling Dominoes | Y | OE | Number | 0.470 | 0.509 | 0.165 * |
| Height and Circumference of Vase | Y | OE | Measure | 0.252 | 0.559 | 0.372 * |
Note. * p < 0.01.
Table 7.
Individual Item Analysis for the Wave 3 Instrument (valid sample size, n = 997).
| Problem | Figure Y/N | Fixed Choice (FC) or Open Ended (OE) | NCTM Category | Item Difficulty | Item Discrimination | Correlation with Spatial |
|---|---|---|---|---|---|---|
| Scale Drawing of Office | Y | FC | Measure & Number | 0.770 | 0.549 | 0.303 * |
| Wood, String, and Paper to make one Kite (Part A) | N | OE | Number | 0.80 | 0.521 | 0.272 * |
| Wood, String, and Paper to make four Kites (Part B) | N | OE | Number | 0.543 | 0.601 | 0.312 * |
| Comparing Weights of Dogs | N | FC | Algebra | 0.250 | 0.437 | 0.268 * |
| Interpreting Graph of Protein in Peanut Butter | Y | FC | Analysis & Probability | 0.800 | 0.621 | 0.345 * |
| Interpreting Algebraic Equation | N | FC | Algebra | 0.640 | 0.589 | 0.297 * |
| Charging for Lawn Mowing | N | FC | Algebra | 0.480 | 0.514 | 0.247 * |
| Vertical Angles PQR and TQV | Y | OE | Geometry | 0.380 | 0.611 | 0.399 * |
Note. * p < 0.01.
Table 8.
Individual Item Analysis for the Wave 4 Instrument (valid sample size, n = 338).
| Problem | Figure Y/N | Fixed Choice (FC) or Open Ended (OE) | NCTM Category | Item Difficulty | Item Discrimination | Correlation with Spatial |
|---|---|---|---|---|---|---|
| Dimensions on Apartment | Y | OE | Measure | 0.400 | 0.475 | 0.255 * |
| Pyramid-shaped Roof Part A | Y | OE | Measure | 0.380 | 0.608 | 0.417 * |
| Pyramid-shaped Roof Part B | Y | OE | Measure | 0.580 | 0.393 | 0.285 * |
| Dice Pattern I | Y | FC-2 | Geometry | 0.710 | 0.498 | 0.295 * |
| Dice Pattern II | Y | FC | Geometry | 0.760 | 0.490 | 0.331 * |
| Dice Pattern III | Y | FC | Geometry | 0.770 | 0.411 | 0.259 * |
| Interpreting Speed of Car Graph | Y | FC | Analysis & Probability | 0.640 | 0.421 | 0.333 * |
| Identifying the Shape of Race Track | Y | FC | Analysis & Probability | 0.260 | 0.442 | 0.384 * |
| Cost of Apartment I | N | FC | Number | 0.340 | 0.424 | 0.280 * |
| Cost of Apartment II | N | FC | Number | 0.690 | 0.454 | 0.263 * |
| Cost of Apartment III | N | FC | Number | 0.410 | 0.246 | 0.049 (N.S.) |
| Cost of Apartment IV | N | FC | Number | 0.500 | 0.193 | 0.000 (N.S.) |
| Open-ended Cost of Apartment Calculation | N | OE | Number | 0.160 | 0.581 | 0.429 * |
| Number of Small Cubes for 3 × 3 × 3 Cube with Missing Center | Y | OE | Measure & Geometry | 0.190 | 0.514 | 0.403 * |
| Number of Small Cubes for 6 × 5 × 4 Cube with Missing Center | Y | OE | Measure & Geometry | 0.080 | 0.460 | 0.341 * |
Note. * p < 0.01; N.S. = Non-significant.
Table 9.
Characteristics of Spatial Math Problems by the NCTM Content Strand.
| Algebra | Number | Measurement | Analysis and Probability | Geometry | |
|---|---|---|---|---|---|
| No. of problems * | 8 | 10 | 12 | 3 | 7 |
| Mean Item difficulty | 0.63 | 0.48 | 0.36 | 0.57 | 0.64 |
| Mean Correlation with Spatial test | 0.22 | 0.25 | 0.31 | 0.35 | 0.34 |
* Note that some problems fit within two categories.
Table 10.
Confirmatory Factor Analysis (CFA) Models with Goodness-of-Fit Indexes and Reliability Evidence.
Table 10.
Confirmatory Factor Analysis (CFA) Models with Goodness-of-Fit Indexes and Reliability Evidence.
| Wave 1 | Wave 2 | Wave 3 | Wave 4 | |||||
|---|---|---|---|---|---|---|---|---|
| EFA | CFA | EFA | CFA | EFA | CFA | EFA | CFA | |
| n | 1383 | 1383 | 1263 | 1263 | 795 | 794 | 377 | 376 |
| No. of Items | 6 | 4 | 7 | 6 | 8 | 8 | 15 | 13 |
| a Q1 | 0.457 * | 0.400 * | 0.496 * | 0.519 * | 0.625 * | 0.655 * | 0.483 * | 0.499 * |
| Q2 | 0.653 * | 0.658 * | 0.666 * | 0.648 * | 0.412 * | 0.408 * | 0.710 * | 0.723 * |
| Q3 | 0.178 * | 0.696 * | 0.691 * | 0.535 * | 0.541 * | 0.398 * | 0.393 * | |
| Q4 | 0.742 * | 0.754 * | 0.500 * | 0.495 * | 0.429 * | 0.403 * | 0.703 * | 0.730 * |
| Q5 | 0.800 * | 0.765 * | 0.377 * | 0.786 * | 0.762 * | 0.775 * | 0.790 * | |
| Q6 | 0.316 * | 0.409 * | 0.410 * | 0.581 * | 0.590 * | 0.550 * | 0.530 * | |
| Q7 | 0.568 * | 0.580 * | 0.475 * | 0.432 * | 0.379 * | 0.355 * | ||
| Q8 | 0.563 * | 0.585 * | 0.494 * | 0.506 * | ||||
| Q9 | 0.430 * | 0.445 * | ||||||
| Q10 | 0.446 * | 0.334 * | ||||||
| Q11 | 0.007 | |||||||
| Q12 | −0.063 | |||||||
| Q13 | 0.737 * | 0.944 * | ||||||
| Q14 | 0.691 * | 0.640 * | ||||||
| Q15 | 0.792 * | 0.755 * | ||||||
| Fit Index | ||||||||
| Chi-square | 2.467 | 33.084 | 61.075 | 142.498 | ||||
| df | 2 | 9 | 20 | 65 | ||||
| p | 0.291 | 0.0001 | <0.001 | <0.001 | ||||
| RMSEA | 0.013 | 0.046 | 0.051 | 0.056 | ||||
| 90% CI | 0.000, 0.057 | 0.030, 0.063 | 0.040, 0.066 | 0.044, 0.069 | ||||
| CFI | 0.999 | 0.957 | 0.925 | 0.924 | ||||
| TLI | 0.996 | 0.928 | 0.895 | 0.909 | ||||
| SRMR | 0.021 | 0.049 | 0.056 | 0.090 | ||||
| Cronbach’s α | 0.572 | 0.537 | 0.681 | 0.727 | ||||
Note. * p < 0.05; EFA = exploratory factor analysis; a Questions are numbered in order appeared on the spatial math instruments for factor analyses; CFA = confirmatory factor analysis; RMSEA = root-mean-square error of approximation; CI = confidence interval; CFI = comparative fit index; TLI = Tucker–Lewis index; SRMR = standardized root mean square residual.
Table 11.
Item Characteristics by Types of Problems: Figures versus No Figures.
| Item Characteristics | No Figure | Figure | Independent t-Test | Effect Size | ||||||
|---|---|---|---|---|---|---|---|---|---|---|
| n | M | SD | n | M | SD | t | df | p | Hedges’ g | |
| Item Difficulty | 15 | 0.56 | 0.23 | 21 | 0.45 | 0.22 | 1.47 | 34 | 0.151 | 0.486 |
| Item Discrimination | 15 | 0.48 | 0.14 | 21 | 0.51 | 0.07 | –0.66 | 18.8 | 0.517 | –0.493 |
| Correlation with Spatial | 15 | 0.25 | 0.12 | 21 | 0.30 | 0.09 | –1.49 | 34 | 0.145 | –0.243 |
Table 12.
Item Characteristics by Types of Problems: Open-ended versus Fixed-choice.
| Item Characteristics | Open-Ended | Fixed-Choice | Independent t-Test | Effect Size | ||||||
|---|---|---|---|---|---|---|---|---|---|---|
| n | M | SD | n | M | SD | t | df | p | Hedges’ g | |
| Item Difficulty | 16 | 0.38 | 0.18 | 20 | 0.59 | 0.22 | −3.18 | 34 | 0.003 | −1.042 |
| Item Discrimination | 16 | 0.55 | 0.07 | 20 | 0.46 | 0.11 | 2.65 | 34 | 0.012 | 0.869 |
| Correlation with Spatial | 16 | 0.32 | 0.09 | 20 | 0.25 | 0.10 | 2.33 | 34 | 0.026 | 0.765 |
Publisher’s Note: MDPI stays neutral with regard to jurisdictional claims in published maps and institutional affiliations. |
© 2022 by the authors. Licensee MDPI, Basel, Switzerland. This article is an open access article distributed under the terms and conditions of the Creative Commons Attribution (CC BY) license (https://creativecommons.org/licenses/by/4.0/).
Share and Cite
MDPI and ACS Style
Sorby, S.A.; Duffy, G.; Yoon, S.Y. Math Instrument Development for Examining the Relationship between Spatial and Mathematical Problem-Solving Skills. Educ. Sci. 2022, 12, 828. https://doi.org/10.3390/educsci12110828
AMA Style
Sorby SA, Duffy G, Yoon SY. Math Instrument Development for Examining the Relationship between Spatial and Mathematical Problem-Solving Skills. Education Sciences. 2022; 12(11):828. https://doi.org/10.3390/educsci12110828
Chicago/Turabian StyleSorby, Sheryl Ann, Gavin Duffy, and So Yoon Yoon. 2022. "Math Instrument Development for Examining the Relationship between Spatial and Mathematical Problem-Solving Skills" Education Sciences 12, no. 11: 828. https://doi.org/10.3390/educsci12110828
Note that from the first issue of 2016, this journal uses article numbers instead of page numbers. See further details here.