Article

Assessing Teachers’ Capabilities to Work with Models and Evaluate Results in the Context of a Complex and Authentic STEM Problem

Department of Computer Science, University of Wuerzburg, 97074 Würzburg, Germany
*
Author to whom correspondence should be addressed.
Educ. Sci. 2024, 14(1), 104; https://doi.org/10.3390/educsci14010104
Submission received: 26 October 2023 / Revised: 13 December 2023 / Accepted: 8 January 2024 / Published: 17 January 2024
(This article belongs to the Special Issue Methodological Issues in STE(A)M Education)

Abstract

:
Since the practice turn, the contemporary education landscape has been shifting from mere knowledge dissemination to empowering students to solve problems. Special emphasis is given to problems on which students work for an extended period (at least several hours; frequently multiple school days). While working on such problems, it is essential to employ a variety of activities. Two of these are working with models and evaluating models and their results. One topic that has received little attention up to now is the question of to what extent educators are able to apply these skills. This study, fundamentally exploratory in nature, seeks to delve into such an assessment by evaluating the competence of n = 20 educators in estimating and evaluating building evacuation duration using digital simulations. Our results show that the participants self-assessed as being able to solve such exercises. However, this was contrasted by our external assessment of the solutions provided by the participants, which showed that the solutions lacked in quality.

1. Introduction

The practice turn [1] describes a shift in modern educational paradigms, especially in regard to two core aspects. The first is the shift from teacher-centered to student-centered instructions [2,3], and the second is a change in focus, from teaching factual knowledge “to helping students figure out phenomena and design solutions to problems” [4]. To implement these new paradigms in practice, a multitude of approaches have been proposed in recent years. These include, among others, scenario-based education [5,6,7], situated learning [8,9], complex and authentic modelling [10,11], problem-based learning [12,13], and simulation-based-learning [14,15].
A unifying factor between all of these approaches is the fact that students typically work on problems for an extended period of time—at least hours, frequently multiple days. Thus, the corresponding exercises form a “sharp contrast to many other modelling activities common at school” [11] and that are (currently) often only included in regular school lessons that follow a 45-minute format. Instead, where already implemented, other formats are used. These include so-called modeling weeks in Germany, project days in (some) schools focusing on solving a single problem (c.f. [11,16]), or teaching–learning-labs at universities (c.f. [17,18]). We call these complex and authentic problems, based on two key characteristics that are frequently demanded for problems in such an educational context.
Based on the assumption that the implementation of such approaches into regular school education is indeed desirable, one has to ask whether current educators are equipped to teach in such settings. As such, the central goal of this paper was an exploratory analysis of educators’ abilities to work with problems that could be used in such a setting—a necessary prerequisite to be able to teach with them (c.f. [19]). More precisely, we focus our qualitative evaluation on two activities that are crucial for any problem-solving process: working with models, and evaluating models and the results achieved using them. Additionally, we analyzed whether the self-assessment of the educators regarding being able to solve such exercises was aligned with our external assessment.
We approached this measurement with an evaluative qualitative analysis of n = 20 educators tasked to solve a problem we posed. Our results indicated that, while our participants indeed generally felt able to solve such problems and teach with them, they nevertheless achieved low evaluation scores for both activities.

2. Educational Background

There are many different problems that have been proposed for the approaches listed previously. For example, twenty published examples recommended for complex and authentic modelling are presented in (p. 291, [11]).
In this section, we first describe STEM problems and teaching about problem-solving in general. Then, we explore two characteristics that are frequently demanded of problems in the described context: complexity and authenticity. Lastly, we outline the two activities chosen for this evaluation that are crucial for approaching any such problem: working with models, and evaluating models and the results achieved using them. Lastly, we introduce the SOLO taxonomy we use later to assess the quality of the argumentation used in the evaluation.

2.1. Problem-Solving in STEM Education

Problems in education are defined as “tasks that cannot be solved by direct effort” [20], emphasizing the necessity for strategic and structured approaches to finding solutions [21].
For STEM problems, a common distinction is made in regard to the relevance of each of the individual STEM subjects to the problem stated [22]. In an integrated approach, “[a]ll four disciplines are combined equally in a real-world problem” [23]. Contrary to that, in a separate approach, “each discipline is taught separately as an independent subject, with little or no integration” [23]. The problem chosen for this work uses a semi-integrated approaches. More precisely, our problem emphasizes only two of the STEM subjects (mathematics and technology), rather than all of them. Notably, while this approach is common, it is not without criticisms (c.f. [22,23,24]).

2.1.1. Teaching Problem-Solving

Teachers are required to possess a multifaceted range of knowledge and skills, some of which were identified in a literature review: to teach problem-solving, one needs knowledge of problems, problem-solving, problem posing, students as problem solvers, problem-solving instructions, and affective factors and beliefs [25]. Out of those, in-depth understanding and firsthand experience in problem-solving are pivotal for effectively imparting these skills to students, as teachers should “experience mathematical problem-solving from the perspective of the problem solver before they can adequately deal with its teaching” [19].
Notably, prior research has already identified difficulties teachers encounter in problem-solving, including an “inability to successfully relate the solutions to real life”, a “lack of flexibility in choice of problem-solving approaches”, an “inflexibility in their choice or management of problem-solving strategies”, and “a lack of strategies for interpreting the information given to them in word problems and for recognising the appropriate procedure to use” (c.f. [25] for more comprehensive list).
However, most of the prior research focused either on smaller-scale problems or modelling tasks (e.g., [26,27,28]), or on relative gains from interventions (e.g., [29,30,31]), rather than an overall assessment of the level of competence shown by educators working on such larger-scale problems as described earlier.
Such a limited analysis of problem-solving activities is problematic, as “[problem-solving] proficiency is not a one-dimensional concept and cannot be achieved by focusing on just one or two of the factors that define it” [25]. As such, assessment of the many different sub-activities necessary for problem-solving is desirable for a comprehensive picture of the abilities of certain groups to solve problems. Such assessments of teachers’ capabilities are especially important, as “assessment of mathematics teachers’ knowledge [is] one of the most important parameters of the quality of mathematics teaching in school” [32].
Notably, as teachers must decide which limited aspects of the problem should be simplified in order to be suitable for the target audience, their problem-solving proficiency needs to be higher for teaching problem-solving than for solving problems themselves. Furthermore, “the teacher needs to have a broad and deep understanding of the diversity of approaches that students might take. Trying to quickly grasp the mathematics [...] while simultaneously devising appropriate responses, is not an easy task for the teacher. The difficulties in doing this should not be underestimated” [33].

2.1.2. Complex Problems

Complex problems are characterized by five key properties: the large numbers of variables describing the situation, interdependence among these variables, unknown variables and goals, changes in the situation under consideration, and the presence of multiple (possibly conflicting) goals [34]. Notably, the last two properties are only frequently associated with complex problems, but are not a necessary ingredient for them [34]. However, in education where problems are artificially introduced by the teacher, they do not naturally change over time or possess multiple antagonistic goals. As solving complex problems already entails sufficient difficulties (c.f. [35]), the problem we pose will not have these two properties. The importance of solving complex problems is underscored by their critical role in the 21st-century workplace [36], and solving them is frequently considered one of the most important 21st century skills (e.g., [37,38,39,40,41]).

2.1.3. Authenticity in STEM Education

Many authors have highlighted the significance of authenticity in STEM education (e.g., [10,42,43,44]), where the use of real-world contexts is crucial to contextualize learning and spur student engagement [45]. In fact, some even argue that “authenticity must be viewed as a cornerstone of STEM literacy problems” [46].
Authenticity, although a prevalent concept, varies in interpretation: “[T]he uses vary greatly from referring to externally defined practices to student relevance” [47]. Generally, authenticity refers to an “alignment of student learning experiences with the world for which they are being prepared for” [10]. However, more precisely, eight different ways of using the term have been identified [48].
One usage refers to authentic problems that should “be grounded in the world of the students” [47]. This emphasizes the importance of sense-making, i.e., the ability of students “to make sense of the phenomena they encounter and understand the relationships among them, to have a working knowledge of the world beyond the horizon of their own limited experience” [49]. As such, authentic problems “shall articulate the relevance of mathematics in daily life, environment and sciences and impart competencies to apply mathematics in daily life, environment and sciences” [11].
Another usage focuses on authentic activities: activities performed by students that “have real world relevance” [44]. Such activities can be “comparable with practices of professional scientists” [47], “comparable with non-professional citizen practices” [47], or “relevant and real to workplace situations” [50].
Empirically, authenticity has been shown to have the potential to enable desirable educational outcomes [51], including increases in motivation [52,53,54] and task performance [52,54,55], as well as improved collaboration [56].

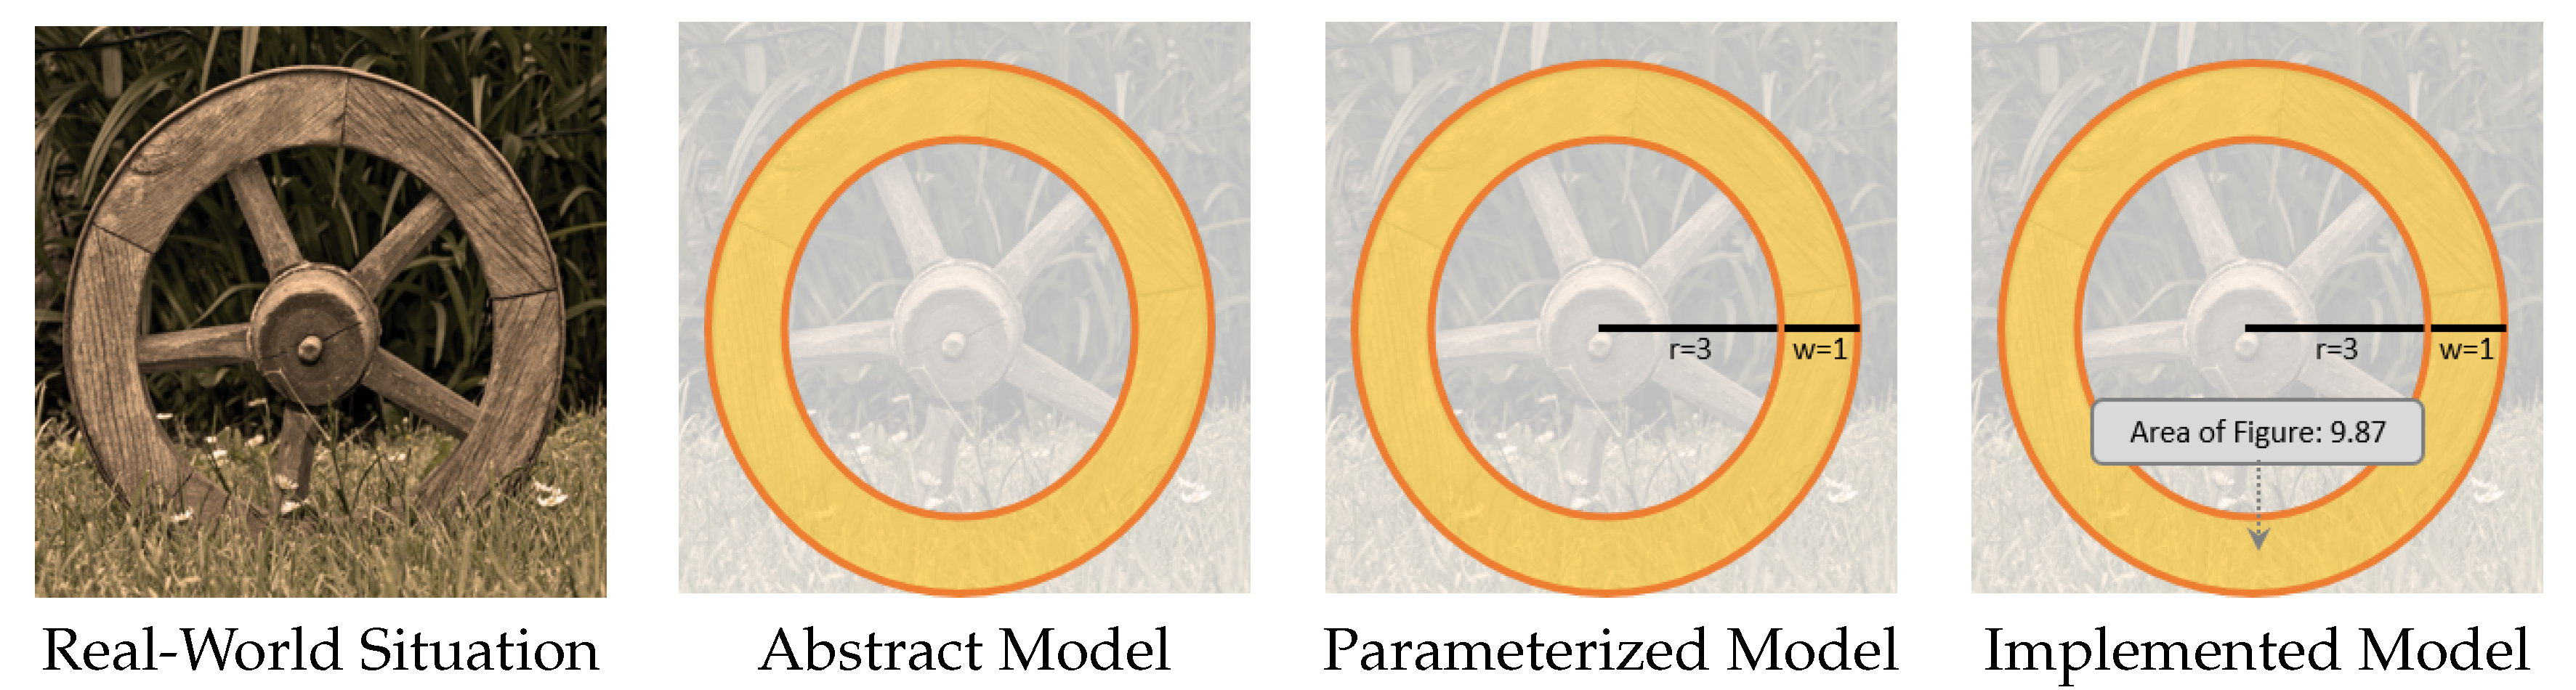
2.2. Models and Working with Models in Problem-Solving

Models play a central role in STEM problem-solving (c.f. [21,57,58]). Their significance is notably underscored in steps five (building models), seven (using models, computing), and eight (generative data, potentially with a simulation) of the problem-solving process presented in [13].

2.2.1. Defining Models and Their Common Properties

In the context of our research, a model is defined as a simplified, conceptual representation of a system in the real world; their description frequently utilizes images, numbers, formulas, programs, and their interrelationships [58].
To enhance clarity, this article introduces an expansive use of the term model, distinguishing among abstract, parameterized, and implemented models—as illustrated in Figure 1: To enable a mathematical approach to a problem, a real-world problem (e.g., estimating the time to evacuate a building) can be modelled using an abstract model (e.g., a grid automaton). This abstract model can then be applied to a specific real-world situation (e.g., estimating the time to evacuate a given sports hall) by selecting a suitable parameter (e.g., two cells for the width of the hallway in this sports hall), leading to a parameterized model. In practice, the calculations of a model are frequently automated with technology. In this case, the abstract and parameterized model have to be implemented using technology, leading to an implemented model. This distinction is especially important when discrepancies arise between parameterized and implemented models due to implementation errors.
The transition from real-world scenarios to any model type is termed model-building [59], encompassing activities like simplifying and structuring a situation to construct a model. The finished model should “on the one hand still contain essential features of the original situation, but is on the other hand already so schematized that (if at all possible) it allows for an approach with mathematical means” [60]. Models can be used to “provide information (or predictions) on some characteristics of [the model] which are not explicitly stated during its elaboration” [61] (predictive models). The extent to which a model can generate novel insights is termed its utility [61], with its usability being a measure of the effort needed to glean these insights [62]. However, other types of model exist: “descriptive models are also ubiquitous in science education materials” [63] and explanatory models are central to science research [63].

2.2.2. Selection of Models

The necessity for models to be self-consistent [61] does not preclude the use of different models to represent the same situation. This variability can be used to fulfill different goals of a model [64] but also necessitates a conscious selection and subsequent evaluation of a chosen model and its parameters: “models may select different features of the object, because there is a different evaluation of what characterizes the object, or because there are distinct aspects of the object which deserve modeling” [61].
Notably, the predictions of different models can contradict each other, highlighting the relevance of model evaluation. Additionally, within classroom settings, teachers should not only be adept at solving problems with one model but should guide students in model selection, problem-solving, and result evaluation, independently of the students’ model choices [33].

2.2.3. Working with Technological Models

Technological interaction is often indispensable when working with models, as “both the design and interpretation of experimental practices in modern science are often based on the use of computational modelling” [58]. Despite this, “technology is rarely explicitly called out within definitions of integrated STEM education” [45].
In the problem-solving process, technology can serve one of two distinct roles (c.f., [45]): first, by enhancing efficiency in problem-solving; e.g., by increasing efficiency or collaboration (information technology aspect). Second, by being embedded within the model itself; e.g., because computational concepts like algorithmic thinking are used to create or comprehend parts of the problem (computational aspect). Notably, both roles of technology are dependent on each other [45,65] and they each have benefits that lead to prominent arguments for the inclusion of computing technology for problem-solving and mathematical modeling (e.g., [11,66,67,68]).
Technological support is particularly beneficial for simulations, defined as “the imitation of a real-world process or system over time. Whether done by hand or on a computer, simulation involves the generation of an artificial history of a system and the observation of that artificial history to draw inferences concerning the operating characteristics of the real system” [69].

2.2.4. Model and Result Evaluation

After modeling, an evaluation step is crucial (c.f. [13,70,71,72,73,74]). This evaluation needs to encompass verification and validation activities, whose differences are often overlooked: “there is inconsistency in the meanings of verification and validation in both research and educational literature” [75].
Verification is the process of determining whether the execution of the working process was free from mistakes. Formally defined, verification “refers to the processes and techniques that the model developer uses to assure that his or her model is correct and matches any agreed-upon specifications and assumptions” [76]. Verification activities include checking for mistakes like calculation and implementation errors, comparing values derived from the models with values known to follow from the model [76] (e.g., because an authority like the teacher provided these values for verification), and formally proofing that a proposition does follow from previously stated assumptions [77]. Further techniques are presented in [77,78].
Validation is the process of determining whether a model is applicable for achieving a certain goal in a given situation. It is formally defined as substantiation that a model “within its domain of applicability possesses a satisfactory range of accuracy consistent with the intended application of the model” [79]. Validation techniques include empirical testing to show the correctness of a proposed real-world solution [80], comparing the proposed solution to prior knowledge about the real-world [81], and arguing for the reasonableness of the underlying assumptions of the model [82]. A further technique with high practical relevance is cross-validation: In this approach, two different abstract models are used to represent the same real-world situation. The alignment of predictions from the corresponding parameterized models is then used as an indicator of the validity of both models [83]. Further techniques are presented in [78,84,85].
In problem-solving, the evaluation itself must take into account whether the results are applicable to the problem stated at the beginning. However, evaluation activities should usually also focus on the quality of the model itself [70]. For example, it is desirable to evaluate when the models do and do not work [86].

2.2.5. The SOLO Taxonomy to Measure Structural Complexity

One way to measure the quality of an argumentation is using the structure of observed learning outcomes (SOLO), as described by [87]. This taxonomony introduces five levels that “can be used as at least one important index of structural complexity” of a response. These levels are cumulative, i.e., “[e]ach one adds something to the previous one”.
The lowest of these level is the pre-structural level. An answer at this level adds nothing to the solution. Instead, it may ignore the question (denial), restate given information or the question in different words (tautologizing) or use irrelevant information to answer the question (transduction). The answer “closes without even seeing the problem”.
At the second unistructural level, the answer adds one relevant datum to the answer. There are no further aspects explored. The answer frequently “jumps to conclusions on one aspect, and so can be very inconsistent”.
At the third multistructural level, multiple relevant pieces of information are added. However, they are not weighted against each other or put into a larger context. There is an “isolated fixation on data, and [the answer] can come to different conclusion with [the] same data”.
At the fourth relational level, the different types of relevant information are put into a wider context using relational context information or by being weighted against each other. At this point, the answer usually consistently follows from the data and the answer holds true unless it goes beyond the initially described scenario.
Lastly, at the final extended abstract level, the answer additionally includes abstractions and hypotheses, to make sure the answer is true not only in the current scenario, but also if using different scenarios or edge-cases. The answer consistently follows from the data and clearly states relevant assumptions and limitations.
Additional to these five levels, there are also four intermediary or transitional levels. For example, transitional level 1+ would be a student that “attempts to answer the question but only partially grasps a significant point”.
While these levels were derived based on the cognitive development stages (c.f. [88]), there is no necessary connection between the cognitive development of the person answering and the structural complexity of the answer given. In fact, the SOLO taxonomy was developed precisely because the same persons were observed as giving “a middle concrete response in mathematics [...] followed by a series of concrete generalization responses in geography”. Thus, the cognitive development stage of a person might act as the upper limit to the responses of an participant. For assessment, “the, SOLO levels are equivalent to attainment test results; they describe a particular performance at a particular time”.

3. Simulating Building Evacuations as the Problem for our Study

Based on prior research, we used building evacuation as the domain for our study. As discussed before (see Section 2.1), this domain choice emphasizes two of the STEM subjects: mathematics and technology. Notably, this choice also allows for complex and authentic problems, interesting and authentic activities, and meaningful inclusion of technology, while not being too reliant on domain knowledge or sophisticated mathematical methods (c.f. [89]). Moreover, given the complexity of problems in this domains, digital simulations are frequently used to automate certain steps of the problem-solving process (c.f. [90]).
Two mathematical models are frequently used for such evacuation simulations: grid automata [91] and Flow Networks [92,93].

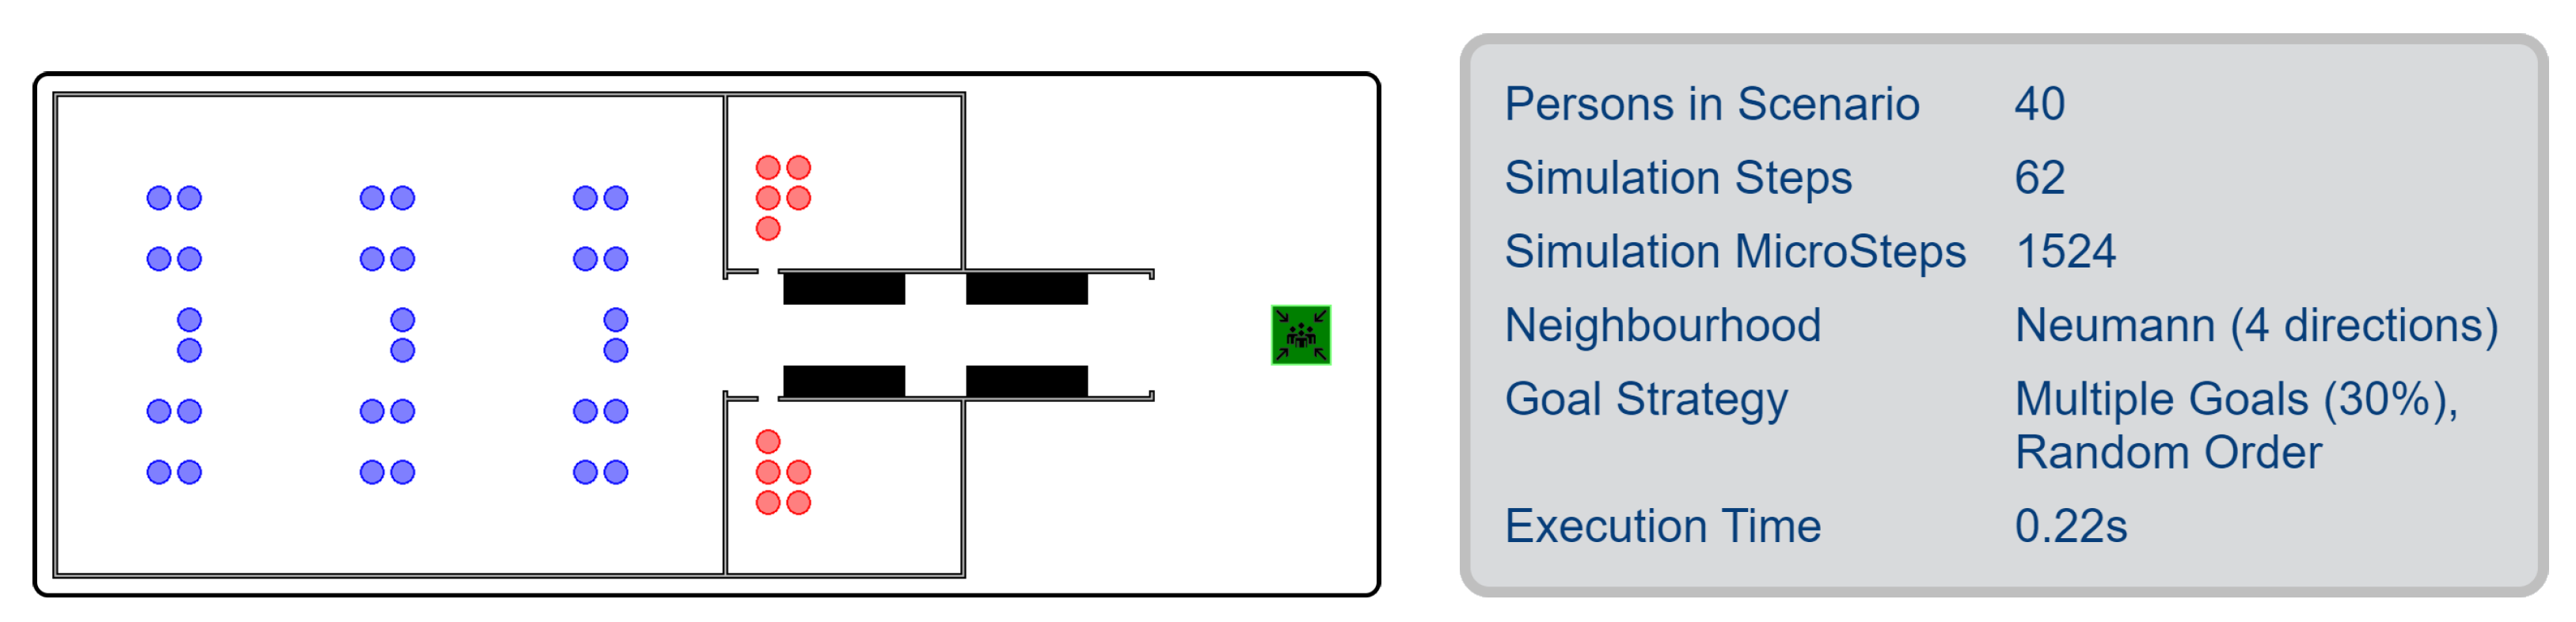
3.1. Simulating Building Evacuations with Grid Automata

One approach to simulate building evacuations are grid automata. They are based on one of the oldest computing models: the cellular automaton, dating back to von Neumann [94]. Cellular automatons consist of cells with neighbours that change state according to specified rules. Additionally, in a grid automaton, cells are implemented as a 2D grid of rectangular cells.
For simulating evacuations, each cell can be either empty, full, blocked, or safe. Full cells contain (exactly) one agent, empty cells do not. Blocked cells neither do nor can contain an agent. They represent walls. Safe cells remove each agent passing through them from the simulation. They represent the safe destinations.
During each simulation step, each agent can move to a neighbouring cell—either in four (Neumann neighbourhood) or in eight directions (Moore neighbourhood).
Whether or how the agents move is described using the fleeing algorithm. A simple fleeing algorithm might instruct each agent to move to the cell next on the shortest path of unblocked cells to the nearest safe cell if this neighbouring cell is empty.

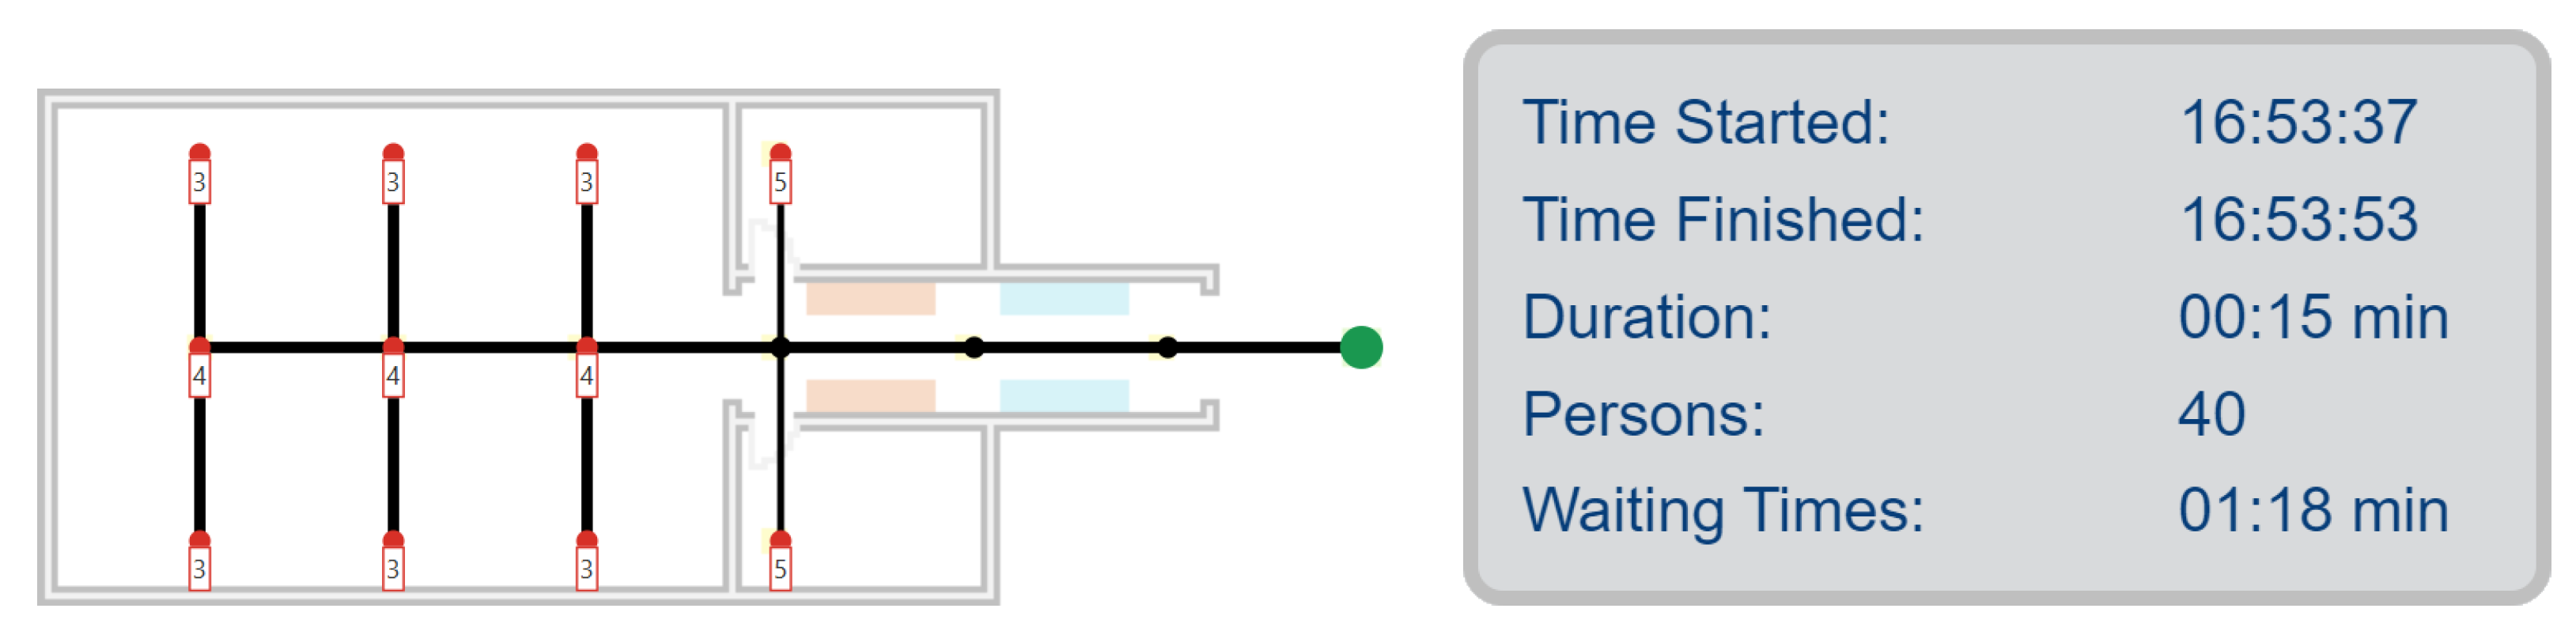
3.2. Simulating Building Evacuations with Flow Networks

In flow networks, nodes represent positions in 2D-space. They are connected by edges over which agents can move. Each edge has two key properties: delay and parallelism. The delay denotes the time necessary to get from the start of the edge to the destination. The derived speed of the edge is the change in position during the simulated time (frequently provided in pixels per seconds). Parallelism denotes the number of agents that fit on the edge simultaneously.
During simulation, an edge is available, if less agents than the parallelism are currently on it. During the execution of the simulation, each agent uses the available edges to get to one of the safe nodes. The decision about which edge to take and when (or whether to wait for an edge to become available) is described using the fleeing algorithm.
As neighbours can be interpreted as the destination of edges, the same fleeing algorithms can be used for both models. One common fleeing algorithm is the closest goal algorithm: actors are instructed to move to the neighbour that minimizes the distance to the nearest goal, if possible. Further algorithms are described in [95].

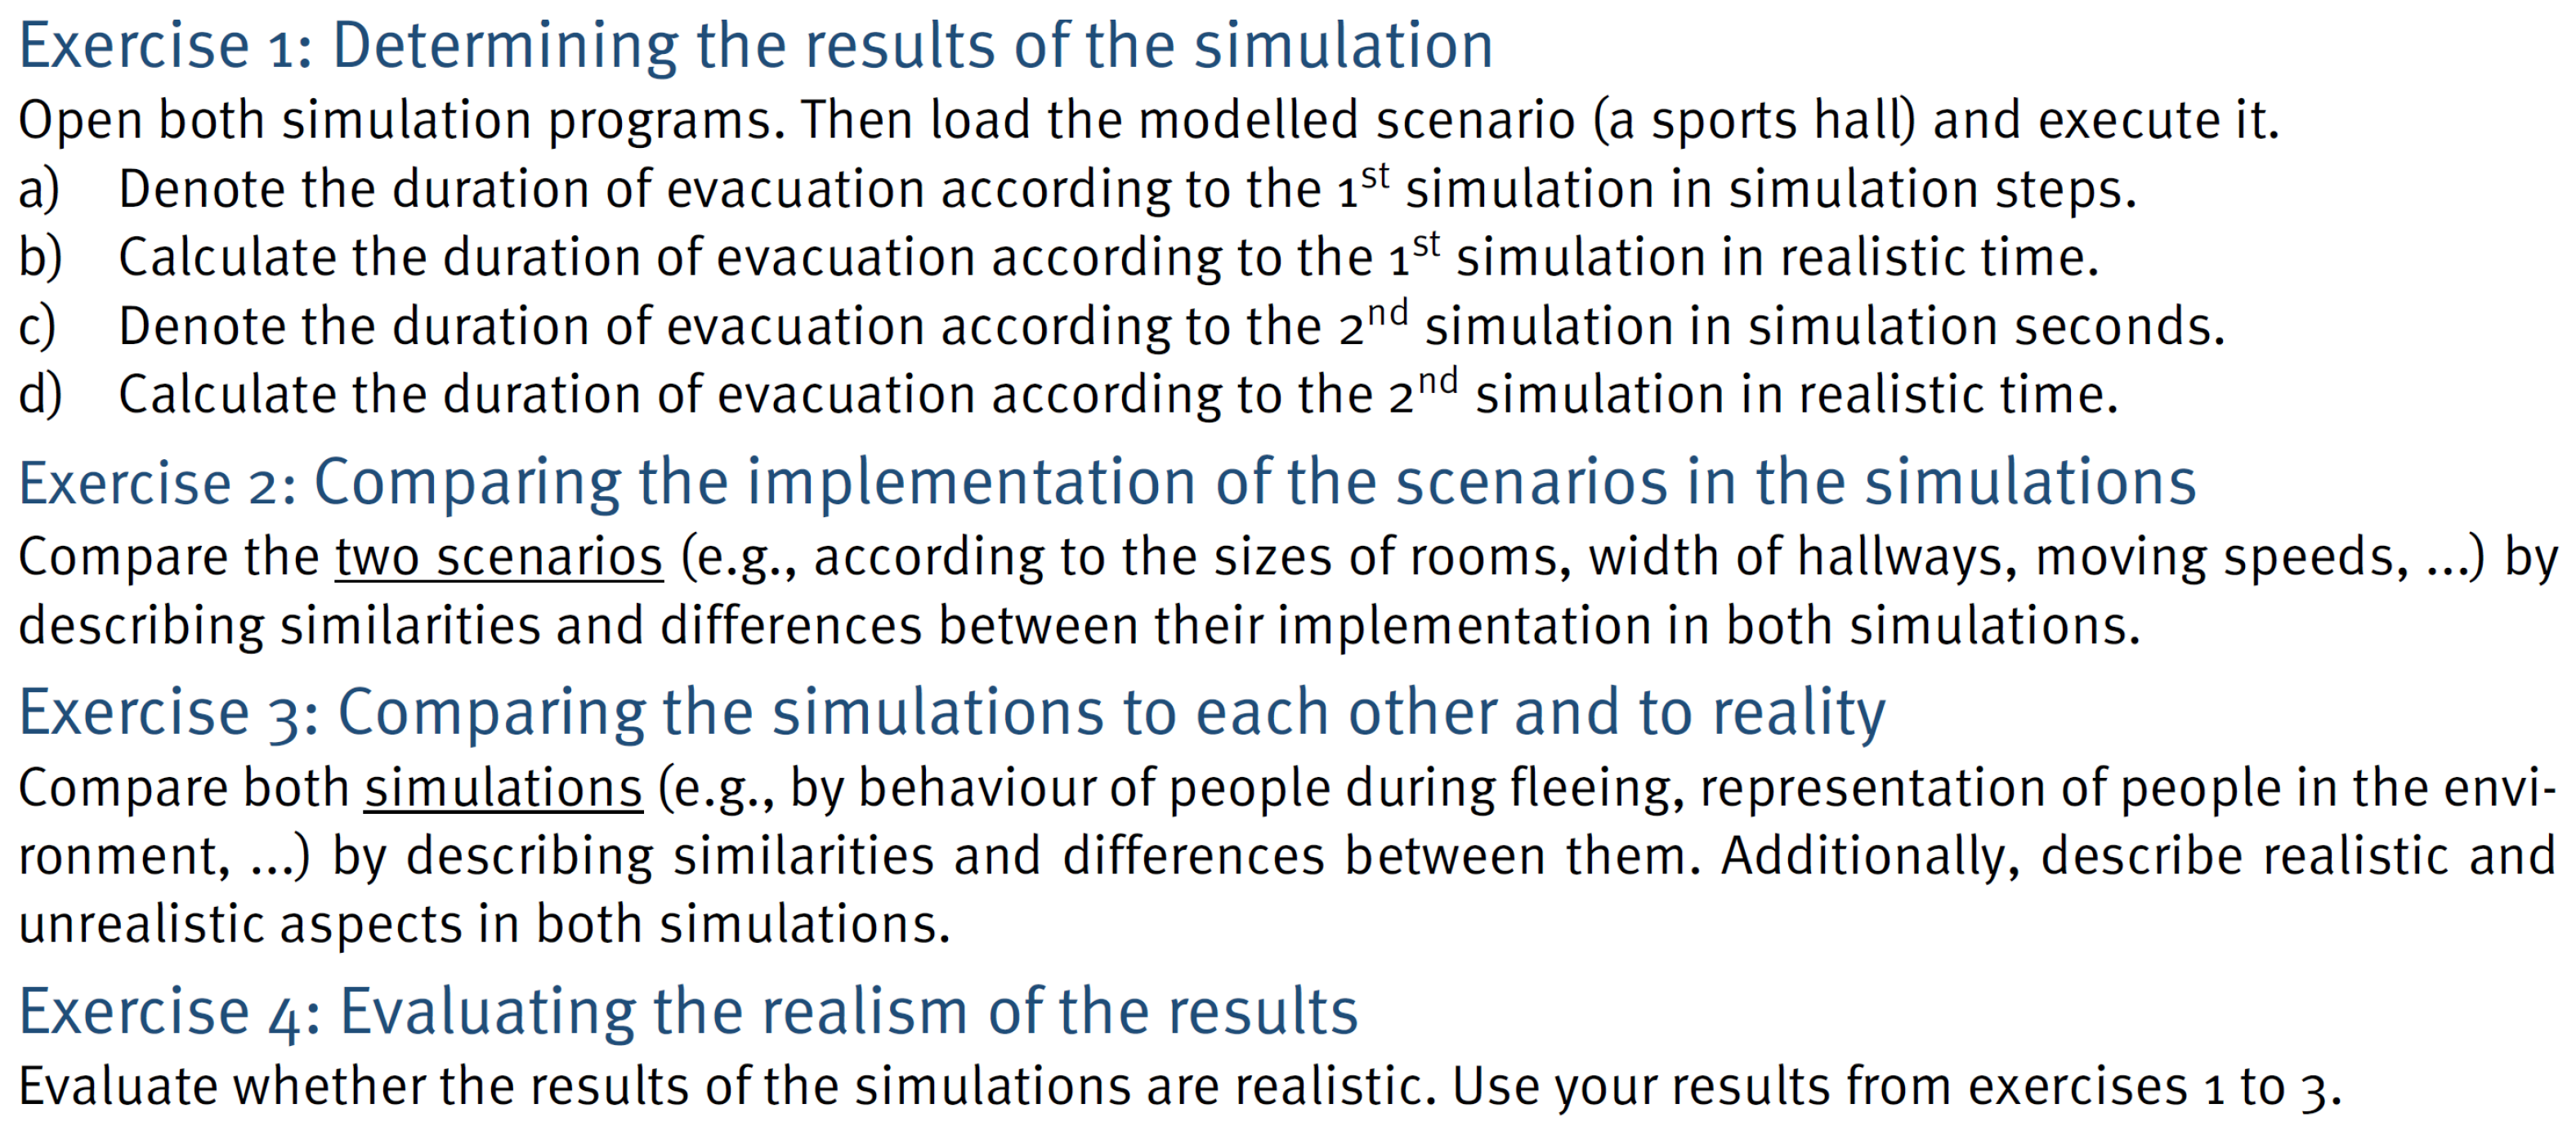
3.3. Description of the Problem Used for Our Study

For our study, we needed a specific problem. After considering various options, we selected the task of applying two simulation environments to simulate a scenario and then comparing and evaluating those in regard to the result accuracy. The problem itself was introduced with a motivating text and a visualization of the sports hall as depicted in two distinct simulations, each accompanied by a brief explanation.
The first simulation, referenced in [95] and visualized in Figure 2, operates on a grid automaton. In this setup, every individual occupies a cell measuring 50 × 50 cm2 and progresses step-wise to a safe external area. The number of steps taken by the last participant can be used to estimate the evacuation time. The model uses the scale 16 × 16 px 2 = ^ 50 × 50 cm 2 = ^ 1 cell.
The second simulation, referenced in [89] and depicted in Figure 3, operates on a flow network. Here, each person begins at a node and navigates through edges to reach safety outside the sports hall. The simulation’s duration, influenced by edge delays, can be used to estimate the evacuation time. The model uses the scale 1 m = ^ 10 px . By default, persons are configured to move at 50 px/s.
The exercises used to structure the problem are shown in Figure 4:

3.4. Significance of the Problem

The problem we used is authentic, both in the way that there are professional mathematicians working on this problem (although they may use more sophisticated models, c.f., [96,97,98,99]), and that corresponding activities are typical for approaching STEM problems (c.f. Section 2.1). The problem is also complex, both in regard to the time necessary to solve it, and the number of variables that need to be accounted for (e.g., assumed walking speed, real evacuation time, fleeing algorithm, discretization method).
It also relies on several activities demanded in modern educational settings. For example, the United States’ National Research Council argues that students should “Use (provided) computer simulations or simulations developed with simple simulation tools as a tool for understanding and investigating aspects of a system, particularly those not readily visible to the naked eye” [100]. Furthermore, they should “evaluate and critique competing design solutions” [100] for a problem. Alternatively, the European Commission also lists modelling and simulation as one of the ten key areas of computer science education [101] and a report issued by them highlighted the educational relevance of activities such as the ones used in the task; for example, “computer simulations are often used in science classes to support learning. Learners use simulations to explore phenomena, engaging in what if experiments and reflections while changing the values of the simulation’s parameters” [102].

3.5. The Trap in the Problem

Both simulation environments offered a button to load a pre-implemented sports hall model. However, an intentional inconsistency was embedded: the sports hall within the flow network was scaled threefold. Thus, the built model did not correspond with the actual sports hall representation or a logical parameterized version (i.e., the parameterized and implemented model differed). This deliberate discrepancy aimed to present participants with an identifiable issue during their evaluations in exercises 2–4, without prior warning. Ideally, during their tasks, participants would discern this size disparity in the second exercise, which was designed to promote a side-by-side comparison of the scenarios, particularly spotlighting hallways’ dimensions in the instructions.
One way to identify this size difference is measuring the size of the hallways (visualized in Figure 5). In the grid automaton, there are 6 cells of 50 cm alongside each row of lockers (⇒ 3 m). In the flow network, the edge alongside one row of lockers has a distance of 90 px (⇒ 9 m).

4. Formal Setup

Shortly before the study, the participants received the exercise sheet and links to the two simulation environments. They then had up to four hours to “solve the exercises in a way they themselves would consider satisfactory”. The study itself was conducted with two groups: a student group (6 participants) and a teacher group (14 participants). Initially, the student group was intended to be used as a pilot group. However, as both groups achieved similar results, we decided to merge the results submitted by both into the single dataset we analyze in this paper.

4.1. Prospective Teacher Group

Participants in this group are prospective teachers who are currently studying for a teaching degree for a higher secondary school at our local university. They were advanced in their studies (at least semester six) and are named with an S, followed by a number (e.g., S4). The students received the exercise sheet during a (voluntary) seminar on working with simulations in mathematics education. Two sessions (120 min each) were used, in which the students worked on the exercises on their own in a live session via the video-conference software Zoom. They were allowed to ask questions by (virtually) raising their hand. Questions and answers were discussed in a separate room.
In a feedback round after the sessions, students explained that they understood the exercises but had problems solving them. In addition, two of the students reported that they did not feel comfortable asking questions in this setting.

4.2. Teacher Group

To incentivize asking questions, we changed the setup for the teacher group. This time, the study was conducted in a two-person meeting via Zoom. Participants are named with an P, followed by a number (e.g., P7). At the start of the meeting, the participant was asked to share their screen and explain their working process and thoughts using the thinking aloud method [103]. They were told that they could ask the researcher any kind and any number of questions at any time, that the researcher knows about the inner-workings of both simulation environments, that any question would be answered as briefly as possible in order to not influence their thought process, and that any and any number of follow-up questions were allowed. Very open questions like “What should I do now?” were answered with “I don’t want to influence your approach. What exactly do you want to know?”). Thirteen of the fourteen teachers submitted ahead of time (mostly after 150–210 min of the 240 min working time). One participant (P14) was provided ten extra minutes after the four hours to finish their current thought and was then requested to submit the solution as it was at that time.
The teachers were actively practicing in Bavarian Schools (Southern Germany). Most had a full teaching permit for both mathematics and computer science in Bavaria, Germany. This requires bachelor-level courses in both subjects (including, e.g., courses on software engineering, statistics, analysis, and algorithms), as well as a two year practical training. Two participants only had a mathematics teaching permit, one only had a computer science teaching permit, two further teachers had not yet finished their practical training.

5. Research Questions

The central goal of this exploratory study was the evaluation of educators’ abilities to solve the problem we posed to them and their evaluation of both the model and the results achieved using it. More precisely, we posed four research questions.
First, educators should “experience mathematical problem-solving from the perspective of the problem solver before they can adequately deal with its teaching” [19]. However, there has only been a small amount of prior research on the capability of teachers to solve problems like ours (see Section 2.1.1). Based on this gap, we posed the following question:
Research Question 1:
To what extent were the participants able to correctly estimate the duration with the two simulation environments?
Second, evaluating models and the results achieved with them is a central step while working with models (see Section 2.2.4). However, different goals or kinds of evaluations are often overlooked (see Section 2.2.4). As such, it is necessary that teachers support students by providing and discussing potential and different criteria and that they structure their argumentation by including multiple criteria into an overall assessment. Thereby, “[a] numerical weighting system can help evaluate a design against multiple criteria” [100]. Based on this requirement, we wanted to assess the quality of the argumentation in the evaluation:
Research Question 2:
To what extent were the participants able to argue for or against the realism of their estimated evacuation durations?
Third, being able to solve a problem for oneself does not necessarily enable one to teach well the solving of similar problems. Instead, additional capabilities are required (c.f. Section 2.1.1). As such, we wanted to analyze whether the teachers thought they were sufficiently educated to both solve such problems and teach using them:
Research Question 3:
To what extent do the teachers believe they are sufficiently educated to work on and teach using such problems?
Fourth, it was unclear how good the participants were at judging their own capabilities. Notably, there is little precedence in assessing such a capability. Prior research either focuses on the alignment between students’ self-assessment and teachers’ assessment (e.g., [104,105,106,107]) or with teachers’ self-assessment for problems outside of STEM (e.g., [108,109,110,111]). As such, in our last research question, we wanted to analyze whether there were differences in the self-assessed capability to solve problems like ours and the capabilities shown in the earlier analysis:
Research Question 4:
To what extent was the self-assessment of the participants aligned with the capabilities identified by our assessment?

6. Methods

In general, we used an evaluative qualitative analysis, based on the iterative process of Kuckartz [112], to assess the quality of the evacuation estimates, as well as the argumentation for the evaluation. The main goal of this method is to “assess the data and build categories, whose characteristics are usually noted as ordinal numbers or levels” [112]. Then, a survey using closed questions was used to analyze the self-assessment of the participants. Lastly, the correlation between the answers to the closed question and the assessment levels was used to analyze the dependencies between both. The remainder of this section describes each of the methods in more detail.

6.1. Method for Research Question 1

The evaluative analysis of the solutions was based on eight quality indicators. These were built as follows: Before the evaluation, one of the authors wrote a sample solution for the task. Then, this author proposed quality indicators, read the submitted solutions of the participants, and revised the sample solution and quality indicators. Then, the other authors reviewed the sample solution and indicators and suggested improvements for clarity and completeness. This process was iterated until all authors had agreed that the sample solution and the indicators were suitable for the evaluation.
After creating the indicators, one of the authors classified every solution, to evaluate whether the solutions conformed to the indicator (Education 14 00104 i003) or did not (Education 14 00104 i001). In special cases, a solution could be classified as partly fulfilling an indicator (Education 14 00104 i002). For this evaluation, the whole solution was considered: If a participant denoted two different results in exercise 1b (steps and micro-steps) and denoted in exercise 4 that the steps were the correct result to evaluate for realism, then the indicator “exactly one result per simulation is denoted” was fulfilled.
For each indicator fulfilled (out of eight), the participant was awarded one point. For every partially fulfilled indicator, half a point was awarded. The sample solution and quality indicators used are available in Appendix A.

6.2. Method for Research Question 2

The evaluative analysis of the argumentation for the evaluation was based on the levels of the SOLO-taxonomy (see Section 2.2.5). This taxonomy measures “structural organization, which discriminates well-learned from poorly learned material in a way not unlike that in which mature thought is distinguishable from immature thought” [87]. For our purposes, it was superior to the alternative—the Bloom taxonomy [113]—as the latter “is used mostly to set questions and items, not to evaluate open-ended responses to existing questions and item types” [87]. In the evaluation, the solutions were first summarized and paraphrased, then coded as one of the five levels or four intermediary levels (see Section 2.2.5).

6.3. Method for Research Question 3

To analyze the self-assessment of the participants, we asked them to state their level of agreement to the following three propositions using a 5-point-Likert scale:
  • I feel sufficiently technically educated to solve such problems (as a learner);
  • I feel sufficiently technically educated to teach with such problems;
  • I feel sufficiently didactically educated to teach with such problems.
The original questions were provided in German and were provided within five minutes after submission of the solutions. One participant (S6) did not answer the question and had to be excluded from the analysis. Note that “technically” and “didactically” refer to the German phrases “fachlich” and “didaktisch” that do not have a direct English translation. They are used as contrast between education focused on content within a subject (e.g., a mathematics teacher hearing a lecture about calculus or programming) and education focused on educational practices (e.g., a mathematics teacher hearing a lecture about students’ cognitive development or learning theories). Thus, “technically” should not be interpreted to imply technical education as in education in simulation technology).

6.4. Method for Research Question 4

We used correlation analysis to identify potential relationships between the identified variables. Here, we computed both the Pearson (linear correlation, r) and Spearman (rank correlation, ρ ) correlations between the point score, the SOLO-level (the transitional SOLO-levels 1+ and 2+ were transformed to 1.5 and 2.5 respectively), and the self-assessment of the first two questions. Note that Spearman correlation is more robust and differences between the Pearson and Spearman coefficient can indicate that the correlation is not robust or that the dependency is non-linear.
As our small sample size made analyzing robustness crucial, and we also calculated the skipped correlations [114], i.e., the correlations after removing a data point from the set. Additionally, if applicable, we also calculated the skipped correlation after removing both the highest and lowest scoring participants (according to the point score) from the dataset. Our interpretation of potential dependencies was based on a holistic picture of these correlation values.
In our interpretation, we used the guidelines for behavior science [115] to interpret the strength of any correlation. As such, a correlation of ≥0.1 is considered weak, ≥0.3 medium, and ≥0.5 strong. An example of a medium correlation would be a correlation of r = 0.30 between self-estimated intelligence and the result of a cognitive ability test [116].
Note again that this was an exploratory case study with a limited number of participants, i.e., each dependency found only acted as a basis for a hypothesis that needs to be further tested in a large-scale, quantitative study.

7. Results

In this section, we list the results of the research questions given earlier (c.f. Section 5) and based on the method described above (c.f. Section 6). Note that, for spacial reasons as well as better readability, some details have been moved to Appendix B.

7.1. Research Question 1: Production of Estimates

A full overview of which participant fulfilled which indicator and the mistakes made by individual participants is provided in Table A1 in Appendix B. There, we also go into more detail about the edge-cases of the coding and discuss every classification classed as partially correct (Education 14 00104 i002). Notably, this partially correct classification was given rather leniently.
The distribution of points is shown in Figure 6. Overall, three participants achieved seven or more points, ten participants achieved between five and six (inclusive) points, and seven participants achieved four or less points.
It is noteworthy, that six participants were unaware of the necessary format of the answer—exactly one simulation estimate for each simulation environment—and only half of the participants used consistent assumptions regarding the speed of the agents to calculate their estimates. One aspect only a few participants struggled with was the identification of the correct key result for the simulation environment—for both environments, only two participants did not denote the correct number.
In the end, only four pairs of estimates correctly followed from the simulation environment and only one correctly adjusted for the inconsistent sizes of the sports halls. As such, three quarters of all participants were unable to produce estimates that were both mathematically correct and used consistent assumptions.
Result Summary:
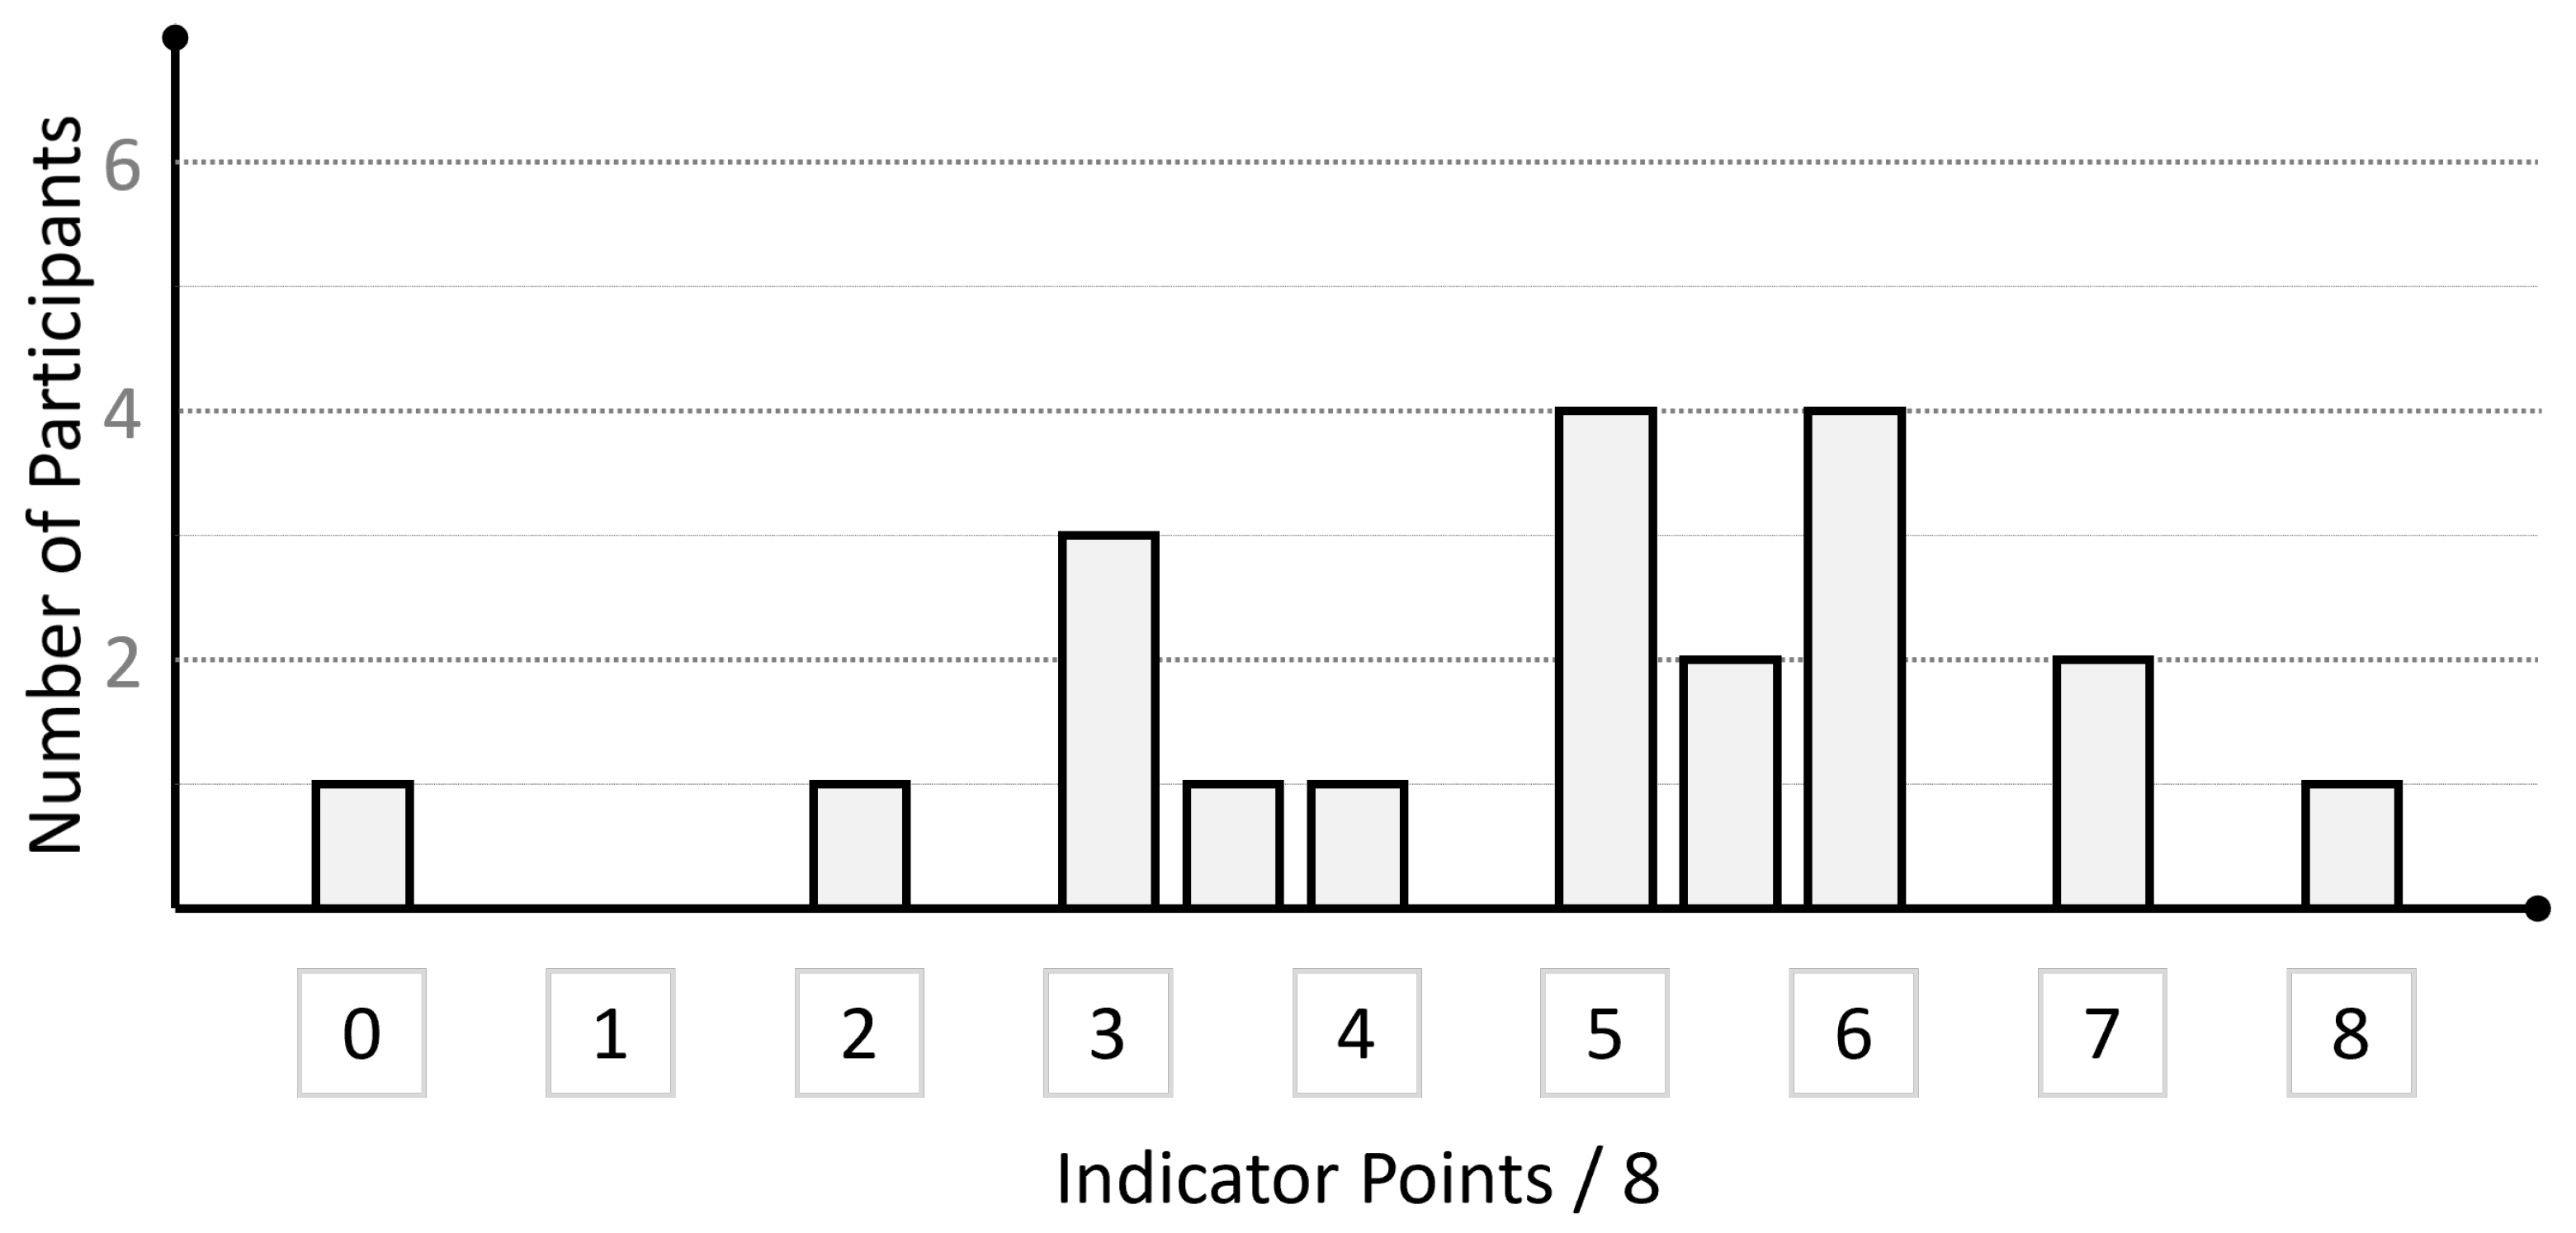
Only four pair of estimates were mathematically correct and used consistent assumptions. Seven participants fulfilled half or less of the criteria. Six participants did not recognize the necessary format of the answer.

7.2. Research Question 2: Evaluation of Realism

From the 20 participants, two did not provide any meaningful information towards an answer. Of the remaining 18, six gave no clear conclusion in regard to whether their estimates were realistic or not. One of them highlighted that their analysis was not sophisticated enough to come to a conclusion but listed aspects that, after evaluation, would allow for a meaningful conclusion. Five argued that their estimates were realistic if certain (stated) assumptions were fulfilled; and two of them argued that these assumptions had been fulfilled. After that, the results of the grid automaton were evaluated to be rather realistic (6 in favor, 3 against); as were the results of the flow network (5 in favor, 4 against).
The main argument used (10 times) was a variation of the following: “If the following assumptions are not fulfilled, the result is not realistic. Otherwise, it is”. For example, P7 argued: “The Model is realistic if the group is guided (e.g., pupils). It is less suited for, e.g., the evacuation simulation of a rock concert” or, less explicitly, P5: “The simulation was programmed to assume the same walking speed for every person. This might not be the case in reality”. Notably, this argumentation never included a justification of why the results would realistic if these assumptions were fulfilled. As such, this line of argumentation uses the absence of evidence as evidence of absence—which is false, as there might be other factors not listed that make the estimates unrealistic. For our evaluation, we coded this as one core argument regarding the realism of the results, even if multiple assumptions were listed within the argument. Only two participants argued for some (but not all) assumptions regarding whether they had been fulfilled, two further participants stated (without reasoning) some (but not all) assumptions, whether they had been fulfilled or not.
The second most used argument was the assertion (without argumentation) that the results did seem realistic or unrealistic (6 times). For example P4: “The results seems rather short to me” or, more explicitly, P9: “on first glance, the result seems to lie within a realistic time-frame”.
The third most used argument was a cross-validation (5 times): since two different models produced results within the same magnitude, both were likely to be realistic.
Three times, a participant argued that a certain assumption had not been (exactly) fulfilled and, as such, the results were unrealistic. For example, P6: “The results of the simulations are unrealistic, because certain aspects that could influence the estimate were not accounted for (see exercise 3). For example, in the simulation, multiple people can be on the same position in space. This is physically impossible” or P1: “for both environments: Is the behavior during fleeing realistic (do really all persons act at the same time?) ⇒ model is good for building a mental concept, but not so much for accuracy”.
Lastly, seven times, the conclusion was—at least in part—based on arguments that were unsuitable for evaluating the realism of the results. This included the usability of the simulation software (2 times), details of their own solution (like specific parameter choices) that could be solved differently (2 times), the comprehensibility of the simulation for students (1 time), the quality of the visualisation (1 time), or properties of the model whose connection to the realism of the results was not explained (1 time).
Regarding the SOLO-levels, we categorized a solution that did not provide an argument as level 1 (2 times); a solution that only used one argument unsuitable for such an evaluation as level 1+ (2 times), a solution that used at least one correct argument as level 2 (6 times); a solution that used the same argument multiple times with a slightly different focus or used additional wrong arguments as level 2+ (5 times), and a solution that used multiple correct lines of arguments to form their conclusion (without connecting them in any way) as level 3 (5 times). A histogram is shown in Figure 7:
Table A2 shows an overview of the evaluations and the final assessment of each participant. Notably, not a single participant performed an analysis to quantify the potential impact of a change within the simulation on the overall result, weighted different arguments against each other, demonstrated a relational approach in any way, or made abstractions and generalisations—or even tried but failed in their attempt to do so. As such, no participant was assessed as falling within the level 3+ or higher.
Result Summary:
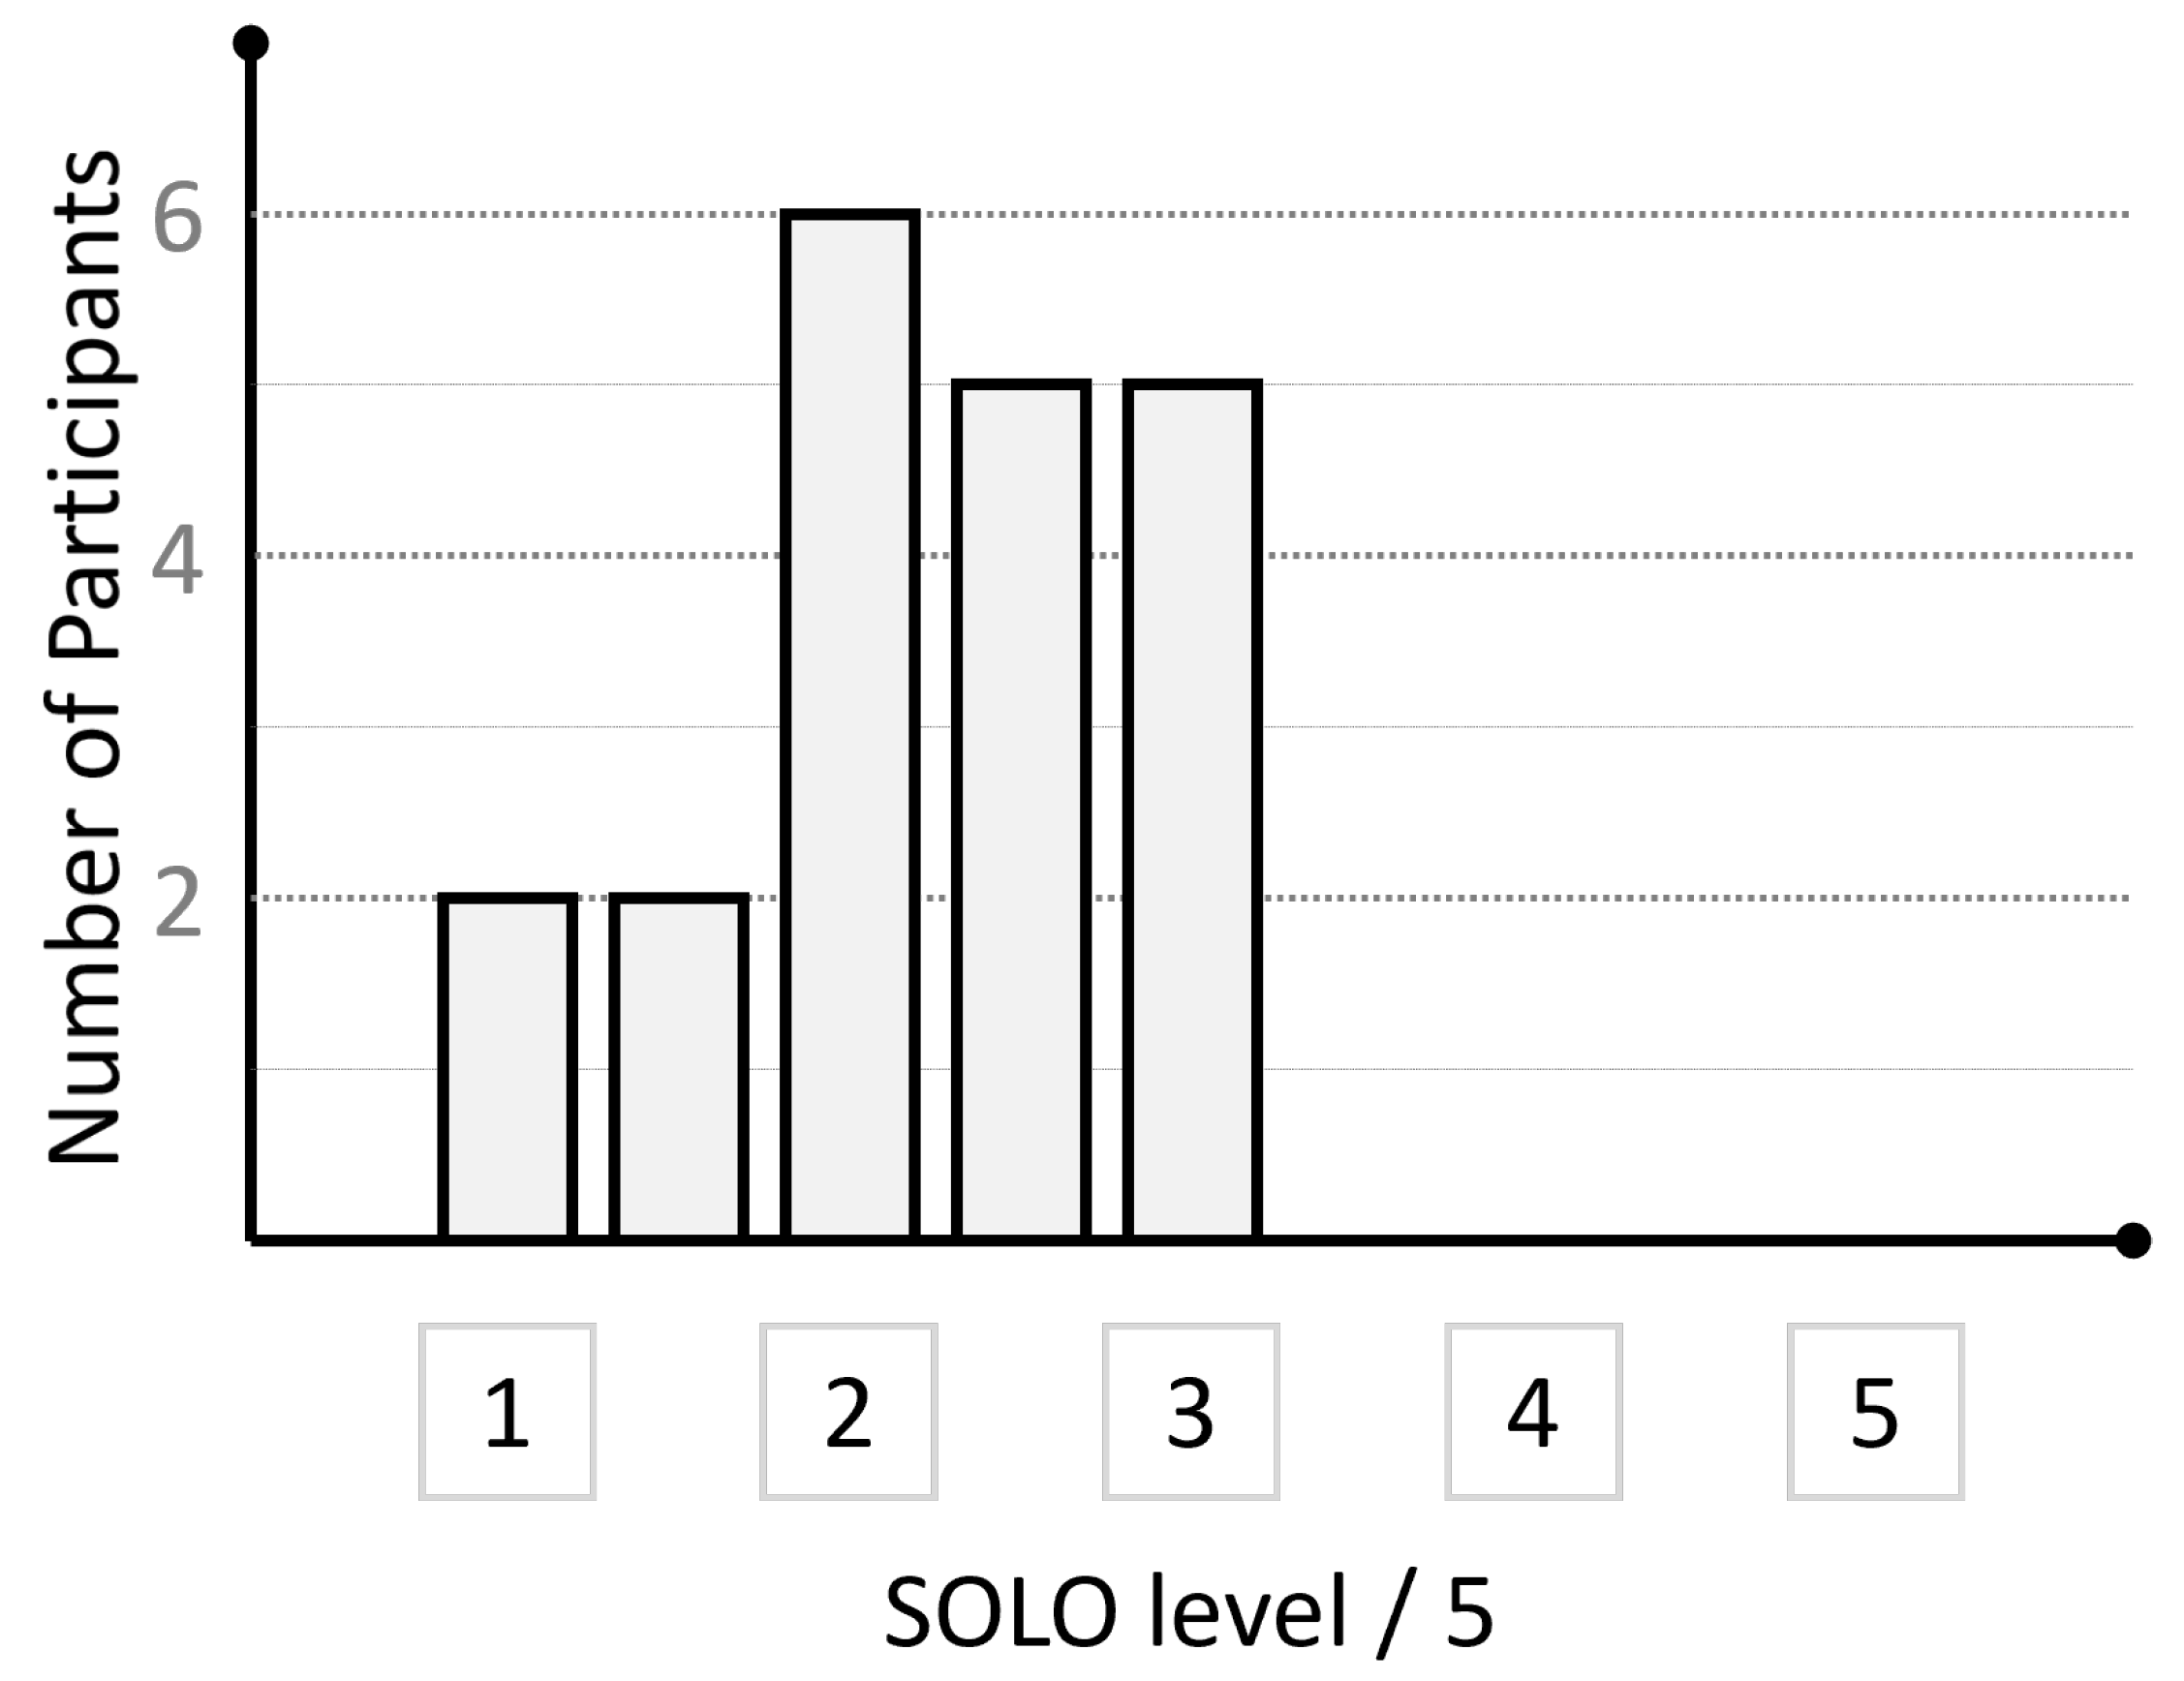
A significant minority of participants had no final conclusion on whether their estimates were realistic. Five evaluations reached a SOLO level of 3, no argumentation was scored higher.

7.3. Research Question 3: Participants’ Self-Assessment

Most teachers agreed with the proposition “I feel sufficiently technically educated to solve such problems as a learner”: one participant instead answered no ( 1 × 1 ), three participants had a neutral opinion ( 3 × 0 ), seven answered rather yes ( 7 × 1 ), and eight participants answered yes ( 8 × 2 ) . As such, 15 participants felt sufficiently educated to solve exercises of this type ( = 1.16 , σ = 0.90 ).
The agreement with the proposition “I feel sufficiently technically educated to teach with such exercises” was lower: four teachers answered rather not ( 4 × 1 ), five teachers had a neutral opinion ( 5 × 0 ), seven teachers answered rather yes ( 7 × 1 ), and three teachers answered yes ( 3 × 2 ). Thus, ten teachers felt sufficiently educated to teach using exercises of this sort ( = 0.47 , σ = 1.02 ).
The agreement to the proposition “I feel sufficiently educationally educated to teach with such exercises” was the lowest: five teachers answered rather no ( 5 × 1 ), six had a neutral opinion ( 6 × 0 ), five answered rather yes ( 5 × 1 ), and four yes ( 4 × 2 ). Thus, nine teachers felt sufficiently educated to teach with exercises of this type ( = 0.42 , σ = 1.12 ).
Result Summary:
Most participants (15) felt sufficiently technically educated to solve such exercises. Half of them (6) also felt sufficiently (technically and educationally) educated to teach using such exercises

7.4. Research Question 4: Dependency between Self-Assessment and Our Assessment

We provide a full diagram showing the point score, the solo level, and the self-assessment (first question) in Figure 8.
Seven participants either obtained a solo level of 3 (the highest measured amongst our participants) or a result that followed without errors from the simulations; two of these participants obtained both. There was a small to medium correlation between the point scores and the SOLO levels ( r = 0.25 , ρ = 0.32 ), which was robust if removing any one participant ( 0.15 r 0.42 , 0.26 ρ 0.42 ), or both the lowest and highest scoring participants ( r = 0.32 , ρ = 0.33 ).
From the six participants that felt sufficiently educated to both solve and teach using such exercises, two obtained a point score of 5 or higher, and four obtained a point score of 3 or lower. The average point score of these participants was lower ( = 3.66 ) than that of the remaining participants ( = 5.25 ) Calculating the correlation between the agreement to the first proposition (“I feel sufficiently technically educated to solve such problems (as a learner)”) and the point score resulted in a correlation of r = 0.37 . However, the rank correlation was lower ( ρ = 0.17 ), indicating that the results might not be robust. And indeed, the skipped correlation was non-existent: Removing the lowest scoring participants led to r = 0.02 , ρ = 0.01 , additionally removing the highest scoring participant made the correlation negative ( r = 0.11 , ρ = 0.10 ). Thus, while there was a medium correlation between the self-assessment of being sufficiently technically educated to solve such tasks and the quality of the solution, this correlation was not robust. As such, we argue that this correlation was an artifact of our small sample size and not indicative of a correlation between the underlying concepts.
The correlation between agreement to the second proposition (“I feel sufficiently technically educated to teach with such problems”) with the point score was negligible ( r = 0.13 , ρ = 0.07 ). It even becomes negative if one removes the worst scoring participant ( r = 0.11 , ρ = 0.06 ) and stays negative when removing both the best and worst scoring participants ( r = 0.18 , ρ = 0.13 ).
From the six participants that felt sufficiently educated to solve such exercises and teach using them, none achieved SOLO level 3, i.e., took into account more than one suitable argument for the evaluation. The average SOLO level of these participants was lower ( = 1.75 ) than that of the remaining participants ( = 2.45 ). Calculating the correlation between both variables returned a medium to large correlation, which was negative, i.e., a lower SOLO level correlated with a higher self-assessed ability to solve such exercises ( r = 0.40 , ρ = 0.42 ). This correlation was robust against removing any one participant ( 0.53 r 0.34 , 0.56 ρ 0.36 ), as well as against removing the participants with the highest and lowest point scores ( r = 0.53 , ρ = 0.53 ).
The correlations between agreement to the second proposition (“I feel sufficiently technically educated to teach with such problems”) and the SOLO levels was also negative and of a similar magnitude, even if a little smaller ( 0.44 r 0.28 , 0.43 ρ 0.26 ).
Result Summary:
The quality of the simulation estimates and the quality of the evaluation were at least weakly correlated. The quality of the simulation estimates was likely uncorrelated with the self-assessment. The quality of the evaluation with the self-assessment had a negative correlation that was of at least medium strength.

8. Interpretation

This exploratory research had the primary goal of assessing the abilities of educators to work with models and evaluate models and their results. To do so, we assessed the quality of twenty educators—six students studying for a teaching degree and fourteen practicing teachers. In this section, we try to generalize from the patterns in the results we observed.

8.1. Lack of Competence in the Assessed Activities

The first key result is that only a small minority of our participants produced a result that correctly followed from the provided model and technology. Furthermore, in the evaluation, only a small minority of participants used multiple distinct arguments in their conclusion and no one weighted them against each other or used other techniques to combine them into a full picture (see Section 7.1 and Section 7.2).
This is concerning, as such activities are indeed part of many curricula (see Section 3.4). As such, there might be a gap between the demands of modern educational research and curricula and the capabilities of current educators.
Notably, the extent of this gap cannot be assessed using our work. For such an assessment, a qualitative study with a larger sample size must be used. However, there is a sharp contrast between the frequent and confident implication that the vast majority of educators are able to do everything written in a curriculum, on the one hand, and the assessed capabilities in this exploratory study, on the other hand. Based on our results, it might be worthwhile to actually conduct such a large-scale study, to assess the existing capabilities of educators with regard to complex and authentic problems as demanded by both curricula and research.

8.2. Gap between Self-Assessment and External Assessment

The second main result is the gap between the self-assessment of teachers and the external assessment in our study. For the first activity assessed, the self-assessment was uncorrelated with our assessment. For the second activity, there was a strong negative correlation. As such, at least some participants were unaware of their own limitations [117].
This is a problem for any situation that explicitly or implicitly relies on such an self-assessment. An example would be voluntary training for practicing teachers with regard to evaluation problems. Given the negative correlation, such a training might be predominantly chosen by teachers that are aware of their own limitations and recognize the problem as complex, but not by those that are unaware of their limitations and think their current solution is adequate. As such, such a voluntary training might not be attended by those who have the highest requirement for it.

8.3. Independence of Sub-Skills of Problem-Solving

A third result of our exploratory study is that it might be more suitable to describe problem-solving as a composite of various sub-skills, rather than one atomic skill. While it is likely that there are multiple weak or medium-strong correlations between several sub-skills of complex and authentic problem-solving (or with general intelligence), our data do not suggest that these connections are strong or easily spotted when using a small sample size. Thus, instead of speaking of the capability to solve complex problems, it might be more suitable to develop a competence model based on different sub-skills of this process.
Similarly, it might be useful if educational interventions were described with sufficient details to identify the sub-skills of problem-solving that are fostered. This might also increase the relevance of problem-solving overall: If the multiple distinct sub-skills necessary for problem-solving were identified, it would be possible to include time for focusing on each of them in curricula—rather than focusing on problem-solving as singular entity. To this end, developing a classification system to describe which kinds of problems are suitable for teaching which kinds of sub-skills might be more helpful.

9. Limitations

In this section, we address potential limitations in our study method and their subsequent implications.

9.1. Sample Characteristics and Size

This study reports on results of an exploratory study with n = 20 participants. This size limitation is mostly attributed to difficulties in recruiting practicing teachers for such a long setup. While we consider this sample size appropriate for an exploratory study to formulate initial hypotheses, further quantitative confirmation is necessary before greater emphasis can be put on our generalizations in Section 8.
Similarly, our participants were largely from the same educational background in Bavaria, Germany—receiving similar education, primarily focusing on in-depth knowledge in mathematics and computer science but not on applied problem-solving. Our participants differed in their school type (2 × Elementary Education, “Grundschule”; 5 × lower secondary education, “Realschule”; 13 × higher secondary education, “Gymnasium”), age (20–60), and gender (13 × female, 7 × male). However, it remains uncertain how these findings would apply to teachers from different regions or backgrounds.

9.2. Task Validity and Specificity

The appropriateness of the task we selected to assess teachers’ abilities remains in question. Our task design aimed to mirror typical school tasks (see Section 2.1 and Section 3.4) in modern settings; however, its effectiveness in doing so has not been confirmed, given the absence of measurement tools assessing problem similarity or complexity. To ensure a comprehensive understanding, future studies should incorporate problems from various domains, of various types, focusing on diverse aspects of problem-solving, and spanning multiple STEM subjects.
Furthermore, the specifics of the setup we used (like the specific simulation environments) could and should also be varied. While we tried to mitigate problems by being lenient in our assessment, the exact impact of specific implementation choices are currently unclear.

9.3. Influence from the Setup

We summarized results from both student and teacher groups, due to their similar outcomes. Though the overall findings remained consistent, some nuances existed when considering each group individually. This merging was notable, especially since the groups had different levels of supervision and question-asking tendencies (students asked a total of 2 questions, the teacher group 237).
However, one has to note that these questions were not used as well as possible by many participants: In the person-to-person meetings, participant asked an average of 19.75 questions (range: 6–35). This indicates that the barrier to asking question had been sufficiently reduced. However, analysis of these questions shows that a large percentage of them (≈40%) focused on program usage (e.g., “which button do I need to press to load the sports hall?”). Questions regarding the model itself (e.g., “can you explain the variable waiting times?”) were far less frequent (≈12%). As such, it is likely that the answers frequently only sped up the working process, rather than leading to additional insights into the model or problem-solving process.

9.4. Focus on the Written Solutions

Our analysis focused on the written solutions of the teachers. Thus, it might be possible that the teachers used far more sophisticated lines of argumentation and reasoning to come to their conclusion than they cared to write down. While possible, we consider this to be very unlikely, as an author was present during the whole solving process and the teachers, asked to verbally discuss their thought process, did not show clear indications of writing down significantly less arguments or weighting between arguments than they thought of.

10. Conclusions

This research focused on a case study based on simulating building evacuations to analyze the problem-solving capabilities of educators in the context of problem-centric education. In our study, we performed two evaluative analyses into the solutions of twenty educators asked to evaluate the realism of two evacuation estimates. Three key findings were identified.
First, aligned with existing research (see Section 2.1.1), a significant number of teachers struggled when working on the problem. This was likely not due to the mathematics involved, but because of difficulties in applying mathematics to real-world contexts. For example, errors in the application of the rule of three were significantly less common than the usage of inconsistent assumptions regarding the walking speed when creating the duration estimates. Additionally, the argumentation used for the evaluation was rather superficial. Techniques like analyzing the impact of a potential change to the estimates or weighting different arguments against each other were not used.
Second, the self-assessment of teachers was either uncorrelated or negatively correlated with the assessment we conducted. This was especially true for the correlation between the self-assessment as being able to solve exercises like the one we provided and the ability to use sophisticated argumentation.
Third, the weak correlation between the different sub-activities necessary for problem-solving strengthens the position (c.f. [25]) of problem solving as a multifaceted combination of skills, each of which do not necessarily correlate strongly with one another.
The study’s main limitations included a limited sample size of 20 participants, who were predominantly from a similar educational background in Bavaria, Germany. Furthermore, the validity of the task designed to assess the teachers’ abilities is uncertain, especially with no established tools available for gauging its similarity or complexity compared to other educational tasks. Although the results from the student and teacher groups were combined due to similar outcomes, there were notable differences in their interaction levels and the types of questions asked, emphasizing software use over underlying model understanding. Lastly, while the analysis prioritized written solutions, it is believed that these sufficiently represented the teachers’ thought processes, given the consistent observation during their problem-solving sessions.
Based on this exploratory study, two main lines of future work emerge. First, it might be useful to assess the capabilities of teachers to solve problems as used in modern education styles in more detail, especially based on typical examples from the local curriculum. A large-scale, representative, quantitative analysis might reveal and quantify previously unseen gaps that then could be addressed through additional teacher training. Second, it might be worth investigating the reason for this gap further. This could include both a more detailed analysis of the approach taken by teachers to such exercises and identifying which steps exactly (like coming up with potential arguments, applying arguments, weighting arguments) teachers struggle with. Furthermore, it might also be worthwhile analyzing whether the tendency to focus on larger-scale problems in education and on problem-solving activities (rather than content knowledge) is also reflected in current teacher education.
Overall, working on complex and authentic problems is seen as more and more relevant in STEM education. However, our findings hint at a potential need for more nuanced teacher training, emphasizing the translation of math to real-world situations, better argumentation based on mathematical models, and a deeper understanding of the composite sub-skills involved in problem-solving.

Author Contributions

Conceptualization, A.G., H.-S.S. and M.H.; Methodology, A.G. and H.-S.S.; Software, A.G.; Validation, A.G., H.-S.S. and M.H.; Formal Analysis, A.G.; Investigation, A.G.; Resources, A.G.; Data Curation, A.G.; Writing—Original Draft Preparation, A.G.; Writing—Review & Editing, A.G., H.-S.S. and M.H.; Visualization, A.G.; Supervision, H.-S.S. and M.H.; Project Administration, H.-S.S. and M.H.; Funding Acquisition, H.-S.S. and M.H. All authors have read and agreed to the published version of the manuscript.

Funding

This research received no external funding.

Institutional Review Board Statement

The research was conducted and the resulting data were stored in accordance with international and local legislation, as well as institutional requirements, including the Declaration of Helsinki and the GDPR. In accordance with these requirements, the explicit approval of an ethics commission was not required for our research.

Informed Consent Statement

Informed consent was obtained from all subjects involved in the study.

Data Availability Statement

All information relevant for the analysis is provided in the tables in the Appendix B.

Acknowledgments

We would like to thank the participants of this study for their participation.

Conflicts of Interest

The authors declare no conflict of interest.

Appendix A. Details on the Evaluative Qualitative Analysis of the Estimates

In this section, we first present the sample solution to the first exercise, as well as the eight quality indicators used to evaluate the submissions of the participants.

Appendix A.1. Sample Solution

To produce the simulation results, one needs to load the sports hall with 40 persons into the environment, execute it, and denote the key result corresponding to the simulated evacuation time (grid automaton: simulation steps, flow network: simulation duration). To do so, one has to understand both the grid automaton and the flow network sufficiently to understand why these values are the key result of the simulation (rather than, e.g., the location of congestion points).
For the grid automaton, the simulation steps were scattered between 40 and 65 simulation steps—depending on the configuration used (neighbourhood and fleeing algorithm), and randomness. As such, it is possible (or even desirable) to denote this result as a range or probability distribution, rather than a number.
The flow network is deterministic; its simulated duration is always 15.6 s (only one algorithm was available in the simulation and this algorithm corresponds to one of the algorithms in the grid automaton).
Subsequently, this simulation result has to be converted to a real-world estimate. To do so, one has to first assume a realistic walking speed. With this assumption, the rule of three can be used to determine a real-world estimate. As example, if the grid automaton simulation lasted 62 steps (corresponding to moving one cell or 50 cm) and one assumes a walking speed of roughly 1 m/s for each agent, then the real-world estimate would be (approximately) 31 s.
Later on, while comparing both scenarios based on hallway sizes (as asked for in the second exercise), one should recognize that all sizes are scaled up by a factor of three in the flow network. Adjusting for this difference leads to an estimate of (approximately) 26 s for the flow network, compared to 20–33 s in the grid automaton (if assuming a walking speed of 1 m/s).

Appendix A.2. Indicators

The authors agreed to use the following indicators as quality indicators for the submitted solutions: First, an indicator was introduced as a “formal minimum” to proceed:
E
One Estimate: Did the Participant denote exactly one real-world estimate (this estimate might be a range or distribution) for evaluation per simulation environment?
  • Regardless of whether the problem was solved correctly or not, evaluating the realism of the estimates requires exactly one result per simulation environment as object for analysis in the evaluation. As such, participants not fulfilling this criteria were unable to perform any meaningful evaluation.
Additionally, we included the following indicators. These indicators are relevant as every mistake in these indicators changes the perceived situation:
E1
Denote Grid Value: Did the participant denote (at least) the amount of simulation steps as a key result of the grid automaton?
E2
Transform Grid: Did the participants transform the result of the grid automaton correctly into a real-world estimate of the evacuation duration?
E3
Denote Flow Value: Did the participant denote (at least) the simulation duration as a key result of the flow network?
E4
Transform Flow: Did the participants correctly transform the result of the flow network into a real-world estimate of the evacuation duration?
E5
Consistent Speed: Did the participant assume the same speed of agents for creating both real-world estimates?
E6
Size Difference: Did the participant note that the sport halls implemented did not have the same size?
E7
Configuration Impact: Did the participant indicate that the grid automaton results vary with different configurations?
  • Participants that did not fulfill one of these criteria were unable to perform a fully correct evaluation in exercise 4.

Appendix B. Details about the Quality of the Solutions

Appendix B.1. Denoting Exactly One Result

Out of the 20 participants, 14 were evaluated as denoting exactly one real-world estimate per simulation environment. Solutions that denoted more than one result per environment but clarified that both “are of the same magnitude” or highlighted that “one of them is the number to evaluate” (underlining one of the results was seen as sufficient) were evaluated to have fulfilled indicator E.
From the six that did not, S3 and P14 did not include any estimate for one simulation. Notably, P14 was the only participant that had to be asked to submit the solution as it currently was since the time was up. S6 performed two different transformations to calculate the real-world time (one was wrong), without further clarification. P6, P9, and P13 denoted two results for the grid automaton (with different configurations) without further clarification.

Appendix B.2. Denoting and Transforming the Results

Only six participants denoted correct results for both simulations.
In the flow network, participants frequently added the waiting times to the simulation duration (mistake WT, 6 times). The waiting times are additional statistical information about the flow network execution, defined as the summed duration that agents waited for edges to become available. For example, if the waiting times were 80 s and there were 40 agents in the simulation, then every agent waited (on average) two seconds for edges to become available while moving to the goal. Notably, this time was already included in the simulated duration of the evacuation.
Table A1. Evaluation of the solutions according to the indicators. Mistakes made by the participants are listed with a abbreviation in the column mistakes. Evaluations are marked as correct (Education 14 00104 i003), incorrect (Education 14 00104 i001), or partially correct (Education 14 00104 i002). Partially correct solutions are justified in the text.
EE1E2E3E4E5E6E7
ParticipantOne EstimateDenote Grid Value Transform GridDenote Flow Value Transform FlowConsistent Speed Size DifferenceConfig ImpactMistakesPoint Score
S1Education 14 00104 i003Education 14 00104 i003Education 14 00104 i002Education 14 00104 i003Education 14 00104 i003Education 14 00104 i003Education 14 00104 i002Education 14 00104 i001R36
S2Education 14 00104 i003Education 14 00104 i003Education 14 00104 i003Education 14 00104 i003Education 14 00104 i001Education 14 00104 i003Education 14 00104 i001Education 14 00104 i001WT5
S3Education 14 00104 i001Education 14 00104 i001Education 14 00104 i001Education 14 00104 i001Education 14 00104 i001Education 14 00104 i001Education 14 00104 i001Education 14 00104 i001 0
S4Education 14 00104 i003Education 14 00104 i003Education 14 00104 i003Education 14 00104 i003Education 14 00104 i003Education 14 00104 i003Education 14 00104 i003Education 14 00104 i003 8
S5Education 14 00104 i003Education 14 00104 i003Education 14 00104 i003Education 14 00104 i003Education 14 00104 i001Education 14 00104 i003Education 14 00104 i001Education 14 00104 i001WT5
S6Education 14 00104 i001Education 14 00104 i003Education 14 00104 i003Education 14 00104 i003Education 14 00104 i001Education 14 00104 i001Education 14 00104 i001Education 14 00104 i001R3, WT3
P1Education 14 00104 i003Education 14 00104 i003Education 14 00104 i003Education 14 00104 i003Education 14 00104 i001Education 14 00104 i001Education 14 00104 i001Education 14 00104 i001WT4
P2Education 14 00104 i003Education 14 00104 i003Education 14 00104 i003Education 14 00104 i003Education 14 00104 i003Education 14 00104 i003Education 14 00104 i001Education 14 00104 i001 6
P3Education 14 00104 i003Education 14 00104 i003Education 14 00104 i003Education 14 00104 i003Education 14 00104 i002Education 14 00104 i003Education 14 00104 i001Education 14 00104 i001R35.5
P4Education 14 00104 i003Education 14 00104 i003Education 14 00104 i003Education 14 00104 i003Education 14 00104 i001Education 14 00104 i003Education 14 00104 i001Education 14 00104 i001R3, WT5
P5Education 14 00104 i003Education 14 00104 i003Education 14 00104 i003Education 14 00104 i003Education 14 00104 i003Education 14 00104 i002Education 14 00104 i001Education 14 00104 i001 5.5
P6Education 14 00104 i001Education 14 00104 i003Education 14 00104 i003Education 14 00104 i003Education 14 00104 i001Education 14 00104 i002Education 14 00104 i002Education 14 00104 i003LW5
P7Education 14 00104 i003Education 14 00104 i001Education 14 00104 i001Education 14 00104 i003Education 14 00104 i001Education 14 00104 i001Education 14 00104 i002Education 14 00104 i003LW3.5
P8Education 14 00104 i003Education 14 00104 i003Education 14 00104 i003Education 14 00104 i003Education 14 00104 i001Education 14 00104 i003Education 14 00104 i003Education 14 00104 i001LW6
P9Education 14 00104 i001Education 14 00104 i003Education 14 00104 i001Education 14 00104 i003Education 14 00104 i001Education 14 00104 i001Education 14 00104 i001Education 14 00104 i003MS, WT3
P10Education 14 00104 i003Education 14 00104 i003Education 14 00104 i003Education 14 00104 i003Education 14 00104 i003Education 14 00104 i003Education 14 00104 i001Education 14 00104 i001 6
P11Education 14 00104 i003Education 14 00104 i003Education 14 00104 i003Education 14 00104 i003Education 14 00104 i003Education 14 00104 i003Education 14 00104 i001Education 14 00104 i003 7
P12Education 14 00104 i003Education 14 00104 i003Education 14 00104 i003Education 14 00104 i003Education 14 00104 i003Education 14 00104 i002Education 14 00104 i002Education 14 00104 i003 7
P13Education 14 00104 i001Education 14 00104 i003Education 14 00104 i001Education 14 00104 i003Education 14 00104 i001Education 14 00104 i001Education 14 00104 i001Education 14 00104 i003 3
P14Education 14 00104 i001Education 14 00104 i003Education 14 00104 i003Education 14 00104 i001Education 14 00104 i001Education 14 00104 i001Education 14 00104 i001Education 14 00104 i001 2
Education 14 00104 i003/201418151871027
Moreover, some participants applied the rule of three incorrectly (mistake R3, 4 times). If this was the only mistake during transformation, the solution was evaluated as partially correct (Education 14 00104 i002).
Some participants did not use the result of the simulation to calculate the real-world estimate for the flow network. Instead, the participant took the longest way walked in the flow network and denoted the time it took a person to walk that distance as the result of the simulation, thus ignoring congestion (mistake LW, 3 times). If this was the only mistake during the transformation, the solution was evaluated as partially correct (Education 14 00104 i002), since a slightly different model (without congestion) was used but the solution of this model was calculated correctly.
P7 denoted the execution time (the time the CPU took to calculate the simulation results) as the result of the grid automaton, S6 assumed the execution time was the real-world speed of the agents one had to use for the transformation. P9 calculated the real-world time based on the simulation micro steps (i.e., the number of individual movements of agents) rather than the simulation steps.

Appendix B.3. Consistent Speed

Ten persons used consistent assumptions about the speed of agents.
P5 and P6 assumed a speed of “one step per second” in the grid automaton (i.e., 50 cm/s) but “one meter per second” in the flow network—likely mixing up “one step” with “one meter”. They were evaluated as having partly fulfilled this indicator (Education 14 00104 i002).
Additionally, P12 assumed 6 m/s as the walking speed in the grid automaton but 5 m/s in the flow network. However, the solution highlighted that this was “in the same order of magnitude”. Furthermore, during the recording, the participant justified this verbally by highlighting that physics is also a subject they teach. The solution was evaluated to have partly fulfilled this indicator (Education 14 00104 i002).

Appendix B.4. Size Difference and Configuration Impact

Six participants recognized the difference in the hallway sizes, but only two produced a real-world estimate with a corrected size. Two were evaluated to have fulfilled criteria E6; the other four were evaluated as partly correct (Education 14 00104 i002).
Seven participants denoted the impact of the configuration. S4 did so explicitly: “If enabling movement in eight directions, the result of the grid automaton becomes lower than the one in the flow network.” The other participants did so implicitly by denoting simulation results for different configurations. Out of them, only P7 used the range of results for the following evaluation. Four participants just chose one of the estimates and argued why they ignored the other one. Stated reasons included higher realism (P6, P12), deliberate simplification of the exercise (P11), or alignment to the movements in the flow network (S4).
Two participants (P9, P13) just wrote both results without (explicit or implicit) clarification how this affected their evaluation. P10 denoted that other configurations were available but neither explicitly nor implicitly denoted the impact on the result.
Table A2. Overview of the conclusions reached, arguments used, and SOLO-level.
IDGrid Real.?Flow Real.?SOLO-LevelArguments Used
S1Education 14 00104 i003Education 14 00104 i0012+assertion about magnitude of results; assertion about assumptions
S2??1No clear argumentation given (denial)
S3Education 14 00104 i003Education 14 00104 i0032+Listed Assumptions that must be fulfilled; Argued why Assumptions are fulfilled; Visual Representation of the Simulations; Comprehensibility by Students
S4Education 14 00104 i003Education 14 00104 i0033Listed Assumptions that must be fulfilled; Cross-Validation;Usability of Simulation
S5??2+assertion about magnitude of results; assertion about assumptions
S6Education 14 00104 i003Education 14 00104 i0033Listed Assumptions that must be fulfilled; assertion about assumptions; assertion about magnitude of result
P1Education 14 00104 i001Education 14 00104 i0011+listed assumptions that are not exactly fulfilled
P2??2cross-validation
P3Education 14 00104 i003Education 14 00104 i0033cross-validation; listed assumptions that must be fulfilled
P4Education 14 00104 i001Education 14 00104 i0013assertion about the magnitude of results; listed assumptions that must be fulfilled; details of own solution
P5Education 14 00104 i002Education 14 00104 i0022listed assumptions that must be fulfilled
P6Education 14 00104 i001Education 14 00104 i0011+listed assumptions that are not exactly fulfilled
P7Education 14 00104 i002Education 14 00104 i0022listed assumptions that must be fulfilled
P8??2cross-validation
P9??2+assertion about magnitude of results; usability of software; listed assumptions that are not exactly fulfilled
P10Education 14 00104 i003Education 14 00104 i0033cross-validation; comparison with real-world event
P11??2+listed assumptions that must be fulfilled; analyzed properties of the model; details of own solution
P12??2listed assumptions that must be fulfilled
P13??1No clear argumentation given (tautologizing)
P14Education 14 00104 i002Education 14 00104 i0022listed assumptions that must be fulfilled

References

  1. Forman, E.A. The practice turn in learning theory and science education. In Constructivist Education in an Age of Accountability; Springer: Cham, Switzerland, 2018; pp. 97–111. [Google Scholar] [CrossRef]
  2. Engle, R.A.; Conant, F.R. Guiding principles for fostering productive disciplinary engagement: Explaining an emergent argument in a community of learners classroom. Cogn. Instr. 2002, 20, 399–483. [Google Scholar] [CrossRef]
  3. Kokotsaki, D.; Menzies, V.; Wiggins, A. Project-based learning: A review of the literature. Improv. Sch. 2016, 19, 267–277. [Google Scholar] [CrossRef]
  4. Krajcik, J. Three-dimensional instruction. Sci. Teach. 2015, 82, 50. [Google Scholar]
  5. Hursen, C.; Fasli, F.G. Investigating the Efficiency of Scenario Based Learning and Reflective Learning Approaches in Teacher Education. Eur. J. Contemp. Educ. 2017, 6, 264–279. [Google Scholar] [CrossRef]
  6. Misfeldt, M. Scenario based education as a framework for understanding students engagement and learning in a project management simulation game. Electron. J. E-Learn. 2015, 13, 181–191. [Google Scholar]
  7. Lave, J.; Wenger, E. Situated Learning: Legitimate Peripheral Participation; Cambridge University Press: Cambridge, UK, 1991. [Google Scholar] [CrossRef]
  8. Holbrook, J.; Rannikmae, M. The Nature of Science Education for Enhancing Scientific Literacy. Int. J. Sci. Educ. 2007, 29, 1347–1362. [Google Scholar] [CrossRef]
  9. Herrington, J.; Oliver, R. An instructional design framework for authentic learning environments. Educ. Technol. Res. Dev. 2000, 48, 23–48. [Google Scholar] [CrossRef]
  10. McKenzie, A.D.; Morgan, C.K.; Cochrane, K.W.; Watson, G.K.; Roberts, D.W. Authentic learning: What is it, and what are the ideal curriculum conditions to cultivate it in. In Quality Conversations, Proceedings of the 25th HERDSA Annual Conference, Perth, WA, Australia, 7–10 July 2002; Higher Education Research and Development Society of Australasia, Inc.: Milperra, Australia, 2002; pp. 426–433. Available online: https://citeseerx.ist.psu.edu/document?doi=f0ff25e610b51526b22860eb85192a603321aa30 (accessed on 7 January 2024).
  11. Kaiser, G.; Bracke, M.; Göttlich, S.; Kaland, C. Authentic Complex Modelling Problems in Mathematics Education. In Educational Interfaces between Mathematics and Industry: Report on an ICMI-ICIAM-Study; Springer International Publishing: Cham, Switzerland, 2013; pp. 287–297. [Google Scholar] [CrossRef]
  12. Merritt, J.; Lee, M.Y.; Rillero, P.; Kinach, B.M. Problem-based learning in K–8 mathematics and science education: A literature review. Interdiscip. J. Probl.-Based Learn. 2017, 11, 3. [Google Scholar] [CrossRef]
  13. Priemer, B.; Eilerts, K.; Filler, A.; Pinkwart, N.; Rösken-Winter, B.; Tiemann, R.; Belzen, A.U.Z. A framework to foster problem-solving in STEM and computing education. Res. Sci. Technol. Educ. 2020, 38, 105–130. [Google Scholar] [CrossRef]
  14. Moorthy, K.; Vincent, C.; Darzi, A. Simulation based training. BMJ 2005, 330, 493. [Google Scholar] [CrossRef]
  15. Gegenfurtner, A.; Quesada-Pallarès, C.; Knogler, M. Digital simulation-based training: A meta-analysis. Br. J. Educ. Technol. 2014, 45, 1097–1114. [Google Scholar] [CrossRef]
  16. Buchholtz, N.; Mesrogli, S. A whole week of modelling–examples and experiences of modelling for students in mathematics education. In Teaching Mathematical Modelling: Connecting to Research and Practice; Springer: Dordrecht, The Netherlands, 2013; pp. 307–316. [Google Scholar] [CrossRef]
  17. Greefrath, G.; Wess, R. Mathematical Modeling in Teacher Education—Developing Professional Competence of Pre-Service Teachers in a Teaching–Learning Lab. Proc. Singap. Natl. Acad. Sci. 2022, 16, 25–39. [Google Scholar] [CrossRef]
  18. Siller, H.S.; Greefrath, G.; Wess, R.; Klock, H. Pre-service Teachers’ Self-Efficacy for Teaching Mathematical Modelling. In Advancing and Consolidating Mathematical Modelling: Research from ICME-14; Springer: Cham, Switzerland, 2023; pp. 259–274. [Google Scholar] [CrossRef]
  19. Thompson, A.G. Teaching and Learning Mathematical Problem Solving. In Teaching and Learning Mathematical Problem Solving; Routledge: London, UK, 1985. [Google Scholar] [CrossRef]
  20. Liljedahl, P.; Santos-Trigo, M.; Malaspina, U.; Bruder, R. Problem Solving in Mathematics Education; Springer: Cham, Switzerland, 2016. [Google Scholar] [CrossRef]
  21. Pólya, G.; Conway, J.H. How to Solve It: A New Aspect of Mathematical Method; Princeton University Press: Princeton, NJ, USA, 1957. [Google Scholar]
  22. Hobbs, L.; Clark, J.C.; Plant, B. Successful students–STEM program: Teacher learning through a multifaceted vision for STEM education. In STEM Education in the Junior Secondary: The State of Play; Springer: Singapore, 2018; pp. 133–168. [Google Scholar] [CrossRef]
  23. Just, J.; Siller, H.S. The Role of Mathematics in STEM Secondary Classrooms: A Systematic Literature Review. Educ. Sci. 2022, 12, 629. [Google Scholar] [CrossRef]
  24. Moore, T.J.; Smith, K.A. Advancing the state of the art of STEM integration. J. STEM Educ. Innov. Res. 2014, 15, 5. Available online: https://karlsmithmn.org/wp-content/uploads/2017/08/Moore-Smith-JSTEMEd-GuestEditorialF.pdf (accessed on 7 January 2024).
  25. Chapman, O. Mathematics teachers’ knowledge for teaching problem solving. LUMAT Int. J. Math, Sci. Technol. Educ. 2015, 3, 19–36. [Google Scholar] [CrossRef]
  26. Chapman, O. Constructing Pedagogical Knowledge of Problem Solving: Preservice Mathematics Teachers. Int. Group Psychol. Math. Educ. 2005, 2, 225–232. [Google Scholar]
  27. Podkhodova, N.; Snegurova, V.; Stefanova, N.; Triapitsyna, A.; Pisareva, S. Assessment of Mathematics Teachers’ Professional Competence. J. Math. Educ. 2020, 11, 477–500. [Google Scholar] [CrossRef]
  28. Ramos-Rodríguez, E.; Fernández-Ahumada, E.; Morales-Soto, A. Effective Teacher Professional Development Programs. A Case Study Focusing on the Development of Mathematical Modeling Skills. Educ. Sci. 2022, 12, 2. [Google Scholar] [CrossRef]
  29. Kinay, I.; Bagceci, B. The Investigation of the Effects of Authentic Assessment Approach on Prospective Teachers’ Problem-Solving Skills. Int. Educ. Stud. 2016, 9, 51–59. [Google Scholar] [CrossRef]
  30. Koellner, K.; Jacobs, J.; Borko, H.; Schneider, C.; Pittman, M.E.; Eiteljorg, E.; Bunning, K.; Frykholm, J. The problem-solving cycle: A model to support the development of teachers’ professional knowledge. Math. Think. Learn. 2007, 9, 273–303. [Google Scholar] [CrossRef]
  31. Jasper, B.; Taube, S. Action research of elementary teachers’ problem-solving skills before and after focused professional development. Teach. Educ. Pract. 2005, 17, 299–310. [Google Scholar]
  32. Blömeke, S.; Delaney, S. Assessment of teacher knowledge across countries: A review of the state of research. ZDM 2012, 44, 223–247. [Google Scholar] [CrossRef]
  33. Doerr, H.M. What knowledge do teachers need for teaching mathematics through applications and modelling? In Modelling and Applications in Mathematics Education; Springer: New York, NY, USA, 2007; pp. 69–78. [Google Scholar] [CrossRef]
  34. Funke, J. Complex problem solving. Encyclopedia of the Sciences of Learning; Springer: Berlin/Heidelberg, Germany, 2012; pp. 682–685. [Google Scholar]
  35. Wess, R.; Klock, H.; Siller, H.S.; Greefrath, G. Mathematical Modelling. In Measuring Professional Competence for the Teaching of Mathematical Modelling: A Test Instrument; Springer International Publishing: Cham, Switzerland, 2021; pp. 3–20. [Google Scholar] [CrossRef]
  36. De Fruyt, F.; Wille, B.; John, O.P. Employability in the 21st Century: Complex (Interactive) Problem Solving and Other Essential Skills. Ind. Organ. Psychol. 2015, 8, 276–281. [Google Scholar] [CrossRef]
  37. Jang, H. Identifying 21st century STEM competencies using workplace data. J. Sci. Educ. Technol. 2016, 25, 284–301. [Google Scholar] [CrossRef]
  38. Geisinger, K.F. 21st Century Skills: What Are They and How Do We Assess Them? Appl. Meas. Educ. 2016, 29, 245–249. [Google Scholar] [CrossRef]
  39. Neubert, J.C.; Mainert, J.; Kretzschmar, A.; Greiff, S. The Assessment of 21st Century Skills in Industrial and Organizational Psychology: Complex and Collaborative Problem Solving. Ind. Organ. Psychol. 2015, 8, 238–268. [Google Scholar] [CrossRef]
  40. Greiff, S.; Wüstenberg, S.; Molnár, G.; Fischer, A.; Funke, J.; Csapó, B. Complex problem solving in educational contexts—Something beyond g: Concept, assessment, measurement invariance, and construct validity. J. Educ. Psychol. 2013, 105, 364. [Google Scholar] [CrossRef]
  41. Jacobson, M.J.; Wilensky, U. Complex systems in education: Scientific and educational importance and implications for the learning sciences. J. Learn. Sci. 2006, 15, 11–34. [Google Scholar] [CrossRef]
  42. Ciolan, L.; Ciolan, L.E. Two perspectives, same reality? How authentic is learning for students and for their teachers. Procedia-Soc. Behav. Sci. 2014, 142, 24–28. [Google Scholar] [CrossRef]
  43. Lombardi, M.M.; Oblinger, D.G. Authentic learning for the 21st century: An overview. Educ. Learn. Initiat. 2007, 1, 1–12. [Google Scholar]
  44. Reeves, T.C.; Herrington, J.; Oliver, R. Authentic activities and online learning. In Quality Conversations, Proceedings of the 25th HERDSA Annual Conference, Perth, WA, Australia, 7–10 July 2002; Higher Education Research and Development Society of Australasia, Inc.: Milperra, Australia, 2002; p. 562. Available online: https://ro.ecu.edu.au/cgi/viewcontent.cgi?article=4899&context=ecuworks (accessed on 7 January 2024).
  45. Roehrig, G.H.; Dare, E.A.; Ellis, J.A.; Ring-Whalen, E. Beyond the basics: A detailed conceptual framework of integrated STEM. Discip. Interdiscip. Sci. Educ. Res. 2021, 3, 1–18. [Google Scholar] [CrossRef]
  46. Roth, W.M. Authentic School Science: Knowing and Learning in Open-Inquiry Science Laboratories; Springer: Dordrecht, The Netherlands, 2012; Volume 1. [Google Scholar] [CrossRef]
  47. Anker-Hansen, J.; Andreé, M. In pursuit of authenticity in science education. Nord. Stud. Sci. Educ. 2019, 15, 54–66. [Google Scholar] [CrossRef]
  48. Vos, P. What is ‘authentic’ in the teaching and learning of mathematical modelling? In Trends in Teaching and Learning of Mathematical Modelling; Springer: Dordrecht, The Netherlands, 2011; pp. 713–722. [Google Scholar] [CrossRef]
  49. Heymann, H.W. Why Teach Mathematics?: A Focus on General Education; Springer: Dordrecht, The Netherlands, 2003; Volume 33. [Google Scholar] [CrossRef]
  50. Har, L.B. Authentic Learning. The Active Classroom The Hong Kong Institute of Education. 2013. Available online: https://www.eduhk.hk/aclass/Theories/AuthenticLearning_28June.pdf (accessed on 7 January 2024).
  51. Bhagat, K.K.; Huang, R. Improving Learners’ Experiences through Authentic Learning in a Technology-Rich Classroom. In Authentic Learning Through Advances in Technologies; Springer: Singapore, 2018; pp. 3–15. [Google Scholar] [CrossRef]
  52. Chin, K.Y.; Lee, K.F.; Chen, Y.L. Impact on student motivation by using a QR-based U-learning material production system to create authentic learning experiences. IEEE Trans. Learn. Technol. 2015, 8, 367–382. [Google Scholar] [CrossRef]
  53. Somyürek, S. An effective educational tool: Construction kits for fun and meaningful learning. Int. J. Technol. Des. Educ. 2015, 25, 25–41. [Google Scholar] [CrossRef]
  54. Chen, G.D.; Nurkhamid; Wang, C.Y.; Yang, S.H.; Lu, W.Y.; Chang, C.K. Digital learning playground: Supporting authentic learning experiences in the classroom. Interact. Learn. Environ. 2013, 21, 172–183. [Google Scholar] [CrossRef]
  55. Sadik, A. Digital storytelling: A meaningful technology-integrated approach for engaged student learning. Educ. Technol. Res. Dev. 2008, 56, 487–506. [Google Scholar] [CrossRef]
  56. Pu, Y.H.; Wu, T.T.; Chiu, P.S.; Huang, Y.M. The design and implementation of authentic learning with mobile technology in vocational nursing practice course. Br. J. Educ. Technol. 2016, 47, 494–509. [Google Scholar] [CrossRef]
  57. Hallström, J.; Schönborn, K.J. Models and modelling for authentic STEM education: Reinforcing the argument. Int. J. STEM Educ. 2019, 6, 1–10. [Google Scholar] [CrossRef]
  58. Gilbert, J.K. Models and modelling: Routes to more authentic science education. Int. J. Sci. Math. Educ. 2004, 2, 115–130. [Google Scholar] [CrossRef]
  59. Gilbert, S.W. Model Building and Definition of Science. J. Res. Sci. Teach. 1991, 28, 73–79. [Google Scholar] [CrossRef]
  60. Blum, W.; Niss, M. Applied mathematical problem solving, modelling, applications, and links to other subjects—State, trends and issues in mathematics instruction. Educ. Stud. Math. 1991, 22, 37–68. [Google Scholar] [CrossRef]
  61. Tomasi, J. Models and modeling in theoretical chemistry. J. Mol. Struct. THEOCHEM 1988, 179, 273–292. [Google Scholar] [CrossRef]
  62. Bevana, N.; Kirakowskib, J.; Maissela, J. What is usability. In Proceedings of the 4th International Conference on HCI 1991, Stuttgart, Germany, 1–6 September 1991; pp. 1–6. [Google Scholar]
  63. Pluta, W.J.; Chinn, C.A.; Duncan, R.G. Learners’ epistemic criteria for good scientific models. J. Res. Sci. Teach. 2011, 48, 486–511. [Google Scholar] [CrossRef]
  64. Apostel, L. Towards the formal study of models in the non-formal sciences. In The Concept and the Role of the Model in Mathematics and Natural and Social Sciences; Springer: Dordrecht, The Netherlands, 1961; pp. 1–37. [Google Scholar] [CrossRef]
  65. Brinda, T.; Fothe, M.; Friedrich, S.; Koerber, B.; Puhlmann, H.; Röhner, G.; Schulte, C. Grundsätze und Standards für die Informatik in der Schule-Bildungsstandards Informatik für die Sekundarstufe I. 2008. Available online: https://informatikstandards.de/fileadmin/GI/Projekte/Informatikstandards/Dokumente/bildungsstandards_2008.pdf (accessed on 7 January 2024).
  66. Greefrath, G.; Siller, H.S.; Weitendorf, J. Modelling considering the influence of technology. In Trends in Teaching and Learning of Mathematical Modelling; Springer: Dordrecht, The Netherlands, 2011; pp. 315–329. [Google Scholar] [CrossRef]
  67. Geiger, V. Factors affecting teachers’ adoption of innovative practices with technology and mathematical modelling. In Trends in Teaching and Learning of Mathematical Modelling; Springer: Dordrecht, The Netherlands, 2011; pp. 305–314. [Google Scholar] [CrossRef]
  68. Kaiser, G. Mathematical Modelling and Applications in Education. In Encyclopedia of Mathematics Education; Springer: Dordrecht, The Netherlands, 2014; pp. 396–404. [Google Scholar] [CrossRef]
  69. Banks, J. Discrete Event System Simulation; Pearson Education: Delhi, India, 2005. [Google Scholar]
  70. Kaiser, G.; Stender, P. Complex modelling problems in co-operative, self-directed learning environments. In Teaching Mathematical Modelling: Connecting to Research and Practice; Springer: Dordrecht, The Netherlands, 2013; pp. 277–293. [Google Scholar] [CrossRef]
  71. Ortlieb, C.P. Mathematische Modelle und Naturerkenntnis; Universität Hamburg, Fachbereich Mathematik: Hamburg, Germany, 2001. [Google Scholar] [CrossRef]
  72. Blum, W.; Leiß, D. Deal with modelling problems. Math. Model. Educ. Eng. Econ.-ICTMA 2007, 12, 222. [Google Scholar]
  73. Ferri, R.B. 5.5—Modelling Problems from a Cognitive Perspective. In Mathematical Modelling; Haines, C., Galbraith, P., Blum, W., Khan, S., Eds.; Woodhead Publishing: Sawston, UK, 2007; pp. 260–270. [Google Scholar] [CrossRef]
  74. Doerr, H.M.; Ärlebäck, J.B.; Misfeldt, M. Representations of modelling in mathematics education. In Mathematical Modelling and Applications; Springer: Cham, Switzerland, 2017; pp. 71–81. [Google Scholar] [CrossRef]
  75. Czocher, J.; Stillman, G.; Brown, J. Verification and Validation: What Do We Mean? In Making Waves, Opening Spaces; Mathematics Education Research Group of Australasia: Adelaide, Australia, 2018; pp. 250–257. Available online: http://files.eric.ed.gov/fulltext/ED592478.pdf (accessed on 7 January 2024).
  76. Carson, J. Model verification and validation. In Proceedings of the Winter Simulation Conference, San Diego, CA, USA, 8–11 December 2002; Volume 1, pp. 52–58. [Google Scholar] [CrossRef]
  77. Whitner, R.B.; Balci, O. Guidelines for Selecting and Using Simulation Model Verification Techniques. In Proceedings of the 21st Conference on Winter Simulation, Washington, DC, USA, 4–6 December 1989; pp. 559–568. [Google Scholar] [CrossRef]
  78. Kleijnen, J.P. Verification and validation of simulation models. Eur. J. Oper. Res. 1995, 82, 145–162. [Google Scholar] [CrossRef]
  79. Schlesinger, S. Terminology for model credibility. Simulation 1979, 32, 103–104. [Google Scholar] [CrossRef]
  80. Brown, J.P.; Stillman, G.A. Developing the roots of modelling conceptions: ‘Mathematical modelling is the life of the world’. Int. J. Math. Educ. Sci. Technol. 2017, 48, 353–373. [Google Scholar] [CrossRef]
  81. Stillman, G. Impact of prior knowledge of task context on approaches to applications tasks. J. Math. Behav. 2000, 19, 333–361. [Google Scholar] [CrossRef]
  82. Czocher, J.A.; Moss, D.L. Mathematical modeling: Are prior experiences important? Math. Teach. 2017, 110, 654–660. [Google Scholar] [CrossRef]
  83. Browne, M.W. Cross-validation methods. J. Math. Psychol. 2000, 44, 108–132. [Google Scholar] [CrossRef] [PubMed]
  84. Sargent, R.G. Simulation model verification and validation. In Proceedings of the 1991 Winter Simulation Conference Proceedings, Phoenix, AZ, USA, 8–11 December 1991. [Google Scholar] [CrossRef]
  85. Ling, Y.; Mahadevan, S. Quantitative model validation techniques: New insights. Reliab. Eng. Syst. Saf. 2013, 111, 217–231. [Google Scholar] [CrossRef]
  86. Redish, E. Using Math in Physics: 4. Toy Models. Phys. Teach. 2021, 59, 683–688. [Google Scholar] [CrossRef]
  87. Biggs, J.B.; Collis, K.F. Evaluating the Quality of Learning: The SOLO Taxonomy (Structure of the Observed Learning Outcome); Academic Press: Cambridge, MA, USA, 2014. [Google Scholar]
  88. Collis, K.F. A Study of Concrete and Formal Operations in School Mathematics: A Piagetian Viewpoint; Australian Council for Educational Research: Melbourne, Australia, 1975. [Google Scholar] [CrossRef]
  89. Greubel, A.; Siller, H.S.; Hennecke, M. Teaching Simulation Literacy with Evacuations. In Proceedings of the European Conference on Technology Enhanced Learning, Heidelberg, Germany, 14–18 September 2020; pp. 200–214. [Google Scholar] [CrossRef]
  90. Greubel, A.; Siller, H.S.; Ruzika, S.; Knippertz, L. Teaching Mathematical Modeling with Computing Technology: Presentation of a Course based on Evacuations. In Proceedings of the 17th Workshop in Primary and Secondary Computing Education, Morschach, Switzerland, 31 October–2 November 2022. [Google Scholar] [CrossRef]
  91. Li, Y.; Chen, M.; Dou, Z.; Zheng, X.; Cheng, Y.; Mebarki, A. A review of cellular automata models for crowd evacuation. Phys. A Stat. Mech. Appl. 2019, 526, 120752. [Google Scholar] [CrossRef]
  92. Cova, T.J.; Johnson, J.P. A network flow model for lane-based evacuation routing. Transp. Res. Part A Policy Pract. 2003, 37, 579–604. [Google Scholar] [CrossRef]
  93. Yamada, T. A network flow approach to a city emergency evacuation planning. Int. J. Syst. Sci. 1996, 27, 931–936. [Google Scholar] [CrossRef]
  94. Kari, J. Theory of cellular automata: A survey. Theor. Comput. Sci. 2005, 334, 3–33. [Google Scholar] [CrossRef]
  95. Greubel, A.; Siller, H.S.; Hennecke, M. EvaWeb: A Web App for Simulating the Evacuation of Buildings with a Grid Automaton. In Proceedings of the 16th European Conference on Technology Enhanced Learning, EC-TEL 2021, Bolzano, Italy, 20–24 September 2021. [Google Scholar] [CrossRef]
  96. Shen, T.S. ESM: A building evacuation simulation model. Build. Environ. 2005, 40, 671–680. [Google Scholar] [CrossRef]
  97. Tan, L.; Hu, M.; Lin, H. Agent-based simulation of building evacuation: Combining human behavior with predictable spatial accessibility in a fire emergency. Inf. Sci. 2015, 295, 53–66. [Google Scholar] [CrossRef]
  98. Pelechano, N.; Malkawi, A. Evacuation simulation models: Challenges in modeling high rise building evacuation with cellular automata approaches. Autom. Constr. 2008, 17, 377–385. [Google Scholar] [CrossRef]
  99. Dimakis, N.; Filippoupolitis, A.; Gelenbe, E. Distributed building evacuation simulator for smart emergency management. Comput. J. 2010, 53, 1384–1400. [Google Scholar] [CrossRef]
  100. National Research Council. A Framework for K-12 Science Education: Practices, Crosscutting Concepts, and Core Ideas; National Academies Press: Washington, DC, USA, 2012. [CrossRef]
  101. Monnet, J. Informatics Education at School in Europe; Publications Office of the European Union: Luxembourg, 2022. [Google Scholar] [CrossRef]
  102. Bocconi, S.; Chioccariello, A.; Dettori, G.; Ferrari, A.; Engelhardt, K. Developing Computational Thinking in Compulsory Education: Joint Research Center (European Commission); Publications Office of the European Union: Luxembourg, 2016. [Google Scholar] [CrossRef]
  103. Van Someren, M.; Barnard, Y.; Sandberg, J. The Think Aloud Method: A Practical Approach to Modelling Cognitive Processes; Academic Press: London, UK, 1994; Available online: https://pure.uva.nl/ws/files/716505/149552_Think_aloud_method.pdf (accessed on 7 January 2024).
  104. Alias, M.; Masek, A.; Salleh, H. Self, Peer and Teacher Assessments in Problem Based Learning: Are They in Agreements? Procedia-Soc. Behav. Sci. 2015, 204, 309–317. [Google Scholar] [CrossRef]
  105. Baars, M.; Vink, S.; Van Gog, T.; De Bruin, A.; Paas, F. Effects of training self-assessment and using assessment standards on retrospective and prospective monitoring of problem solving. Learn. Instr. 2014, 33, 92–107. [Google Scholar] [CrossRef]
  106. Chen, P. Relationship between Students’ Self-Assessment of Their Capabilities and Their Teachers’ Judgments of Students’ Capabilities in Mathematics Problem-Solving. Psychol. Rep. 2006, 98, 765–778. [Google Scholar] [CrossRef] [PubMed]
  107. Falchikov, N.; Goldfinch, J. Student Peer Assessment in Higher Education: A Meta-Analysis Comparing Peer and Teacher Marks. Rev. Educ. Res. 2000, 70, 287–322. [Google Scholar] [CrossRef]
  108. Ross, J.; Bruce, C. Teacher self-assessment: A mechanism for facilitating professional growth. Teach. Teach. Educ. 2007, 23, 146–159. [Google Scholar] [CrossRef]
  109. Brouwers, A.; Tomic, W. A longitudinal study of teacher burnout and perceived self-efficacy in classroom management. Teach. Teach. Educ. 2000, 16, 239–253. [Google Scholar] [CrossRef]
  110. Cancro, G. The Interrelationship of Organizational Climate, Teacher Self-Efficacy, and Perceived Teacher Autonomy. Ph.D. Thesis, Fordham University, New York, NY, USA, 1992; p. 146. Available online: https://www.proquest.com/dissertations-theses/interrelationship-organizational-climate-teacher/docview/303980667/se-2 (accessed on 7 January 2024).
  111. Ross, J. The reliability, validity, and utility of self-assessment. Pract. Assess. Res. Eval. 2019, 11, 10. [Google Scholar] [CrossRef]
  112. Kuckartz, U. Qualitative text analysis: A systematic approach. In Compendium for Early Career Researchers in Mathematics Education; Springer: Cham, Switzerland, 2019; pp. 181–197. [Google Scholar] [CrossRef]
  113. Forehand, M. Bloom’s taxonomy: Original and revised. Emerg. Perspect. Learn. Teach. Technol. 2005, 8, 41–44. [Google Scholar]
  114. Pernet, C.R.; Wilcox, R.; Rousselet, G.A. Robust Correlation Analyses: False Positive and Power Validation Using a New Open Source Matlab Toolbox. Front. Psychol. 2013, 3, 606. [Google Scholar] [CrossRef]
  115. Cohen, J. Statistical Power Analysis for the Behavioral Sciences; Academic Press: Cambridge, MA, USA, 2013. [Google Scholar] [CrossRef]
  116. Furnham, A.; Grover, S. Correlates of Self-Estimated Intelligence. J. Intell. 2020, 8, 6. [Google Scholar] [CrossRef]
  117. Dunning, D. The Dunning–Kruger Effect: On Being Ignorant of One’s Own Ignorance. In Advances in Experimental Social Psychology; Elsevier: Amsterdam, The Netherlands, 2011; Volume 44, pp. 247–296. [Google Scholar] [CrossRef]
Figure 1. Different model types. Image: https://stock.adobe.com/de/images/old-wheel/112747036 (accessed on 1 January 2024).
Education 14 00104 g001
Figure 2. (Left): Visual representation from introductory text. (Right): The result table after execution of this scenario with standard configuration (screenshot from simulation).
Education 14 00104 g002
Figure 3. (Left): Visual representation from the introductory text. (Right): The result table after execution of this scenario with standard configuration (screenshot from simulation).
Education 14 00104 g003
Figure 4. Exercises used to formulate the problem (abbreviated). The full exercise sheet (including the introductory texts) is available at https://evadid.it/workbook/20220420StudyExEng.pdf (accessed on 1 January 2024).
Education 14 00104 g004
Figure 5. (Left): Visualization of the hallways as implemented in both simulation environments. (Right): The properties of the edge selected in the flow network (highlighted in yellow).
Education 14 00104 g005
Figure 6. Histogram of the point score of the participants (half points are possible).
Education 14 00104 g006
Figure 7. Histogram of the SOLO-levels of participants (intermediary levels are possible).
Education 14 00104 g007
Figure 8. Chart of the point score and the SOLO level of the participants. The answer to the question “I feel sufficiently technically educated to solve such problems” is denoted as icon: Education 14 00104 i004 = agree, Education 14 00104 i005 = rather agree, Education 14 00104 i006 = neutral, Education 14 00104 i007 = rather disagree. The participant with the empty icon did not answer the question.
Education 14 00104 g008
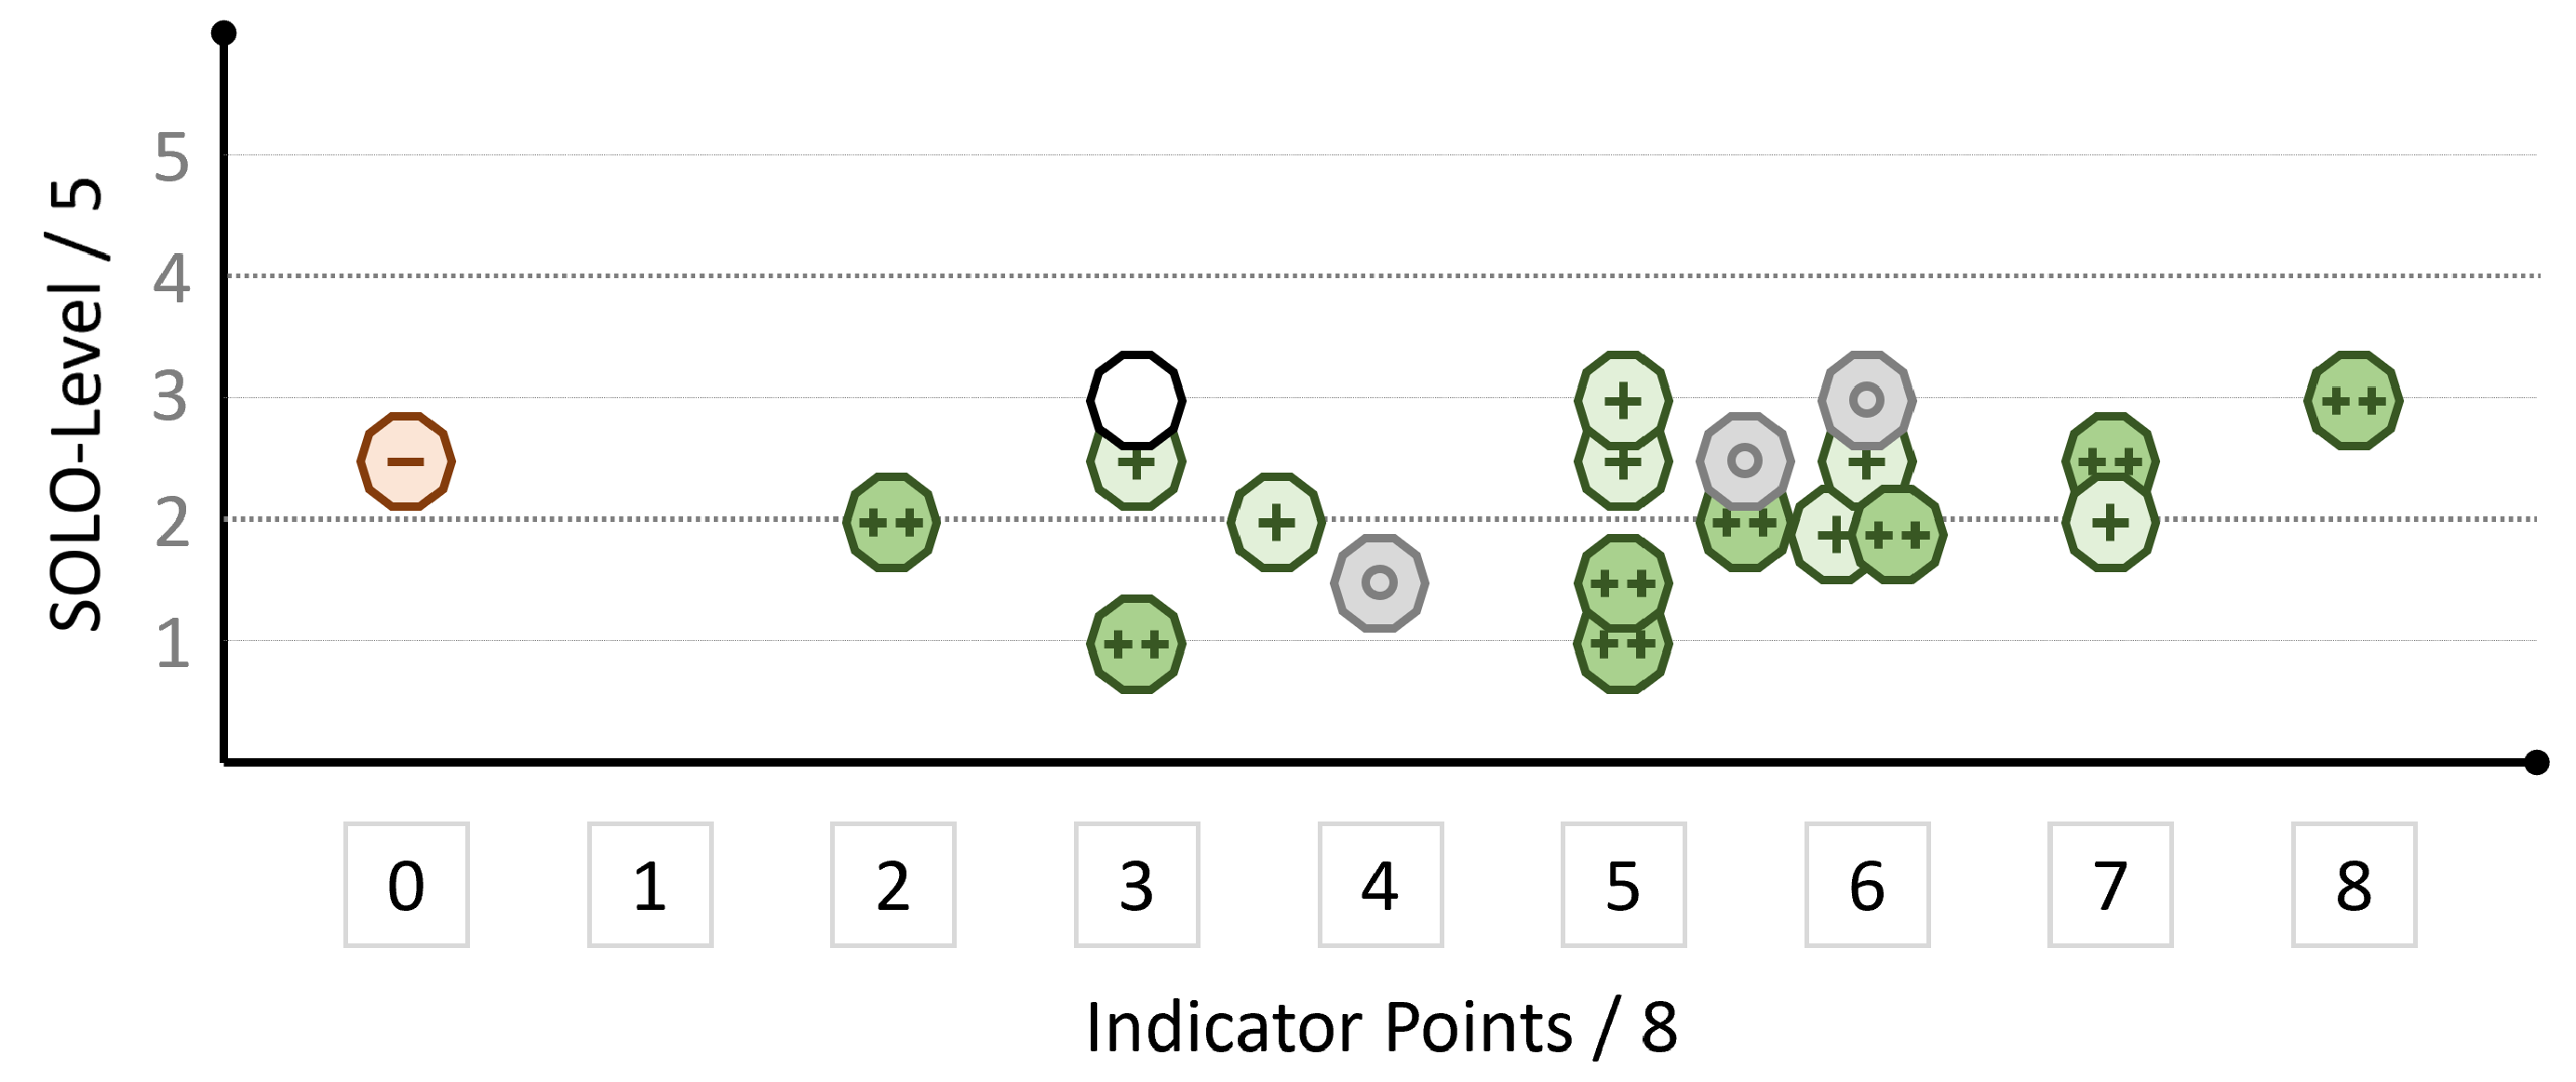
Disclaimer/Publisher’s Note: The statements, opinions and data contained in all publications are solely those of the individual author(s) and contributor(s) and not of MDPI and/or the editor(s). MDPI and/or the editor(s) disclaim responsibility for any injury to people or property resulting from any ideas, methods, instructions or products referred to in the content.

