Article

The Role of Visual Representations in Undergraduate Students’ Learning about Genetic Inheritance

by
David Menendez
1,*,
Andrea Marquardt Donovan
2,
Olympia N. Mathiaparanam
3,4,
Rebecca E. Klapper
3,4,
Seung Heon Yoo
3,4,
Karl S. Rosengren
3,4 and
Martha W. Alibali
2
1
Department of Psychology, University of California-Santa Cruz, Santa Cruz, CA 95060, USA
2
Department of Psychology, University of Wisconsin-Madison, Madison, WI 53706, USA
3
Department of Psychology, University of Rochester, Rochester, NY 14611, USA
4
Department of Brain and Cognitive Sciences, University of Rochester, Rochester, NY 14611, USA
*
Author to whom correspondence should be addressed.
Educ. Sci. 2024, 14(3), 307; https://doi.org/10.3390/educsci14030307
Submission received: 9 February 2024 / Revised: 6 March 2024 / Accepted: 8 March 2024 / Published: 14 March 2024
(This article belongs to the Special Issue Visualization in Biology Education)

Abstract

:
Prior work has shown that many undergraduate students have misconceptions about genetic inheritance, even after they take genetics courses. Visual representations, such as pedigree diagrams, are commonly used in genetics instruction, and they help students quickly visualize the phenotypes of multiple generations. In Study 1, we examined whether presenting a pedigree diagram of a wolf’s eye color in a rich and realistic manner (i.e., with rich perceptual images that resemble real animals) or in an abstract manner (i.e., with circles and squares representing animals) would help undergraduates learn from a brief, online lesson on inheritance of the wolf’s eye color, and whether they would transfer what they learned when reasoning about eye color in other species (near transfer) and other traits in other species (mid- and far transfer). Counter to our hypothesis, students transferred more with the rich diagram. In Study 2, we compared the rich diagram from Study 1 to a perceptually bland diagram (i.e., with color and textural features removed). There were no differences in students’ learning or transfer between the diagrams. These results suggest that realistic elements that are attention grabbing and easily interpretable by students can be beneficial for transfer in online lessons.

1. Introduction

Genetic inheritance is a foundational topic in biology education, as it provides a mechanism for how organisms obtain their traits. An understanding of the processes involved in genetics is critical for understanding within-species variation [1,2] and evolution through natural selection [3]. The importance of learning about genetics is highlighted by its inclusion in the standards for science education in the United States [4] and many other countries [5,6]. However, students often have difficulties understanding genetic inheritance [7,8,9]. Understanding genetics for a specific organism presented in a lesson is important, and it is also critical that students learn to transfer from the examples provided in lessons, though such transfer is often limited [10,11].
One tool that teachers and curricular materials commonly use to support students’ learning of genetics is visual representations. Visual representations are diagrams, images, photographs, and other materials, such as pedigree diagrams, that provide learners with a visual depiction of a concept [12]. In this paper, we report two studies that examined whether different types of visual representations presented during a genetics lesson varied in their effectiveness for helping students learn and transfer from the lesson.

2. Understanding of Genetics

By age 3, children understand that organisms inherit their traits from their parents, and their understanding becomes more sophisticated with age [13,14,15]. Despite these early understandings, people’s reasoning about genetic inheritance is also susceptible to cognitive biases and misconceptions. Two cognitive biases, also called cognitive construals [16], are (1) essentialism, which is the belief that organisms have an innate essence that determines their characteristics [17], and (2) teleology, which is the belief that an organism’s characteristics were designed to achieve a particular goal or purpose [18,19]. These biases influence many aspects of how people think, and more specifically, how people think about biology [20].
People also have specific misconceptions about genetic inheritance. One such misconception is the perceptual similarity bias, which is the tendency to think that offspring phenotypes that are more similar to their parents are more likely than those that are dissimilar to their parents [21]. If both parents have the exact same phenotype for a given trait (e.g., brown eyes), then their offspring are indeed more likely to also express that phenotype (brown eyes). This misconception applies when the offspring’s phenotype is not exactly the same as the parents. That is, if both parents have brown eyes, it is possible that the offspring might have a different eye color than the parents (e.g., yellow or green eyes). Given the complexity of genetic inheritance, particularly for traits that depend on multiple genes, both eye colors might be similarly (un)likely (but plausible). However, even adults who have learned about genetics rely on perceptual similarity to judge whether a phenotype is possible and to estimate how likely it is. Another misconception about genetic inheritance is the sex-matching bias, which is the tendency to think that organisms are more likely to resemble the parent of the same sex [21]. Although some traits are in fact sexually dimorphic or sex-linked, people apply this bias to many traits, including those that are not sexually dimorphic. Menendez, Mathiaparanam, et al. [21] showed that many undergraduate students believe that animals will resemble the parent of the same sex, even for traits like eye color that are not sex-linked in humans or in any of the animals used in their study. These two misconceptions are evident in children as young as 4 years of age [22]. This suggests that these misconceptions are stable across development and they appear to be resistant to instruction, as college students who have learned about genetics continue to exhibit them. These misconceptions are the focus of the lesson we presented to the students in this study.

3. Visual Representations in Biology Education

Visual representations are common in educational materials across a range of content domains [23,24]. Visual representations in biology books tend to be perceptually rich, including features such as color, shading, and texture, which make the images appear realistic and similar to their real-world counterparts [25,26]. However, as students progress to higher grade levels, they are exposed to progressively more bland and abstract visual representations [25]. In higher grades, visual representations typically have fewer perceptually rich features and use more symbols and conventions, such as shapes or arrows, to convey information [25,27,28]. This leads to at least three types of visual representations: (a) perceptually rich, realistic visual representations, which are colorful and have details that resemble their real-life referents, (b) perceptually bland visual representations, which have fewer details, but still contain basic elements (e.g., overall outline) of their real-life referents, and (c) abstract visual representations, which use symbols with no resemblance to their real-life referents [29]. In this paper, we focus on these three types of visual representations, as they have received substantial attention in psychological and educational research, and they have been found to influence learning and generalization.
These different ways of presenting information can have consequences for students’ learning and transfer. Perceptually rich visual representations are attention grabbing [30,31,32], which can be beneficial for guiding attention to the visual representations [33]. However, perceptually rich visual representations may guide attention to irrelevant information, which has been shown to reduce learning and transfer [34,35]. Students can also use perceptually rich features as cues to help them recall the information at a later date [36], though this may also increase cognitive load [37]. Overall, the findings on the effects of different visual representations are mixed, and it is unknown whether perceptually rich visual representations are generally beneficial or generally detrimental to learning and transfer.
There is evidence to suggest that abstract representations might be beneficial for transfer beyond the specific example used in the lesson [38,39,40]. This may be due to abstract representations being conceptually distanced from any one specific example. Theories of learning and transfer have proposed that presenting abstract information to students enhances the likelihood that they will transfer the information, as this information is less tied to a specific context [38,41].This conceptual distancing might make it easier for students to apply what they learned in a lesson to new examples. However, if the representations become too abstract (e.g., by using too many symbols or shapes to stand in for specific features), students may have difficulty understanding the symbolic elements of abstract representations and what they represent [28,42,43,44]. This can be particularly problematic if teachers do not explain how the symbols are related to what they represent, which can lead to confusion among students [45,46]. Furthermore, recent studies suggest that when rich visual representations highlight relevant aspects of the lesson, then they are just as effective as abstract visual representations at promoting transfer [47,48].
Finally, perceptually bland visual representations have been found to increase transfer while not decreasing learning [25,49]. Studies suggest that the increased transfer may be due to students interpreting the visual representations as more general (e.g., as depicting insects instead of ladybugs [50]), while preserving critical features so that relevant aspects of the depicted entity are readily grasped [51]. But it is worth noting that not every study has found an advantage for bland visual representations over rich ones (see [52,53] for examples). It may be that bland visual representations are not always sufficiently attention grabbing to support students’ learning and, at the same time, not sufficiently abstract to support transfer.
Taken together, the results of past research have created a complex landscape of findings, such that particular modes of visual representation may be beneficial, but the effect may depend on whether students are familiar with the symbols, whether the visual features are irrelevant or distracting, and whether the research is assessing learning or transfer. Given that prior studies have found differences between rich, abstract, and bland visual representations in both learning and transfer, the current studies examine how these visual representations might influence the learning and transfer of genetic inheritance concepts. Prior research on transfer has taken one of two approaches: (1) examining whether students transfer to any new exemplar [49] or (2) examining how transfer depends on the similarity (both in terms of the animal and the trait) between the exemplar in the lesson and the one in the test [54]. In the current studies, we take the second approach, considering transfer to increasingly dissimilar exemplars from the one in the lesson in order to examine how the features of the visual representations influence how far students transfer.

4. Current Studies

In the present studies, we provided undergraduate students with a lesson about genetic inheritance that included either perceptually rich or abstract visual representations (Study 1) or that included either perceptually rich or perceptually bland visual representations (Study 2), and we tested their learning and transfer from the lesson. The purpose of these studies was not to assess perception of the representations, but to investigate how perceptual information might influence how people interpret representations in educational contexts, and how this could influence learning and transfer. Both studies were conducted in the spring of 2021, and due to concerns about COVID-19, both studies were conducted online. Therefore, we used an online experimental methodology and used quantitative data analysis techniques to explore how undergraduate students think about genetic inheritance before and after a brief lesson, and to examine how the diagram presented during the lesson influences undergraduate students’ learning and generalization. To examine how students think about genetic inheritance before and after a lesson, we used the two tasks used by Menendez et al. [21] to identify the perceptual similarity and sex-matching misconceptions. The phenotypic judgment task assessed whether students believe that certain offspring are possible, and the offspring prediction task assessed whether students believe that certain offspring are more likely. The lesson targeted the common misconceptions described earlier by focusing on the fact that offspring can look very different from their parents (challenging the perceptual similarity bias) and that offspring receive the same amount of genetic information from each parent (challenging the sex-matching bias). The visual representations in the lesson were pedigree diagrams. This type of diagram shows the phenotypes of members of an animal family, and such diagrams are commonly used during genetics instruction [55]. Pedigree diagrams used in biology instruction can be presented with realistic images (e.g., with images depicting individual animals and phenotypes) or abstract images (e.g., using circles and squares to represent male and female individuals and using color to represent phenotypes).
Given that transfer was one focus of the current studies, after the lesson, we assessed how students thought about genetics with species and traits that were different from those in the lesson. The lesson explained genetic inheritance using wolf eye color as the example. The first item in the post-test was about wolf eye color (i.e., the same animal and trait as in the lesson), and we used this item to assess learning. The second item was about fox eye color (i.e., the same trait as in the lesson, but a different animal); we considered this item to reflect near transfer. The third item was about ear size in fennec foxes (i.e., a different trait and a different animal); we considered this item to reflect mid-level transfer. Finally, the fourth item was about fin type in bass (i.e., a very different species and a different trait); we considered this item to reflect far transfer.
Both of the studies were pre-registered, including both the hypotheses and the planned statistical analyses. For the effect of visual representations, we hypothesized that students would transfer more when they learned with the abstract diagram (Study 1) or the perceptually bland diagram (Study 2) than when they learned with the rich diagram. Even though there are disagreements in the literature about which type of visual representation is better for student learning, many of the results for transfer show an advantage for abstract or bland visual representations over rich ones [25,39,40,49,51]. The results would support this idea if participants were more likely to judge that offspring that are dissimilar to the parents are possible in the phenotypic judgment task (i.e., an increase in the likelihood that participants endorsed these offspring as possible), and if participants were more likely to respond that these offspring are likely in the offspring prediction task (i.e., an increase in the likelihood that participants selected these offspring).

5. Study 1: Rich vs. Abstract Visual Representations

All of the materials, data, and analysis scripts for this study can be found at https://osf.io/4bt8h/?view_only=de690a5b73c0480dbb64e253a11170ad (accessed on 6 February 2024). The pre-registration for this study can be found at https://osf.io/fzrg6/?view_only=635da3bdc1fc4e2c84d220e08ea30181 (accessed on 6 February 2024).

5.1. Method

5.1.1. Participants

As pre-registered, we recruited 160 undergraduate students from an Introduction to Psychology course at a large midwestern university (one additional student started but did not complete the study and thus their data were excluded). We determined this sample size based on previous studies examining the effects of diagram features on learning and transfer in biology [49]. Two participants were excluded because they failed the attention checks (details below), yielding a final sample of 158 participants (71 men, 86 women, and 1 non-binary individual). Per self-report, 113 participants identified as white, 7 as Black or African American, 26 as Asian or Asian American, 6 as Latinx or Hispanic, 1 as Arab, 1 as Pacific Islander, and 2 as bi- or multi-racial; 2 did not report racial or ethnic information.

5.1.2. Design

This study was unmoderated and used a pre-test–lesson–post-test design. In the pre-test, participants answered questions about two animals: wolves and beavers. For both animals, participants first completed the phenotypic judgment task, followed by the offspring prediction task. For the offspring prediction task, we randomized whether participants first answered about male or female offspring. After completing the pre-test, participants received a lesson about genetic inheritance. Participants were randomly assigned to see either a perceptually rich or an abstract pedigree diagram (see Figure 1). After the lesson, we asked participants two simple comprehension questions. They then completed the phenotypic judgment task and the offspring prediction task for four animals: wolves, foxes, fennec foxes, and bass.

5.1.3. Procedure

Participants completed the study online, using the platform Qualtrics. Participants provided informed consent electronically before participating in the study. For each animal, participants completed the phenotypic judgment task followed by the offspring prediction task. In the pre-test, participants saw two animal families: wolves (with both parents having light yellow eyes) and beavers (with the mother having dark brown eyes and the father having light brown eyes). Then, participants viewed the lesson. After the lesson, they answered the comprehension questions and then completed the post-test. The post-test was comprised of four animal families: wolves (with both parents having light yellow eyes), foxes (with the mother having dark brown eyes and the father having light brown eyes), fennec foxes (with the mother having small ears and the father having big ears), and bass (with both parents having spikey fins). The animals were presented to participants in the order listed. This order reflects the increasing distance between the exemplar in the lesson and the target animal in the post-test, which requires progressively further transfer [54]. First, participants saw the example that was used in the lesson with the same trait that was in the focus of the lesson (i.e., wolf eye color), and thus we refer to performance on this item as “learning” from here on. Then, we presented participants with an item with the same trait but in a different mammal (i.e., eye color, but in foxes); we refer to performance on this item as “near transfer” from here on. Then, we presented participants with an item with a different trait in a different mammal (i.e., ear size in fennec foxes); we refer to performance on this item as “mid transfer” from here on. Finally, we presented participants with an item with a different trait in a non-mammal (i.e., fin type in bass); we refer to performance on this item as “far transfer” from here on. In the pre-test and post-test, we included one attention check to make sure participants were reading the questions. This attention check showed them a drawing of an animal labeled with the species name and asked them to select the species name from a list of choices.

5.1.4. Materials

Phenotypic judgment task. We used the phenotypic judgment task from Menendez et al. [21]. In this task, participants saw drawings of the mother and father of an animal family. The parents had either the same or different phenotypes (e.g., both had green eyes, or one had green eyes and the other had brown eyes). The participants were then presented with drawings of different offspring options, one at a time, and were asked if the animal pictured could be an offspring of the mother and father shown. There were five types of offspring shown, including offspring that (1) resembled one or both parents (e.g., green eyes), (2) resembled the other parent, (3) had a blend of the phenotypes by having part of each phenotype (e.g., one green eye and one brown eye), (4) had a blend of the phenotypes by having a mixture of the two phenotypes (e.g., eyes with a color in-between green and brown), or (5) had an unrelated phenotype (e.g., purple eyes). Participants saw all options in a randomized order. Hereafter we refer to types (3) and (4) as “blends”.
Offspring prediction task. We also used the offspring prediction task from Menendez et al. [21]. In this task, participants saw the same animal parents as in the phenotypic judgment task, and they were told that the parents had six offspring, three males and three females, throughout their lives. Participants were then presented with the same five offspring choices and were instructed to select offspring to show what the three male and three female offspring would look like. We randomized whether participants answered for the male or female offspring first for each participant and for each animal. Then, participants were asked to write an explanation for their selections in a text box.
Lesson. All participants received a short lesson about genetics using wolf families as examples. The lesson consisted of a 97s video that participants viewed. There was no text for participants to read, and the only information shown was the pedigree diagram (more information on the diagram is provided below). The voice-over in the lesson stated that (1) all organisms have genetic information, (2) this genetic information is in their cells, (3) this genetic information determines how an organism will look, (4) parents pass genetic information to their offspring, (5) an offspring receives half of their genetic material from each parent, and (6) the offspring may resemble either parent or may look different from either parent. These topics have been proposed as key topics in learning progressions for genetics [56].
The lesson included several examples of wolves with various eye colors, using three families depicted in a pedigree diagram. Participants were randomly assigned to see either a perceptually rich or an abstract pedigree diagram (see Figure 1). Both versions of the pedigree diagram depicted one set of parents with the same eye color and one set with different eye colors. Participants were told that both families had offspring that looked like one of the parents (or both parents, in the same eye color family). Participants were told that these two offspring (that had different eye colors) got together and had four offspring, one with the father’s eye color, one with the mother’s eye color, and two with different eye colors. The lessons were identical except for the diagram that participants saw (i.e., the rich or the abstract visual representation). A full lesson script is presented in the Supplemental Materials.
As seen in Figure 1, the perceptually rich diagram used realistic drawings of wolf faces, which showed the eyes, but which did not differentiate visually between male and female wolves. The abstract diagram used geometric shapes to represent the animals. Male wolves were shown with squares and females with circles. The color inside the shape represented the eye color of the respective wolf. These conventions are typical for pedigree diagrams [55], but they were not explicitly described in the lesson. During the lesson, the diagram did not appear all at once. First, we presented the family on the top left. We used red square outlines to highlight the mother, father, and offspring when they were mentioned in the lesson. Then, we presented the family on the top right, using similar highlighting. Finally, we presented the family at the bottom. The timing and highlighting for both lessons were identical, so that the only difference between conditions was in the diagram that was presented.
Comprehension questions. We asked participants two simple comprehension questions immediately after the lesson. The first question was “How many generations of animals were shown in the lesson?”, with “1”, “2”, or “3” as response options. The second question was “Which of these eye colors was mentioned in the lesson?”, with “blue”, “brown”, or “purple” as the response options. We accepted “3” and “brown” as correct answers.

5.1.5. Data Analytic Strategy
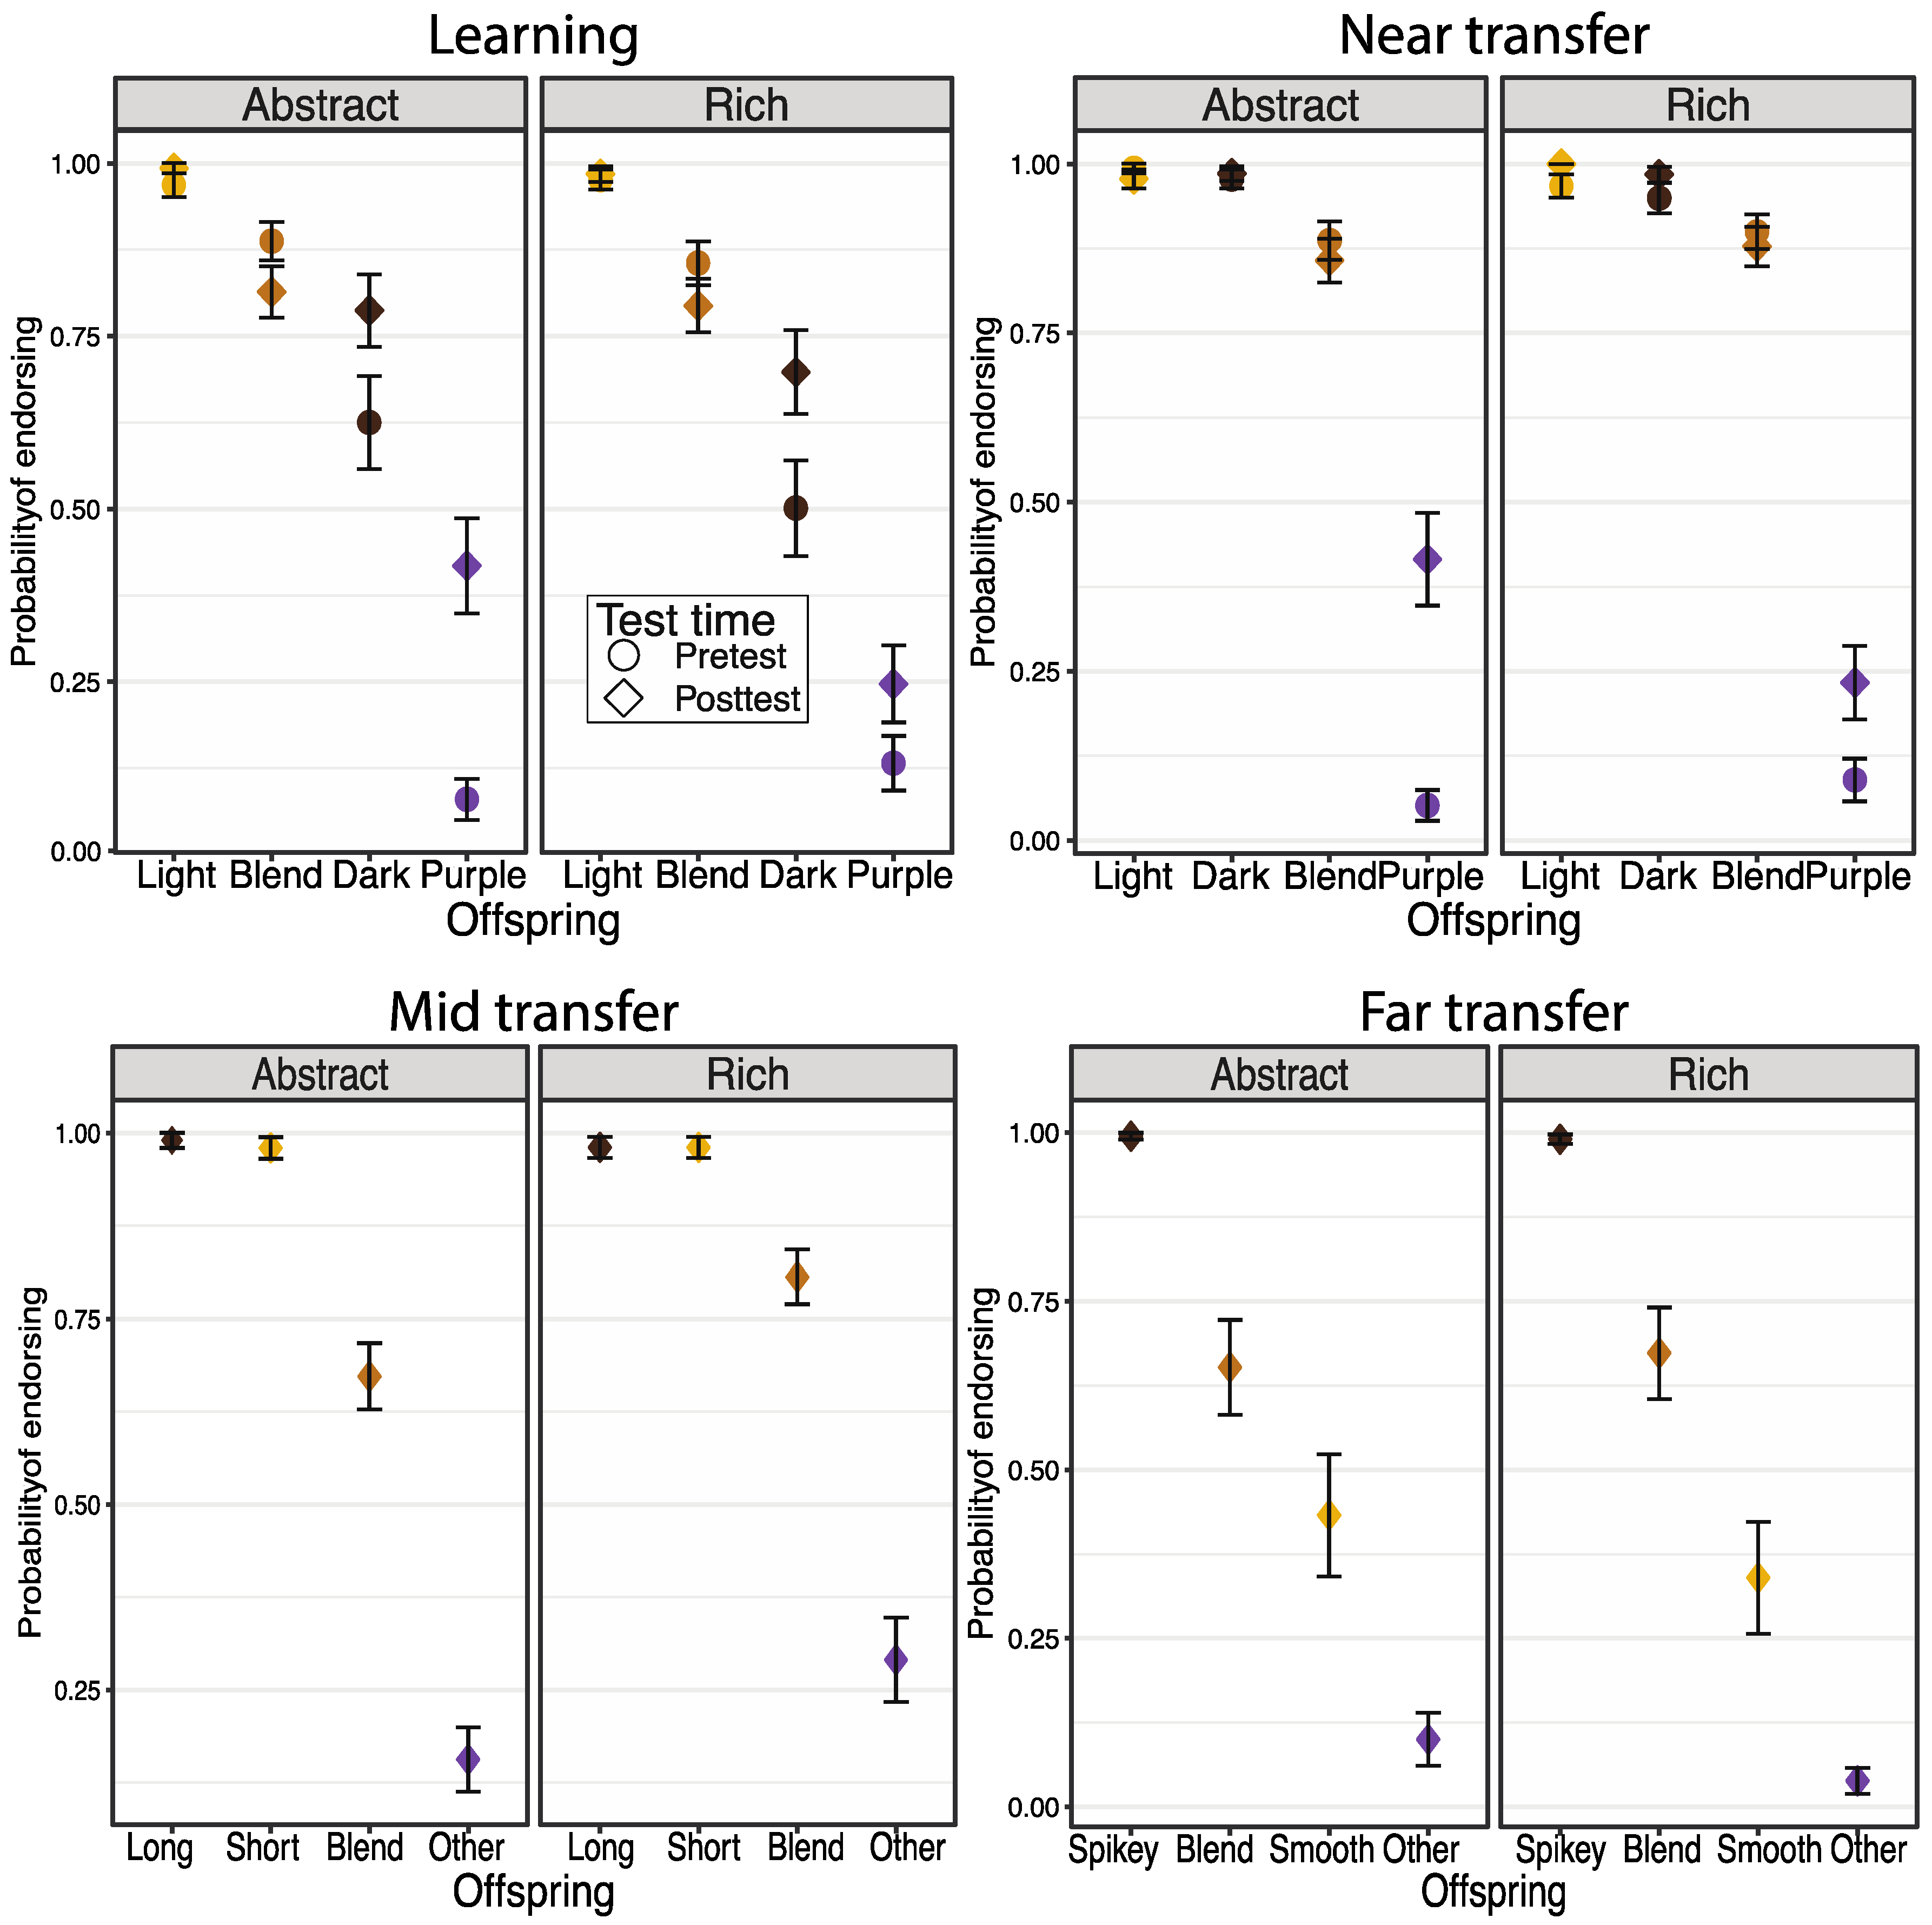
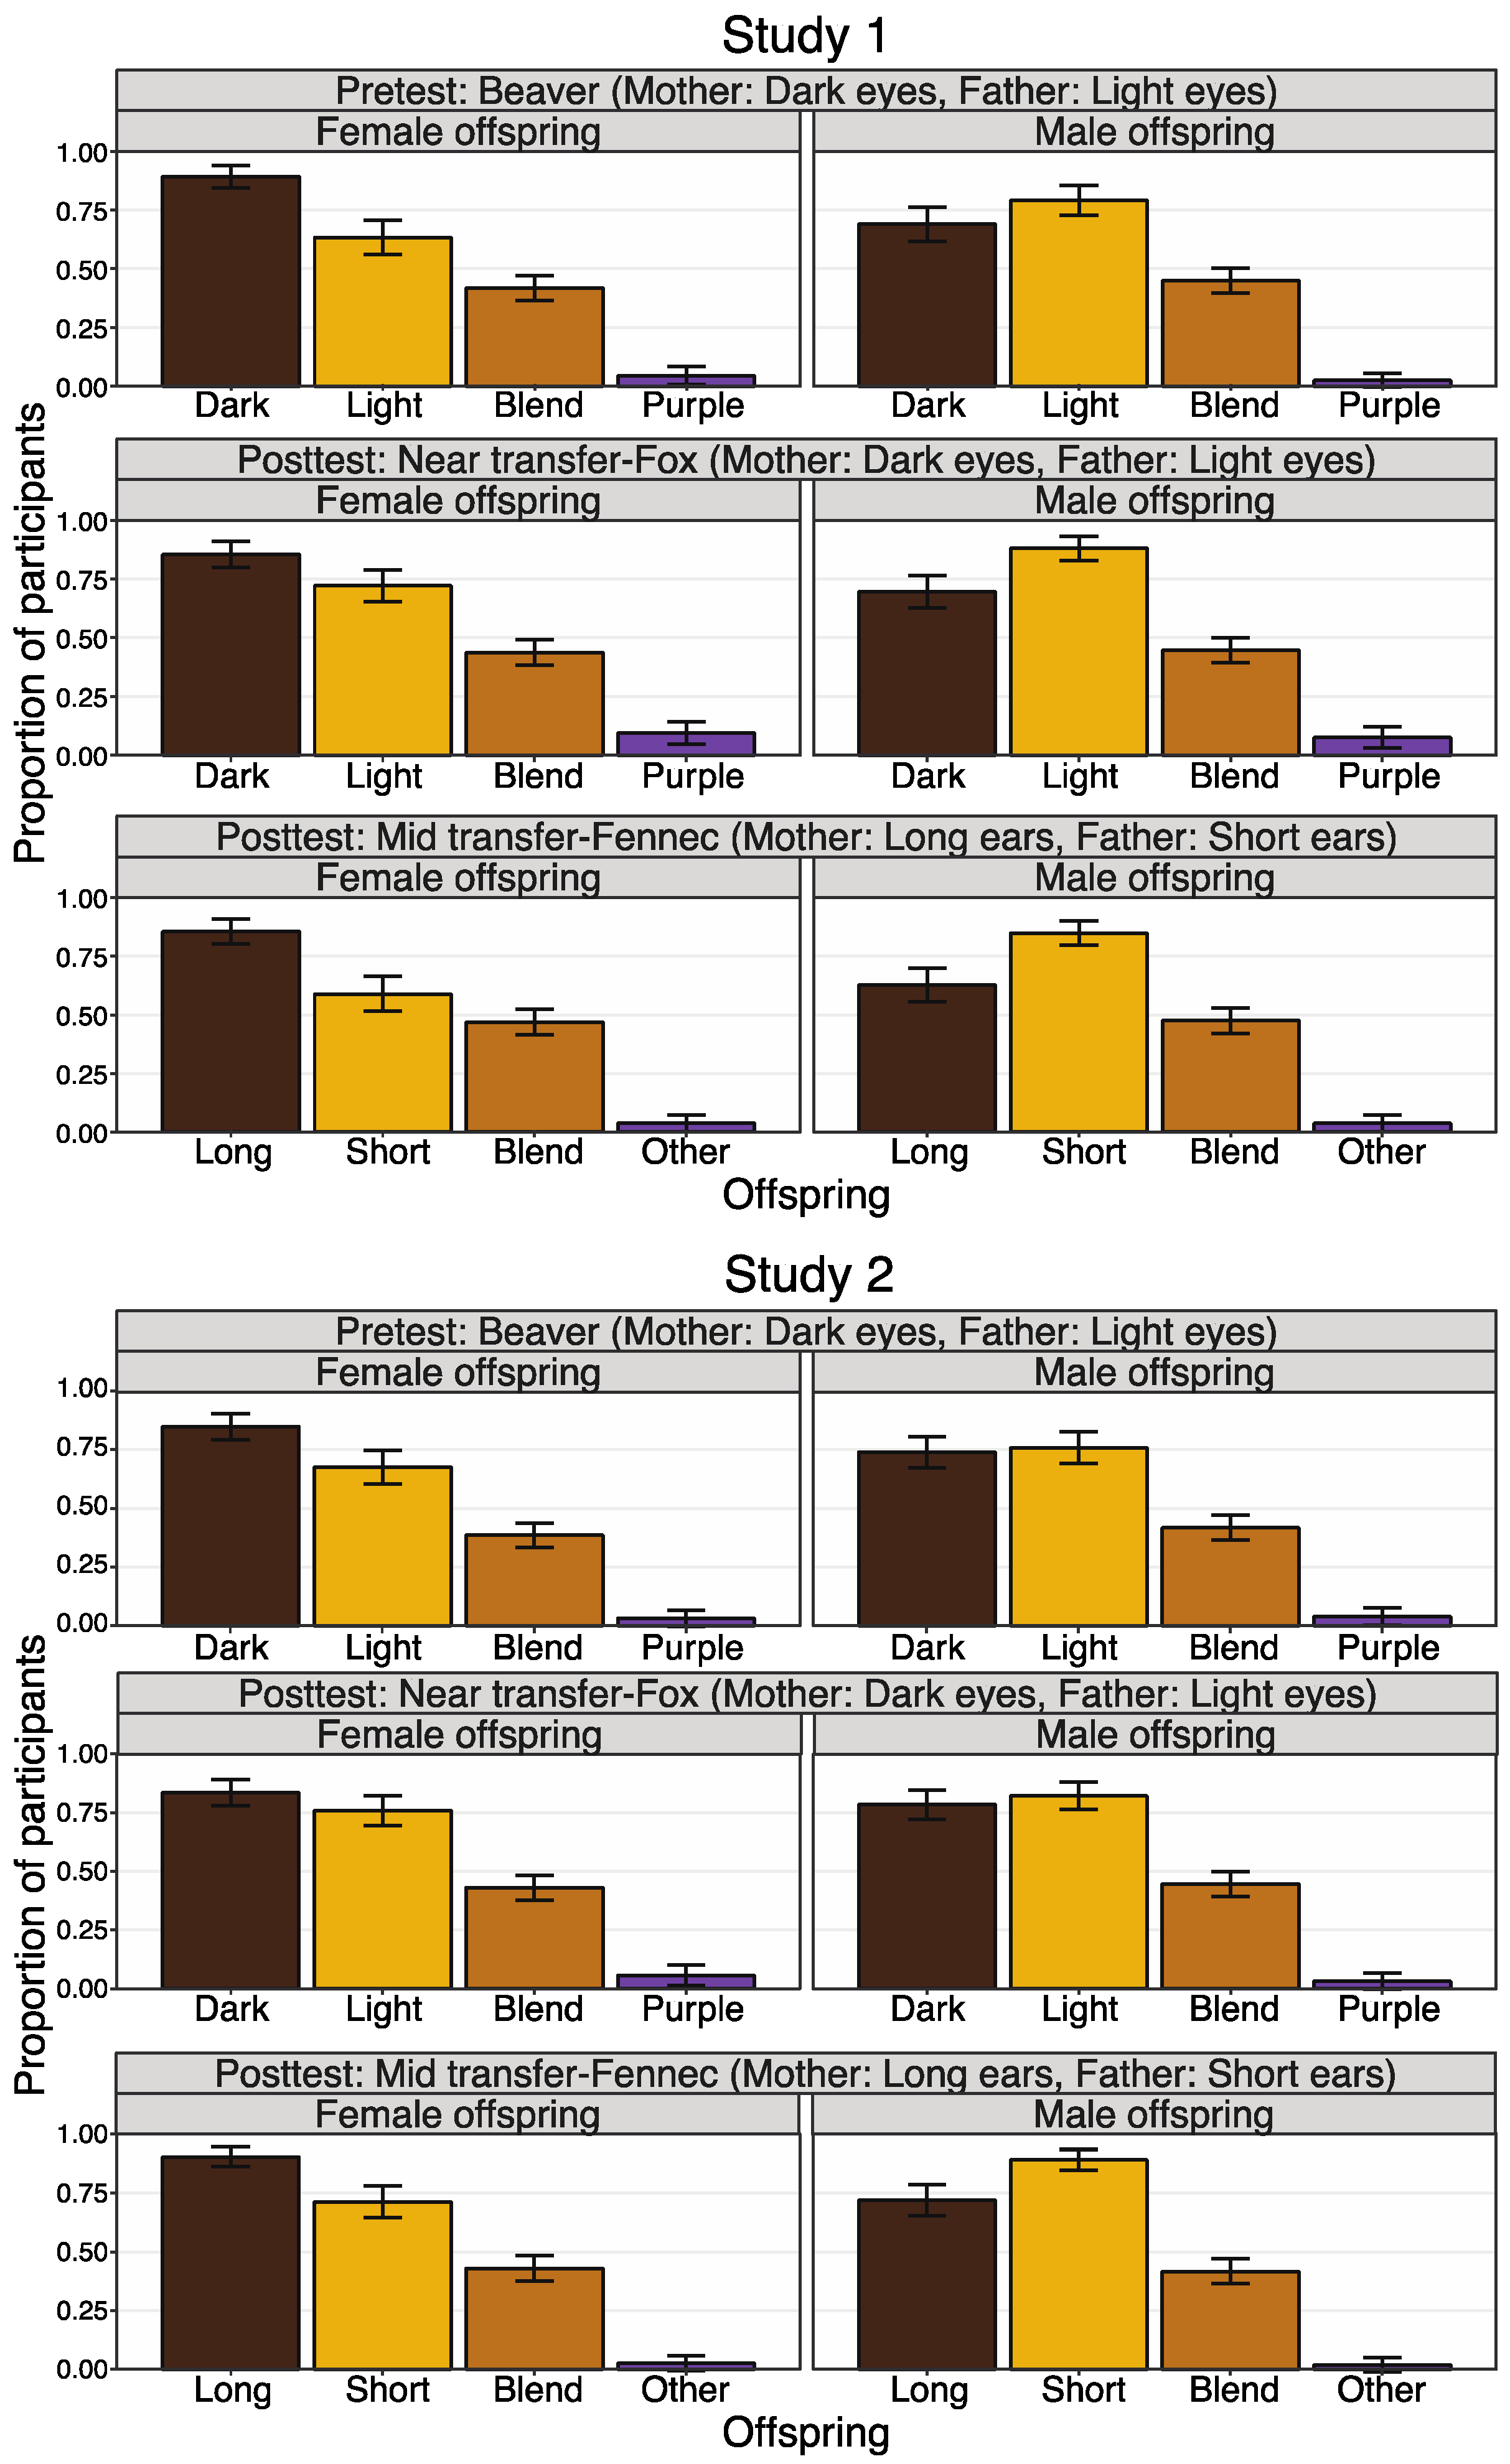
Following our pre-registration, for both the phenotypic judgment and the offspring prediction task, we present two analyses. First, we used logistic mixed-effects models to examine the offspring that participants endorsed (i.e., judged as a possible offspring in the phenotypic judgment task) or selected (i.e., chose as one of the offspring of the animal parents in the offspring prediction task). We included offspring type and diagram condition and their interaction as predictors in all of these models. For the offspring prediction task, we also included offspring sex and its interaction with the other variables. When examining learning (responses to the wolf in the pre-test and post-test) and near transfer (responses to the beaver in the pre-test and the fox in the post-test), we included test time as a predictor and allowed it to interact with the other factors. When examining mid- and far transfer (the fennec fox and the bass, respectively), we did not include test time because there was no equivalent animal in the pre-test. For all models, we started with a maximal random effects structure and followed the recommendations by Brauer and Curtin [57] in cases of non-convergence. We used non-orthogonal contrasts to examine the effect of offspring type and used the blends as the reference group. To protect against multiple comparisons, we examined the individual contrasts only when the omnibus test for offspring type was significant. Given this modeling approach, no other corrections are required [57]. The second pre-registered analysis examined the total number of offspring endorsed or selected. Given that this second analysis generally showed similar results, we present it in the Supplemental Materials.

5.2. Results

5.2.1. Pre-Registered Analyses

Phenotypic Judgment Task

Learning. The first model to converge included by-subject random intercepts, but no other random effects. We found an effect of offspring type, χ2(N = 158, 3) = 272.35, p < 0.001. Replicating Menendez et al. [21], participants showed a perceptual similarity bias in the pre-test, in that they were more likely to endorse the offspring with the light eyes (which matched both parents) than the offspring with blends, χ2(N = 158, 1) = 37.28, p < 0.001, more likely to endorse offspring with blends than those with dark eyes, χ2(N = 158, 1) = 33.48, p < 0.001, and more likely to endorse offspring with dark eyes than those with purple eyes, χ2(N = 158, 1) = 97.16, p < 0.001. We also found an effect of test time, χ2(N = 158, 1) = 5.55, p = 0.018, and an interaction between offspring type and test time, χ2(N = 158, 3) = 31.23, p < 0.001. As can be seen in Figure 2 (top left panel), participants in the post-test had a higher likelihood of endorsing all offspring, and this was driven largely by an increased likelihood of endorsing offspring with dark eyes, χ2(N = 158, 1) = 9.46, p = 0.002, and offspring with purple eyes, χ2(N = 158, 1) = 21.31, p < 0.001, suggesting that the lesson was effective at helping participants overcome the perceptual similarity bias. No other effects were significant. Importantly, the interaction of diagram condition (rich vs. abstract) and test time was not significant, χ2(N = 158, 1) = 0.14, p = 0.712.
Near transfer. The first model to converge included by-subject random intercepts, but no other random effects. We found an effect of offspring type, χ2(N = 158, 3) = 264.37, p < 0.001, and an interaction between offspring type and test time, χ2(N = 158, 3) = 25.71, p < 0.001. As can be seen in Figure 2 (top right panel), participants were similarly likely to endorse the offspring types that matched one of the parents (i.e., offspring with light or dark eyes), χ2(N = 158, 1) = 0.52, p = 0.472, and they were more likely to endorse them than the offspring that blended the parents’ phenotypes, χ2(N = 158, 1) = 25.84, p < 0.001, as well as more likely to endorse offspring with blends than those with purple eyes, χ2(N = 158, 1) = 222.16, p < 0.001. In the post-test, participants were more likely to endorse offspring with purple eyes, χ2(N = 158, 1) = 26.84, p < 0.001. No other effects were significant. Importantly, the interaction of diagram condition (rich vs. abstract) and test time was not significant, χ2(N = 158, 1) = 0.01, p = 0.920.
Mid-transfer (fennec fox and ear size). The first model to converge included by-subject random intercepts, but no other random effects. We found an effect of offspring type, χ2(N = 158, 3) = 127.25, p < 0.001, and an effect of diagram condition, χ2(N = 158, 1) = 5.70, p = 0.017, but no interaction between offspring type and diagram condition, χ2(N = 158, 3) = 1.68, p = 0.640. Similar to near transfer, and as can be seen in Figure 2 (bottom left panel), participants were similarly likely to endorse the offspring that matched one of the parents (i.e., the offspring with small and large ears), χ2(N = 158, 1) = 0.20, p = 0.657, and they were more likely to endorse those than offspring with blends, χ2(N = 158, 1) = 28.16, p < 0.001, as well as more likely to endorse offspring with blends than those with a different type of ears, χ2(N = 158, 1) = 70.62, p < 0.001. Although the interaction between offspring type and diagram condition was not significant, χ2(N = 158, 3) = 1.68, p = 0.640, the greater endorsement in the rich condition appears to be primarily due to a greater likelihood of endorsing offspring with blends and offspring with a different type of ears.
Far transfer (bass and fin type). The first model to converge included by-subject random intercepts, but no other random effects. We found an effect of offspring type, χ2(N = 158, 3) = 121.67, p < 0.001. Similar to the pre-test, and as can be seen in Figure 2 (bottom right panel), participants showed a perceptual similarity bias, such that participants were more likely to endorse offspring that matched both parents than offspring with blends, χ2(N = 158, 1) = 53.15, p < 0.001, more likely to endorse offspring with blends than offspring with smooth fins, χ2(N = 158, 1) = 18.68, p < 0.001, and more likely to endorse offspring with smooth fins than offspring with a different type of fin, χ2(N = 158, 1) = 36.36, p < 0.001. There was no effect of diagram condition, χ2(N = 158, 1) = 0.05, p = 0.829, and no other effects were significant.

Offspring Prediction Task

Learning. The first model to converge included by-subject random intercepts, but no other random effects. We found an effect of offspring type, χ2(N = 158, 3) = 568.79, p < 0.001, an effect of diagram condition, χ2(N = 158, 1) = 6.50, p = 0.011, an interaction between offspring type and diagram condition, χ2(N = 158, 3) = 12.52, p = 0.006, and a three-way interaction between offspring type, test time, and diagram condition, χ2(N = 158, 3) = 9.62, p = 0.022. As can be seen in Figure 3 (top left panel), in the pre-test, participants showed a perceptual similarity bias, in that they were more likely to select the offspring with light eyes than the offspring with blends, χ2(N = 158, 1) = 359.54, p < 0.001, more likely to select offspring with blends than offspring with dark eyes, χ2(N = 158, 1) = 11.19, p = 0.001, and more likely to select offspring with dark eyes than offspring with purple eyes, χ2(N = 158, 1) = 89.32, p < 0.001. Participants who learned with the rich diagram were more likely to select offspring with blends in both the pre-test and post-test than those who learned with the abstract diagram, χ2(N = 158, 1) = 6.50, p = 0.011, which suggests a failure of random assignment. Finally, participants who learned with the abstract diagram were more likely to select offspring with dark eyes and with purple eyes in the post-test than participants who learned with the rich diagram, χ2(N = 158, 1) = 6.30, p = 0.012, and χ2(N = 158, 1) = 8.38, p = 0.004, respectively.
Near transfer. The first model to converge included by-subject random slopes for the non-orthogonal contrasts for offspring type, and no other random effects. We found an effect of offspring type, χ2(N = 158, 3) = 148.43, p < 0.001, and an interaction between offspring type and test time, χ2(N = 158, 3) = 14.39, p = 0.002. As in the phenotypic judgment task, participants were more likely to endorse the offspring that matched the parents than the offspring with blends, and were more likely to endorse the offspring with blends than the offspring with purple eyes. As can be seen in Figure 3 (top right panel), participants were more likely to select the light-eyed offspring in the post-test. We also found an effect of diagram condition, such that participants who learned with the rich diagram had an overall higher likelihood of selecting different types of offspring in the pre-test and post-test than those who learned with the abstract diagram, χ2(N = 158, 1) = 11.53, p = 0.001. This effect did not interact with test time, χ2(N = 158, 1) = 0.71, p = 0.398, and there was also no significant interaction between diagram condition and offspring type, χ2(N = 158, 3) = 1.62, p = 0.655. Descriptively, it appears that this effect is primarily driven by higher endorsement of offspring with blends in the rich diagram condition.
Mid-transfer. The first model to converge included by-subject random intercepts, but no other random effects. We found an effect of offspring type, χ2(N = 158, 3) = 222.27, p < 0.001. As in the phenotypic judgment task, participants were more likely to endorse the offspring that matched the parents than the offspring with blends, and were more likely to endorse the offspring with blends than the offspring with a different type of ears. We also found an effect of diagram condition, χ2(N = 158, 1) = 7.14, p = 0.007. As can be seen in Figure 3 (bottom left panel), participants who learned with the rich diagram had an overall higher likelihood of selecting different types of offspring in the post-test than the ones who learned with the abstract diagram.
Far transfer. The first model to converge included by-subject random slopes for the non-orthogonal contrasts for offspring type, and did not allow them to correlate, and it included no other random effects. We found an effect of offspring type, χ2(N = 158, 3) = 112.37, p < 0.001. Participants were more likely to select the offspring with spikey fins (which matched the parents) than the offspring with blends and were more likely to select offspring with smooth fins than the offspring with different fins. However, unlike in the phenotypic judgment task, there was no difference in the likelihood of selecting offspring with blends and offspring with smooth fins. See Figure 3 (bottom right panel).

Post-Hoc Analyses

Comprehension questions. We explored whether participants also differed in their responses to the two comprehension questions that we asked them right after the lesson. We fit a logistic mixed-effects regression predicting whether participants answered each comprehension question correctly from diagram condition. We included by-subject random intercepts. Diagram condition did not influence responses to the comprehension questions, χ2(N = 158, 1) = 0.11, p = 0.742.
Sex matching. We also explored whether the lesson influenced participants’ tendency to sex match. This analysis focused on the beaver (pre-test), fox (post-test), and fennec fox (post-test), as these were the animals where the parents had different eye colors, and so we could see whether they matched the male offspring to the father’s phenotype and the female offspring to the mother’s phenotype. We included offspring type, offspring sex, animal, and diagram condition as predictors. The first model to converge included by-subject random intercepts but no other random effects. We found an interaction between offspring type and offspring sex, χ2(N = 158, 3) = 24.42, p < 0.001. As can be seen in Figure 4, participants did indeed sex match, in that they were more likely to select female offspring that matched the mother’s eye color and male offspring that matched the father’s eye color. However, we did not find that this tendency varied across animals, χ2(N = 158, 6) = 3.71, p = 0.715, and it did not vary with animal and diagram condition, χ2(N = 158, 6) = 3.87, p = 0.695. This replicates Menendez et al. [21], who also found that undergraduate students have a sex-matching bias. Note that we did not find that our lesson (or either diagram condition) led participants to revise their beliefs.

5.3. Discussion

Undergraduate students exhibited a perceptual similarity bias, such that they believed that offspring that more closely resembled the parents would be more likely than dissimilar offspring. In addition, undergraduate students exhibited a sex-matching bias, such that they thought that offspring would be more likely to resemble the parent of the same sex. These findings replicate those of Menendez, Mathiaparanam, et al. [21]. Additionally, we found that a short lesson helped participants revise their perceptual similarity beliefs. However, this was true only for eye color, the trait that was the focus of the lesson. When asked about other traits such as ear size or fin type, participants exhibited bias once again, suggesting a failure to transfer from the lesson.
Contrary to our hypothesis, we found that undergraduate participants transferred more when the lesson included rich diagrams. We found that in both the phenotypic judgment task and the offspring prediction task, participants were more likely to endorse and select offspring that were not identical to the parents in the rich diagram condition. This is surprising, as prior research suggests that undergraduate students are more likely to transfer broadly from lessons with abstract visual representations [38,39,40]. We did find that students who learned with the abstract diagram endorsed more dissimilar offspring for the wolf than those who learned with the rich diagram. However, the majority of the findings indicate a benefit for the rich visual representations. Further, post-hoc analyses suggest that this was not due to inattention, as students in both conditions were just as likely to answer the comprehension questions correctly.
Given that this finding was opposite to our hypothesis, we decided to follow up by examining whether perceptually rich or bland diagrams influenced learning about genetics. Unlike abstract diagrams, perceptually bland diagrams retain some realistic elements that make them more similar to the real-world objects that they represent. Additionally, unlike perceptually rich diagrams, they have fewer details, which might make them easier to process (i.e., they might induce less cognitive load [36]). Perceptually bland diagrams have been found to lead to greater transfer for some biological concepts [49]. Therefore, Study 2 used a similar methodology as Study 1, but randomly assigned participants to either a perceptually rich or a perceptually bland pedigree diagram. Study 2 was pre-registered after the data were collected but prior to the research team accessing the data. We hypothesized that participants who learned with the bland diagram would be more likely to transfer than participants who learned with the rich diagram.

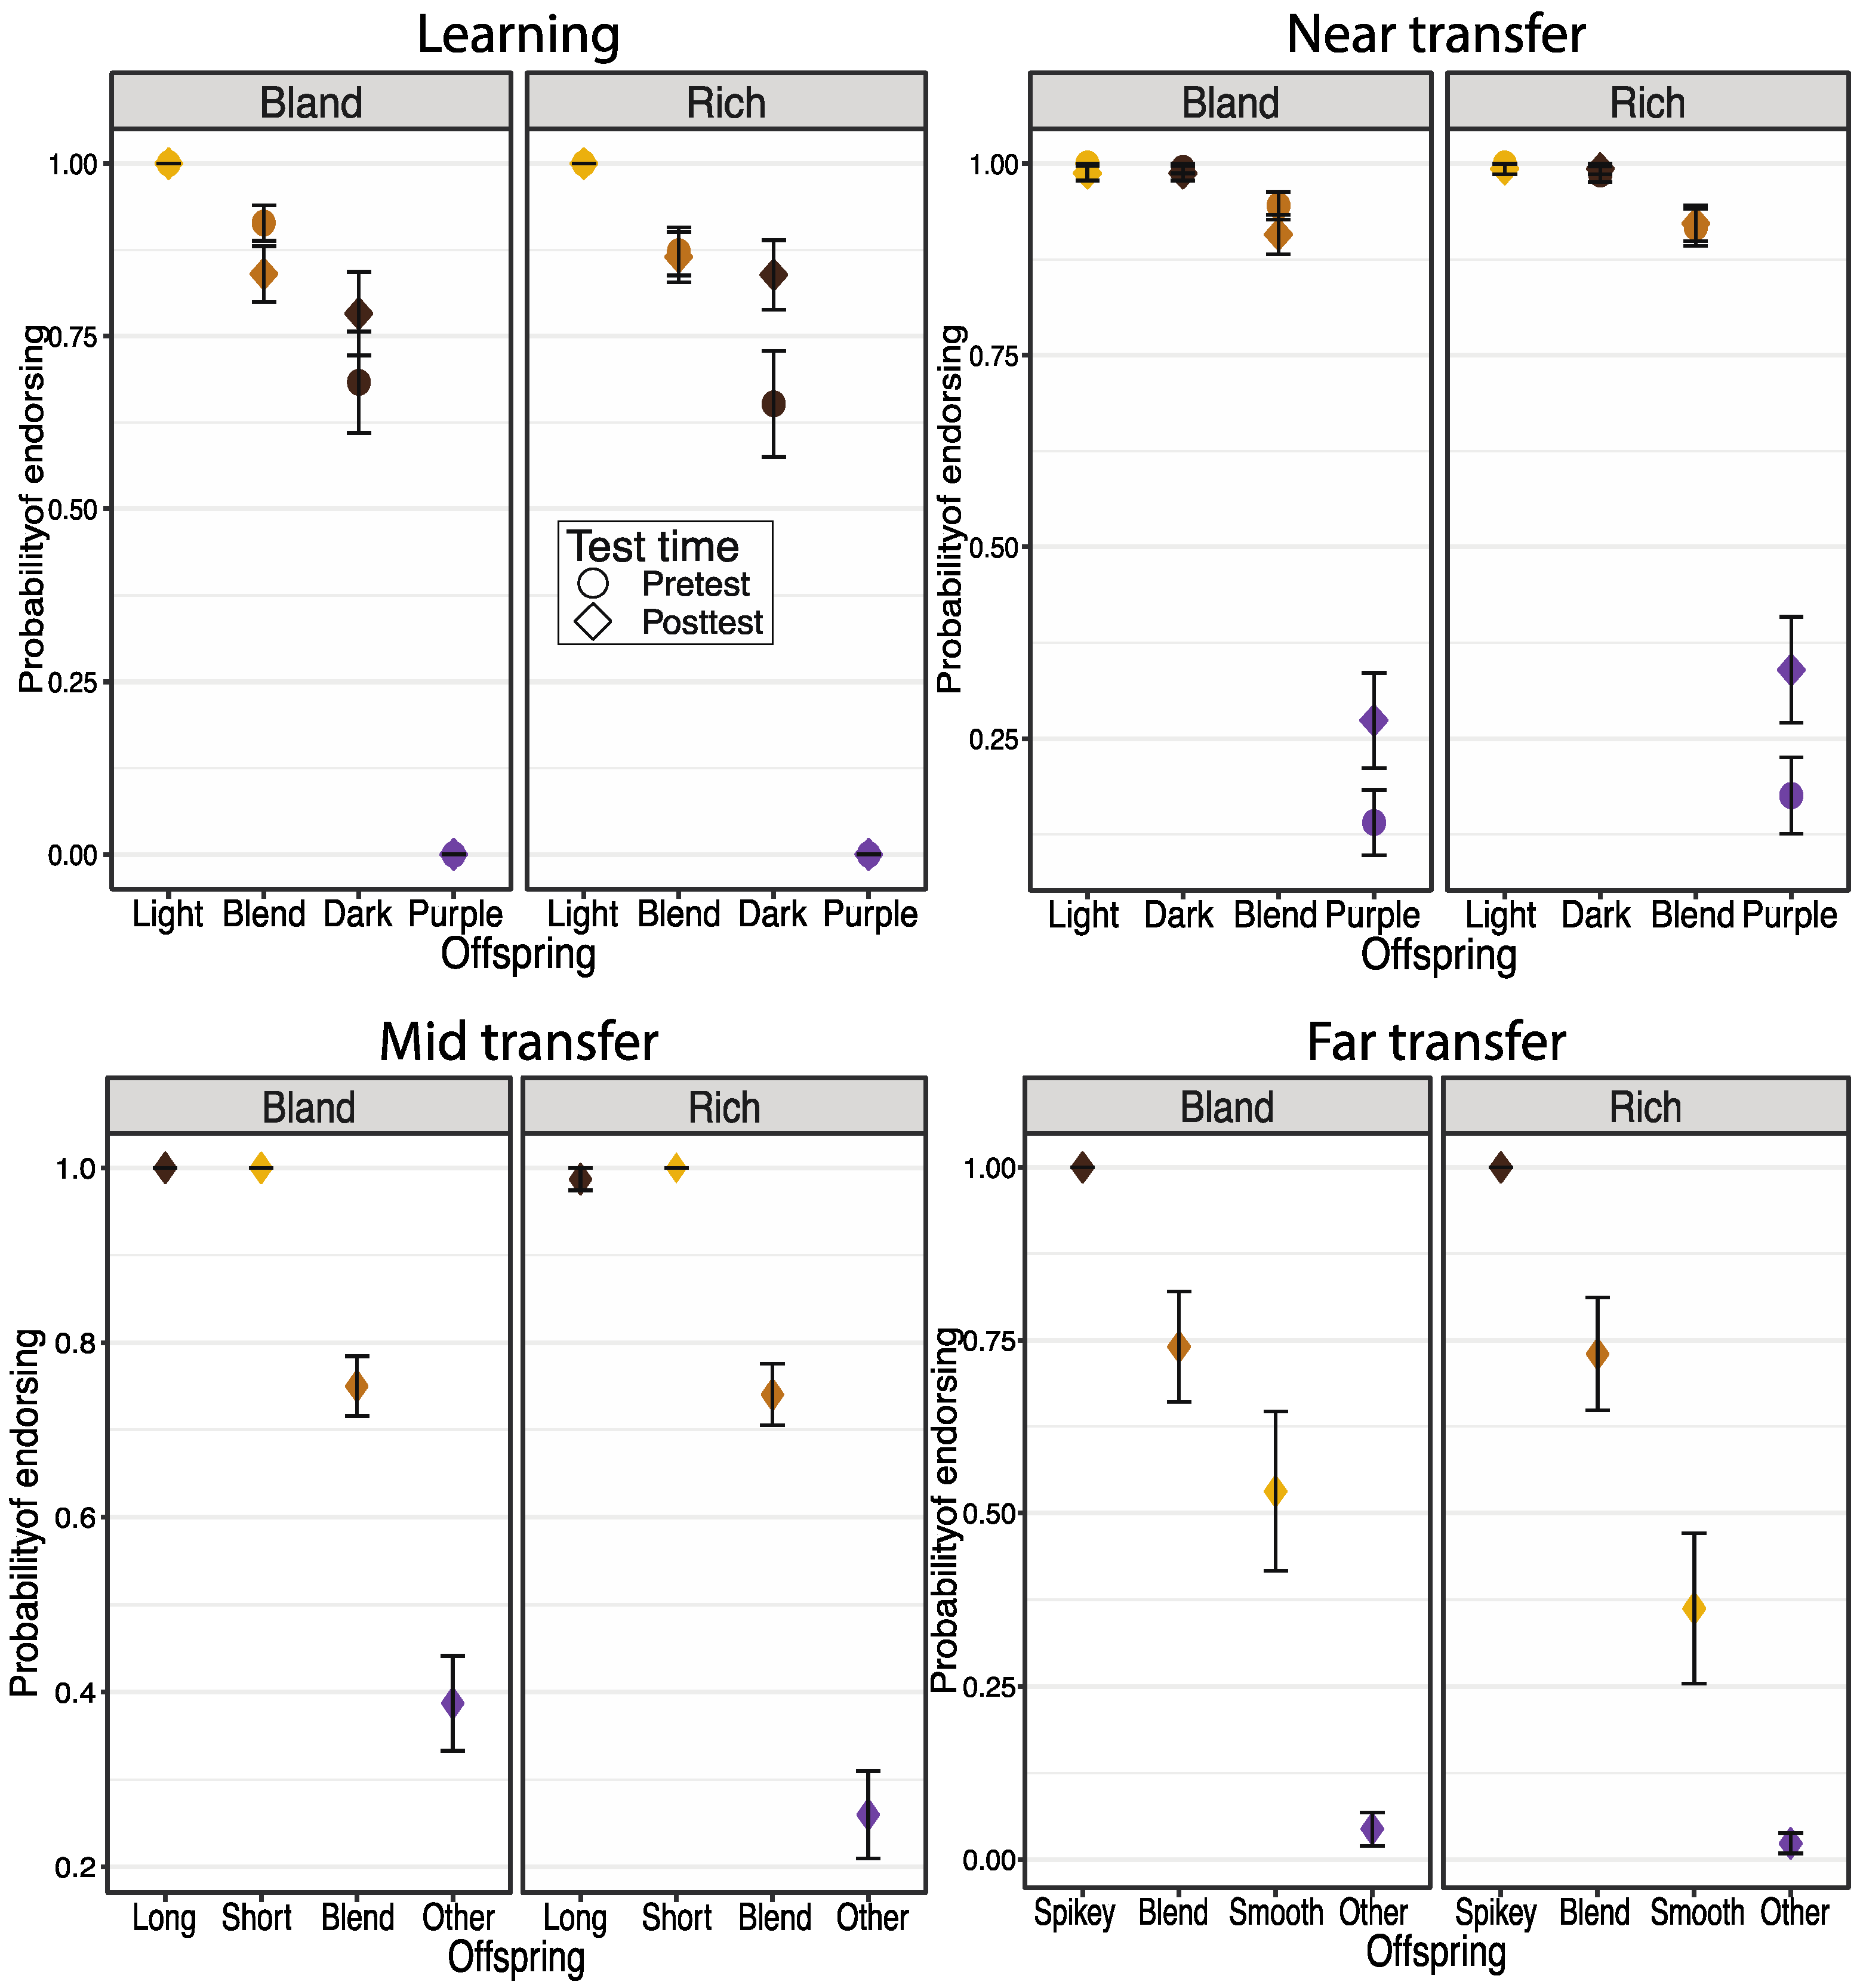
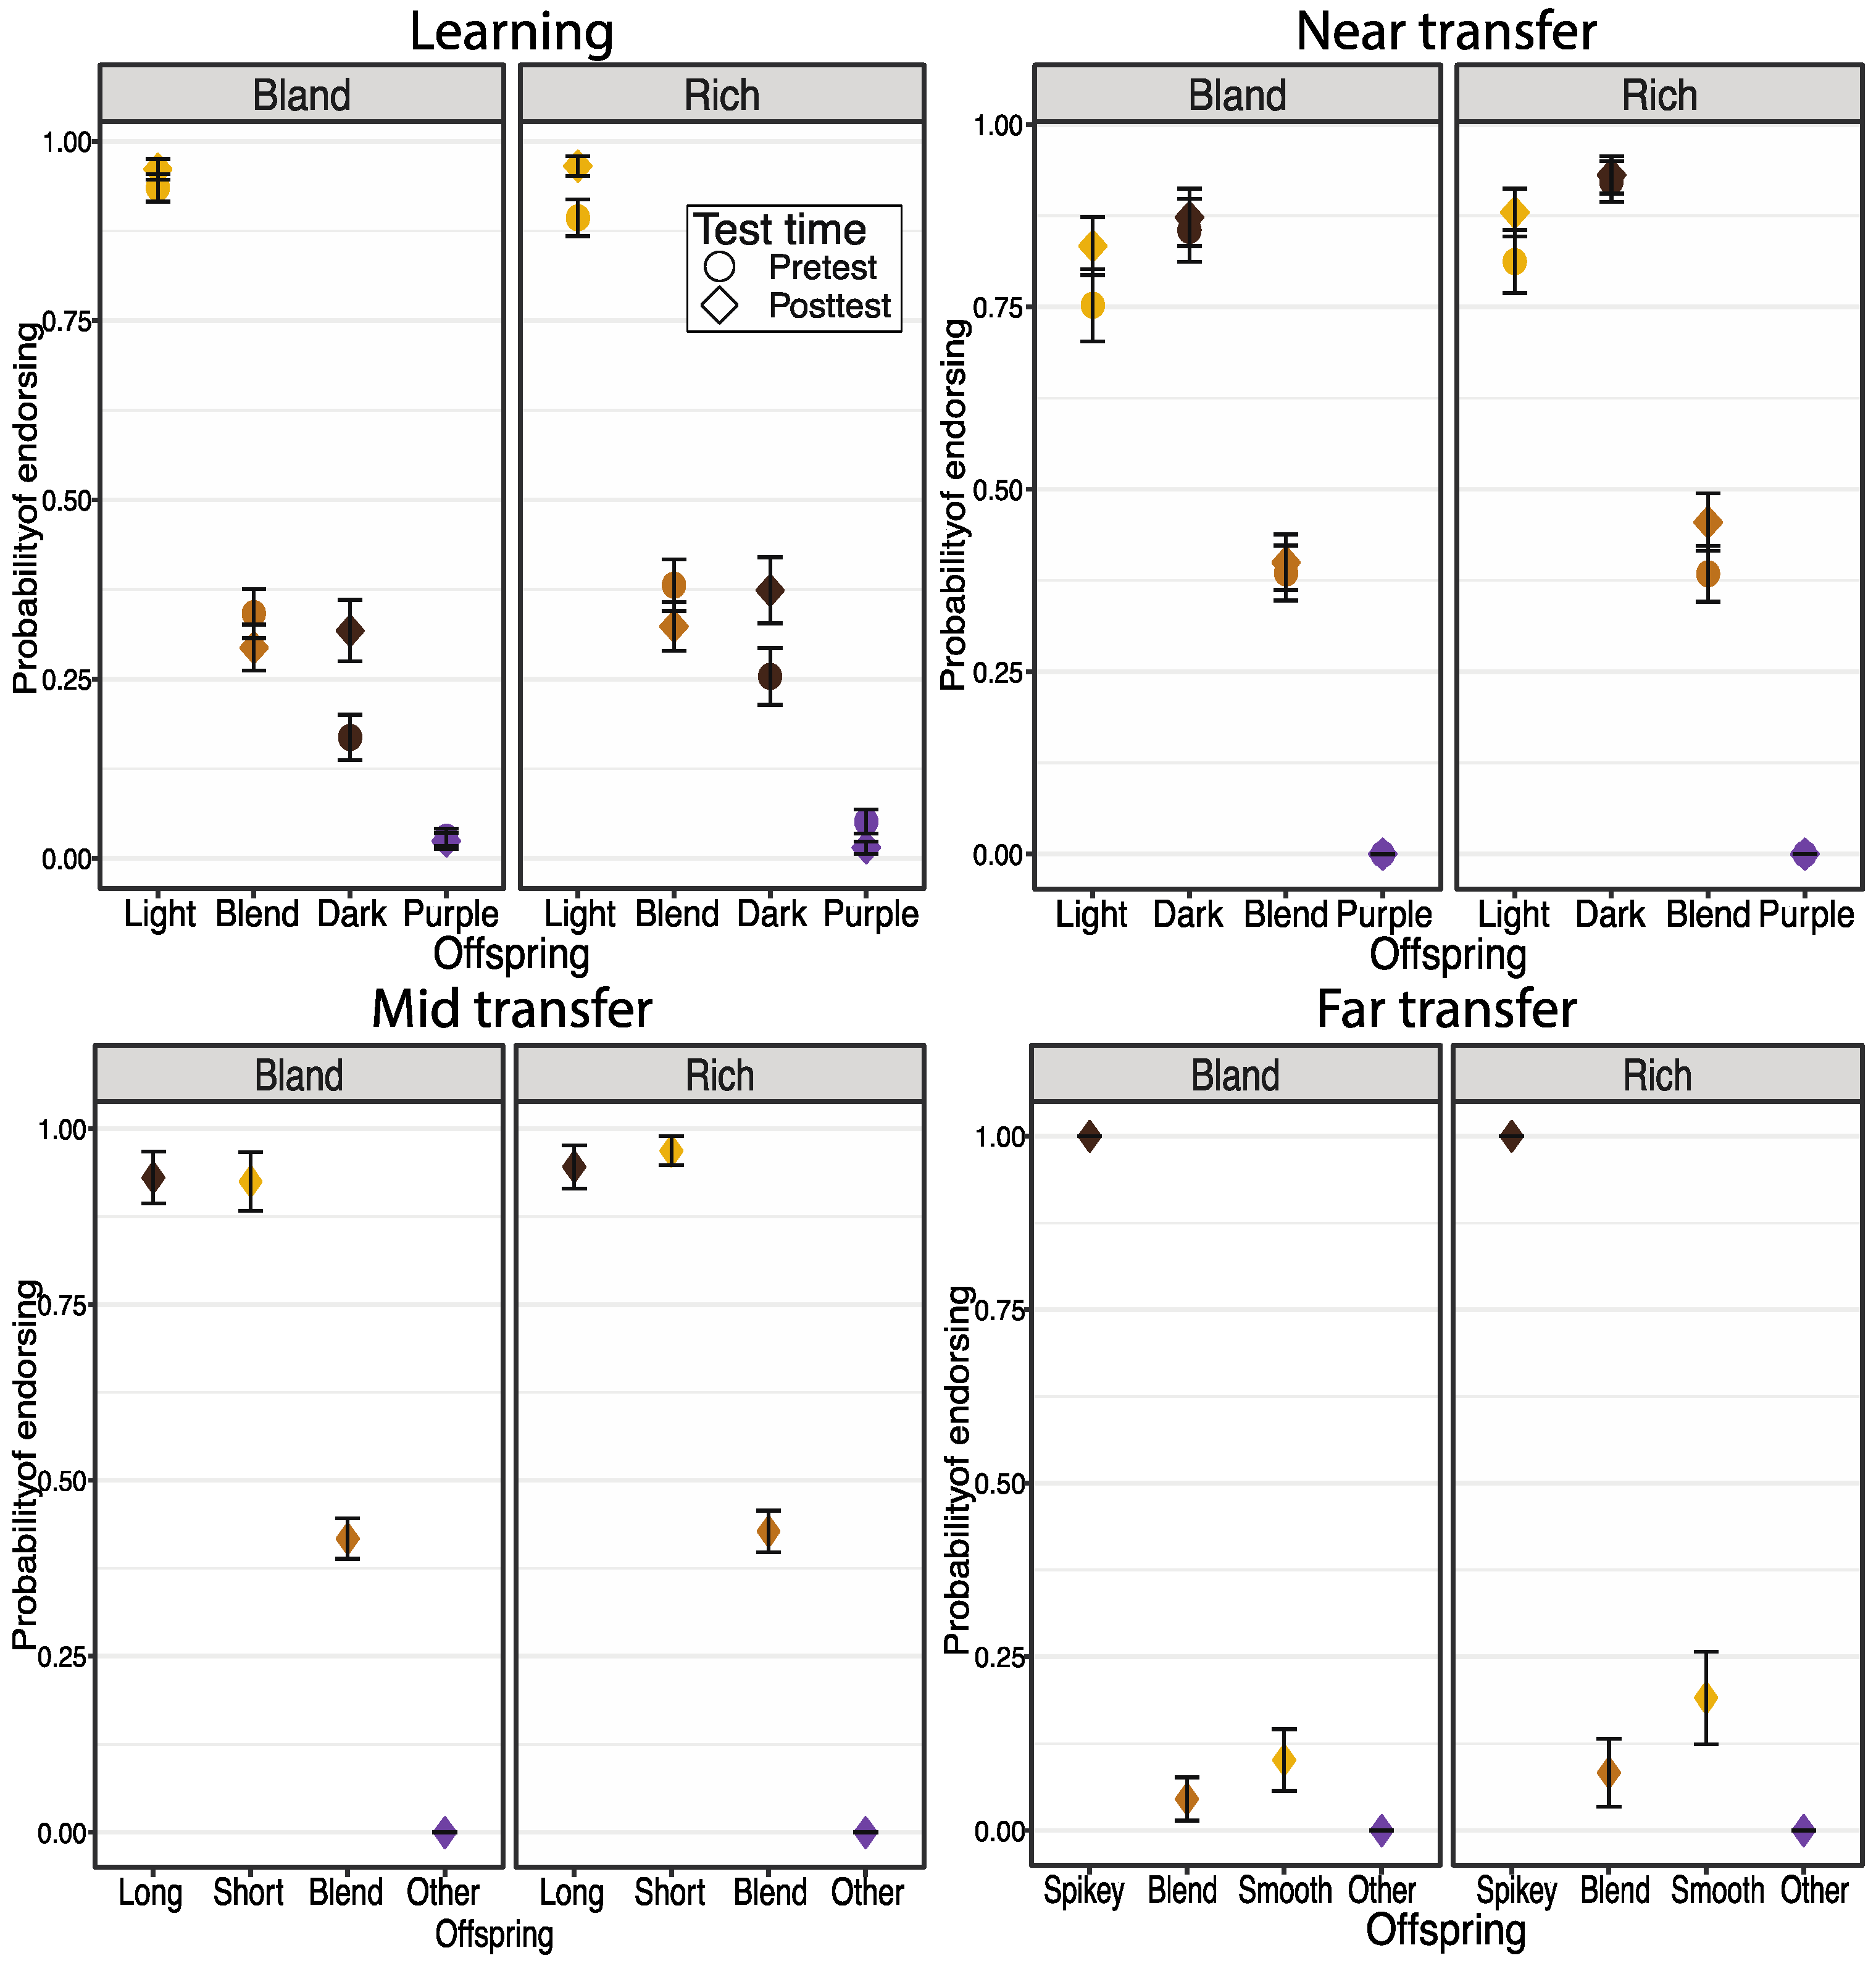
6. Study 2: Rich versus Bland Diagrams

All of the materials, data, and analysis scripts for this study can be found at https://osf.io/cx5uw/?view_only=1577cad59aa74271877e99b61360af41(accessed on 6 February 2024). The pre-registration for this study can be found at https://osf.io/5yvbj/?view_only=dccf354f301542919eba86d3588dc324 (accessed on 6 February 2024).

6.1. Method

6.1.1. Participants

As pre-registered, we recruited 160 undergraduate students from an Introduction to Psychology course at a large midwestern university. Again, this sample size was determined based on previous studies examining the effects of diagram features on learning and transfer in biology [49]. We excluded the data from three participants, as one participant did not finish the study and two participants failed the attention checks, yielding a final sample of 157 participants (51 men, 104 women, 1 non-binary individual, and 1 individual who did not report gender). Per self-report, 112 participants identified as white, 2 as Black or African American, 27 as Asian or Asian American, 5 as Latinx or Hispanic, 2 as Native American, 1 as Arab, and 4 as bi- or multi-racial; 2 individuals did not report racial or ethnic information.

6.1.2. Design and Procedure

The design, materials, and procedure of this study were identical to Study 1, with one exception, which was that participants were randomly assigned to either a perceptually rich or a perceptually bland diagram for the lesson. The rich diagram was identical to the one used in Study 1. The bland diagram was created by removing most of the textural, shading, and color details from the rich diagrams, so that it was basically a line drawing of the wolf faces. We did retain the color of the eyes, as this was an important visual feature for the lesson. See Figure 1 for a visualization of the diagrams.

6.1.3. Data Analytic Strategy

Our approach to analyzing the data was identical to that of Study 1. We present the analyses examining the offspring endorsed or selected in the main text, and the analyses showing the number of offspring endorsed or selected in the Supplemental Materials. In order to make the reporting more succinct, we do not report every contrast on offspring type, but only how responses changed with test time or diagram condition, as the findings are largely consistent with Study 1 and Menendez et al. [21].

6.2. Results

6.2.1. Pre-Registered Analyses

Phenotypic Judgment Task

Learning. The first model to converge did not allow random effects to correlate. We found an effect of offspring type, χ2(N = 157, 3) = 31.86, p < 0.001, and an interaction between offspring type and test time, χ2(N = 157, 3) = 10.02, p = 0.018. As can be seen in Figure 5 (top left panel), participants in the post-test had a higher likelihood of endorsing all offspring, but this was driven largely by the increased likelihood of selecting offspring with dark eyes, χ2(N = 157, 1) = 120.68, p < 0.001, suggesting that the lesson was effective at helping participants overcome the perceptual similarity bias. Importantly, the interaction of diagram condition (rich vs. bland) and test time was not significant. No other effects were significant.
Near transfer. The first model to converge included by-subject random intercepts, but no other random effects. We found an effect of offspring type, χ2(N = 157, 3) = 237.73, p < 0.001, and an interaction between offspring type and test time, χ2(N = 157, 3) = 8.06, p = 0.045. As can be seen in Figure 5 (top right panel), in the post-test, participants were more likely to endorse the offspring with purple eyes, χ2(N = 157, 1) = 8.59, p = 0.003. No other effects, including the test time by diagram condition interaction, were significant.
Mid-transfer. The first model to converge included by-subject random intercepts, but no other random effects. We found an effect of offspring type, χ2(N = 157, 3) = 71.17, p < 0.001. See Figure 5 (bottom left panel). No other effects were significant.
Far transfer. The first model to converge did not allow the random effects to correlate. We found an effect of offspring type, χ2(N = 157, 3) = 102.23, p < 0.001. See Figure 5 (bottom right panel). No other effects were significant.

Offspring Prediction Task

Learning. The first model to converge included by-subject random intercepts, but no other random effects. We found an effect of offspring type, χ2(N = 157, 3) = 550.64, p < 0.001, and an interaction between offspring type and test time, χ2(N = 157, 3) = 25.82, p < 0.001. As can be seen in Figure 6 (top left panel), in the post-test, participants were more likely to select the offspring with dark eyes, χ2(N = 157, 1) = 13.73, p < 0.001. No other effects, including the main effect of condition or the test time by diagram condition interaction, were significant.
Near transfer. The first model to converge included by-subject random intercepts and by-subject random slopes for the non-orthogonal contrasts for offspring type. We found an effect of offspring type, χ2(N = 157, 3) = 149.19, p < 0.001. No other effects were significant.
Mid-transfer. The first model to converge included by-subject random intercepts and by-subject random slopes for the non-orthogonal contrasts for offspring type. We found an effect of offspring type, χ2(N = 157, 3) = 61.70, p < 0.001. No other effects were significant.
Far transfer. The first model to converge included by-subject random intercepts and by-subject random slopes for the non-orthogonal contrasts for offspring type and did not allow them to correlate. We found an effect of offspring type, χ2(N = 157, 3) = 91.49, p < 0.001. However, we did not see a perceptual similarity bias. Participants were likely to select the offspring that looked like the parents, but all other offspring were rarely selected. See Figure 6 (bottom right panel). No other effects were significant.

6.2.2. Post-Hoc Analyses

Comprehension questions. We explored whether participants in the perceptually rich and perceptually bland conditions differed in their responses to the two comprehension questions that we asked immediately after the lesson. We fit a logistic mixed-effects regression predicting whether participants answered each comprehension question correctly from diagram condition. We included by-subject random intercepts. We did not find that diagram condition influenced responses to the comprehension questions, χ2(N = 157, 1) = 0.01, p = 0.905.
Sex matching. We also explored whether the lesson influenced participants’ tendency to sex match. We included offspring type, offspring sex, animal, and diagram condition as predictors. The first model to converge included by-subject random intercepts and no other random effects. We found an interaction between offspring type, offspring sex, and animal, χ2(N = 157, 6) = 12.69, p = 0.048. As can be seen in Figure 4, participants did indeed sex match for the beaver (eye color in the pre-test), χ2(N = 157, 3) = 8.46, p = 0.037, and the fennec fox (ear size in the post-test), χ2(N = 157, 3) = 33.07, p < 0.001, but not the fox (eye color in the post-test), χ2(N = 157, 3) = 4.56, p = 0.207. This suggests that the lesson did encourage adults to revise their sex matching for eye color, but that they did not transfer this to other traits (i.e., ear size). However, we should note that the sex-matching tendency in the pre-test was smaller in Study 2 than in Study 1, and specifically, it was not as prevalent for the male offspring.

6.3. Discussion

Study 2 did not find differences in participants’ learning and transfer from lessons that involved perceptually rich and perceptually bland pedigree diagrams. Although we did see some shifts in participants’ endorsements and selections in the post-test, these changes were primarily for the animal in the lesson (the wolf), suggesting a hesitancy to transfer to other animals. Unlike in Study 1, we saw that participants did not sex match for eye color after the lesson. However, they did engage in sex matching for ear size, showing that they did not transfer their knowledge from the eye color lesson to other traits.

7. General Discussion

Overall, the findings of the two studies presented in this paper are mixed, as in prior work [35,36,38,49]. Both studies suggest that undergraduate students did not transfer very far from the exemplar used in the lesson. Attempting to promote transfer by presenting perceptually bland or abstract visual representations—an approach that has been successful in prior research [38,39,40,49]—was not effective in this context. Counter to our hypothesis, participants transferred more broadly when presented with perceptually rich visual representations than with abstract visual representations. This result is opposite to what we hypothesized; however, as we discussed previously, this pattern has been found in some prior studies. Prior work has found that realistic visual representations, particularly detailed and colorful images like the ones used in these studies, are attention grabbing [32] but can be harder to process [37]. Other studies have found that rich visual representations do not lead to less learning [32,52], can enhance recall [36], and can promote transfer [47,48,53].
Even though the finding that rich visual representations promote transfer more than abstract ones is not novel (see [53]), the question remains as to why research in this area of study continues to yield mixed findings. One possibility might be due to the setting of the lesson. We used an unmoderated, online procedure, in which students completed the study in their own time. Students might have had more distractions than if the study had been conducted in person or in a controlled laboratory setting. As such, it is possible that participants needed the attentional support of the rich diagram in order to focus on the lesson. Previous work has found a greater benefit of rich diagrams in online settings [49], although in these studies, there was still an overall advantage for bland diagrams. This is a possibility we cannot rule out with our data, and future studies should examine how differences in setting (online versus in-person, or moderated versus unmoderated) influence the effectiveness of different diagrams. It is also worth noting that this explanation may not account for why there was no difference between the rich and bland diagrams, unless one infers that they were equally attention grabbing, as both depicted animal faces.
Another possibility is that the observed differences are due to differences in the use of symbols or conventions in the diagrams. Although pedigree diagrams are common in genetics instruction [55], it is possible that students in our studies did not know how to interpret them. Although all visual representations rely on symbols to represent real-world referents, some are more easily connected to their referents [58,59,60]. Some visual representations—including pedigree diagrams—rely on symbols or field-specific conventions that students need to know [43,45]. Prior work has found that students often struggle with understanding some symbolic elements of visual representations, such as how to interpret certain features of the diagrams, including the lines, the positions of the elements, or the shapes (in the abstract version) [42,43,44,46]. This difficulty in understanding the symbolic elements of the representation might have increased the cognitive load of using and processing the visual representation [61,62,63].
In the present study, all of the diagrams were two-dimensional images, but there were probably differences in how easily the students could map the features of the diagrams to their real-world referents. In the case of the abstract diagram, the use of circles and squares and the connection to eye color might have confused students, leading to limited transfer. This might be the reason why we saw an advantage for the rich diagram when compared to the abstract diagram, but not when compared to the bland diagram. The bland diagram is less realistic than the rich one. However, the bland diagram does not contain as many symbols as the abstract diagram; it retains many features that are analogous to actual wolves (particularly the eyes). As such, the rich and bland diagrams might have been easier to process and therefore incurred less cognitive load, whereas the abstract diagram might have been more challenging to process, incurring greater load. Therefore, the results could be explained by accounts that consider the representational knowledge of the students [43,45,64]. Future work should examine whether explaining the symbols and conventions used in abstract diagrams would enhance students’ ability to learn and transfer from these diagrams.
Both of our studies highlight that the benefits of a particular visual representation or type of representation are not universal. Rather, their benefits might depend on other characteristics of the topic (e.g., how easy it is to visualize), learner (e.g., whether they understand the symbols they are being shown), and setting (e.g., the number of distractors). Other factors, such as students’ familiarity with a given visual representation, the content domain, and the age of the student, among others, should also be considered by educators when deciding how to use visual representations to enhance learning. These findings push us to consider not just whether a particular type of visual representation is effective, but where, when, and for whom it is effective.

8. Implications for Understanding Genetics

In both studies, we replicated the finding that undergraduate students display biases in their thinking about genetic inheritance [21]. We found that for eye color, ear size, and fin type, undergraduates used perceptual similarity to judge whether an offspring is possible. This was the case, even though many students had previously had genetics instruction. Further, we found that for both eye color and ear size, undergraduates displayed a sex-matching bias, thinking that offspring are more likely to resemble the parent of the same sex. Both of these biases have also been found in children as young as 4 years of age [22]. These studies provide further evidence that undergraduate students in the United States rely on early-emerging cognitive biases when thinking about genetic inheritance.
In the lesson, we explained that offspring could look similar to or very different from their parents (countering the perceptual similarity bias), and that offspring receive the same amount of genetic material from each parent (countering the sex-matching bias). This short lesson was effective at helping students to, at least briefly, overcome their perceptual similarity bias, evidenced by their greater endorsements and selections of highly dissimilar offspring. However, this change was limited to the trait that was the focus of the lesson, which was eye color. Participants’ endorsements and selections for the other traits continued to follow these biases, showing a resistance to transfer to other traits. Additionally, the lesson did not lead participants to change their beliefs about sex matching in Study 1, but it did in Study 2. But once again, participants did not transfer this decreased sex-matching tendency to a different trait. It should be noted that the lesson we used was very short and not interactive, and it is likely that a lengthier and more targeted instruction, in which these beliefs are repeatedly challenged, might lead to greater change; for an example of this approach in overcoming biases in genetics education, see [65,66]. It could also be the case that providing students with a more interactive lesson (in which they have to answer questions or solve problems) would engage them more and promote greater learning and transfer [67]. Our work highlights that these biases persist, even after years of biology instruction and after short lessons. This work adds to the body of literature in biology education showing that psychological biases (also called cognitive construals) influence how people think about biology and that biology instruction can be ineffective at challenging these biases and, in some cases, can even promote them [16,20,26,68].
The fact that students revised their beliefs about perceptual similarity (and to a lesser extent, their beliefs about sex matching) after a brief online lesson is encouraging. Future work should examine whether students revert to relying on these biases after a delay. Studies that include delayed post-tests would be more similar to the experiences of students in real classrooms who are tested on material they learned weeks or even months before. These studies would inform us of how long-lasting the effects of different visual representations are, and whether people continue to rely on biases after lessons. Additionally, in the current study, we used brief lessons to attempt to correct these biases. Future work should examine whether more comprehensive biological instruction that directly challenges these biases would lead to greater conceptual change. Finally, future work should examine whether correcting these beliefs at younger ages is more effective, because there would be less time for the beliefs to become entrenched in students’ thinking [69].

9. Limitations

The results of these studies need to be considered in light of their limitations. First, both studies used a very brief lesson. Even though there were changes in how participants thought about genetics after the lesson, it is possible that the lesson was not long enough to prompt long-term change. Second, students completed the studies online in an unmoderated setting. This setting was necessary given that we could not collect data in person due to the COVID-19 pandemic, and it does mimic the conditions of an asynchronous online class. However, participants may have had other distractions that influenced their attention. The type of device and the screen size that participants used to watch the lesson were also not controlled, potentially leading to uncontrolled differences in diagram size and clarity. Small screen sizes could have lessened the effects of the experimental manipulations. Finally, our study included only students from a large research university in the United States. It is possible that students at other types of universities or in other locations might have different responses to the diagrams, as the influence of features of diagrams can depend on the characteristics of the learners [70,71].

10. Conclusions

In these studies, we investigated whether undergraduate students would transfer more from a genetics lesson that used perceptually rich, perceptually bland, or abstract visual representations, providing the first test of how the perceptual features of diagrams influence learning about genetic inheritance. Although students learned from all of the lessons, they transferred more from the rich diagram than from the abstract diagram. We did not find any differences in learning or transfer between the rich and bland diagrams. These results are counter to prior findings with other biology topics, but they suggest that for genetics instruction, having some concrete elements that are easily interpretable by students can be beneficial. Further, the findings suggest that online lessons might benefit from including perceptually rich visual representations as they are more attention grabbing. Future work should examine whether explicitly explaining the symbolic elements of abstract visual representations and their connections to real-world referents can help students learn from them. These studies show that abstract visual representations are not always better for transfer—suggesting that previous claims that abstract or bland visual representations are beneficial may need to be qualified. In the context of other work, our findings suggest that the effects of perceptual features of visual representations might depend on the content domain and on the age and experience of the students. More broadly, our findings highlight the importance of studying where, when, and for whom a visual representation is effective.

Author Contributions

Conceptualization, D.M., O.N.M., K.S.R. and M.W.A.; methodology, D.M.; validation, D.M., A.M.D., O.N.M., R.E.K. and S.H.Y.; formal analysis, D.M.; investigation, D.M. and A.M.D.; writing—original draft preparation, D.M.; writing—review and editing, D.M., A.M.D., O.N.M., R.E.K., S.H.Y., K.S.R. and M.W.A.; visualization, D.M.; project administration, A.M.D.; funding acquisition, K.S.R. and M.W.A. All authors have read and agreed to the published version of the manuscript.

Funding

The research reported in this article was supported by the National Science Foundation, through Award # 1760940 to K.S.R and M.W.A. The opinions expressed are those of the authors and do not represent views of NSF.

Institutional Review Board Statement

The study was conducted in accordance with the Declaration of Helsinki, and approved by the Institutional Review Board of University of Wisconsin–Madison (protocol code: 2018-0789, date of approval: 6 November 2018).

Informed Consent Statement

Informed consent was obtained from all subjects involved in the study.

Data Availability Statement

All of the data, and analysis scripts for these studies can be found at https://osf.io/4bt8h/?view_only=de690a5b73c0480dbb64e253a11170ad (accessed on 6 February 2024) and https://osf.io/cx5uw/?view_only=1577cad59aa74271877e99b61360af41 (accessed on 6 February 2024).

Conflicts of Interest

The authors declare no conflict of interest.

References

  1. Batzli, J.M.; Smith, A.R.; Williams, P.H.; McGee, S.A.; Dósa, K.; Pfammatter, J. Beyond Punnett Squares: Student Word Association and Explanations of Phenotypic Variation through an Integrative Quantitative Genetics Unit Investigating Anthocyanin Inheritance and Expression in Brassica rapa Fast Plants. CBE Life Sci. Educ. 2014, 13, 410–424. [Google Scholar] [CrossRef]
  2. Batzli, J.M.; Knight, J.K.; Hartley, L.M.; Maskiewicz, A.C.; Desy, E.A. Crossing the Threshold: Bringing Biological Variation to the Foreground. CBE Life Sci. Educ. 2016, 15, es9. [Google Scholar] [CrossRef]
  3. Emmons, N.; Lees, K.; Kelemen, D. Young Children’s Near and Far Transfer of the Basic Theory of Natural Selection: An Analogical Storybook Intervention. J. Res. Sci. Teach. 2018, 55, 321–347. [Google Scholar] [CrossRef]
  4. NGSS Lead States. Next Generation Science Standards: For States, By States; The National Academies Press: Washington, DC, USA, 2013; ISBN 978-0-309-27227-8. [Google Scholar]
  5. APEC Human Resource Development Working Group. Analysis of Mathematics and Science Standards from the Asia-Pacific Economic Cooperation 2009; APEC Secretariat: Washington, DC, USA, 2011. [Google Scholar]
  6. OECD. PISA 2021 Technical Standards; OECD: Paris, France, 2018; Volume 25. [Google Scholar]
  7. Stern, F.; Delaval, M.; Kampourakis, K.; Müller, A. Implicit Associations of Teleology and Essentialism Concepts with Genetics Concepts among Secondary School Students. PLoS ONE 2020, 15, e0242189. [Google Scholar] [CrossRef]
  8. Stern, F.; Kampourakis, K.; Müller, A. “Genes for a Role,” “Genes as Essences”: Secondary Students’ Explicit and Implicit Intuitions about Genetic Essentialism and Teleology. J. Res. Sci. Teach. 2023, 60, 237–267. [Google Scholar] [CrossRef]
  9. Stern, F.; Kampourakis, K. Teaching for Genetics Literacy in the Post-Genomic Era. Stud. Sci. Educ. 2017, 53, 193–225. [Google Scholar] [CrossRef]
  10. Kaminske, A.N.; Kuepper-Tetzel, C.E.; Nebel, C.L.; Sumeracki, M.A.; Ryan, S.P. Transfer: A Review for Biology and the Life Sciences. CBE Life Sci. Educ. 2020, 19, es9. [Google Scholar] [CrossRef]
  11. Newman, D.L.; Catavero, C.M.; Wright, L.K. Students Fail to Transfer Knowledge of Chromosome Structure to Topics Pertaining to Cell Division. CBE Life Sci. Educ. 2012, 11, 425–436. [Google Scholar] [CrossRef]
  12. Mayer, R.E. Multimedia Learning, 2nd ed.; Cambridge University Press: Cambridge, UK; New York, NY, USA, 2009; ISBN 978-0-521-51412-5. [Google Scholar]
  13. Solomon, G.E.A. Birth, Kind and Naïve Biology. Dev. Sci. 2002, 5, 213–218. [Google Scholar] [CrossRef]
  14. Solomon, G.E.A.; Johnson, S.C.; Zaitchik, D.; Carey, S. Like Father, Like Son: Young Children’s Understanding of How and Why Offspring Resemble Their Parents. Child Dev. 1996, 67, 151–171. [Google Scholar] [CrossRef]
  15. Williams, J.M. Children and Adolescents’ Understandings of Family Resemblance: A Study of Naïve Inheritance Concepts: Phenotypic Similarity and Difference. Br. J. Dev. Psychol. 2012, 30, 225–252. [Google Scholar] [CrossRef]
  16. Coley, J.D.; Tanner, K.D. Common Origins of Diverse Misconceptions: Cognitive Principles and the Development of Biology Thinking. CBE Life Sci. Educ. 2012, 11, 209–215. [Google Scholar] [CrossRef]
  17. Gelman, S.A.; Rhodes, M. “Two-Thousand Years of Stasis”: How Psychological Essentialism Impedes Evolutionary Understanding. In Evolution Challenges: Integrating Research and Practice in Teaching and Learning about Evolution; Rosengren, K.S., Brem, S.K., Evans, E.M., Sinatra, G.M., Eds.; Oxford University Press: Oxford, UK, 2012. [Google Scholar]
  18. Kelemen, D. Teleological Minds: How Natural Intuitions about Agency and Purpose Influence Learning about Evolution. In Evolution Challenges: Integrating Research and Practice in Teaching and Learning about Evolution; Rosengren, K.S., Brem, S.K., Evans, E.M., Sinatra, G.M., Eds.; Oxford University Press: Oxford, UK, 2012; pp. 66–92. [Google Scholar]
  19. Kelemen, D.; Rottman, J.; Seston, R. Professional Physical Scientists Display Tenacious Teleological Tendencies: Purpose-Based Reasoning as a Cognitive Default. J. Exp. Psychol. Gen. 2013, 142, 1074–1083. [Google Scholar] [CrossRef]
  20. Coley, J.D.; Arenson, M.; Xu, Y.; Tanner, K.D. Intuitive Biological Thought: Developmental Changes and Effects of Biology Education in Late Adolescence. Cognit. Psychol. 2017, 92, 1–21. [Google Scholar] [CrossRef]
  21. Menendez, D.; Mathiaparanam, O.N.; Seitz, V.; Liu, D.; Donovan, A.M.; Kalish, C.W.; Alibali, M.W.; Rosengren, K.S. Like Mother, like Daughter: Adults’ Judgments about Genetic Inheritance. J. Exp. Psychol. Appl. 2023, 29, 63. [Google Scholar] [CrossRef]
  22. Menendez, D.; Donovan, A.M.; Mathiaparanam, O.N.; Seitz, V.; Sabbagh, N.F.; Klapper, R.E.; Kalish, C.W.; Rosengren, K.S.; Alibali, M.W. Deterministic or Probabilistic: U.S. Children’s Beliefs about Genetic Inheritance. Child Dev. 2024. [Google Scholar] [CrossRef]
  23. Godwin, K.E.; Leroux, A.J.; Seltman, H.; Scupelli, P.; Fisher, A.V. Effect of Repeated Exposure to the Visual Environment on Young Children’s Attention. Cogn. Sci. 2022, 46, e13093. [Google Scholar] [CrossRef]
  24. Woodward, A. Do Illustrations Serve an Instructional Purpose in U.S. Textbooks? In Learning from Textbooks: Theory and Practice; Britton, B.K., Binkley, M., Woodward, A., Binkley, M.R., Eds.; Psychology Press: London, UK, 1993; pp. 115–134. ISBN 978-0-8058-0677-9. [Google Scholar]
  25. Menendez, D. Cues to Generality: Integrating Linguistic and Visual Information When Generalizing Biological Information. J. Educ. Psychol. 2023, 115, 1110–1124. [Google Scholar] [CrossRef]
  26. Menendez, D.; Mathiaparanam, O.N.; Liu, D.; Seitz, V.; Alibali, M.W.; Rosengren, K.S. Representing Variability: The Case of Life Cycle Diagrams. CBE Life Sci. Educ. 2020, 19, ar49. [Google Scholar] [CrossRef]
  27. Wiley, J.; Sarmento, D.; Griffin, T.D.; Hinze, S.R. Biology Textbook Graphics and Their Impact on Expectations of Understanding. Discourse Process. 2017, 54, 463–478. [Google Scholar] [CrossRef]
  28. Wright, L.K.; Fisk, J.N.; Newman, D.L. DNA → RNA: What Do Students Think the Arrow Means? CBE Life Sci. Educ. 2014, 13, 338–348. [Google Scholar] [CrossRef]
  29. Kaminski, J.A.; Sloutsky, V.M.; Heckler, A.F. The Cost of Concreteness: The Effect of Nonessential Information on Analogical Transfer. J. Exp. Psychol. Appl. 2013, 19, 14–29. [Google Scholar] [CrossRef]
  30. Fisher, A.V.; Godwin, K.E.; Seltman, H. Visual Environment, Attention Allocation, and Learning in Young Children: When Too Much of a Good Thing May Be Bad. Psychol. Sci. 2014, 25, 1362–1370. [Google Scholar] [CrossRef]
  31. Harp, S.F.; Mayer, R.E. How Seductive Details Do Their Damage: A Theory of Cognitive Interest in Science Learning. J. Educ. Psychol. 1998, 90, 414–434. [Google Scholar] [CrossRef]
  32. Morita, A.; Fukuya, I. Impact of Decorative Pictures in Learning Materials: The Effect of Attention-Grabbing Features. Appl. Cogn. Psychol. 2023, 37, 1352–1365. [Google Scholar] [CrossRef]
  33. Skulmowski, A.; Rey, G.D. Realistic Details in Visualizations Require Color Cues to Foster Retention. Comput. Educ. 2018, 122, 23–31. [Google Scholar] [CrossRef]
  34. Abercrombie, S. Transfer Effects of Adding Seductive Details to Case-Based Instruction. Contemp. Educ. Psychol. 2013, 38, 149–157. [Google Scholar] [CrossRef]
  35. Eitel, A.; Bender, L.; Renkl, A. Are Seductive Details Seductive Only When You Think They Are Relevant? An Experimental Test of the Moderating Role of Perceived Relevance. Appl. Cogn. Psychol. 2019, 33, 20–30. [Google Scholar] [CrossRef]
  36. Skulmowski, A.; Rey, G.D. Realism as a Retrieval Cue: Evidence for Concreteness-specific Effects of Realistic, Schematic, and Verbal Components of Visualizations on Learning and Testing. Hum. Behav. Emerg. Technol. 2020, 3, 283–295. [Google Scholar] [CrossRef]
  37. Skulmowski, A.; Rey, G.D. The Realism Paradox: Realism Can Act as a Form of Signaling despite Being Associated with Cognitive Load. Hum. Behav. Emerg. Technol. 2020, 2, 251–258. [Google Scholar] [CrossRef]
  38. Goldstone, R.L.; Sakamoto, Y. The Transfer of Abstract Principles Governing Complex Adaptive Systems. Cognit. Psychol. 2003, 46, 414–466. [Google Scholar] [CrossRef]
  39. Goldstone, R.L.; Son, J.Y. The Transfer of Scientific Principles Using Concrete and Idealized Simulations. J. Learn. Sci. 2005, 14, 69–110. [Google Scholar] [CrossRef]
  40. Kaminski, J.A.; Sloutsky, V.M.; Heckler, A.F. The Advantage of Abstract Examples in Learning Math. Science 2008, 320, 454–455. [Google Scholar] [CrossRef] [PubMed]
  41. Gentner, D. Structure-Mapping: A Theoretical Framework for Analogy. Cogn. Sci. 1983, 7, 155–170. [Google Scholar] [CrossRef]
  42. Rau, M.A. How Do Students Learn to See Concepts in Visualizations? Social Learning Mechanisms with Physical and Virtual Representations. J. Learn. Anal. 2017, 4, 240–263. [Google Scholar] [CrossRef]
  43. Stieff, M. Improving Representational Competence Using Molecular Simulations Embedded in Inquiry Activities. J. Res. Sci. Teach. 2011, 48, 1137–1158. [Google Scholar] [CrossRef]
  44. Wright, L.K.; Cardenas, J.J.; Liang, P.; Newman, D.L. Arrows in Biology: Lack of Clarity and Consistency Points to Confusion for Learners. CBE Life Sci. Educ. 2018, 17, ar6. [Google Scholar] [CrossRef] [PubMed]
  45. Nitz, S.; Ainsworth, S.E.; Nerdel, C.; Prechtl, H. Do Student Perceptions of Teaching Predict the Development of Representational Competence and Biological Knowledge? Learn. Instr. 2014, 31, 13–22. [Google Scholar] [CrossRef]
  46. Stieff, M.; Scopelitis, S.; Lira, M.E.; Desutter, D. Improving Representational Competence with Concrete Models: IMPROVING REPRESENTATIONAL COMPETENCE. Sci. Educ. 2016, 100, 344–363. [Google Scholar] [CrossRef]
  47. De Bock, D.; Deprez, J.; Van Dooren, W.; Roelens, M.; Verschaffel, L. Abstract or Concrete Examples in Learning Mathematics? A Replication and Elaboration of Kaminski, Sloutsky, and Heckler’s Study. J. Res. Math. Educ. 2011, 42, 109–126. [Google Scholar] [CrossRef]
  48. Trninic, D.; Kapur, M.; Sinha, T. The Disappearing “Advantage of Abstract Examples in Learning Math”. Cogn. Sci. 2020, 44, e12851. [Google Scholar] [CrossRef]
  49. Menendez, D.; Rosengren, K.S.; Alibali, M.W. Do Details Bug You? Effects of Perceptual Richness in Learning about Biological Change. Appl. Cogn. Psychol. 2020, 34, 1101–1117. [Google Scholar] [CrossRef]
  50. Menendez, D.; Sabbagh, N.F.; Alibali, M.W.; Rosengren, K.S. Timelines or Time Cycles: Exposure to Different Spatial Representations of Time Influences Sketching and Diagram Preferences. Educ. Res. Policy Pract. 2023, 1–19. [Google Scholar] [CrossRef]
  51. Butcher, K.R. Learning from Text with Diagrams: Promoting Mental Model Development and Inference Generation. J. Educ. Psychol. 2006, 98, 182–197. [Google Scholar] [CrossRef]
  52. Skulmowski, A. Is There an Optimum of Realism in Computer-Generated Instructional Visualizations? Educ. Inf. Technol. 2022, 27, 10309–10326. [Google Scholar] [CrossRef]
  53. Skulmowski, A. Realistic Visualizations Can Aid Transfer Performance: Do Distinctive Shapes and Descriptive Labels Contribute towards Learning? J. Comput. Assist. Learn. 2022, 38, 681–691. [Google Scholar] [CrossRef]
  54. Klahr, D.; Chen, Z. Findings One’s Place in Transfer Space. Child Dev. Perspect. 2011, 5, 196–204. [Google Scholar] [CrossRef]
  55. Mathiaparanam, O.N.; Donovan, A.; Menendez, D.; Jones, C.; Yoo, S.H.; Alibali, M.W.; Kalish, C.W.; Rosengren, K. Perceptual Features in Visual Representations: A Content Analysis of Inheritance Diagrams. Proc. Annu. Meet. Cogn. Sci. Soc. 2022, 44, 4061. [Google Scholar]
  56. Duncan, R.G.; Rogat, A.D.; Yarden, A. A Learning Progression for Deepening Students’ Understandings of Modern Genetics across the 5th–10th Grades. J. Res. Sci. Teach. 2009, 46, 655–674. [Google Scholar] [CrossRef]
  57. Brauer, M.; Curtin, J.J. Linear Mixed-Effects Models and the Analysis of Nonindependent Data: A Unified Framework to Analyze Categorical and Continuous Independent Variables That Vary within-Subjects and/or within-Items. Psychol. Methods 2018, 23, 389–411. [Google Scholar] [CrossRef]
  58. DeLoache, J.S. Becoming Symbol-Minded. Trends Cogn. Sci. 2004, 8, 66–70. [Google Scholar] [CrossRef]
  59. DeLoache, J.; Peralta, O.; Anderson, K.N. Multiple Factors in Early Symbol Use—A Theory of the Development of Deliberate Reasoning and Intentional Action. Cogn. Dev. 1999, 14, 299–312. [Google Scholar] [CrossRef]
  60. DeLoache, J.S.; Uttal, D.H.; Pierroutsakos, S.L. The Development of Early Symbolization: Educational Implications. Learn. Instr. 1998, 8, 325–339. [Google Scholar] [CrossRef]
  61. Chandler, P.; Sweller, J. Cognitive Load Theory and the Format of Instruction. Cogn. Instr. 1991, 8, 293–332. [Google Scholar] [CrossRef]
  62. Mayer, R.E.; Moreno, R. Nine Ways to Reduce Cognitive Load in Multimedia Learning. Educ. Psychol. 2003, 38, 43–52. [Google Scholar] [CrossRef]
  63. Skulmowski, A.; Xu, K.M. Understanding Cognitive Load in Digital and Online Learning: A New Perspective on Extraneous Cognitive Load. Educ. Psychol. Rev. 2021, 34, 171–196. [Google Scholar] [CrossRef]
  64. Ainsworth, S. The Educational Value of Multiple-Representations When Learning Complex Scientific Concepts. In Visualization: Theory and Practice in Science Education; Gilbert, J., Reiner, M., Nakhleh, M.B., Eds.; Models and Modeling in Science Education; Springer: New York, NY, USA, 2008; pp. 191–208. ISBN 978-1-4020-5266-8. [Google Scholar]
  65. Donovan, B.M. Framing the Genetics Curriculum for Social Justice: An Experimental Exploration of How the Biology Curriculum Influences Beliefs About Racial Difference. Sci. Educ. 2016, 100, 586–616. [Google Scholar] [CrossRef]
  66. Donovan, B.M.; Weindling, M.; Salazar, B.; Duncan, A.; Stuhlsatz, M.; Keck, P. Genomics Literacy Matters: Supporting the Development of Genomics Literacy through Genetics Education Could Reduce the Prevalence of Genetic Essentialism. J. Res. Sci. Teach. 2021, 58, 520–550. [Google Scholar] [CrossRef]
  67. Clinton, V.; Morsanyi, K.; Alibali, M.W.; Nathan, M.J. Learning about Probability from Text and Tables: Do Color Coding and Labeling through an Interactive-User Interface Help? Appl. Cogn. Psychol. 2016, 30, 440–453. [Google Scholar] [CrossRef]
  68. Betz, N.; Leffers, J.S.; Thor, E.E.D.; Fux, M.; de Nesnera, K.; Tanner, K.D.; Coley, J.D. Cognitive Construal-Consistent Instructor Language in the Undergraduate Biology Classroom. CBE Life Sci. Educ. 2019, 18, ar63. [Google Scholar] [CrossRef]
  69. Kelemen, D. The Magic of Mechanism: Explanation-Based Instruction on Counterintuitive Concepts in Early Childhood. Perspect. Psychol. Sci. 2019, 14, 510–522. [Google Scholar] [CrossRef] [PubMed]
  70. Harsh, J.A.; Campillo, M.; Murray, C.; Myers, C.; Nguyen, J.; Maltese, A.V. “Seeing” Data like an Expert: An Eye-Tracking Study Using Graphical Data Representations. CBE Life Sci. Educ. 2019, 18, ar32. [Google Scholar] [CrossRef]
  71. Sanchez, C.A.; Wiley, J. An Examination of the Seductive Details Effect in Terms of Working Memory Capacity. Mem. Cognit. 2006, 34, 344–355. [Google Scholar] [CrossRef]
Figure 1. Pedigree diagrams used in the lessons for Study 1 and 2. From left to right: the abstract diagram used in Study 1, the rich diagram used in Studies 1 and 2, and the bland diagram used in Study 2.
Education 14 00307 g001
Figure 2. Participants’ probability of endorsing (y-axis) different offspring types (x-axis) for the learning items (top left panels), the near-transfer items (top right panels), the mid-transfer item (bottom left panels), and the far-transfer item (bottom right panels) for Study 1. The results are separated by diagram condition (abstract or rich diagram) in different panels. The points show the model predictions for the probability a given offspring type would be endorsed, and the shape of the points indicates the test time, with circles showing the results for the pre-test and diamonds the results for the post-test. The error bars show the within-subject standard errors of the point estimates.
Education 14 00307 g002
Figure 3. Participants’ probability of selecting (y-axis) different offspring types (x-axis) for the learning items (top left panels), the near-transfer items (top right panels), the mid-transfer item (bottom left panels), and the far-transfer item (bottom right panels) for Study 1. The results are separated by diagram condition (abstract or rich diagram) in different panels. The points show the model predictions for the probability a given offspring type would be selected, and the shape of the points indicates the test time, with circles showing the results for the pre-test and diamonds the results for the post-test. The error bars show the within-subject standard errors of the point estimates.
Education 14 00307 g003
Figure 4. Participants’ probability of selecting (y-axis) different offspring types (x-axis) for Study 1 (top three panels) and Study 2 (bottom three panels) for items for which the mother and father had different eye colors. Within the panels for each study, the top panel shows the results for the pre-test item, the middle panel shows results for the near-transfer item, and the bottom panel shows the results for the mid-transfer item. The graphs on the left show selections for female offspring and the ones on the right show selections for male offspring. The error bars show the within-subject standard errors of the point estimates.
Education 14 00307 g004
Figure 5. Participants’ probability of endorsing (y-axis) different offspring types (x-axis) for the learning items (top left panels), the near-transfer items (top right panels), the mid-transfer item (bottom left panels), and the far-transfer item (bottom right panels) for Study 2. The results are separated by diagram condition (perceptually bland or perceptually rich diagram) in different panels. The points show the model predictions for the probability a given offspring type would be endorsed, and the shape of the points indicates test time, with circles showing the results for the pre-test and diamonds the results for the post-test. The error bars show the within-subject standard errors of the point estimates.
Education 14 00307 g005
Figure 6. Participants’ probability of selecting (y-axis) different offspring types (x-axis) for the learning items (top left panels), the near-transfer items (top right panels), the mid-transfer item (bottom left panels), and the far-transfer item (bottom right panels) for Study 2. The results are separated by diagram condition (bland or rich diagram) in different panels. The points show the model predictions of the probability a given offspring type would be selected, and the shape of the points indicates test time, with circles showing the results for the pre-test and diamonds the results for the post-test. The error bars show the within-subject standard errors of the point estimate.
Education 14 00307 g006
Disclaimer/Publisher’s Note: The statements, opinions and data contained in all publications are solely those of the individual author(s) and contributor(s) and not of MDPI and/or the editor(s). MDPI and/or the editor(s) disclaim responsibility for any injury to people or property resulting from any ideas, methods, instructions or products referred to in the content.

