Article

Is Subjective Knowledge the Key to Fostering Sustainable Behavior? Mixed Evidence from an Education Intervention in Mexico

1
School of Sustainability, Arizona State University, Tempe, AZ 85281, USA
2
Center for Global Sustainability and Cultural Transformation, Leuphana University, Lüneburg 21335, Germany
*
Author to whom correspondence should be addressed.
Educ. Sci. 2017, 7(1), 4; https://doi.org/10.3390/educsci7010004
Submission received: 28 October 2016 / Revised: 9 December 2016 / Accepted: 15 December 2016 / Published: 24 December 2016
(This article belongs to the Special Issue Sustainability, Environment and Education)

Abstract

:
Educational interventions are a promising way to shift individual behaviors towards Sustainability. Yet, as this research confirms, the standard fare of education, declarative knowledge, does not work. This study statistically analyzes the impact of an intervention designed and implemented in Mexico using the Educating for Sustainability (EfS) framework which focuses on imparting procedural and subjective knowledge about waste through innovative pedagogy. Using data from three different rounds of surveys we were able to confirm (1) the importance of subjective and procedural knowledge for Sustainable behavior in a new context; (2) the effectiveness of the EfS framework and (3) the importance of changing subjective knowledge for changing behavior. While the impact was significant in the short term, one year later most if not all of those gains had evaporated. Interventions targeted at subjective knowledge will work, but more research is needed on how to make behavior change for Sustainability durable.

1. Introduction

Achieving a Sustainable future requires that individuals around the world adopt different habits and behaviors. Psychologists as well as other scholars have proposed a diverse array of models to explain why some people act more sustainably than others do, but have had only limited success in reaching a professional consensus regarding the underlying drivers of Sustainable behaviors. The world’s Sustainability challenges cannot await the development of a perfect theoretical model of Sustainable behavior. Rather, what is urgently needed is to extract from psychological and behavior research the principals which can most effectively inform the development of the interventions which create meaningful and durable changes towards Sustainability in the participants’ behaviors.
Much work has already been done in this direction. Of particular importance is that of psychologist McKenzie-Mohr who has distilled a host of research into a practical behavior change toolkit for community-level interventions [1]. Others have pointed to education as one of the best entry points for fostering Sustainable behavior change [2,3,4,5]. Unfortunately, even education programs with explicit Sustainable behavior change goals are failing to integrate the most basic behavioral research into their curricular design and implementation [6]. One practical framework for educational interventions which foster Sustainable behavior change, was proposed by one of us [7]; hereafter referred to as the Educating for Sustainability framework (EfS). Initial efforts have shown that this approach has promise [8], but this paper is the first attempt to statistically evaluate the EfS framework’s potential for changing behaviors via educational interventions. More importantly this contributes to our understanding of whether psychological insights into Sustainable behavior can be effectively applied in a typical educational setting.

1.1. Influence of Knowledge on Sustainable Behavior

These broader insights are due to the fact that the Educating for Sustainability framework is based on the integration of several strands of research including behavior change, Sustainability science and education pedagogy. The foundation of this framework is the well-studied result that knowledge of facts (which is the typical focus of education) does little to influence behavior [9,10]. A wide array of theoretical frameworks have been proposed to explain what exactly does motivate Sustainable behaviors and “although many hundreds of studies have been undertaken, no definitive explanation has yet been found [10].” The Educating for Sustainability framework integrates the insights of these researchers by using Kaiser and Fuhrer’s [11] concept of different domains of knowledge. The theory behind this approach has been fully fleshed out elsewhere [7,8]. In brief we propose that procedural knowledge and subjective knowledge are the keys to Sustainable behavior change, while declarative knowledge is far less so. A broad extensive survey previously conducted by the authors found exactly this relationship for both food and waste behaviors [12].
  • Declarative Knowledge: This domain encompasses much of what is typically considered “knowledge”; facts about how long plastic persists in the environment or what happens to organics in the landfill. We do not argue that declarative knowledge is unnecessary just that it is insufficient to motivate Sustainable behavior change;
  • Procedural Knowledge: This is the ‘how-to’ knowledge necessary to actually take Sustainable action. For example, this may encompass knowledge of what type of recyclables your local community collects or how to manage a compost pile at home. Some types of procedural knowledge are highly situational while others are more universal;
  • Subjective Knowledge: This domain encompasses a broad range including values, attitudes, and beliefs about consequences of personal action. Additionally, this domain includes information one has regarding these issues for family and friends as well as general social norms both descriptive and injunctive [13]. Previously, we had divided subjective knowledge into two domains—effectiveness and social—but have decided that they are best unified into one domain. The specific reasons for this are elaborated fully in Appendix B.3. Subjective knowledge includes for example beliefs about whether recycling will have an impact and if your friends would find composting at home gross or strange.

1.2. Designing an Intervention with the Educating for Sustainability Framework

While education interventions generally have been shown to be an effective avenue for promoting Sustainable behaviors [14], little has been done to evaluate outcomes for behavior in higher education [15]. For this research we are assessing the impact of a stand-alone Sustainability elective course for Mexican university students of all majors on knowledge and behaviors with regards to Sustainability and waste. In order to effectively target subjective and procedural domains of knowledge and thus promote Sustainable behavior, new approaches are needed in the classroom [7,8]. The intervention was therefore designed and implemented based on the EfS framework with an emphasis on developing the procedural and subjective knowledge of the participants. Some of the ways this was done included a focus on student choice, building social support and networks and an emphasis on systems thinking. For a full description of the education intervention itself see Appendix A.

1.3. Research Questions and Hypothesis

1.3.1. Is the Relationship between Procedural and Subjective Knowledge and Sustainable Behaviors Cross-Culturally Robust?

The broad applicability of much behavioral science research has been justifiably questioned [16] given its narrow sampling base. Latin America is particularly poorly represented, one survey of psychological literature found that only 1% of the sampled publications included participants from Latin America [17]. Comparative surveys of environmental knowledge and behavior which have recently been undertaken in the region have found differences between countries [18,19], emphasizing the need for caution in extrapolating findings from studies undertaken in Europe or the United States to other parts of the world.
Our previous study, which found significant relationships between levels of procedural and subjective knowledge and Sustainable food and waste behaviors, was investigating a narrow population, K-12 teachers in the United States [12]. We do not assume that our proposed knowledge-behavior relationship is cross-culturally robust and seek to confirm that it holds up as a necessary condition for answering the rest of the questions in this study.
Hypothesis 1.
Higher levels of subjective and procedural knowledge correlates with more Sustainable behavior while higher levels of declarative knowledge do not.

1.3.2. Does Using the Educating for Sustainability Framework Create an Educational Program Which Effectively Targets Procedural and Subjective Knowledge?

If procedural and subjective knowledge are the keys to Sustainable behavior than it is essential to design interventions which effectively target those knowledge domains. The EfS framework proposes that the key output of an effective educational intervention is increased procedural and subjective knowledge relevant to the targeted behavior [8]. Increases in these types of knowledge should lead to the desired outcome of more Sustainable behavior. We designed an educational intervention using the EfS framework (as described in Appendix A) and collected data before and after to evaluate whether this intervention resulted in the desired impact on the participants.
Hypothesis 2.
Participating students will show an increase in their procedural and subjective knowledge as well as Sustainable behaviors after the educational program.

1.3.3. Does increasing Procedural and Subjective Knowledge in an Individual Increase Their Likelihood of Behaving More Sustainably?

Much of the research on links between knowledge and human behaviors only looks at relationships for a snapshot in time [20]. We identified this as one of the key weaknesses in our extensive survey, writing: “from this data alone we cannot conclude that an intervention (such as an education program) which increases an individual’s knowledge in the different domains will correspondingly increase their participation in Sustainable behaviors [12].” Demonstrating a correlation between procedural and subjective knowledge and behavior is insufficient evidence that changing these types of knowledge will lead to changes in behavior. We therefore must look at the relationship between changes in knowledge and changes in behavior among the study’s participants.
Hypothesis 3.
Changes in procedural and subjective knowledge will predict changes in Sustainable behavior while changes in declarative knowledge will not.

1.3.4. Do Changes in the Knowledge Domains and Sustainable Behavior Endure over the Long Run for Participants in Education Programs Such As This?

To effectively contribute to Sustainability an educational intervention needs to create long-term behavior change. Unfortunately, education programs have been relatively unsuccessful at creating this type of enduring change in participants’ behaviors [2,21]. Indeed, Redman [8] found that over the course of the year after a summer education program the participants’ level of Sustainable behaviors slowly declined (though still ended up more Sustainable than before the intervention). Unfortunately, most studies only report on results from immediately after an education program or a follow-up of mere weeks [22]. We contend that in the long run there is a significant drop-off in impact of education interventions, but how much is too little studied. The important question for determining if education programs generally and the EfS framework specifically can foster the necessary changes towards more Sustainable behavior is the scale of the decline. To be a useful tool for Sustainability there must still be significant increases in behavior a year or more out.
Hypothesis 4.
After one year participating students will still have increased knowledge (in all domains) and Sustainable behaviors relative to before the education program.

2. Methods

In this section we provide only a brief overview of the methods applied in this study. A full and detailed description of the methods is included in the Appendix B, Appendix C and Appendix D while the raw survey data and R analysis script is available online.

2.1. Instrument Design

Many environmental/Sustainability knowledge/behavior surveys attempt to cover the full range of topics (e.g., food, waste, energy, water, etc.) but this leads to little information about each one and overly long surveys [23,24,25]. More importantly, there is evidence that individuals’ knowledge and actions vary from area to area and a general survey washes that out [26]. We chose to focus our survey instrument on assessing knowledge and behavior with regards only to household waste for several reasons: (1) To build on the work we have previously done which focused specifically on food and waste behaviors; (2) Waste was one of the focal subjects of our educational intervention whose impact we are studying; (3) Sustainable waste strategies are relatively well accepted by experts and known about even by those who do not participate in them (e.g., recycling).
Beginning with our previously developed survey [12], we translated the questions and made three significant changes. (1) We only asked questions about three knowledge domains having combined social and effectiveness knowledge (see Appendix B.3.); (2) Beyond that we sought to shorten the overall instrument to make it easier to deploy both online and for later in-person household studies (paper forthcoming); (3) We needed to make it specific and relevant to Mexico. For example we asked if people “separated” their waste at home. This is not sorting waste into recycling and non-recycling. Rather the policy in Mexico is to get waste separated into “organics” and “inorganics” at the household level. The idea is that this keeps potential recyclable material clean in the “inorganics” pile and easy for people later in the waste stream to sort through. We used a four point Likert scale and categorized the questions into four groups: declarative knowledge, procedural knowledge, subjective knowledge and behaviors (for more information see Appendix B.4). A sample of questions are show in Table 1 while the full survey instrument is provided in the Appendix C in the original Spanish as well as a translation into English.

2.2. Participant Population

This research was conducted with students at a newly opened branch of Mexico’s National University (UNAM) in Leon, Guanajuato. The only Sustainability or environmental curriculum that the students were exposed to was imparted in our classes. The baseline data was collected in the first week of our classes and included students from all five degree programs (then existing). This baseline data is divided into two groups an intervention sample and a non-intervention sample. The intervention sample was surveyed again in full after the intervention was over. One year later we were able to get follow-up responses from a sub-sample of the intervention sample. Descriptive information about these samples can be seen in Table 2.
Although the sampling methodology was not random we contend that our samples are sufficiently representative for the purposes of this study. We provide a fuller justification in Appendix D.5 including the results of the Kolmogorov-Smirnov (KS) test we used to compare the samples.
This population of Mexican students was sufficient for answering the research questions of the present study for a couple reasons in particular. First, they are a very different group than those surveyed previously, providing a serious check on the broad applicability of the knowledge-behavior link for Sustainability. Secondly, higher education institutions everywhere are committing to creating Sustainable citizens but there is as yet little evidence whether the courses and curriculum offered are achieving this laudable goal [15]. Ultimately, the university students of our sample, while not representative of the general population, are exactly the population that educational interventions of this type are targeted at.

2.3. Implementation and Analysis

The instrument was delivered via a web-based form and for all cases the identical form was used (see Appendix B.5 for more detail). After anonymizing the data and removing duplicate and incomplete entries we have shared online the raw survey results in CSV format. All data manipulation and analysis was completed in R, an open-source statistical package and all the R script necessary to reproduce the results is also included. In Appendix D we describe in detail all the steps we took including removal of outliers, multicollinearity checks, the complete statistical outputs and more. Since the scales we use are both specific to this study and effectively arbitrary we report standardized results in the body of the paper. In Appendix B.6 we describe how we created the standardized coefficient of the regressions and calculated Cohen’s D (or effect size) for the t-tests. Appendix D includes both the standardized and unstandardized results.

3. Results

In this section we will discuss the specific analysis done to test each of the hypothesis and briefly present the results. The full results with additional analysis and tables can be found in Appendix D.
Hypothesis 1.
Higher levels of subjective and procedural knowledge correlates with more Sustainable behavior while higher levels of declarative knowledge do not.
In order to assess this hypothesis, we looked at the ‘all student’ sample which after cleaning and outlier removal had 119 observations. In general, for this study we will measure the levels of knowledge in the three domains and behavior using indices whose composition is detailed in Appendix D.2. Table 3 reports basic information about the indices for the all student sample including Cronbach’s Alpha—a measure of how related the individual items of the index are. These standardized Alpha’s are sufficiently high as the indices are attempting to capture broad domains and incorporate diverse concepts [27]. However, the behavior index does not have a satisfactory alpha value due the multitude of behaviors it encompasses, which includes questions ranging from water bottle use to recycling. Interestingly, the correlation of the items dramatically increased after the intervention (to 0.70), presumably as the students had begun to link these behaviors more closely together themselves.
For all of the regressions in this study we used ordinary least squares (OLS) and controlled for sex, age, origin, degree program and final grade and checked for multicollinearity among the variables. We standardized the coefficients using the method suggested by Gelman [28]. In the body of the paper we will report only the standardized results for the knowledge domains and significant control variables. The full results and details of the regressions can be found in Appendix D.
The regression results support the hypothesis that procedural and subjective knowledge correlate with Sustainable behavior. The very low p-value (p < 0.01) and high estimate for the coefficient suggest a very robust relationship. Meanwhile, declarative knowledge does not correlate (as hypothesized).
Hypothesis 2.
Participating students will show an increase in their procedural and subjective knowledge as well as Sustainable behaviors after the educational program.
We ran a paired t-test comparing the pre- and post- survey answers for the intervention participants and calculated an effect size of the intervention using Cohen’s D. Across the board there were statistically significant improvements on all but two of the survey questions (even after adjusting the p-values for multiple comparisons, see Appendix D.10). Our focus is as always on the indices where we can be confident of a significant positive change (
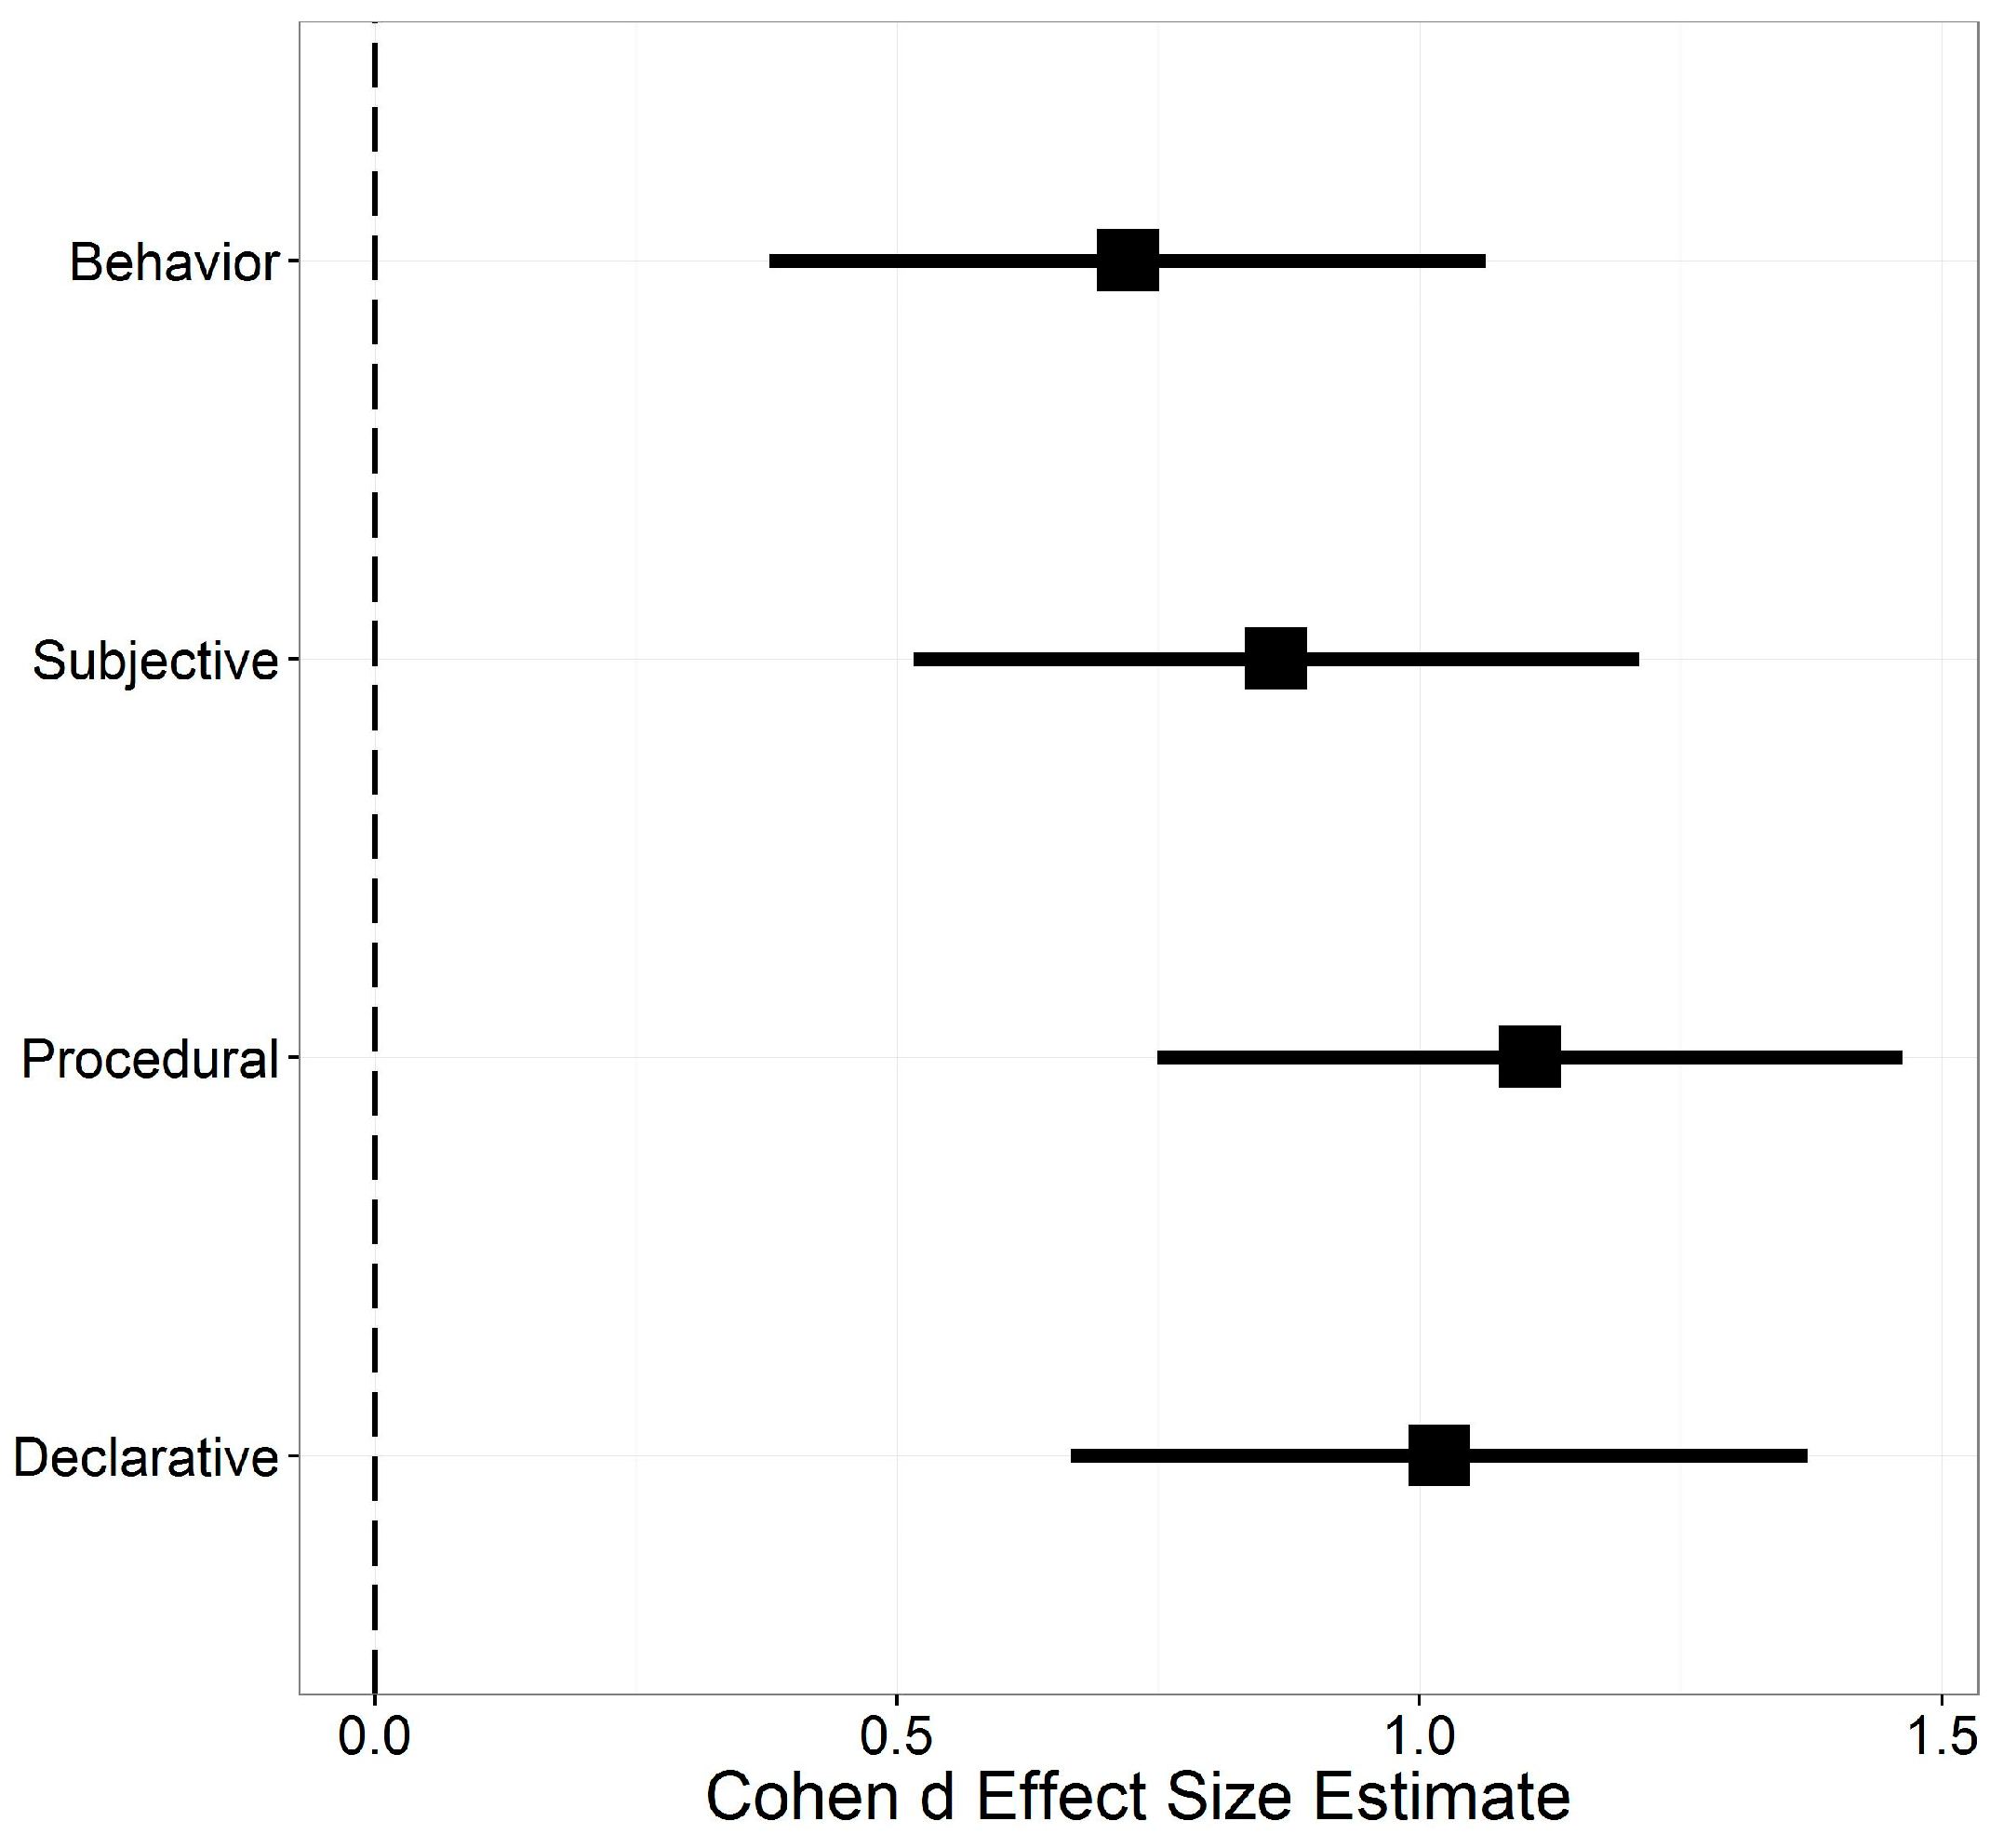
p < 0.01) for all four. The graph in Figure 1 shows the estimated change along with the 95% confidence intervals. The intervention clearly had an impact on the participating students, confirming hypothesis two.
Hypothesis 3.
Changes in procedural and subjective knowledge will predict changes in Sustainable behavior while changes in declarative knowledge will not.
We calculated the change in knowledge and behavior by subtracting each individual students’ post-survey results from their pre-survey results. We could then run a regression to see whether changes in index scores predicted changes in Sustainable behavior. Table 4 displays the regression results for this analysis. Only subjective knowledge is significant and its effect size is quite large. Therefore, hypothesis three is only partially upheld as increases in procedural knowledge did not contribute at all to predicting increases in behavior (neither did declarative knowledge which we had expected).
Hypothesis 4.
After one year participating students will still have increased knowledge (in all domains) and Sustainable behaviors relative to before the education program.
From the subset of students who responded to the follow-up survey one year later we can get an idea of the long term impact of the intervention. There was a large reversion by the participants back to their pre-scores across the board (see Appendix D.13). For the indices, the graph in Figure 2 shows the change between the pre- and follow-up surveys, nearly all the change we saw in Figure 1 having been wiped out. While there is strong evidence for large changes in procedural and social knowledge immediately following the intervention after a year the reversion was so large that we cannot statistically say whether procedural or social knowledge changed over the long run.
We also ran regressions on the follow-up results and the difference between the follow-up and pre-survey scores and found subjective knowledge to be predictive of behavior again and with a large coefficient. Unfortunately, the indices are highly correlated with each other which, when combined with the much reduced sample size, means that this result should be taken much more provisionally than the other evidence for subjective knowledge.

4. Discussion

4.1. Robustness of Knowledge Domains and Their Links to Sustainable Behavior

Our previous study found a strong relationship between procedural and subjective knowledge and Sustainable waste behaviors among US K-12 teachers and this research found the same relationship among a very different population, Mexican university students. In fact, the standardized coefficients are very similar for the US (procedural: 0.313, subjective: 0.302/0.404—was split into two indices) and Mexico (procedural: 0.305, subjective: 0.324). This finding bolsters the case for the broad relevance of procedural and subjective knowledge domains for predicting the participation of individuals in Sustainable behaviors.
One area of concern is that the adjusted R2 in this study is quite a bit lower than we found previously [12], 0.395 vs. 0.787. That suggests that this model is less predictive overall than previous data had suggested. This could be due to change in the survey instrument, including its much shorter length or differences between the two studied populations.

4.2. The Course Made a Big Impact but That Largely Dissipated

The intervention we designed based on the EfS framework had a big impact on the participants’ survey responses (and presumably their knowledge and behaviors). There were large and significant increases in all four indices. In their meta-analysis Osbaldiston and Scott [20] found that the vast majority of experiments on Sustainable behavior change only measure the impact two to eight weeks out at best. What has been done has produced warning flags about the true long term impact of our current efforts. Touching base with eco-tourism participants four months later Ballantyne, Packer and Falk [29] (p. 1249) found that “in general there was a low level of long-term impact.” Our own follow up a year later showed exactly why the predominance of short term analysis in Sustainable behavior change and Sustainability education research is insufficient to evaluate the efficacy of behavior interventions.
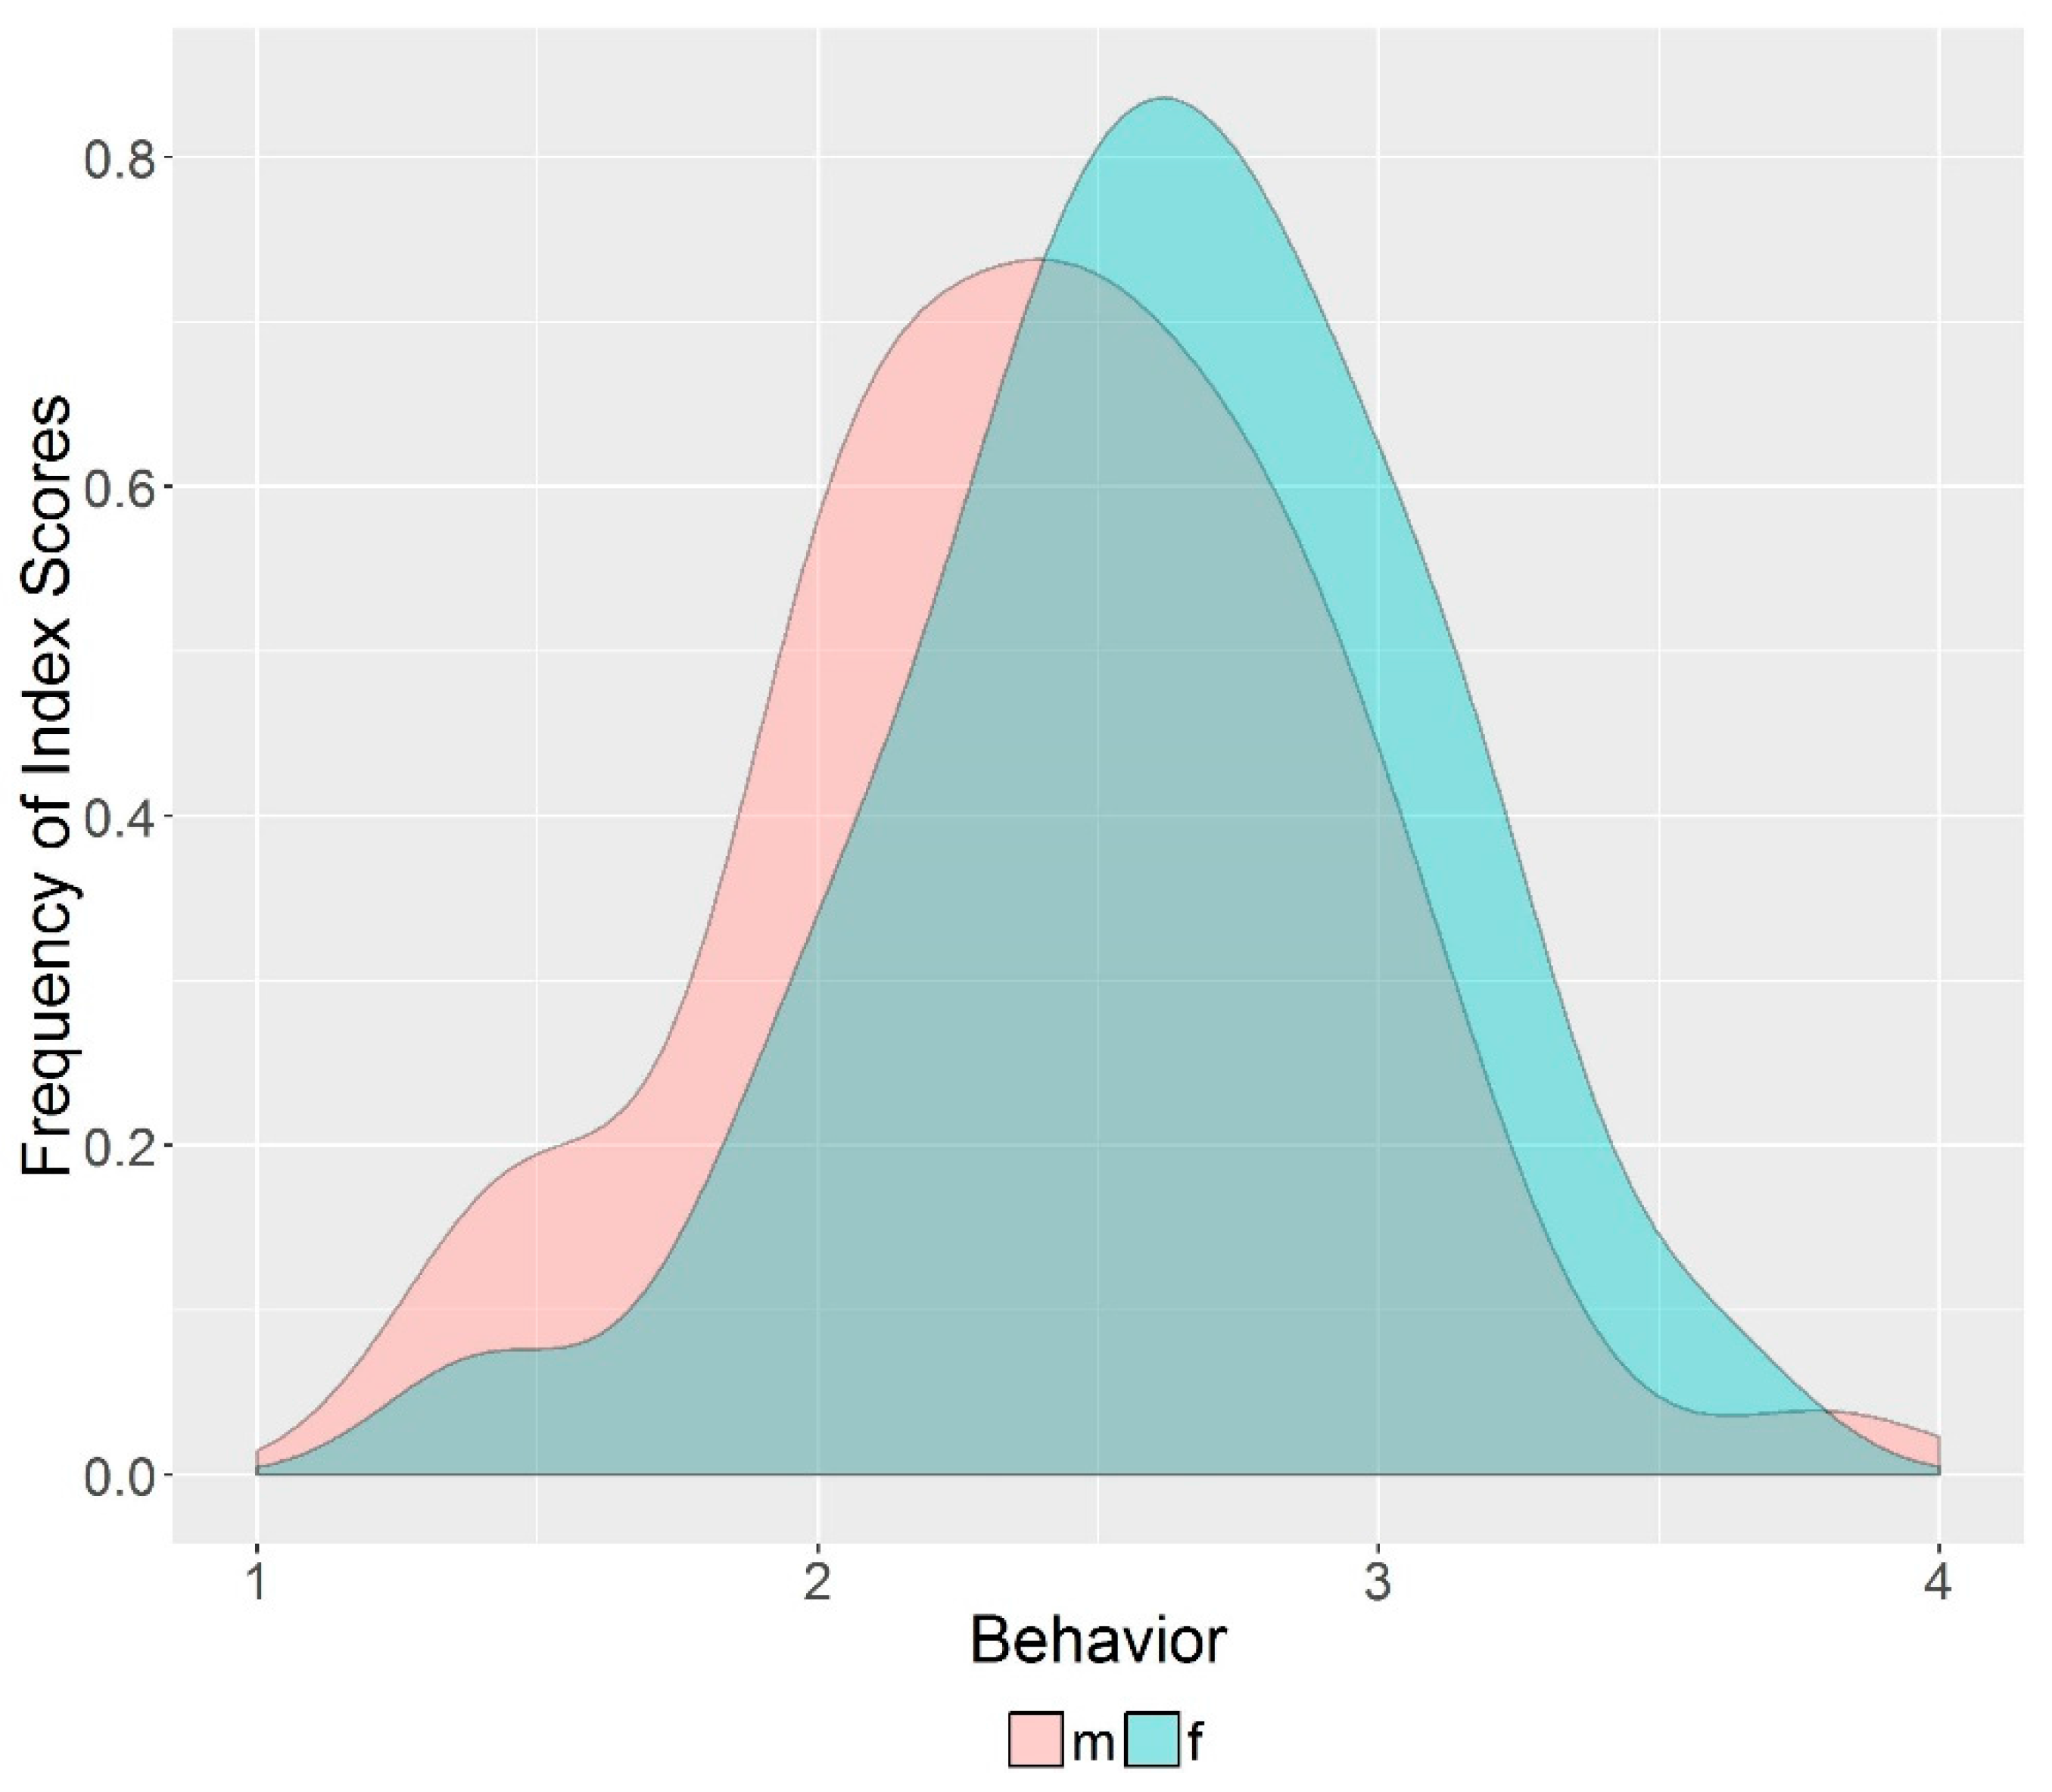
The results from a year later showed that most of the gains in knowledge and behavior have dissipated. Procedural and subjective knowledge, the focus of our intervention suffered most, with the gains of the intervention possibly being completely wiped out. There was however a statistically significant improvement in behaviors which was after all the overall goal of the intervention. If these gains in Sustainable behavior continue to endure the intervention will have been successful, if more modestly so than hoped. Density plot histograms in Figure 3 clearly show how the intervention changed the participants and how the responses mostly reverted for behavior but less so for declarative.

4.3. There Were Significant Differences between the Sexes

Other researchers have found that women have more positive attitudes towards Sustainability [30] and the environment [31] and are more likely to participate in more Sustainable behaviors [32]. In our initial analysis of the ‘all student’ sample we found that to be the case, as can be seen in Table 5, where being female was a significant predictor of Sustainable behavior. An unpaired t-test comparing the male and female respondents found a statistically significant difference (p = 0.024) between the means of their Sustainable behaviors (see Appendix D.15 for full results of this and subsequent analysis related to sex differences).
To investigate this further, we divided our ‘all student’ survey sample by sex and found some very intriguing differences. For females, procedural knowledge had a large effect size 0.490 (p < 0.01) but subjective knowledge was not a significant predictor at all. For males it was the reverse with subjective knowledge being key, effect size 0.792 (p < 0.01) and procedural knowledge not being significant.
Yet, further investigations did cast some doubt as to whether this difference was just so much statistical noise. Firstly, the effect disappeared in the post and follow-up survey as the differences between the sexes for Sustainable behavior became statistically indistinguishable according to t-tests (as well as sex no longer being a significant predictor in the regressions). It is possible that the intervention had a differential impact on male and female students, thus closing the sex gap. Treating the males and females of the all student sample as separate samples we used the Kolmogorov-Smirnov (KS) test to ask if these samples represented different populations. For none of the indices were we able to say that males and females were different populations. It is outside the scope of this research project to investigate sex-based differences further but this suggestive finding has important implications which needs to be taken up in future research.

4.4. Changing Subjective Knowledge Predicted an Increase in Sustainable Behavior

One of the main caveats from our previous research into the relationship between knowledge and waste behaviors was whether changing procedural and/or subjective knowledge would change behaviors. In this study we found evidence that increasing subjective knowledge does increase participation in Sustainable behaviors but increasing procedural knowledge (all else being equal) did not. This is especially interesting because procedural knowledge was still significant when we looked at the relationships in the post-survey, but not when looking at the changes.
It should be noted though that the adjusted R2 is quite a bit smaller when looking at the changes pre vs. post than in the regression for hypothesis one. The adjusted R2 is also small for a regression of just the post survey data (0.264). Our conclusion is that our model is less effective in explaining Sustainable behaviors after participation in the course. Overall the results of this study bolster the case for a focus on subjective knowledge in education interventions though the reduced predictive power of the model (as measured by the R2) and the lack of the expected significance of changing procedural knowledge points to the need for further study and verification.

4.5. Declarative Knowledge Is Easily Acquired and Durable, Yet Its Acquisition Does not Achieve the Goal of Behavior Change

While the EfS framework focuses on subjective (and procedural knowledge), students are expected to gain declarative knowledge as well (perhaps even more effectively than with traditional modes of teaching). We found that, indeed, the participating students significantly improved their declarative knowledge and, more importantly, that improvement endured through to the follow-up survey. Unfortunately, this research also further demonstrated the lack of a link between declarative knowledge and Sustainable behavior. This is not just a static non-relationship, the acquiring of more declarative knowledge did not predict any change in Sustainable behavior either.

5. Conclusions

The results of this study provide substantial support for the idea that the most effective way to encourage the adoption of Sustainable behaviors is to focus on subjective knowledge. This was in fact the only measured variable which was always statistically significant for predicting Sustainable behaviors. Researchers have previously focused on norms, on attitudes, on beliefs or on some other way of framing non-factual knowledge. We believe that a general conception of subjective knowledge which incorporates elements of all these concepts is more practical for implementation. However, subjective knowledge is framed, the relevant point for educators, policy-makers and others looking to foster more Sustainable behaviors is that factual, declarative knowledge is ineffective for achieving this end. Interventions, whether explicitly educational or not, must focus on subjective knowledge if behavior goals are to be achieved.
We are not the first to suggest that subjective knowledge is the key to fostering the Sustainable behaviors our world needs. This study makes an important contribution by confirming its importance in a new context, finding it to be changeable via a purposeful education intervention and showing that changes in subjective knowledge positively impacts Sustainable behavior. Unfortunately, our follow-up survey found that the acquisition of subjective knowledge may be tenuous with average scores reverting to virtually where they were in the pre-survey after only a year. All interventions, particularly educational ones are time limited. This one was a full semester; many educational interventions are shorter. If subjective knowledge increases a lot during the intervention, as it did in this study, that is great, but ultimately meaningless if this gain dissipates completely over the long run. Is it simply impossible for a short intervention to durably change subjective knowledge? Could low cost and efficient methods like spot-check-ins or social media be sufficient to bolster subjective knowledge over the long run? Or is it necessary to foster university-wide (or community wide) social norms? Ultimately, researchers must show that subjective knowledge can be durably acquired if it is to be recommended as a tool for achieving Sustainability.
There are many possibilities beyond subjective knowledge for fostering Sustainable behavior but as long as researchers close out their studies with post-surveys and lack a long term follow-up, we will never really know what works. Our study found that the results of a post-survey were not indicative of long term change and that one year later knowledge of all kinds was reduced. Yet we did find a small but significant positive change in behavior, lending support to the utility of the Educating for Sustainability framework for promoting Sustainable behavior. The logistical challenges are appreciable but long term evaluations are essential if research on behavior change is ultimately going to contribute to Sustainability.

Author Contributions

Aaron Redman and Erin Redman conceived and designed the experiments; Aaron and Erin performed the experiments; Aaron analyzed the data; Aaron and Erin wrote the paper.

Conflicts of Interest

The authors declare no conflict of interest.

Appendix A. Description of Education Intervention

The approach to creating the course’s curriculum was based on five key components: (1) Positioning the students’ actions as a point of empowerment rather than a point of blame; (2) Developing a continuous knowledge-action-reflection cycle; (3) Fostering collaboration amongst students from different disciplines; (4) Making global issues, such as climate change, relevant to the students’ careers and lives; (5) Focusing on higher-order knowledge and subjective ways of knowing (value-laden knowledge). The central tenant our of course was to let the students choose what sustainable actions they wanted to focus on based on what was most relevant to their personal lives and was an appropriate scale for a one semester course. We then connected the research and broader problems and solutions to their selected focus/action, bridging the ‘knowledge-action gap’ [6,8,33]. Due to the personal nature of individual behavior change, we also built in moments for reflection and positive reinforcement, therefore expanding the traditional knowledge to action cluster to a more robust knowledge-action-reflection cycle. The ultimate goal of this course was to leave the students feeling empowered about their ability to foster change, hopeful about the diverse and exciting ways in which sustainable change can be achieved, and engaged in sustainability as an area of lifelong interest.

Appendix A.1. EfS Informed Pedagogy

The pedagogy and course design were based on the Education for Sustainability framework initially laid out in Redman and Larson [6]. Here we briefly explain three key examples of how the implementation of this framework operated:
  • Student Choice: As can be seen in Table A1, internal motivation, early success, and consistency are critical components of fostering pro-environmental behaviors. With relation to self-determination theory, the students had autonomy to choose their focus from the very onset of class in order to position the behavior change as an internal rather than external choice. According to researchers it is important to enhance an internal locus of control because with external controls, the person will revert to pre-intervention behaviors if the external force is removed resulting in negligible long-term change. Focusing on self-selected behaviors also speaks to intrinsic satisfaction because students have the opportunity and support to accomplish their personal behavioral goal, hence achieving behavioral competence [34]. However, it is critical to ensure that the task selected is feasible so that students have a positive experience with Sustainable behaviors (i.e., feel empowered) and feel the satisfaction of task completion. As noted by De Young [34] (p. 521), “What seems to others a simple action may become for them a major challenge” hence, reinforcing the concept that we, as teachers, cannot be the determiners of feasible behaviors for the students because we may not understand each individual’s barriers to change.
Table A1. Examples of Relevant Theories.
TheoryBrief Summary of Theory
Self-determination theory (SDT)People are more likely to engage in a behavior if they perceive that the motivation to do it comes from within them rather than from an external, controlling agent.
Self-efficacy theoryPeople that experience success at attaining their goals develop stronger intentions to continue to perform them.
Cognitive Dissonance TheoryPeople strive for internal consistency, meaning that they want to obtain information that is consistent with their actions and they want to behave consistently across related actions.
Locus of controlPeople often refer to locus of control as internal—meaning the person feels they have control of events/actions—or external—meaning the person feels external powers have control over events/actions.
Intrinsic satisfactionPeople often act for self-centered reasons and when fostering pro-environmental behavior it is critical to speak to people’s intrinsic desire—rather than solely altruistic—to complete tasks [34].
Example: Students self-selected the behavior they wanted to focus on for their final project.
  • Social Support and Networks: Additionally, community-based social marketing [1] and diffusion theory [35] provide strong real-world justifications for focusing on locally relevant barriers and strategies based on the participants’ attitudes and perspectives rather than externally-selected strategies (i.e., chosen by teachers). Unlike the behavioral theories described above, community-based social marketing (CBSM) and diffusion theory outline methods and procedures for effectively targeting sustainable change based on a number of different theoretical constructs as well as significant number of real-world case studies. CBSM is commonly used to foster sustainable behaviors in developed countries (e.g., Canada, US), whereas diffusion theory has frequently focused on innovations, such as improved cook-stoves, pure water spigots, and photovoltaics, in developing countries. While the contexts and actions targeted differ between these two approaches, both Rogers and McKenzie-Mohr highlight the importance of understanding local barriers and developing strategies for overcoming those barriers with local stakeholders. Rogers and McKenzie-Mohr also advocate for the use of local networks in spreading the uptake of a targeted behavior. Rogers writes that ‘individuals depend mainly on the communicated experience of others much like themselves who have already adopted a new idea’ [35] (p. 331) and advocates for developing ‘diffusion networks.’ Similarly, McKenzie-Mohr suggests asking those already engaged in the targeted sustainable behavior to talk to their neighbors and spread their positive experience with their community.
Examples: During the course, we began by asking the students about their perceived barriers to change and assigned them to develop strategies for overcoming those barriers. We re-visited this topic throughout the semester, particularly as part of the final project and reflection. In order to enable the students to share their actions and commitments with their peers, we hosted a Sustainability fair in which the students created booths with visuals and activities. For example, the students that had committed to composting brought in their composting bins and showed the fair’s visitors how to build and maintain their own composting bins. Some groups even utilized our commitment approach by asking visitors to commit to various Sustainability activities. Yet another group, hung photos of professors using reusable water bottles in order to establish their use as the social norm. Other groups created Facebook pages in order to increase the size of their diffusion network while also sharing advice, strategies, and photos of their projects. We posted photos of each student with their project and commitment on the university webpage, making the commitment public, increasing the number of people that are aware of our students’ actions, and encouraging students to behave consistently. Through utilizing peer engagement and building social networks focused, the students created a support system for their sustainability-related actions that will be in place even after our interaction with them as teachers comes to an end.
  • Systems Thinking: With a strong focus on ‘systems’ throughout the course, we aimed to connect students’ targeted behaviors with broader issues and an array of actions. We hoped that this would further engage students in the material because they were learning about system interactions that justified their behaviors and they could connect their chosen activity to a range of other behaviors. These connections create a sense of internal consistency as well as ideally foster spillover, hence taking into account cognitive dissonance theory.
Example: In small groups students drew out a systems diagram of one aspect of the food system (e.g., farming) and then as a class discussed how these parts were connected and interrelated.

Appendix A.2. Course Outline

We think this course outline is broadly adaptable to different instructor preferences and institutional circumstances for an Introduction to Sustainability.
  • The Hook: It is really important when introducing Sustainability to grab the students’ attention right away; before dumping information on them or even providing any backstory. For our hook the students completed an ecological footprint calculator and we spent a whole class doing the Fishbanks: a Renewable Resource Management Simulation (https://mitsloan.mit.edu/LearningEdge/simulations/fishbanks/Pages/fish-banks.aspx). Both of these activities were very engaging for the students, demonstrated a serious problem which created a need for Sustainability and motivated them to learn more about how we might solve these issues;
  • Quick Overview: We gave a very brief overview of the types of problems which drove the creation of Sustainability science, a look at their underlying causes (i.e., population and consumption growth) and how Sustainability science thinks we might go about tackling them. This in total took less than two classes worth of time;
  • Climate: The only area we delved into detail was climate change. We think this is such an important and significant problem that every citizen needs to have at least a basic understanding of it;
  • Solution Spaces: This was the meat of the course, organized around solutions/actions which the average person can take in their life. We delineated six solution spaces: Food, Waste, Electricity, Water, Transportation and Consumption. For each space we studied the whole system, their role in that system and specific actions which they could take that would improve the Sustainability of the system. Due to time constraints we could only spend significant time on Food and Waste while the others were much more briefly covered;
  • Personal/Group Action: For their final project the students worked in teams that were created based upon what solutions space most interested them. The teams were charged with promoting sustainable actions for that space at a fair they put on for the entire university. In addition the students had an individual assignment where they chose a specific action for their life. The action chosen was not important but they had to justify how that action would actually improve the sustainability of their system and clearly describe the steps (procedural) that one would have to take to achieve this more sustainable behavior.

Appendix A.3. What We Did not Do?

It is very important to emphasize some of the things we purposely did not do in this course.
  • We did NOT try to cover every sustainability topic. The typical introductory course attempts to cover every main area within that discipline (Intro bio, chemistry, etc.). Sustainability as a field is so enormous that this task is basically absurd. It just does not work. It leaves the student overwhelmed and no time in the course to get into depth about anything. Far more important is to get the student interested in Sustainability, arm them with the right analytical skills and motivate them to find out more. We believe motivation for continued learning is strongest when someone is striving to become more Sustainable in their personal life;
  • The course was NOT organized by academic topic: One approach to Sustainability and other interdisciplinary style courses is to organize them by the academic areas they synergize. Have a unit on economics, then anthropology then ecology, etc. The other common alternative is to do it based on problems areas. A unit on pollution, then biodiversity, etc. These categorizations are arbitrary (as are all categorizations in our interconnected world) but the real problem is that they are not meaningful to the average person. Outside of academia what does it matter if an idea came from anthropology or from economics. Problem organization is useful but it is very disempowering. Better to organize based on solutions and work back to the problems;
  • We did NOT focus on facts. Data and facts were mentioned in presentations and videos but we made a very clear point that it was not necessary to memorize them. The goal was to understand systems. So we never tested based on facts and all work was assessed based on an understanding of connections not on any particular fact.
The course was called Sistemas Socio-ecologicos para la Sostenibilidad and was run from January 2014 to May 2014 at the Escuela Nacional de Estudios Superiores in Leon, Mexico. We had 87 students enroll in the course from four different majors. Unfortunately taking an interdisciplinary class such as this is very challenging for students given the confining schedules of their degree programs. We were only able to find a 2 hour slot once a week and even that did not work for many interested students. Between vacations and university-wide cancelations we were only able to hold 15 classes, which gave us a mere 30 hours of facetime with the students. On top of that the students estimated that they missed an average of nearly 3 classes due to obligations in their degree program and were late to more than 4 additional ones.
Yet overall the course was seen very positively by the students, 95% of them saying that they “liked” or “liked a lot” the course. All of the survey respondents said they would recommend it to fellow students and all but one would probably or definitely enroll in a follow up course. Most importantly for us 100% agreed that “Due to their participation in the course changed their opinion on the urgency of resolving sustainability challenges.”
If you are interested in more details about the course or specific materials please do not hesitate to contact the authors.

Appendix B. Data Collection Methodology

Appendix B.1. Study Context

This study took place at a new public university in Leon, Guanajuato, Mexico. Leon is the seventh largest city in Mexico with over a million and a half residents. The city has experienced a lot of growth over recent decades, propelled by its nation-leading shoe industry. From a Sustainability perspective the city is known internationally for a system of protected bike lanes and a bus rapid transit system as well as one of the best municipal water systems in Mexico. From a waste perspective though the city lags behind many other Mexican cities. There is no separate pick-up for recycling or organics and according to the director, who we interviewed, a transfer stations at which to sort waste was at least a decade away.
In 2011 Mexico’s National University (UNAM) inaugurated its first independent campus expansion outside of the Mexico City area. UNAM is Mexico’s premier university, highly selective and sought after for its free tuition and high quality education. The branch in Leon was named Escuela Nacional de Estudios Superiores (ENES) and has gotten started with only a handful of degree programs and at the time of the study ~500 students and several dozen faculty. The university draws mostly from Leon and the state of Guanajuato, though students come from all over the country as well. Unlike at UNAM (and most Mexican Universities), neither the departments nor the students are segregated from each other spatially. Yet functionally the degree programs are 100% independent of each other (in terms of class requirements, etc.).
In 2012 we were invited to establish a Sustainability department at the University. We explored developing an independent degree program but found the best educational opportunity to be in introducing Sustainability to all the students. We took over the teaching of a course in three of the degree programs and offered an elective which was taken by most of the students in the other two degree programs (a sixth and seventh degree have since been started). Having complete control of the elective we were offering, we saw in opportunity to investigate whether an educational impact could have a real and significant impact on behavior. As detailed in the Appendix A we designed the course with this research question in mind.

Appendix B.2. Study Population

Ideally, we would have randomly sampled the student population for our baseline information and randomly sampled for participants in the intervention. This was not feasible. Instead we make the case that our study population is sufficiently representative of ENES’s student population. For three of the degree programs we surveyed every student from one cohort. For the other two degree programs the students enrolled voluntarily. There is potentially a bias because the students chose to take a Sustainability elective but we argue that in actuality that bias was very limited. This is because there are almost no electives offered outside of degree programs so ours was effectively the only option whether you were into Sustainability or not. Our understanding was that everyone from these two degree programs which did not enroll in our elective (from the cohorts which were allowed to take electives) did not do so because they had a scheduling conflict with a course in their degree program. Therefore, we captured almost all the students from a single cohort in each degree program ENES was offering at the time.
We statistically analyze whether the sub-sample of the intervention and the follow-up can be considered drawn from the same population as our broad sample (described in the previous paragraph) in Appendix D.

Appendix B.3. Subjective Knowledge

Before beginning this project, we had concluded that we would no longer divide subjective knowledge into two separate domains, effectiveness and social knowledge as we had done previously [12]. There were three basic reasons for this:
  • There is a clear consensus in the psychological and behavior change literature that subjective knowledge is a key motivator of human behaviors. But there is virtually an endless array of exact theories, models and proposed mechanisms. Evidence has been found in support of many of them but none are convincing as being complete explanations for human behavior. The use of effectiveness knowledge and social knowledge in [6] was an attempt to reconcile and synergize these theories. But we now propose that the more coherent synergy is to group all of them under Subjective knowledge;
  • From a research perspective designing survey questions which only got at social knowledge or only effectiveness knowledge proved impractical. We ultimately felt that we could not rigorously defend why one question measured effectiveness and another social and not vice versa;
  • Most importantly the division of subjective knowledge was actually a hindrance for designing curriculum based on EfS and made the approach more difficult to explain to practitioners. Teachers for example rapidly grasped the concept of procedural knowledge and the overall idea of subjective knowledge, but not the finer distinctions. Rather they were interested in the findings of psychology for subjective knowledge; building social norms in the classroom, consistency between words and actions, focus on values, social networks, locus of control etc. The key for EfS is to acknowledge the central role of subjective knowledge for behavior change and then draw on these specific findings to select the curriculum that you will use.

Appendix B.4. Instrument Design

The survey instrument was drawn from our previous work in [12] (2014) on food and waste behaviors. We chose to focus on just waste for this study for several reasons. Firstly, this work forms part of a broader project seeking to understand the waste system in Leon, Mexico. More importantly though, is that it was more straightforward to assess the Sustainability of waste behaviors by the students in Mexico, whereas on the food side we deemed to be too complex and individualized in this context.
We translated the survey ourselves but not being native Spanish speakers got support on wording from several of our Mexican colleagues. Additionally, we piloted the survey with one class of students whose results are not included here due to substantial changes which we made afterwards. We chose to only use 4 Likert options to keep it simpler for the many participants who would have never taken a Likert style survey before. There is mixed evidence for what is the best number of options for a Likert scale and it becomes even murkier when the research is in low-income countries (for a discussion see: http://blogs.worldbank.org/impactevaluations/do-you-agree-or-disagree-how-ask-question). Therefore, we omitted the neutral response and reduced the number of options to four from the more standard five or seven. It is important to note that the quantification of the knowledge domains and even the behaviors is not intended to yield precise measurements but instead to focus on broad patterns and relationships between them and between different time periods (e.g., before and after).
Finally, it is important to note that this survey shares a weakness common too much of the research in this area in that participants are asked to self-report about knowledge, attitudes and behaviors, rather than these being measured directly. There is evidence that people seem to overestimate their own behaviors [36] but the effect was not large. Milfont [37] found that social desirability does not have a strong effect on participant responses as many have feared. While this study makes important advances, we understand its limits and advocate that more future studies measure behaviors directly whenever possible.

Appendix B.5. Collection of Data

We used Google Forms, a free online program, to administer the survey. See Appendix C for how the survey appeared online. Although youths in Mexico are generally accustomed to using the internet before our classes 2/3 of them had only had online assignments “once and a while”. This was one of the reasons that we sought to keep the survey short and to the point. The survey was the first online assignment the students were given at the beginning of their courses with us. They were given credit for taking the survey but as was made clear to them their responses were anonymized and separate from the course credit. The survey was administered in January and August of 2014 to collect the baseline data before the students had any exposure to Sustainability. In May 2014 at the end of the course the students participating in the intervention were surveyed. Once again taking the survey was a class assignment.
In August 2015 all the students who participated in the intervention were contacted by the email to take a follow-up survey. Unfortunately, it has been our experience that this is not a reliable way to contact students at ENES many of whom do not use email frequently or even at all (but it was our only option). This was a definite barrier to getting the number of responses we might have hoped for and collecting more and better contact information is one of the major methodological areas for improvement in the future. We offered the students who participated a raffle for a $25 Amazon gift card (Amazon had recently begun service in Mexico).
Google Forms automatically creates a spreadsheet of responses as they come in. The spreadsheets were downloaded in CSV format and modified for analysis as described in Appendix D.

Appendix B.6. Standardization of Results

As mentioned previously in B4 the scales used on the survey are shorter than is typical and not intended to have meaningful quantities. Therefore in order to compare the results of this study in a meaningful way it is necessary that we standardize the outputs. There are many different methods to doing this though most have in common the use of the standard deviation. This gives you a result which tells you how much impact you had relative to the variation between respondents. As was necessary we took slightly different approaches with the regression and the t-tests.
For the regressions we produced standardized coefficients based on the methodology proposed by Andrew Gelman [28]. This involves dividing each numeric variable by two times its standard deviation. He argues that this is particularly advantageous when regressions include binary variables (as ours does with for example sex). Additionally, each input variable is centered with a mean of zero. These adjustments make the interpretation of regression results much easier-particularly when comparing between items. This procedure has been included in the R-package “arm” under the command standardize. In the body of the paper we will report only standardized regression coefficients while the appendix will include both standardized and un-scaled results.
For t-tests one common way to standardize your results is to use Cohen’s D [38], which is typically reported as the “effect size” of an intervention. The basic approach involves dividing the mean by the standard deviation. Interpretation is still somewhat subjective but Cohen’s suggestion is generally followed: <0.2 “negligible”, <0.5 “small”, <0.8 “medium”, >0.8 “large”. For a paired t-test such as what we used here there are various proposed approaches to selecting the appropriate standard deviation. We have chosen to use one of the most common which is to divide the difference in the means by the standard deviation of the difference of the means. In order to do that we used the “effsize” package which also produced the accompanying confidence intervals. The body of the paper will report the effect sizes only while the appendix will have both the original t-test results and Cohen’s D.

Appendix C. Surveys

Appendix C.1. Screen Captures of Survey (Spanish)

Figure C1. Screen capture of the survey in Spanish.
Education 07 00004 g004aEducation 07 00004 g004bEducation 07 00004 g004c

Appendix C.2. English Translation of Survey

  • How familiar are you with the following concepts/terms? 1—“I have never heard of it” to 4—“I am very familiar with it”;
    • Sustainability;
    • Recycling;
    • Social and Environmental Justice;
    • Composting;
    • Landfill.
  • How would you rate your ability to…1—“Very bad” to 4—“Very good”;
    • …make sustainable decisions about waste?
    • …influence members of my household/family to take more sustainable actions?
    • …make environmentally friendly waste decisions?
    • …influence your friends to take more sustainable actions?
    • …reduce your personal impact on the environment by means of your decisions regarding waste?
  • How would you rate your agreement with the following statements? 1—“I do not agree” to 4—“I agree completely”;
    • I believe that the actions of an individual are central for achieving sustainability.
    • I believe that it is easy to recycle in my house;
    • I know how to compost with organic waste;
    • It is important that everyone always sorts their garbage;
    • I admire people who behave sustainably;
    • I believe that the water from the tap in Leon is safe and healthy to drink.
  • How would you rate your agreement with the following statements? 1—“I do not agree” to 4—“I agree completely”
    • I know people that are committed to living sustainably;
    • Plastic has created serious environmental problems;
    • Environmental health is very important for social justice;
    • Other people think I am strange if I bring a reusable bag with me to the store so I do not have to use a disposable one;
    • I am interested in incorporating sustainability in my degree and professional career;
    • It is the responsibility of the government to reduce the problem of waste.
  • With what frequency do you do the following actions? 1—“Never” to 4—“Always”
    • I bring my reusable bag to the store in order to avoid using a disposable bag;
    • I recycle in my house;
    • I bring a reusable water bottle with me to campus;
    • I correctly sort my garbage;
    • I compost at home.

Appendix C.3. Questions with the ID Numbers Used to Reference Them in the Analysis

Table C1. Table of Questions with ID as Used in Analysis (Output from R).
IDQuestion Text
Q1X.Qué.tan.familiarizado.estás.con.los.siguientes.conceptos...términos...Sostenibilidad…sustentabilidad.
Q2X.Qué.tan.familiarizado.estás.con.los.siguientes.conceptos...términos...Reciclaje.
Q3X.Qué.tan.familiarizado.estás.con.los.siguientes.conceptos...términos...Justicia.ambiental.y.social.
Q4X.Qué.tan.familiarizado.estás.con.los.siguientes.conceptos...términos...Compostaje.
Q5X.Qué.tan.familiarizado.estás.con.los.siguientes.conceptos...términos...Relleno.Sanitario.
Q6X.Cómo.calificarías.tu.capacidad.para...hacer.decisiones.sostenibles.de.desechos.
Q7X.Cómo.calificarías.tu.capacidad.para...influir.a.los.miembros.de.tu.hogar.familia.hacer.acciones.mas.sostenibles.
Q8X.Cómo.calificarías.tu.capacidad.para...hacer.decisiones.amigables.a.medio.ambiente.de.desechos.
Q9X.Cómo.calificarías.tu.capacidad.para...influir.a.tus.amigos.hacer.acciones.mas.sostenibles.
Q10X.Cómo.calificarías.tu.capacidad.para........reducir.tu.impacto.personal.al.medio.ambiente.por.medio.de.tus.decisiones.sobre.desechos.
Q11X.Cómo.calificarías.tu.acuerdo.con.las.siguientes.afirmaciones...Yo.creo.que.es.fácil.reciclar.en.mi.casa.
Q12X.Cómo.calificarías.tu.acuerdo.con.las.siguientes.afirmaciones...Yo.se.como.hacer.compostaje.con.desechos.organics.
Q13X.Cómo.calificarías.tu.acuerdo.con.las.siguientes.afirmaciones...Es.importante.que.todas.personas.siempre.separan.sus.desechos.
Q14X.Cómo.calificarías.tu.acuerdo.con.las.siguientes.afirmaciones...Yo.admiro.personas.quien.se.comportan.sostenibles.
Q15X.Cómo.calificarías.tu.acuerdo.con.las.siguientes.afirmaciones...Yo.conozco.personas.que.se.comprometen.a.vivir.de.manera.sostenible.
Q16X.Cómo.calificarías.tu.acuerdo.con.las.siguientes.afirmaciones...El.plástico.ha.creado.problemas.ambientales.serios.
Q17X.Cómo.calificarías.tu.acuerdo.con.las.siguientes.afirmaciones...Salud.ambiental.es.muy.importante.para.justicia.social.
Q18X.De.que.frecuencia.haces.los.siguientes.acciones...Yo.llevo.mi.bolsa.reusable.a.la.tienda.super.para.evitar.el.uso.de.bolsas.desechables.
Q19X.De.que.frecuencia.haces.los.siguientes.acciones...Yo.reciclo.en.mi.casa.
Q20X.De.que.frecuencia.haces.los.siguientes.acciones...Yo.llevo.un.botella.de.agua.re.usable.a.la.universidad.
Q21X.De.que.frecuencia.haces.los.siguientes.acciones...Yo.hago.seperacion.correcto.de.mis.desechos.
Q22X.De.que.frecuencia.haces.los.siguientes.acciones...Yo.hago.compostaje.en.mi.casa.

Appendix C.4. Questions on Original Survey Removed before Analysis (with Justifications)

There were five questions which were included on the survey but which we removed prior to any analysis. The questions were all kept there each time the survey was administered (even if we intended not to include them in the analysis) because we wanted to make sure that the instrument was identical for each person that took it and every time they did so.
Questions Removed:
  • I believe that the actions of an individual are central for achieving sustainability.
Initially we had intended to also examine the participants’ attitudes about individual agency versus government for making sustainable change but ultimately decided that this was outside the scope of this study.
  • It is the responsibility of the government to reduce the problem of waste.
    As per above we decided that this topic area was outside our scope.
  • I believe that the water from the tap in Leon is safe and healthy to drink
We asked this question because we were seeking to collect some initial data to better understand the values and attitudes towards tap water in Leon.
  • Other people think I am strange if I bring a reusable bag with me to the store so I do not have to use a disposable one.
After the initial round of surveys we got feedback that this question was confusing. We discussed the question with Mexican academic colleagues who agreed with that assessment and we therefore decided to drop the question.
  • I am interested in incorporating sustainability in my degree and professional career.
This question was asked just to get a sense of the participants’ goals as students in our class and was not intended as part of this study.

Appendix D. Step-by-Step Process of Data Handling and Analysis

Appendix D.1. Preparing the CSV Files

The following actions were taken with the raw survey data before sharing it:
  • Results from the six surveys were downloaded from Google;
  • Some removal of observations because of duplications and significant blank entries;
  • Grades and some other demographic information was added;
  • Hand coded sex (based on names and memories) and location (standardized and simplified the students’ entries;
  • Removed irrelevant questions: See Appendix C.4;
  • Assigned a unique ID to each student and then removed their names to anonymize the data.
CSV Files: Intervention_Presurvey; Intervention_Postsurvey; Intervention_Followupsurvey; Nonintervention_Presurvey.
CSV files are available from the Arizona State University Digital Repository: http://hdl.handle.net/2286/R.I.36936 In R.
All of the subsequent analysis was done in R. The full R scripts are also available online, which combined with the CSV files should enable anyone to exactly reproduce our results. R software can be downloaded for free here: https://cran.r-project.org/. For a more user friendly experience we recommend the use of RStudio https://www.rstudio.com/. The R scripts posted online have been organized in parallel to Appendix D so that one could follow along in R.

Appendix D.2. Creating Necessary Dataframes

In order to analyze the data in R we have to load the CSV files into what R calls dataframes. Most of what we do in this step are various manipulations to get the dataframes set-up for analysis and are not themselves relevant to the research.
We created new variables for each of the four indexes. The mean of the questions included was calculated in order to create this new variable. The questions included in each index are in Table D1. When calculating the means for the indexes questions with no response were omitted, meaning that for some participants their index scores will be composed of fewer questions because they left some answers blank.
Table D1. Questions included in each Index for Analysis.
IndexQuestions Included
DeclarativeQ1, Q2, Q3, Q4, Q5, Q16, Q17
ProceduralQ6, Q10, Q11, Q12
SubjectiveQ7, Q8, Q9, Q13, Q14, Q15
BehaviorQ18, Q19, Q20, Q21, Q22
We decided to treat age as a dummy variable by creating three groups, 18–23 (typical college age), 23–30 (young adult) and 31+ (adult). We thought that it was important to control for age but did not think it made sense to do so as a continuous variable (in particular so that the couple participants who were 40+ did not skew the results). The age ranges we chose were not based on the distribution of results but on what we considered different life stages. In addition, grades of students who did not pass the course were coded as a 0 in the original data so those were all changed to 5 so that it was continuous with the other grades (6 through 10).

Appendix D.3. Identify and Remove Outliers

We were very cautious and conservative about removing outliers from the dataset. As mentioned previously some observations were removed because of duplication or large amounts of missing data (i.e., an entire section was unanswered). To identify outliers in the rest of the data set we calculated Cook’s distance which is the most widely used statistical test for measuring the influence of an individual observation [39]. We ran regressions on each of our datasets and then calculated Cook’s distance for each observation in each set and created box-plots. The decision to remove outliers and how many was a judgement call. All descriptive statistics and other data reported in this paper has been calculated after the outliers were removed. The outliers have been removed in the process of creating the dataframes in the previous section. If you want to see the original outliers, make sure that you run this section of script right before the section where we removed them. Below Figure D1 is an example boxplot of the results for the ‘all student survey’ with the outliers we removed identified.
Figure D1. Boxplot of Cook’s Distance for observations of ‘All Students’ regression.
Education 07 00004 g005

Appendix D.4. Produce Descriptive Statistics of Samples

I could not find a package or function in R whose descriptive statistics satisfactory for me. I created my own basic function which can be found in the script. This function takes the percentage which fall into the appropriate category for Sex, Origin, and Degree and the mean of the Age and Grade. Table 2 in the article reports the results of this for the three relevant samples, all of the students, those receiving the intervention and those who followed up one year later. As was noted previously, in preparing the CSV files we hand coded sex and origin. The participants’ origin information had been collected but with an open-ended question the results were extremely messy. We cleaned that up and created just four categories for origin: Leon (location of the university), Guanajuato State (not including Leon), Mexico City and Elsewhere.

Appendix D.5. Compare the Samples Statistically

We have three samples which we argue are fairly representative of the target population--students at ENES. This population is probably broadly similar to other university student populations with specific differences with UNAM (its parent campus) because there the vast majority of students are from Mexico City and differs from other private and public universities in Mexico because UNAM/ENES is by far the most selective. Although the sampling methodology was not random we contend that our samples are sufficiently representative of the student body. The broadest sample ‘All Students’ captures a cross section of students from virtually all the degree programs, reflecting the composition of the student body. Our other two samples are sequential sub-samples of this.
We used the Kolmogorov-Smirnov (KS) test to evaluate whether the sub-samples were drawn from the same population as the students who were not part of those sub-samples. In particular we are concerned with whether the sample has significantly different attitudes, knowledge or behaviors with regards to Sustainability. First we compared the students who participated in the intervention with those who did not in Table D2.
Table D2. Kolmogorov-Smirnov (KS) Test comparing Intervention and Nonintervention Samples.
Intervention (Mean)Nonintervention (Mean)KS StatisticKS p Value
Declarative3.092.990.120.84
Procedural2.822.840.100.96
Subjective3.173.110.090.99
Behavior2.532.500.081
Visually, one can see that the mean scores of students who participated in the intervention and those that did not were very close together and the KS test confirms that statistically these two samples are representative of the same population.
For the next subsample, slightly more than a third of the participants in the intervention responded to the follow-up survey. Table D3 below shows that those that followed up and those that did not are statistically similar though there is some concern about the difference in grades, which while not quite significant is apparent and perhaps not surprising.
Table D3. KS Test comparing Preintervention sample with Followup.
Followups (Mean)Non-Followups (Mean)KS StatisticKS p Value
Declarative3.193.030.230.26
Procedural2.832.810.150.78
Subjective3.163.170.120.94
Behavior2.582.510.061
Final Grade8.077.610.290.10

Appendix D.6. Assessing the Indices with Cronbach’s Alpha

This research investigated the relationship of domains of knowledge and behavior. We assessed this creating indices for each knowledge domain and the behaviors composed of a set of questions. The expectation is that the answers to these questions should be correlated with each other. Cronbach’s Alpha reliability coefficient is a widely utilized method for measuring the correlation between items composing an index [27]. The scores range from 0 to 1 with higher scores indicating a greater correlation between the index’s items. Table D4 reports the Cronbach’s Alpha coefficient in standardized form for the three samples.
Table D4. Standardized Cronbach’s Alpha for indices in each sample.
All StudentsPost-InterventionFollow-up
Declarative0.650.760.83
Procedural0.600.450.78
Subjective0.700.640.83
Behavior0.460.700.78
The way that Cronbach’s Alpha changes for each of the indices in each of the studied groups is very interesting but we are unsure of how to interpret this result. I am for example not surprised that the behavior index was relatively uncorrelated initially as we asked about a diverse set of waste related actions but that after the intervention the students saw them more as connected (e.g., using a re-usable water bottle as a waste reduction strategy). Another potential interpretation from this table is that after the intervention respondents are more inconsistent with their responses but then over the long term they settle into more consistency thus the high coefficients in the follow-up survey.

Appendix D.7. Multicollinearity among Independent Variables in the Regressions

In order to check whether the independent variables in our regressions were correlated we calculated the Variance Influence Factor (VIF) for all the regressions. VIF is widely used to assess multicollinearity and typically a score above 4 is considered to be a concern while 10 indicates multicollinearity that probably should be corrected [40]. Below Table D5 contains the VIF for all of the regressions with the variables of concern highlighted. As can be seen the only concern with multicollinearity is in the follow-up sample with procedural and declarative knowledge. Extra caution is therefore taken with interpreting the results from that particular regression.
Table D5. Variance Influence Factors for all Regressions.
All StudentsPre InterventionPost InterventionFollow upDifferences Pre/PostDifferences Pre/Follow up
Sex1.3011.3951.2922.2761.3602.270
Age Category1.3791.8241.3942.4641.4382.586
Origin1.6331.6811.5073.0151.6293.043
Degree1.9312.1262.1723.4871.9222.329
Final Grade1.4861.7701.4071.8941.4972.326
Declarative1.5591.6761.5295.3481.7453.361
Procedural1.9962.3161.6269.4711.9134.362
Subjective1.5642.0701.7813.8352.2261.977

Appendix D.8. Control Variables

For our various regression analysis we decided to include the same set of control variables: sex, age, origin, degree, and final grade. The following is a brief justification for why we believed these to be important to include:
  • Sex: Other studies have found that women are more likely than men to report pro-environmental attitudes and behaviors [30,31,32]. Indeed, in the initial survey did find that result;
  • Age: As previously mentioned age was converted into three categories. Basically we view age as being relevant in terms of one’s living circumstances and life experiences. The college age group has probably never lived on their own or is just doing it for the first time (far less common in Mexico than the US) and therefore may never have managed household waste before. The young adult group is more likely to have lived on their own and certainly held a job, though many still probably lived with families. The oldest group is by far the most likely to have managed their own household waste;
  • Origin: The participant’s origin is of importance because different cities in Mexico manage their waste very differently. For example, parts of Mexico City have separate garbage, recycling and organic pick-ups whereas Leon only has a garbage pick-up (and some places may have no pick-up);
  • Degree: The background of the students in the different degree programs are somewhat different. More importantly students in each degree program take 100% classes within those programs. Potentially the students from the different programs could be statistically different. In fact it appears that the students from the Intercultural Development and Management degree program are, though since only one of them participates in the intervention, this does not play much of a role in this study.

Appendix D.9. Evaluating Hypothesis 1

Hypothesis 1.
Higher levels of subjective and procedural knowledge correlates with more sustainable behavior while higher levels of declarative knowledge does not.
To assess our first hypothesis, we studied the full sample of students before they had any Sustainability related intervention (i.e., during the first weeks of the semester). In Table D6 are the full regression results for every sample and the differences between samples, while Table D7 is the standardized results.
Table D6. Summary of all regression results in study.
Dependent Variable
Behavior
All StudentsPre InterventionPost InterventionFollow upDifferences Pre/PostDifferences Pre/Follow up
(1)(2)(3)(4)(5)(6)
Sexf0.165 **0.209 *0.0360.049−0.050−0.251
(0.080)(0.106)(0.135)(0.212)(0.140)(0.224)
Age Category (23,30]0.1650.1490.0520.158−0.116−0.031
(0.123)(0.179)(0.259)(0.322)(0.258)(0.334)
Age Category (30,100]0.1690.1810.054−0.028−0.170−0.321
(0.236)(0.257)(0.392)(0.303)(0.387)(0.334)
Origin Leon0.0950.158−0.0470.106−0.0240.050
(0.100)(0.133)(0.178)(0.198)(0.182)(0.229)
Origin GTO0.1900.227−0.1440.290−0.1310.304
(0.116)(0.147)(0.190)(0.237)(0.196)(0.272)
Origin DF0.2070.2660.1730.0970.1920.019
(0.135)(0.175)(0.227)(0.269)(0.240)(0.270)
Degree Desarrollo y Gestión Interculturales0.257 *0.924 *
(0.153)(0.467)
Degree Economia Industrial−0.013
(0.138)
Degree Fisioterapía0.0690.152−0.101−0.075−0.1470.110
(0.117)(0.172)(0.226)(0.355)(0.220)(0.348)
Degree Odontología0.1070.183−0.100−0.150−0.338−0.224
(0.125)(0.164)(0.231)(0.318)(0.224)(0.329)
Final Grade0.0100.014−0.014−0.099−0.043−0.110
(0.033)(0.045)(0.056)(0.077)(0.060)(0.091)
Declarative0.1220.0950.0830.4910.1550.058
(0.101)(0.131)(0.200)(0.303)(0.144)(0.258)
Procedural0.304 ***0.322 **0.439 **−0.0250.1070.174
(0.098)(0.137)(0.195)(0.314)(0.151)(0.220)
Subjective0.374 ***0.296 **0.668 ***0.724 ***0.498 **0.497 *
(0.101)(0.147)(0.238)(0.235)(0.194)(0.235)
Constant−0.269−0.170−1.044−0.4080.6591.168
(0.421)(0.527)(0.872)(0.740)(0.471)(0.678)
Observations1198275287228
R20.4660.4760.3830.8270.3620.648
Adjusted R20.3950.3760.2640.6880.2330.366
Residual Std. Error0.379 (df = 104)0.404 (df = 68)0.508 (df = 62)0.335 (df = 15)0.500 (df = 59)0.356 (df = 15)
F Statistic6.493 *** (df = 14; 104)4.754 *** (df = 13; 68)3.212 *** (df = 12; 62)5.959 *** (df = 12; 15)2.794 *** (df = 12; 59)2.302 * (df = 12; 15)
Note: * p < 0.1; ** p < 0.05; *** p < 0.01.
Table D7. Summary of standardized regression results in study.
Dependent Variable
Behavior
All StudentsPre InterventionPost InterventionFollow upDifferences Pre/PostDifferences Pre/Follow up
(1)(2)(3)(4)(5)(6)
c.Sex0.165 **0.209 *0.0360.049−0.050−0.251
(0.080)(0.106)(0.135)(0.212)(0.140)(0.224)
Age Category (23,30]0.1650.1490.0520.158−0.116−0.031
(0.123)(0.179)(0.259)(0.322)(0.258)(0.334)
Age Category (30,100]0.1690.1810.054−0.028−0.170−0.321
(0.236)(0.257)(0.392)(0.303)(0.387)(0.334)
Origin Leon0.0950.158−0.0470.106−0.0240.050
(0.100)(0.133)(0.178)(0.198)(0.182)(0.229)
Origin GTO0.1900.227−0.1440.290−0.1310.304
(0.116)(0.147)(0.190)(0.237)(0.196)(0.272)
Origin DF0.2070.2660.1730.0970.1920.019
(0.135)(0.175)(0.227)(0.269)(0.240)(0.270)
Degree Desarrollo y Gestión Interculturales0.257 *0.924 *
(0.153)(0.467)
Degree Economia Industrial−0.013
(0.138)
Degree Fisioterapía0.0690.152−0.101−0.075−0.1470.110
(0.117)(0.172)(0.226)(0.355)(0.220)(0.348)
Degree Odontología0.1070.183−0.100−0.150−0.338−0.224
(0.125)(0.164)(0.231)(0.318)(0.224)(0.329)
z. Final. Grade0.0260.038−0.034−0.229−0.103−0.253
(0.085)(0.119)(0.140)(0.178)(0.145)(0.209)
z. Declarative0.1060.0840.0610.4830.1680.057
(0.087)(0.116)(0.146)(0.298)(0.157)(0.251)
z. Procedural0.305 ***0.320 **0.339 **−0.0310.1170.227
(0.099)(0.137)(0.151)(0.397)(0.164)(0.286)
z. Subjective0.324 ***0.261 **0.443 ***0.777 ***0.455 **0.407 *
(0.087)(0.129)(0.158)(0.253)(0.177)(0.193)
Constant2.315 ***2.197 ***3.066 ***2.749 ***0.636 **0.160
(0.134)(0.190)(0.255)(0.360)(0.254)(0.388)
Observations1198275287228
R20.4660.4760.3830.8270.3620.648
Adjusted R20.3950.3760.2640.6880.2330.366
Residual Std. Error0.379 (df = 104)0.404 (df = 68)0.508 (df = 62)0.335 (df = 15)0.500 (df = 59)0.356 (df = 15)
F Statistic6.493 *** (df = 14; 104)4.754 *** (df = 13; 68)3.212 *** (df = 12; 62)5.959 *** (df = 12; 15)2.794 *** (df = 12; 59)2.302 * (df = 12; 15)
Note: * p < 0.1; ** p < 0.05; *** p < 0.01.

Appendix D.10. Evaluating Hypothesis 2

Hypothesis 2.
Participating students will show an increase in their procedural and subjective knowledge as well as sustainable behaviors after the educational program.
To be able to assess this hypothesis we did a paired t-test comparing the pre answers with the post answers. To be able to do this we had to match the pre database with the post database as not all the students completed one or the other. There were 72 paired observations which we used (also had removed outliers as previously discussed). It took some manipulation to get the results in a usable format. Table D8 contains the results from the t-test and the Cohen’s D effect size calculations for all the questions (Cohen’s D is not calculated for all the questions due to some blank responses) and Table D9 has those same results for the indexes.
Figure D2 is a graphical result showing the estimated difference after the intervention in the survey answers with 95% confidence intervals.
Table D8. t-test results and Cohen’s D for pre vs. post changes in survey for all questions.
NamesEstimatep ValueAdjusted p ValueConfint_minConfint_maxt StatisticDegrees FreedomCohens DCD Confint_minCD Conf int_max
Q10.887000.6971.0779.31570
Q20.2220.0020.0100.0840.3603.214710.3790.0440.714
Q30.4860.000040.00020.2670.7064.415710.5200.1830.858
Q40.8060.000000.000000.5221.0895.667710.6680.3271.009
Q50.81900.000000.5751.0646.692710.7890.4441.133
Q60.667000.4820.8527.186710.8470.5001.193
Q70.3190.0010.0050.1350.5043.457710.4070.0720.743
Q80.4860.000000.000000.3190.6535.794710.6830.3411.024
Q90.4430.000020.00020.2500.6364.57469
Q100.3610.00020.0010.1790.5433.955710.4660.1300.802
Q110.1810.0270.1040.0210.3402.259710.266−0.0670.600
Q121.211000.9311.4918.63370
Q130.1940.0120.0500.0440.3452.569710.303−0.0310.637
Q140.2680.000030.00020.1480.3874.45770
Q150.6530.000010.00010.3820.9244.806710.5660.2280.905
Q160.3750.00010.00050.1970.5534.194710.4940.1570.831
Q170.2820.0030.0150.0980.4663.05170
Q180.5690.000000.000050.3400.7994.950710.5830.2450.922
Q190.2780.0030.0120.1000.4553.123710.3680.0330.703
Q200.1250.1180.435-0.0320.2821.583710.187−0.1460.519
Q210.3520.0070.0300.0990.6052.77270
Q220.7220.000000.000030.4431.0025.152710.6070.2680.947
Table D9. t-test Results and Cohen’s D for pre vs. post changes in survey for indices.
NamesEstimatep ValueAdjusted p ValuesConfint_minConfint_maxt StatisticDFCohens DCD Confint_minCD Confint_max
Declarative0.553000.4250.6808.645711.0190.6661.372
Procedural0.601000.4740.7299.381711.1060.7491.462
Subjective0.394000.2870.5027.321710.8630.5161.210
Behavior0.4110.000000.000000.2770.5456.114710.7210.3781.063
Figure D2. Estimate of mean difference for all questions with confidence intervals.
Education 07 00004 g006

Appendix D.11. Adjusting p-Values for Multiple Comparisons

When you are making multiple comparisons your risk for Type II error (false positive) goes up for each additional comparison you make. Schochet [41] lays out guidelines for dealing with this issue in evaluations of educational interventions and suggest two remedies. One is to use indexes instead of individual questions to reduce the number of comparisons you are doing. The comparison of the indexes is the main point of our analysis and what we focused on in the article. The other solutions involve adjusting your p-values to account for the number of comparisons. There are various methodologies have been developed for this adjusting which involve different assumptions and trade-offs about your data. We chose to adjust the p-values with the method developed by Benjamini and Yekutieli [42]. This has been included in all of the previous tables.

Appendix D.12. Evaluating Hypothesis 3

Hypothesis 3.
Changes in procedural and subjective knowledge will predict changes in sustainable behavior while changes in declarative knowledge will not.
In order to evaluate this hypothesis, we created a new dataframe using the matching pre and post dataframes we had created for hypothesis 2. The pre scores were subtracted from the post scores for each participant yielding a measure of the change that occurred due to the intervention. A regression was run on this data to look for relationships with the dependent variable of changing behavior. See the results in Table D7 and Table D8 above.

Appendix D.13. Evaluating Hypothesis 4

Hypothesis 4.
After one year participating students will still have increased knowledge (in all domains) and sustainable behaviors relative to before the education program.
Unfortunately, we were only able to collect responses one year later from about one third of the participants, which after processing and removing outliers left us with 28 observations to compare to the pre-intervention results. After adjusting for multiple comparisons there are only three questions for which we can be claim that there was a long term change, see Table D10 and Figure D3.
We can also look at the indices which once adjusting the p-values we can see a sure change in Declarative knowledge but less confidence that there was a change in behavior, see Table D11.
Figure D3. Estimate of mean difference for all questions with confidence intervals pre vs. follow-up.
Education 07 00004 g007
Table D10. t-test results and Cohen’s D for pre vs. follow-up changes for all questions.
NamesEstimatep ValuesAdjusted p ValuesConfint_minConfint_maxt StatisticDegrees FreedomCohen’s DCD Confint_minCD Confint_max
Q10.5710.00040.0290.2840.8594.076270.7700.2041.337
Q20.1070.2641−0.0860.3001.140270.215−0.3320.763
Q30.0360.8511−0.3520.4230.189270.036−0.5100.581
Q40.5360.0070.1320.1630.9092.948270.5570.0011.114
Q50.7140.0010.0360.3211.1073.731270.7050.1421.268
Q60.1070.5231−0.2320.4460.648270.122−0.4240.669
Q7−0.2140.1841−0.5370.109−1.36227−0.257−0.8050.291
Q80.2860.0730.986−0.0280.6001.867270.353−0.1970.903
Q9−0.2140.1101−0.4800.052−1.65227−0.312−0.8610.237
Q100.0360.8231−0.2890.3610.225270.043−0.5030.588
Q11−0.0710.6261−0.3690.226−0.49327−0.093−0.6390.453
Q120.7780.0020.0460.3211.2353.50026
Q13−0.0710.4901−0.2810.138−0.70127−0.132−0.6790.414
Q140.0710.4241−0.1090.2520.812270.153−0.3930.700
Q150.2500.1481−0.0940.5941.491270.282−0.2670.830
Q160.0710.6461−0.2440.3870.465270.088−0.4580.634
Q17−0.1070.5011−0.4300.215−0.68227−0.129−0.6750.417
Q180.3570.0570.929−0.0120.7261.987270.375−0.1750.926
Q190.0710.6461−0.2440.3870.465270.088−0.4580.634
Q200.1480.3811−0.1940.4900.89126
Q210.2500.1831−0.1250.6251.368270.259−0.2890.807
Q220.2500.1291−0.0770.5771.567270.296−0.2530.845
Table D11. t-test results and Cohen’s D for pre vs. follow-up changes in indices.
NamesEstimatep ValueAdjusted p ValuesConfint_minConfint_maxt StatisticDegrees FreedomCohen’s DCD Conf int_minCD Confint_max
Declarative0.2820.0050.0410.0930.4713.066270.5790.0221.137
Procedural0.2140.0930.258−0.0380.4671.742270.329−0.2200.879
Subjective0.0110.8911−0.1480.1690.138270.026−0.5200.572
Behavior0.2180.0160.0660.0440.3912.577270.487−0.0671.041

Appendix D.14. Density Plot Histograms of the Indices Figure D4

Figure D4. Density plot histograms of the distribution of scores for All, Post and Follow-up surveys. (a) Behavior Index; (b) Declarative Index; (c) Procedural Index; (d) Subjective Index.
Education 07 00004 g008

Appendix D.15. Investigation into the Sex Differences

The results were suggestive of a difference between the sexes, at least on the all student sample. This difference can be seen in Figure D5.
Figure D5. Density plot histogram of the behavior in the all student sample split by sex.
Education 07 00004 g009
In order to compare the differences between the sexes statistically we split the databases into male and female ones and then ran a t-test comparing the responses for behavior on each of the three samples. The results of which can be seen in the Table D12 below. This finds only a significant difference in the ‘All Student’ sample.
Table D12. Unpaired t-test of females vs. males for each sample.
Surveyst StatisticParameterp ValueFemale MeanMale MeanDiff of MeansConfint_minConfint_max
All2.291106.0830.0242.6122.4080.2040.0280.381
Post−0.80362.4060.4252.9003.013−0.113−0.3940.168
Followup1.03311.8840.3222.8702.6000.270−0.3000.840
These data show a statistically significant difference between the female and male respondents initially but that difference is no longer there in the later surveys. We examined this a different way using the Kolmogorov-Smirnov (KS) to ask whether the males and females were drawn from different populations. In Table D13 one can see that for none of the indices can we conclude that males and females are different populations even if the means are statistically different as we found with the t-test.
Table D13. KS Test comparing females vs. males for all student sample.
Female (Mean)Male (Mean)KS StatisticKS p Value
Declarative3.073.040.100.95
Procedural2.872.760.120.83
Subjective3.213.080.180.29
Behavior2.612.410.190.25
We ran a regression on the male and female samples for the all student survey data and report the results in the Table D14 and the standardized results in Table D15. The most interesting result is the difference between the effect of subjective and procedural knowledge for the sexes. The effect is still there in the post survey but dividing that already smaller sample dramatically reduces the power of that result.
Table D14. Regressions of all student survey separated by sex.
Dependent Variable
Behavior
FemaleMale
(1)(2)
Age Category (23,30]0.2360.103
(0.206)(0.154)
Age Category (30,100]0.3720.095
(0.392)(0.306)
Origin Leon0.176−0.010
(0.126)(0.159)
Origin GTO0.0790.269
(0.138)(0.197)
Origin DF0.586 **−0.045
(0.244)(0.175)
Degree Desarrollo y Gestión Interculturales0.426 *0.062
(0.220)(0.213)
Degree Economia Industrial−0.070−0.227
(0.171)(0.235)
Degree Fisioterapía0.191−0.145
(0.145)(0.191)
Degree Odontología0.290 *−0.217
(0.156)(0.194)
Final. Grade−0.0130.015
(0.045)(0.057)
Declarative0.1230.141
(0.121)(0.172)
Procedural0.490 ***0.048
(0.119)(0.174)
Subjective0.1100.792 ***
(0.128)(0.159)
Constant0.267−0.630
(0.547)(0.678)
Observations6752
R20.5230.605
Adjusted R20.4060.470
Residual Std. Error0.358 (df = 53)0.361 (df = 38)
F Statistic4.463 *** (df = 13; 53)4.476 *** (df = 13; 38)
Note: * p < 0.1; ** p < 0.05; *** p < 0.01.
Table D15. Standardized regressions of all student survey separated by sex.
Dependent Variable
Behavior
FemaleMale
(1)(2)
Age Category(23,30]0.2360.103
(0.206)(0.154)
Age Category(30,100]0.3720.095
(0.392)(0.306)
Origin Leon0.176−0.010
(0.126)(0.159)
Origin GTO0.0790.269
(0.138)(0.197)
Origin DF0.586 **−0.045
(0.244)(0.175)
Degree Desarrollo y Gestión Interculturales0.426 *0.062
(0.220)(0.213)
Degree Economia Industrial−0.070−0.227
(0.171)(0.235)
Degree Fisioterapía0.191−0.145
(0.145)(0.191)
Degree Odontología0.290 *−0.217
(0.156)(0.194)
z. Final. Grade−0.0300.043
(0.102)(0.160)
z. Declarative0.1080.121
(0.106)(0.148)
z. Procedural0.506 ***0.046
(0.123)(0.166)
z. Subjective0.0980.648 ***
(0.114)(0.131)
Constant2.292 ***2.487 ***
(0.160)(0.219)
Observations6752
R20.5230.605
Adjusted R20.4060.470
Residual Std. Error0.358 (df = 53)0.361 (df = 38)
F Statistic4.463 *** (df = 13; 53)4.476 *** (df = 13; 38)
Note: * p < 0.1; ** p < 0.05; *** p < 0.01.

References

  1. McKenzie-Mohr, D. Fostering Sustainable Behavior: An Introduction to Community-Based Social Marketing; New Society Publishers: Gabriola Island, BC, Canada, 2011. [Google Scholar]
  2. Hungerford, H.R.; Volk, T.L. Changing learner behavior through environmental education. J. Environ. Educ. 1990, 21, 8–21. [Google Scholar] [CrossRef]
  3. Tilbury, D.; Stevenson, R.; Fien, J.; Schreuder, D. Education and Sustainability: Responding to the Global Challenge; IUCN—The World Conservation Union: Gland, Switzerland, 2002. [Google Scholar]
  4. Fischer, D.; Barth, M. Key competencies for and beyond sustainable consumption. Gaia Ecol. Perspect. Sci. Soc. 2014, 23, 193–200. [Google Scholar]
  5. Barth, M.; Michelsen, G. Learning for change: An educational contribution to sustainability science. Sustain. Sci. 2013, 8, 103–119. [Google Scholar] [CrossRef]
  6. Larson, K.L.; Redman, E. Water Education for Sustainability: Criteria and Recommendations. Soc. Nat. Resour. 2014, 27, 1213–1222. [Google Scholar] [CrossRef]
  7. Frisk, E.; Larson, K.L. Educating for Sustainability: Competencies & Practices for Transformative Action. J. Sustain. Educ. 2011, 2, 1–20. [Google Scholar]
  8. Redman, E. Advancing educational pedagogy for sustainability: Developing and implementing programs to transform behaviors. Int. J. Environ. Sci. Educ. 2013, 8, 1–34. [Google Scholar]
  9. McGuire, N.M. Environmental education and behavioral change: An identity-based environmental education model. Int. J. Environ. Sci. Educ. 2015, 10, 695–715. [Google Scholar]
  10. Kollmuss, A.; Agyeman, J. Mind the Gap: Why do people act environmentally and what are the barriers to pro-environmental behavior? Environ. Educ. Res. 2002, 8, 239–260. [Google Scholar] [CrossRef]
  11. Kaiser, F.G.; Fuhrer, U. Ecological behavior’s dependency on different forms of knowledge. Appl. Psychol. 2003, 52, 598–613. [Google Scholar] [CrossRef]
  12. Redman, E.; Redman, A. Transforming sustainable food and waste behaviors by realigning domains of knowledge in our education system. J. Clean. Prod. 2014, 64, 147–157. [Google Scholar] [CrossRef]
  13. Schultz, P.W.; Nolan, J.M.; Cialdini, R.B.; Goldstein, N.J.; Griskevicius, V. The constructive, destructive, and reconstructive power of social norms. Psychol. Sci. 2007, 18, 429–434. [Google Scholar] [CrossRef] [PubMed]
  14. Zelezny, L.C. Educational interventions that improve environmental behaviors: A meta-analysis. J. Environ. Educ. 1999, 31, 5–14. [Google Scholar] [CrossRef]
  15. Vaughter, P.; Wright, T.; McKenzie, M.; Lidstone, L. Greening the ivory tower: A review of educational research on sustainability in post-secondary education. Sustainability 2013, 5, 2252–2271. [Google Scholar] [CrossRef]
  16. Henrich, J.; Heine, S.J.; Norenzayan, A. The weirdest people in the world? Behav. Brain Sci. 2010, 33, 61–83. [Google Scholar] [CrossRef] [PubMed]
  17. Arnett, J.J. The neglected 95%: Why American psychology needs to become less American. Am. Psychol. 2008, 63, 602–614. [Google Scholar] [CrossRef] [PubMed]
  18. Vicente-Molina, M.A.; Fernández-Sáinz, A.; Izagirre-Olaizola, J. Environmental knowledge and other variables affecting pro-environmental behaviour: Comparison of university students from emerging and advanced countries. J. Clean. Prod. 2013, 61, 130–138. [Google Scholar] [CrossRef]
  19. Geiger, S.M.; Otto, S.; Diaz-Marin, J.S. A diagnostic environmental knowledge scale for Latin America. Biling. J. Environ. Psychol. 2014, 5, 1–36. [Google Scholar]
  20. Osbaldiston, R.; Schott, J.P. Environmental sustainability and behavioral science: Meta-analysis of proenvironmental behavior experiments. Environ. Behav. 2012, 44, 257–299. [Google Scholar] [CrossRef]
  21. Glasgow, R.E.; Klesges, L.M.; Dzewaltowski, D.A.; Bull, S.S.; Estabrooks, P. The future of health behavior change research: What is needed to improve translation of research into health promotion practice? Ann. Behav. Med. 2004, 27, 3–12. [Google Scholar] [CrossRef] [PubMed]
  22. Nussbaum, E.M.; Owens, M.C.; Sinatra, G.M.; Rehmat, A.P.; Cordova, J.R.; Ahmad, S.; Harris, F.C.; Dascalu, S.M. Losing the lake: Simulations to promote gains in student knowledge and interest about climate change. Int. J. Environ. Sci. Educ. 2015, 10, 789–811. [Google Scholar]
  23. Bogner, F.X. The influence of short-term outdoor ecology education on long-term variables of environmental perspective. Progr. Bavar. For. Natl. Park 1998, 29, 17–29. [Google Scholar] [CrossRef]
  24. Finger, M. From knowledge to action? exploring the relationships between environmental experiences, learning, and behavior. J. Soc. Issues 1994, 50, 141–160. [Google Scholar]
  25. Barr, S. Strategies for sustainability: Citizens and responsible environmental behaviour. Area 2003, 35, 227–240. [Google Scholar] [CrossRef]
  26. Thøgersen, J. A cognitive dissonance interpretation of consistencies and inconsistencies in environmentally responsible behavior. J. Environ. Psychol. 2004, 24, 93–103. [Google Scholar] [CrossRef]
  27. Bland, J.M.; Altman, D.G. Statistics Notes: Cronbach’s Alpha. Br. Med. J. 1997, 314, 22–23. [Google Scholar] [CrossRef]
  28. Gelman, A. Scaling regression inputs by dividing by two standard deviations. Stat. Med. 2008, 27, 2865–2873. [Google Scholar] [CrossRef] [PubMed]
  29. Ballantyne, R.; Packer, J.; Falk, J. Visitors’ learning for environmental sustainability: Testing short- and long-term impacts of wildlife tourism experiences using structural equation modelling. Tour. Manag. 2011, 32, 1243–1252. [Google Scholar] [CrossRef]
  30. Sahin, E.; Ertepinar, H.; Teksoz, G. University students’ behaviors pertaining to sustainability : A structural equation model with sustainability-related attributes. Int. J. Environ. Sci. Educ. 2012, 7, 459–478. [Google Scholar]
  31. Christensen, R.; Knezek, G. The climate change attitude survey: Measuring middle school student beliefs and intentions to enact positive environmental change. Int. J. Environ. Sci. Educ. 2015, 10, 773–788. [Google Scholar]
  32. Gossard, M.H.; York, R. Social structural influences on meat consumption. Hum. Ecol. Rev. 2003, 10, 1. [Google Scholar]
  33. Brundiers, K.; Wiek, A. Do We Teach What We Preach? An International Comparison of Problem- and Project-Based Learning Courses in Sustainability. Sustainability 2013, 5, 1725–1746. [Google Scholar]
  34. De Young, R. Expanding and Evaluating Motives for Environmentally Responsible Behavior. J. Soc. Issues 2000, 56, 509–526. [Google Scholar] [CrossRef]
  35. Rogers, E. Diffusion of Innovations; Simon and Schuster: New York, NY, USA, 2003. [Google Scholar]
  36. Chao, Y.-L.; Lam, S.-P. Measuring Responsible Environmental Behavior: Self-Reported and Other-Reported Measures and Their Differences in Testing a Behavioral Model. Environ. Behav. 2011, 43, 53–71. [Google Scholar] [CrossRef]
  37. Milfont, T.L. The effects of social desirability on self-reported environmental attitudes and ecological behaviour. Environmentalist 2009, 29, 263–269. [Google Scholar] [CrossRef]
  38. Cohen, J. Statistical Power Analysis for the Behavioral Sciences, 2nd ed.; Routledge: Abingdon-on-Thames, UK, 1988. [Google Scholar]
  39. Kim, C.; Storer, B.E. Reference values for cook’s distance. Commun. Stat. Part B Simul. Comput. 1996, 25, 691–708. [Google Scholar] [CrossRef]
  40. O’ Brien, R.M. A Caution Regarding Rules of Thumb for Variance Inflation Factors. Qual. Quant. 2007, 41, 673–690. [Google Scholar] [CrossRef]
  41. Schochet, P.Z. Guidelines for Multiple Testing in Impact Evaluations of Educational Interventions. Mathematica Policy Research, Inc.: Princeton, NJ, USA, 2008. [Google Scholar]
  42. Benjamini, Y.; Yekutieli, D. The Control of the False Discovery Rate in Multiple Testing under Dependency. Ann. Stat. 2016, 29, 1165–1188. [Google Scholar]
Figure 1. Graph of t-test result for indices for the change from pre to post surveys.
Education 07 00004 g001
Figure 2. Graph of Cohen’s D effect sizes for changes from pre to the follow-up survey.
Education 07 00004 g002
Figure 3. Density plot histograms of the distribution of scores for All, Post and Follow-up surveys (the rest can be found in Appendix D.14). (a) distribution of declarative scores; (b) distribution of behavior scores.
Education 07 00004 g003
Table 1. Example Questions from Survey Instrument.
QuestionKnowledge Domain
Does plastic create serious environmental problems?Declarative
Do you know how to compost organic waste?Procedural
I know people who are committed to living SustainablySubjective
I bring my reusable bag to the store to avoid using a disposable bag.Behavior
Table 2. Descriptive Statistics of the Surveyed Samples.
AllInterventionFollow-Up
Number1198228
Male43.7%43.9%28.6%
Female56.3%56.1%71.4%
Elsewhere20.2%19.5%17.9%
Leon48.7%45.1%42.9%
Guanajuato State19.3%23.2%25.0%
Mexico City11.8%12.2%14.3%
Agricultural Administration16.0%11.0%7.1%
Intercultural Development and Management10.9%1.2%0
Industrial Economics12.6%00
Physical Therapy35.3%51.2%57.1%
Dentistry25.2%36.6%35.7%
Age(mean)21.521.822.4
Grade(mean)8.17.88.1
Table 3. Descriptive Statistics of Indices for All student sample.
MeanStandard DeviationStandardized Alpha
Declarative3.060.430.65
Procedural2.820.500.60
Subjective3.150.430.70
Behavior2.520.490.46
Table 4. Hypothesis 3: Relationship between the change in knowledge and change in behavior.
Dependent Variable
Behavior
Declarative0.168
(0.157)
Procedural0.117
(0.164)
Subjective0.455 **
(0.177)
Constant0.636 **
(0.254)
Observations72
R20.362
Adjusted R20.233
Residual Std. Error0.500 (df = 59)
F Statistic2.794 *** (df = 12; 59)
Note: * p < 0.1; ** p < 0.05; *** p < 0.01.
Table 5. Hypothesis 1: Regression examining relationship between knowledge and behavior.
Dependent Variable
Behavior
Female0.165 **
(0.080)
Degree: IDM0.257 *
(0.153)
Declarative0.106
(0.087)
Procedural0.305 ***
(0.099)
Subjective0.324 ***
(0.087)
Constant2.315 ***
(0.134)
Observations119
R20.466
Adjusted R20.395
Residual Std. Error0.379 (df = 104)
F Statistic6.493 *** (df = 14; 104)
Note: * p < 0.1; ** p < 0.05; *** p < 0.01.

