
Subject Teachers as Educators for Sustainability: A Survey Study


Department of Teacher Education, University of Helsinki, Helsinki 00014, Finland
*
Author to whom correspondence should be addressed.
Educ. Sci. 2017, 7(1), 8; https://doi.org/10.3390/educsci7010008
Submission received: 30 October 2016
/
Revised: 18 December 2016
/
Accepted: 21 December 2016
/
Published: 4 January 2017
(This article belongs to the Special Issue Teaching Methods in Science Subjects Promoting Sustainability)
Abstract
:Sustainability education (SE) is included in school curricula to integrate the principles, values, and practices of sustainable development (SD) into all education. This study investigates lower secondary school subject teachers as educators for sustainability. A survey was used to study the perceptions of 442 subject teachers from 49 schools in Finland. There were significant differences between the subject teachers’ perceptions of their SE competence, and the frequency with which they used different dimensions of SE (ecological, economic, social, well-being, cultural) in their teaching varied. Teachers’ age had a small effect, but gender, school, and its residential location were nonsignificant factors. Teachers could be roughly classified into three different subgroups according to their perceptions of the role of SE in their teaching; those who considered three SE dimensions rather often and used holistic sustainability approaches in their teaching (biology, geography, history); those who considered two or three dimensions often but were not active in holistic teaching (mother tongue, religion, visual arts, crafts, music, physical and health education, and home economics) and those who used one SE dimension or consider only one holistic approach in their teaching (mathematics, physics, chemistry and language). Subject teachers’ awareness of their SE competence is important to encourage them to plan and implement discipline-based and interdisciplinary SE in their teaching. The specific SE expertise of subject teachers should be taken into account in teacher training and education.
1. Introduction
1.1. Curricular Goals of Sustainability Education
The aim of education for sustainable development (ESD), or sustainability education (SE), is to integrate the principles, values, and practices of sustainable development (SD) into all aspects of education. This challenge was also underlined by the United Nations (UN) as the Decade for Education for Sustainable Development (DESD 2005–2014). During the decade, SE has been increasingly taken into account in the formal education of comprehensive schools around the world [1]. SE emphasizes the consideration of multiple aspects of sustainability including ecological, economic, social, and cultural aspects of SD. The consideration of all aspects of sustainability is crucial in sustainability teaching (ST), although aspects involving the ecological dimension have traditionally been emphasized in schools [2,3,4]. The Finnish National Core Curriculum for Basic Education [5] was in use in the schools during the DESD. According to the curriculum, natural diversity and the preservation of environmental viability is included in the underlying values of basic education. The curriculum also included “Responsibility for the environment, well-being and a sustainable future” as a cross-curricular theme and, according to the curriculum [5] (p. 39), schools should teach “future-oriented thinking and the building of the future upon ecologically, economically, socially and culturally sustainable premises”. The curriculum highlights a holistic view, by which the students should, for instance “come to understand prerequisites for human well-being, the necessity of environmental protection, and the relationship between the two” [5] (p. 39). In the learning objectives and core contents of different school subjects, goals linked to SE have also been mentioned. The national curriculum was renewed in 2014 [6], with seven main areas of students’ transversal competences emphasized in all subjects. One of these main competence areas is “Participation, agency and the building of a sustainable future”. Thus, as sustainability aspects have been highlighted in the past and present curricula [5,6], it is important to study how the goals have been reached in the school.
1.2. Effectiveness of SE in School Education
Currently, SE is widely included in school curricula around the world [1], and research on the effects of SE is gradually increasing. However, very little is known about the effectiveness of SE. In general, the goals of SE are to influence the values, interests, and attitudes of students. In Finland, ninth-grade students’ pro-environmental and pro-social values and attitudes, as well as their interest in environmental and human issues, have been found to be interconnected [7]. In a Finnish study [8], it was also found that ninth-grade students’ interest, values, and attitudes pertaining to environmental issues correlated with each other. An important finding is that students’ sustainability school experiences make a difference, as the Finnish ninth-grade students’ ecologically sustainable behaviors outside the school could be influenced by their personal factors, like sustainability-related attitudes, values, and self-efficacy beliefs, which in turn were influenced by sustainability experiences in the school [9]. Sustainability-related social and agency experiences, in particular, have been found to be important in predicting these behaviors [9]. In Sweden, similar results were found [10], indicating that SE can impact student outcomes in terms of their sustainability consciousness. Thus, to study the educational effectiveness of SE in secondary school, it is also very important to more closely study the competence of the teachers in SE.
1.3. Teachers as Sustainability Educators
SE is a complex and controversial approach, and it may be a challenge for subject teachers. In their review on environmental education research, Hart and Nolan emphasized that teachers’ knowledge, attitudes, and competence to consider versatile and complex phenomena in environmental education vary [11]. In general, teachers’ pedagogical competence can be described as content knowledge, pedagogical knowledge, and pedagogical content knowledge [12]. Subject teachers’ SE competence may be linked to their expertise areas, as well as to the tradition, methods, and practices of different subjects’ teaching [13,14,15,16,17]. However, there are not many detailed studies on teachers’ knowledge of SD and their pedagogical content knowledge related to SE. In general, understanding the different dimensions of sustainability has proven to be a challenge for teachers [13,15,16]. In general, many teachers may not feel very competent at including sustainability issues in their teaching [16]. Therefore, examining in-service subject teachers’ knowledge and skills to implement SE is an important topic to research.
In general, secondary school subject teachers specialize in two or three academic disciplines in Finland. The qualification required for subject teachers is a master’s degree from a university. For their master’s degree, subject teachers need to have completed advanced studies in their major subject, and intermediate studies in their minor subjects, one of which is pedagogical studies in teacher education. For instance, a biology teacher has often studied biology as the major subject, and geography/earth sciences, chemistry, or health education as a minor subject, but these studies do include specific courses on SE.
The aim of this study is to determine to what extent subject teachers take different aspects and holistic approaches of SE into account in their teaching, as well as how competent they feel in teaching different SE dimensions. In this study, teachers’ perceptions of all aspects of sustainability, namely ecological, economic, social, and cultural, as defined by [5], were investigated. The study questions for our research are:
How often do subject teachers implement different dimensions and holistic views of SE in their teaching?
How do subject teachers perceive their competence to teach different dimensions of SE?
Do subject teachers’ perceptions differ from each other in terms of the following:
- teaching frequency of ecological, economic, social, and cultural sustainability;
- teaching a holistic view of SE;
- their competence to teach different dimensions of SE?
What is the relative importance of subject, gender, age, school, and the school’s residential area in explaining the results?
2. Materials and Methods
2.1. Questionnaire and Data Sampling
A large-scale survey was carried out to study the implementation and effects of ESD in 2010 in Finland, see, e.g., [7,9,17]. A specific questionnaire was developed for the research. The background of the questionnaire is in the general recommendations given by UN on the dimensions of SD and SE (e.g., [18]). The items measuring teaching on different aspects of SE were developed using the main areas of sustainability commonly considered in SE [19,20] and the Finnish cross-curricular theme “Responsibility for the environment, well-being, and a sustainable future” [5], especially the ecological, economic, and social dimensions. Items for cultural and economic dimensions were developed using the FNBE recommendations that deepen the understanding of cross-curricula themes [21]. The recommendations of the OKKA Foundation [22] for sustainability schools were also used. OKKA is a foundation for teaching, education, and personal development supporting the educational sector. Its founding organizations are the Trade Union of Education in Finland (OAJ) and several teachers’ associations in the vocational sector. The OKKA Foundation has the right to grant sustainable development certification of educational establishments in Finland.
The original questionnaire is composed of several pages with questions that consider teachers’ sustainability-related teaching in the school. Only sections to elicit responses from teachers on items concerning their general schools practices and teaching on ecological, economic, social, and cultural sustainability at school were included in this study. The teachers were asked how often they considered different dimensions of sustainability (ecological, economic, social, and cultural) in their teaching: “Evaluate how often you consider the issues mentioned below in your own teaching. The teaching method is free depending on the subject and its nature. Choose the alternative that best fits with your own opinion”. The frequency of different activities was rated on a five-point Likert-type scale: 5 = very often, 4 = rather often, 3 = sometimes, 2 = rather seldom, 1 = very seldom.
Teachers’ perceptions of their competence in SE were assessed using five items with which the teachers could rate their responses on a five-point Likert scale: 1 = very poorly, 2 = rather poorly, 3 = satisfactory, 4 = rather well, 5 = very well. Teachers’ perceptions of their knowledge of the cross-curricular theme “Responsibility for the environment, wellbeing and sustainable future” [5] were assessed similarly.
A stratified sampling procedure was used to select the lower secondary school for the study, so that different residential areas (urban, densely populated, and rural) were represented in the sample collected from the whole country. Fourteen teacher questionnaires were sent to each of the selected 54 lower secondary schools, of which five were Swedish-speaking schools. Altogether, 49 schools were included in the study.
The teachers were also asked to indicate their major and minor subject during their pre-service studies. There were 25 different disciplines in the questionnaire:
|
|
|
|
|
|
|
|
|
|
|
|
|
|
|
|
|
|
|
|
|
|
|
|
|
The groupings were carried out according to the two disciplines the subject teachers taught at their schools. The same teacher usually teaches two different subjects according to his/her pre-service major and minor studies, such as mother tongue and literature, history and social studies, physical and health education, or religion and ethics. The grouping was carried out according to the major subject of the teacher. Some disciplines occurred only as minor subjects, such as health education, orthodox religion or other religions, ethics, and social studies. For instance, only four teachers indicated that their major subject was health education, and thus these teachers were combined with the teachers of physical education.
Finnish as the mother tongue and Swedish as a second national language were the most common subjects of the language teachers. The third most common language was English. Because there were not many language teachers who had Finnish as a second national language or French, German, Russian, or other language as their major subject, they were combined to form a group of “other language teachers” in this study. Altogether 16 subject teacher categories were formed.
2.2. Statistical Analyses
An explorative factor analysis (EFA) was used to reduce the data and identify the latent variables of the data with IBM software, PASW 23. Maximum likelihood was used as the extraction method based on Eigenvalues larger than 1. Promax rotation was used, as is likely that the factors measuring different aspects of sustainability correlate with each other. Factor score coefficients were estimated using the regression method and the factor scores were used in statistical analyses. Average scales describing the variables were calculated, with the items’ means representing the Likert scale from 1 to 5 according to the EFA pattern matrix. ANOVA was used to analyze the contribution of gender, age, teachers’ subject, and schools’ location in urban, densely populated, or rural areas.
The original questionnaire was composed of 53 items to find the most suitable solution to study the ecological, economic, social, and cultural aspects of SE. However, only 27 items were accepted into the final best fit factor solution of EFA. In this case, initial communalities varied between 0.441 and 0.774 and the Kaiser-Meyer-Olkin Measure of Sampling Adequacy was 0.91 indicating that the data were adequate to carry out the EFA. The five-factor solution explained 69.4% of the variance in initial Eigenvalues. The number of items per factor varied between three and eight, and the internal consistency (Cronbach’s alpha) from 0.87 to 0.91.
3. Results
3.1. Subject Teachers
The data from 49 schools representing different parts of Finland were used in the study. The response rate for the schools was 92%, and for the teachers’ questionnaires, 60%. A total of 442 teachers participated in the study, but 14 teachers did not indicate their subject. The teachers were grouped into four different age groups: 21–30 years (13%), 31–40 years (25%), 41–50 years (31%), and >50 years (30%) by age. Forty-nine percent of the schools were located in urban areas, while the contribution of densely populated areas was 21% and rural areas 30%.
The teachers were grouped according to the major subject they taught at school, which is commonly the same discipline they studied during their pre-service studies. In general there were more female teachers (53%–97%), with the exception of history, in which 65% of the teacher were male (Table 1).
3.2. Formation of SE Dimensions in Teaching
Five different sustainability dimensions were found by EFA, so that the number of items varied between three and eight in different ST factors (Table 2). For social sustainability, two different types of dimensions were found, namely the general social dimension at the school and society levels, and well-being at the individual level. The cultural dimension was also a factor. Cronbach’s alpha of the different variables varied between 0.87 and 0.91, showing that the internal consistency of the variables was very high. Factor loadings were rather high in all variables. Items’ means indicate that sustainability issues were not considered very frequently (M = 2.7–3.5) by the teachers. The item and variable averages indicate that well-being and social sustainability were the most frequently considered aspects, while ecological, economic, and cultural aspects were considered least frequently.
3.3. Sustainability Dimensions in Teaching
The frequency of the teachers’ use of different sustainability dimensions (ecological, economic, social, wellbeing, and cultural) in their teaching was measured. Science teachers, especially biology and geography teachers, considered the ecological sustainability aspect rather often (Table 3). This aspect was least considered by language, religion, and music teachers. Other subject teachers considered ecological dimensions “rather seldom” (2 on the Likert scale) or “sometimes” (3 on the Likert scale). Economic aspects were considered most often by home economics, history, and biology teachers, but in this case the frequency was “sometimes” or ”rather often” (4 on the Likert scale). Teaching on economic issues followed a similar pattern to the ecologic dimension, so that language and music teachers considered the dimension rather seldom, which was also common among other subject teachers.
Social aspects and well-being were the themes most commonly considered by the teachers. Social sustainability issues were considered rather often, especially by religion, history, and music teachers, and well-being by the teachers of physical and health education, home economics, biology, and geography. This aspect was least frequently considered by chemistry, mathematics, and physics teachers, and by the group of other language teachers. Cultural sustainability was considered especially by mother tongue, history, music, visual arts, and religion teachers. As in social sustainability, cultural issues were least frequently considered by chemistry, mathematics, and physics teachers (Table 3).
3.4. Differences between the Teachers
There seemed to be clear differences in teachers’ ST (Table 3, Figure 1 and Figure 2); thus, univariate analysis of variance (ANOVA) was used to determine which of the independent variables (age, subject of the teacher, or location of the school) were important (Table 4). To test the differences between the teachers, Levene’s test indicated that the variances between the teacher groups did not differ significantly (p > 0.05) from each other. The results show that the teacher’s subject was the most important factor explaining the frequency of ST, accounting 20%–43% of the variance (SS effect + SS error) (Table 4).
The reasons for the results can be seen in Figure 1 and Figure 2, in which the boxplots show large variations between the teachers. Multiple comparisons of ANOVA showed that, for instance, biology and geography teachers considered ecological sustainability issues significantly more often in their teaching than most other teacher groups (Tukey’s test, p < 0.001). Language teachers were different from other teachers in that they thought significantly less about ecological issues than the teachers in biology, physics, chemistry, and mathematics (Tukey’s test, p < 0.001). The home economics teachers considered economic sustainability significantly more often than, for instance, language, mathematics, physics, chemistry and music teachers (Tukey’s test, p < 0.001). In ecological sustainability, the distribution was the largest among history teachers and in economic sustainability among visual arts teachers (Figure 1).
In social, well-being, and cultural sustainability, the overall picture was different from that of ecological and economic ST (Table 3, Figure 2). In teaching on social sustainability the teachers did not differ as much from each other as in ecological and economic sustainability. For instance, in social sustainability, religion teachers were significantly different (Tukey’s test, p < 0.001) only from mathematics, other language, and chemistry teachers. Well-being was most often considered by the teachers of physical/health education, home economics, biology, and geography. For instance, the teachers of physical/health education differed significantly from all language, mathematics, physics, chemistry, and crafts teachers (Tukey’s test, p < 0.001). Likewise, music and visual arts teachers considered cultural sustainability more often than mathematics, physics, chemistry, and English teachers (Tukey’s test, p < 0.001). Well-being and cultural dimensions were the least frequently considered by mathematics, physics, and chemistry teachers, and they differed significantly from most other teacher groups (Tukey’s test, p < 0.001).
3.5. Holistic Approach in SE
The teachers were asked how often they used more holistic ST dimensions in their teaching. (Table 5). In these six items interactions between sustainability dimensions (ecological, economic, social, and cultural) were described. The challenges between different SD dimensions can be considered in various ways in ST; in Table 5 only reduced relations are named.
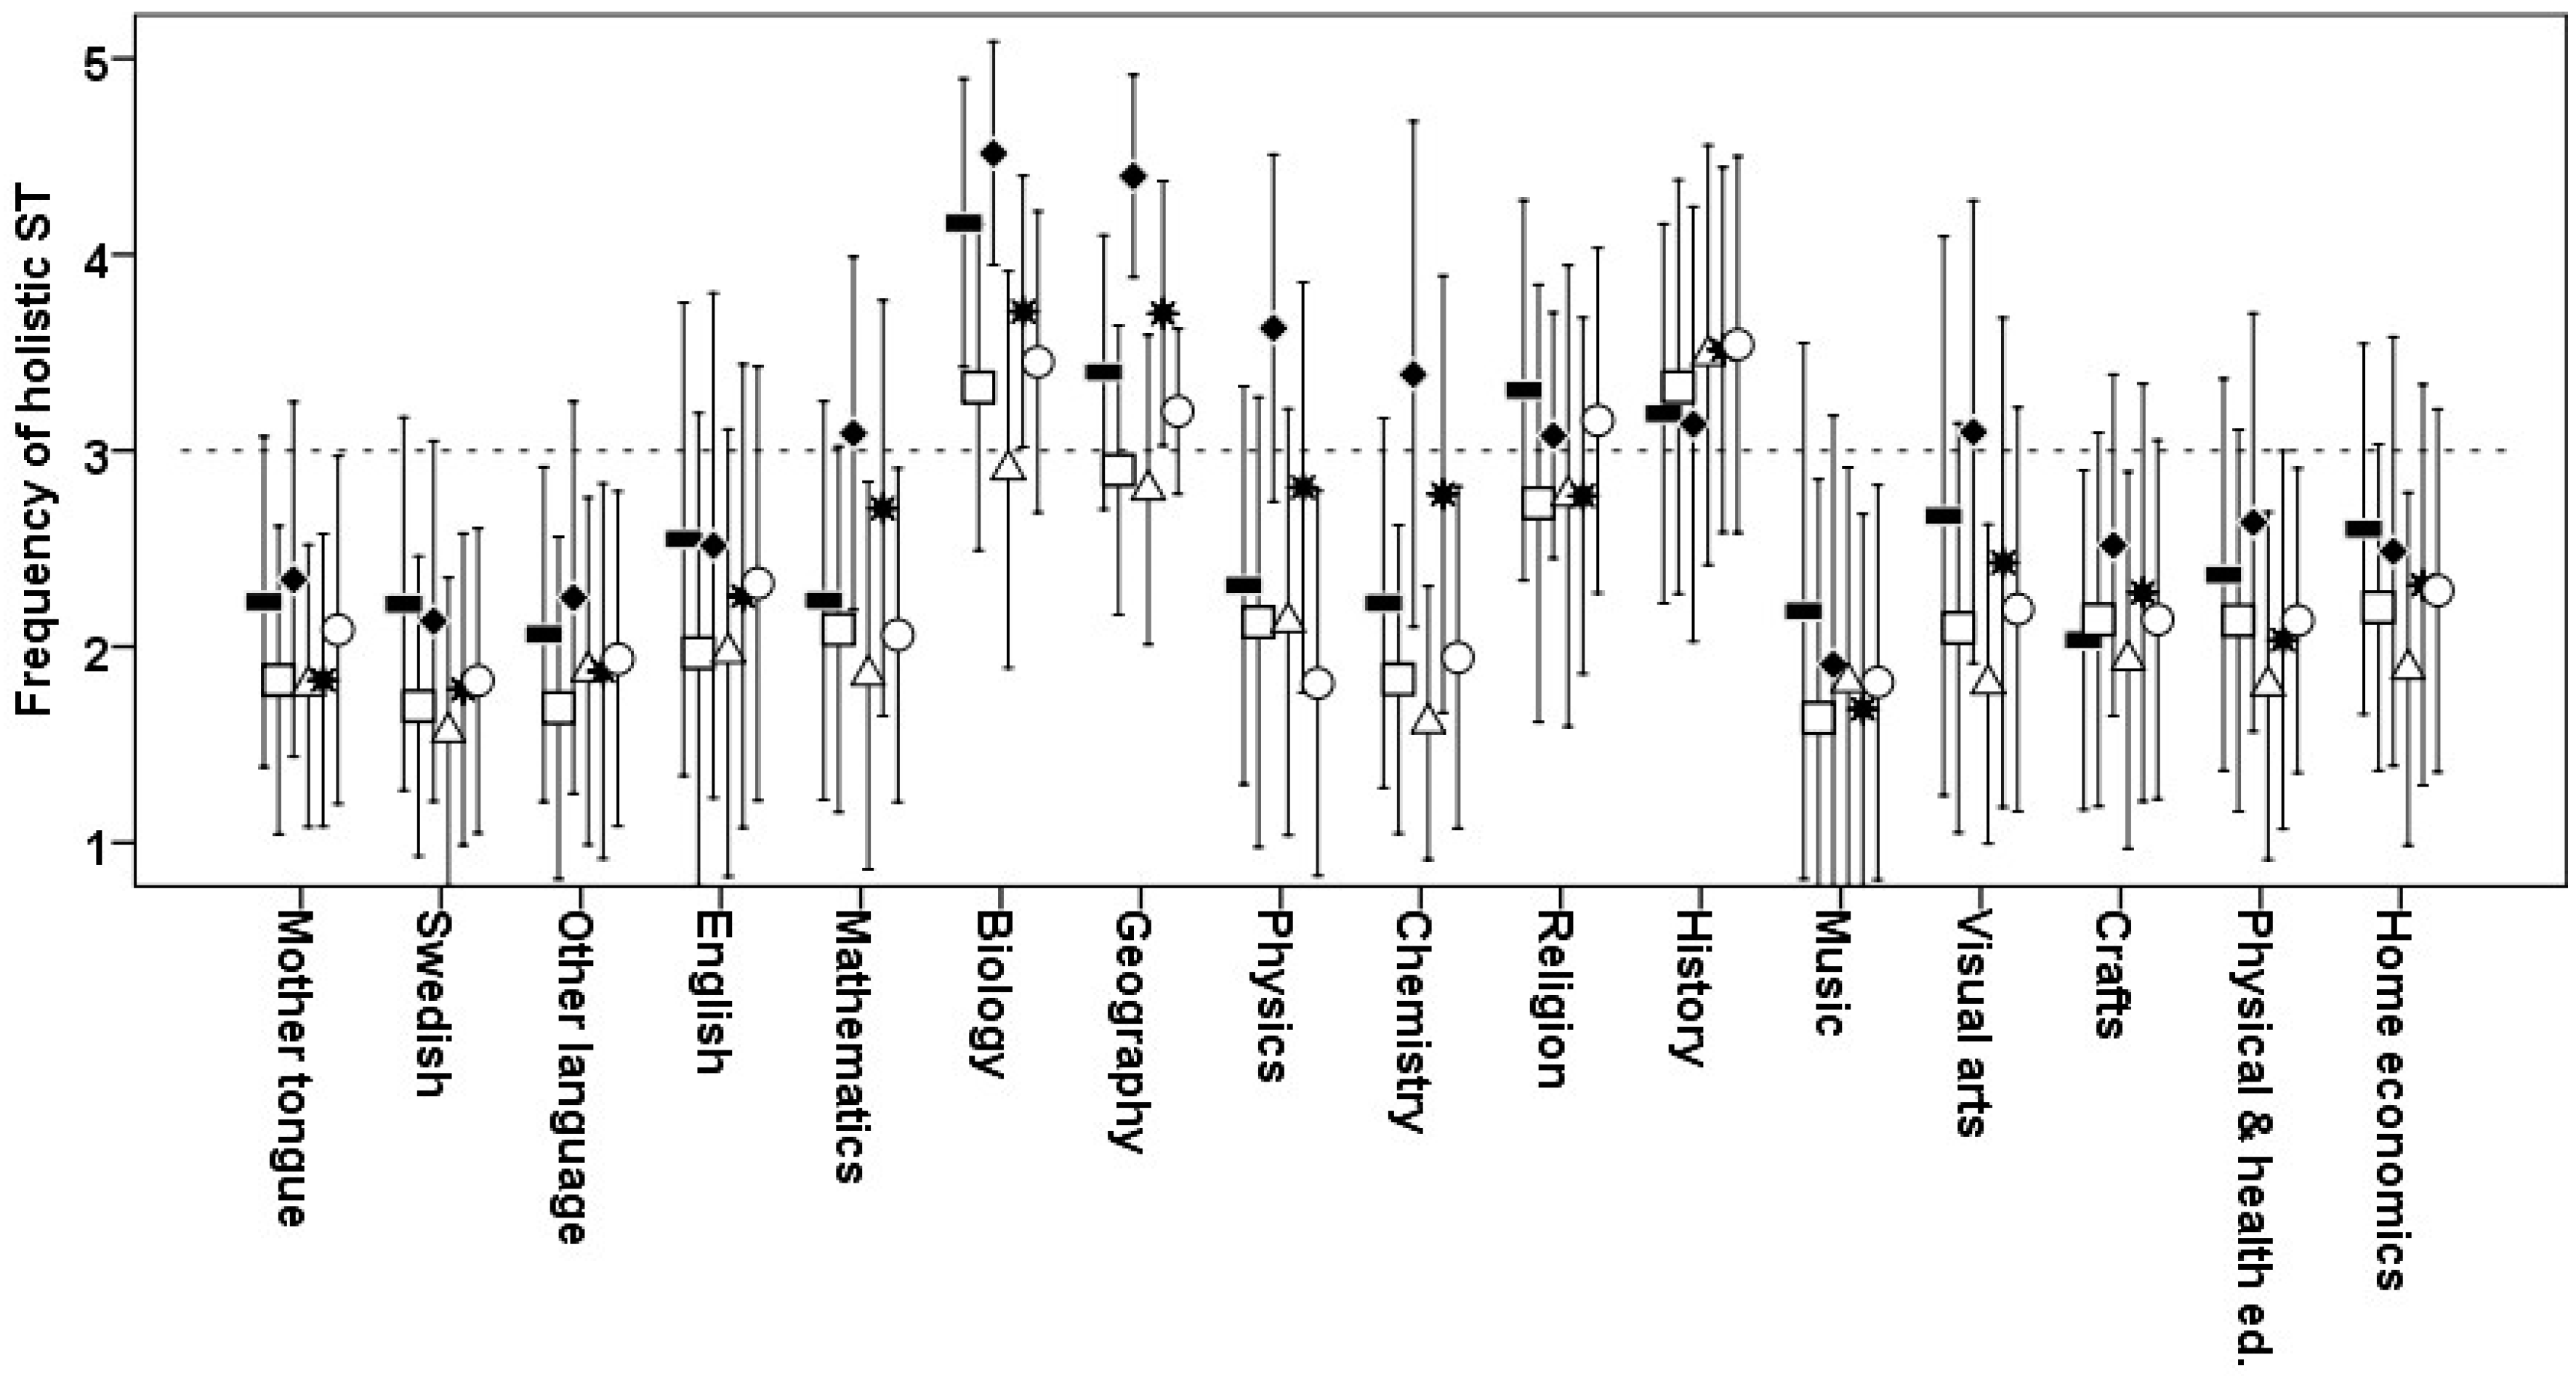
The frequency with which the teachers used holistic approaches in their teaching varied and the teachers differed significantly from each other (ANOVA F = 8.7–11.4, df = 15, p < 0.001) (Figure 3). Overall, holistic approaches were used rather seldom by most teacher groups, except science, history, and religion teachers. Human activity as a cause of challenges in ecological sustainability (Soc.–Eco.) was considered mostly by mathematics and science teachers. In general, biology, geography, history, and religion teachers used several holistic approaches. These teachers used holistic approaches equally or even more often than they used some of the unidimensional sustainability aspects (Figure 3, Table 1). Overall, the challenges caused to economic sustainability by other sustainability aspects were rather rarely considered by most subject teacher groups. A holistic teaching approach in which the ecological aspect was included as the main cause or effect tended to be most commonly used in ST. Only biology, geography, religion, and history teachers reported that they consider an economic–social combination (Econ.–Soc.) at least sometimes in their teaching (Figure 3).
3.6. Teachers’ Perceptions of Their SE Competencies
Teachers’ perceptions of their general competence in SE were assessed using five items by using a five-point Likert scale. On average, teachers rated their knowledge of the cross-curricular theme “Responsibility for the environment, wellbeing and sustainable future” satisfactory or higher (Figure 4). There were still differences between the teachers (one-way ANOVA, F = 4.1, df = 15, p < 0.001). For instance, biology and geography teachers’ responses indicated that their conceptions on their knowledge of the cross-curricular theme was higher than among most other subject teachers, especially physics, chemistry, mathematics, language, and physical and health education teachers (Tukey’s test, p < 0.05).
Teachers’ belief in their competence to teach different dimensions of sustainability (ecological, economic, social, and cultural) was examined using four items. The average competence in different dimensions varied from 2 (“rather poorly” in economic and cultural sustainability by mathematics, physics and chemistry teachers) to nearly 5 (“very well” in ecological sustainability by biology and geography teachers) (Figure 5). To study how much each subject teacher group differed in their competence perceptions, the average SE competence was calculated as the mean of the four SE competence items and analyzed with a one-sample t-test. The analysis indicates that there were significant differences (p < 0.01) in SE competence perceptions within the subject teacher groups (Figure 5). Mathematics, biology, physics, and chemistry teachers felt significantly more competent in teaching ecological dimensions when compared to their average sustainability competence (p < 0.01). Mother tongue and visual arts teachers felt significantly more competent in the economic dimension (p < 0.01), while mathematics and home economics teachers felt less competent, respectively. In addition, the competence in the social dimension was rated significantly lower (p < 0.01) by mother tongue teachers when compared to their average competence. Similar trends, although not significant, could be found among other teachers (Figure 5).
When calculated from the whole sample, teachers’ contributions in different dimensions and holistic approaches in ST, perceptions of their SE competence, and knowledge of cross-curricular goals were in most cases significantly correlated (p < 0.01) with each other (Table 6). In most cases the relationship was moderate (rho = 0.3–0.49) or strong (rho ≥ 0.5), cf. [23]. For instance, the frequency of the ecological dimension used in ST correlated very strongly with all holistic dimensions in ST. The relationship was similar in the economic dimension, but in this case the correlations were mostly moderate. There were also strong correlations between different types of holistic dimensions in ST (Table 6). In some combinations the correlations represent a rather small association (rho = 0.17–0.27), for instance between the social, wellbeing, and cultural sustainability dimensions and holistic approaches of ST that emphasize the combination of ecological, economic, and social aspects (Soc.–Ecol., Econ.–Ecol., see Table 6). Likewise, there were non-significant or rather small correlations between the frequency of social, wellbeing, and cultural sustainability dimensions and the ecological, economic, or curricular competences in ST. On the contrary, ST in the ecological and economic dimensions correlated weakly with the social and cultural competence dimensions. Small correlations were also found between some holistic approaches in ST and social and cultural SE competence. Overall, the correlations reflect at least three types of ST activity, one being strongly related to ecological-holistic-economic dimensions, another to social-economic-holistic dimensions, and the third to well-being-social-cultural dimensions (Table 6).
To classify the different subject teachers into larger subgroups, a decision tree analysis was also carried out with CHAD as the growing method to summarize the results (Table 7). The analysis (F = 37–81, p < 000.1) showed which subject teacher groups answered the questionnaire most similarly. The decision tree analysis classified subject teachers into roughly three or four different subgroups within each of the five sustainability dimensions. The largest averages in Table 7 indicate the highest subgroup activity within a SE dimension. For instance, in the ecological dimension mathematics, biology, physics, geography, chemistry, history, visual arts, crafts, and home economics formed one subgroup. On some occasions, only two or three subject teachers were classified into the same subgroup, such as history and home economics teachers to the economic dimension and biology, physical & health education, and home economics to the well-being dimension. The pattern varied according to the SE dimension, indicating that although subject teachers could be roughly classified into different SE subgroups, the classification strongly depends on the SE dimension in question. Mathematics, physics, chemistry, and language teachers formed the most distinct groups relating to their perceptions to ST, but for other teachers the main factor was their perception of different aspects of SE (Table 6 and Table 7).
3.7. Differences in Demographical Factors
In general, economic and ecological sustainability were the least frequently considered topics in the ST, and the well-being was the most often considered sustainability dimension for all age groups (Figure 6). There were significant differences between the teachers’ age groups in the ST frequency only in the ecological and economic dimensions (F = 8.4, df = 3, p < 0.01) (Table 2). The oldest age group used ecological sustainability topics significantly more often in their teaching than any of the younger age groups (Tukey’s test, p < 0.01). They also used economic and social topics significantly more in their teaching that the youngest age group (Tukey’s test p < 0.01). In well-being and cultural sustainability, there were no significant differences between the age groups (Figure 6).
Due to the large number of schools and the varying number of teachers attending the study, the comparisons were carried out using only a non-parametric independent samples Kruskal–Wallis test. The results indicated that there were no differences between the schools in terms of how often the teachers used different dimensions of sustainability in their teaching. Differences between rural, densely populated, and urban areas could be studied with ANOVA, and the results showed that there were no significant differences between the different residential areas in any of the studied factors. The independent samples t-test also indicated no overall gender differences in any of the studied variables.
4. Discussion
4.1. Teachers’ Main Subject Influence SE
In this study, the perceptions of lower secondary school subject teachers on SE were studied. The results indicated that there were large differences between the subject teachers in how they used ecological, economic, social, well-being, and cultural aspects, as well as holistic approaches, in their ST. Subject teachers also differed from each other in their perception of their competence to teach different dimensions of sustainability and their awareness of the cross-curricular theme “Responsibility for the environment, wellbeing and sustainable future” [5].
The most interesting result of this study was that the teachers’ subject was the most important factor explaining their contribution in ST, their age being of only minor importance. Teachers’ gender, school, or the location in different types of residential areas did not explain the differences between the subject teachers’ perceptions. Teachers’ professional development was likely the reason for the finding that older teachers used more ST than younger teachers. In a Swedish study [16] similar results were found; recently qualified teachers’ perceptions of SD indicated a poorer understanding of SD than teachers who had been working longer than five years. The results of these studies contradict a British study, which found that student teachers have a more comprehensive understanding of SD than their mentors, the experienced teachers [24].
The lack of difference between the subject teachers in different schools is an interesting result, as in an earlier study, the data for which were collected in the same schools as in this study [9], ninth-grade students’ pro-environmental behaviors could be explained by their personal factors, especially self-efficacy beliefs, which in turn was connected to their sustainability-related experiences in the school. In another Finnish survey on ninth-grade students’ environmental interests, values, and attitudes, school-related differences were found [8]. Therefore, although subject teachers’ perceptions of SE may not differ among schools, students’ knowledge of sustainability issues, positive attitudes, and skills to act in sustainable ways may be promoted, for instance, by individual SE enthusiastic teachers and schools’ sustainability-oriented action culture.
4.2. Subject Teachers’ Strengths and Limitations in ST
On average, social sustainability and well-being were the aspects most often considered by teachers, and the cultural dimension was used more often than ecological and economic dimensions. The results are not in line with the studies that have investigated teachers’ understanding of different aspects of SD in teaching [3,15,16]. These studies found that teachers’ understanding was mostly focused on the ecological dimension. In our study, only mathematics, physics and chemistry teachers were clearly focused on the ecological dimension alone. The emphasis of teaching on ecological or environmental issues is attributed to the tradition of environmental education, which is more focused on environmental issues than SE [4,25].
There were also large differences in the frequency with which the teachers considered sustainability issues in their teaching. Our results suggest that although teachers may be uncertain what the different SD and SE dimensions are [14,16], they still consider sustainability-related issues in their subject-specific teaching. In general, as regards the ST frequencies, three different teacher groups could be roughly distinguished: those who considered at least three sustainability dimensions rather often and used several types of holistic approaches in their teaching (biology, geography, and history); those who considered two or three dimensions often but were not especially active in holistic teaching (mother tongue, religion, visual arts, crafts, music, physical/ health education, and home economics), and those who used only one SE dimension or considered only one holistic approach (mathematics, physics, chemistry, and language). The perceptions of the biology, geography, and history teachers of their SE competence and awareness of the sustainability curricular theme were higher when compared to the perceptions of other teachers. The results are partially in line with the Swedish study [14], which found that upper secondary school teachers differ in their understanding of the holistic perspective of SD, including economic, ecological, and social dimensions. As in this study, the Swedish study suggested that subject traditions are important factors that influence teaching, so that social science teachers emphasize social dimensions and science teachers emphasize ecological dimensions [14].
In the Swedish study [16] it was found that the teachers were unsure of their understanding of the economic dimension, which is in accordance with our study, in that the economic dimension was the least considered sustainability dimension in ST by some subject teacher groups. However, it is important to note that, in this study, more detailed differences between the subject teachers could be found as all subject teachers were studied separately. For instance, history and home economics teachers used economic aspects relatively often in their teaching. This is understandable, as sustainability issues are included in the curricula of these disciplines [5]. Home economics, biology and geography teachers consider lifestyles, consumption habits, and environmentally responsible behaviors often in their teaching. The second discipline of history teachers is social studies, and thus social and economic issues are often considered by history teachers.
Subject teachers had different strengths in their competence to teach on different sustainability themes. Due to the national curriculum [5] and teaching traditions, biology and geography teachers are often active in their teaching of the ecological dimension [2]. Also in this study, when compared to other teacher groups, biology and geography teachers most often taught ecological sustainability, but they also taught other sustainability dimensions often and used holistic viewpoints in their teaching. They were also very aware of the cross-curricular sustainability theme and generally felt very competent in ST, especially in the ecological dimension and well-being. The results cannot be fully compared with the Swedish studies [14,16], which found that the science teachers, including biology teachers, focused mostly on the ecological dimension. In Finland biology teachers most often teach geography as a second discipline and geography teachers most often have biology as a second discipline, thus influencing each other. The Finnish biology and geography curricula also shared related content, “The common environment” [5,6], so that more holistic and integrated environmental courses could be implemented.
This study shows that teachers in religion, home economics, history, and crafts used social, well-being, and cultural SE dimensions rather often in their teaching, because of the characteristics of their discipline. History and religion teachers did not often use the ecological aspect of sustainability in their teaching, but history teachers combined the ecological dimension into holistic approaches.
Overall, mathematics, physics, chemistry and language teachers used sustainability issues the least in teaching, considering only the ecological or social-cultural dimensions, respectively. For language teachers, the results of this study are in line with the Swedish findings [14] that many language teachers did not use sustainability issues in their teaching, because they did not see any relevance of SD to their subject. This is understandable, as mathematics, physics, chemistry and language teachers focus largely on subject-specific procedural knowledge and problem-solving skills. Recently it was suggested [15,26] that sustainability aspects can easily be included in science education. For instance, the relevance of scientific knowledge and skills can be considered in individual and societal contexts, together with different SE aspects.
4.3. Implications for Teacher Training and Education
On a global scale, it is widely accepted that SE is an important part of formal education, and it also forms an important part of school curricula. Researchers have argued that subject teachers’ competence to teach sustainability issues is not very high, and they feel unsure about SE [3,11,14,15,16,24]. This study indicated that subject teachers had their own strengths and limitations in SE, which should be taken into account when planning and implementing SE in secondary schools. Subject teachers should become aware of their SE competences through their disciplines. Many in-service teachers already consider sustainability-related issues in their teaching, but do not combine them in a more holistic view of sustainability. Thus, subject teachers would benefit from courses considering the holistic and cross-curricular backgrounds of SD and SE, and how the teachers can combine SE aspects in their pedagogical content knowledge. In-service and student teachers would need training in SE, as suggested by many studies [11,15,16]. In teacher education, SE contexts should be readily included. Recently, teacher education is actively developing SE, for instance in different contexts of formal and non-formal science education [27,28].
In the renewed curriculum of basic education [6], transversal competences are emphasized in all subjects. One of these main competence areas is “Participation, agency and building of a sustainable future”, which requires SE competences. The implementation of multidisciplinary learning content and the integration of different subjects is also a new cross-curricular goal in basic education, providing teachers with a context to cooperate and plan teaching, in which SE can be the main interdisciplinary approach. It is important that teachers are helped to recognize their strengths in SE, and can take other teachers’ SE expertise into account.
4.4. Implications for SE Research
In general, the external validity of the study is very good, because a well-planned stratified sampling was used when gathering the data. When developing the questionnaire, the internal validity was confirmed by using the practices and research-based documents that describe the characteristics of SE in the school [5,18,19,20,21,22]. However, SE is a whole-school approach [29]; thus, the implications of its educational effectiveness are challenging to study. For instance, in this study the variation within the teachers in each school was so large that it may have exceeded the potential variation between the schools. The number of teachers varied from five to 14 in the participating schools and thus all subjects were not presented from every school. The subject of participating teachers also varied. In general, the comparisons of schools with the survey based on teachers’ or students’ responses to a limited number of Likert-scale items may be a rather rough measure of the complexity of SE. The comparative results between the schools should be interpreted with caution and the sources of variation. The differences between the schools had to be quite large to appear in teachers and students’ average responses to Likert scales. Thus, although the statistical significance of differences between the schools or areas may be small, these differences can be important.
The results also reflect the methodological approach of the study, as sustainability-related issues in teaching were examined as such. It is obvious that these dimensions are considered by subject teachers without planned linkage to SE.
To find more detailed information about educational effectiveness in SE, teachers’ and students’ perceptions of sustainability issues should be studied with questionnaires that assess a range of versatile aspects of SE. This study was carried out in a research project, in which several aspects of educational effectiveness was studied (see e.g. [7,9,17]). In this study only teachers’ perceptions of their teaching was investigated. Other SE aspects, such as teachers’ sustainability-related values, self-efficacy beliefs and impacts on schools action culture will be published in another research papers.
5. Conclusions
The perceptions of lower secondary school subject teachers about their ST and competence to teach different aspects of sustainability were studied. The teacher’s subject was the most important factor explaining teachers’ contribution to ST, while their age had little importance. Teachers’ general educational experience was likely related to the result that ST increased with age. Gender, school, or the location of the school in different residential areas did not have any effect on SE teaching. As groups, subject teachers differed from each other when teaching ecological, economic, social, well-being, and cultural aspects of SE or considering holistic aspects of SE. They also differed from each other in their perceptions of their competence to teach different dimensions of sustainability.
Every subject teacher group had its specific strengths and limitations in SE. For instance, biology and geography, history and social studies and to some extent also religion and ethics teachers considered several but different sustainability dimensions often and used holistic approaches in their sustainability-related teaching. However, it is likely that subject teachers were not especially aware of their competence in SE. In-service teacher training courses and SE courses in teacher education would be important in clarifying the background and pedagogy of SE. For instance, in mathematics, physics, chemistry, and language teacher education, problem-solving and multi-literacy pedagogy could be practiced using SE contexts. Teachers also need SE competence to carry out multidisciplinary teaching and cooperate with each other, as the whole-school approach has been found to be an effective educational approach in SE [29]. Subject teachers are experts in their discipline; thus, additional teacher training and education have the potential to result in teachers’ higher SE competence.
Acknowledgments
The data of this study was collected during the SEED project (Sustainable Food Education for Self-Efficacy Development—SEED—How to encourage future citizens to act for a sustainable society) in Finland, under the auspices of the Academy of Finland, project number 128569. NFBE is acknowledged for their expertise in designing the stratified sampling of the schools.
Author Contributions
Anna Uitto and Seppo Saloranta designed and carried out the survey; Anna Uitto analyzed the data and was responsible in writing the paper; Seppo Saloranta commented different versions of the paper.
Conflicts of Interest
The authors declare no conflict of interest.
References
- The United Nations Educational, Scientific and Cultural Organization (UNESCO). Shaping the Future We Want. In UN Decade of Education for Sustainable Development (2005–2014); Final Report; UNESCO: Paris, France, 2014; Available online: http://unesdoc.unesco.org/images/0023/002303/230302e.pdf (accessed on 30 October 2016).
- Rajakorpi, A.; Rajakorpi, H. Sustainable Development in Schools and Educational Institutions? Evaluation 7/200; National Board of Education: Helsinki, Finland, 2001; Available online: http://karvi.fi/app/uploads/2014/09/OPH_0501.pdf (accessed on 30 October 2016).
- Pepper, C.; Wildy, H. Leading for sustainability: Is surface understanding enough? J. Educ. Adm. 2008, 46, 613–629. [Google Scholar] [CrossRef]
- Breiting, S.; Wickenberg, P. The progressive development of environmental education in Sweden and Denmark. Environ. Educ. Res. 2010, 16, 9–37. [Google Scholar] [CrossRef]
- National Core Curriculum for Basic Education (NFBE). National Core Curriculum for Basic Education Intended for Pupils in Compulsory Education; Finnish National Board of Education: Helsinki, Finland, 2004; Available online: http://www.oph.fi/english/curricula_and_qualifications/basic_education/curricula_2004 (accessed on 30 October 2016).
- National Core Curriculum for Basic Education (NFBE). National Core Curriculum for Basic Education Intended for Pupils in Compulsory Education; Finnish National Board of Education: Helsinki, Finland, 2014. (In Finnish) [Google Scholar]
- Uitto, A.; Saloranta, S. The relationship between secondary school students’ environmental and human values, attitudes, interests and motivations. Procedia Soc. Behav. Sci. 2010, 9, 1866–1872. [Google Scholar] [CrossRef]
- Uitto, A.; Juuti, K.; Lavonen, J.; Byman, R.; Meisalo, V. Secondary school students’ interests, attitudes and values concerning school science related environmental issues in Finland. Environ. Educ. Res. 2011, 17, 167–186. [Google Scholar] [CrossRef]
- Uitto, A.; Boeve-de Pauw, J.; Saloranta, S. Participatory school experiences as facilitators for adolescents’ ecological behavior. J. Environ. Psychol. 2015, 43, 55–65. [Google Scholar] [CrossRef]
- Boeve-de Pauw, J.; Gericke, N.; Olsson, D.; Berglund, T. The Effectiveness of Education for Sustainable Development. Sustainability 2015, 7, 15693–15717. [Google Scholar] [CrossRef]
- Hart, P.; Nolan, K. A Critical Analysis of Research in Environmental Education. Stud. Sci. Educ. 1999, 34, 1–69. [Google Scholar] [CrossRef]
- Shulman, L. Those who understand: Knowledge growth in teaching. Educ. Res. 1986, 15, 4–31. [Google Scholar] [CrossRef]
- Jickling, B.; Wals, A.E.J. Globalization and environmental education: Looking beyond sustainable development. J. Curric. Stud. 2007, 40, 1–21. [Google Scholar] [CrossRef]
- Borg, C.; Gericke, N.; Höglund, H.-O.; Bergman, E. The barriers encountered by teachers implementing education for sustainable development: Discipline bound differences and teaching traditions. Res. Sci. Technol. Educ. 2012, 30, 185–207. [Google Scholar] [CrossRef]
- Burmeister, M.; Schmidt-Jacob, S.; Eilk, I. German chemistry teachers’ understanding of sustainability and education for sustainable development—An interview case study. Chem. Educ. Res. Pract. 2013, 14, 169–176. [Google Scholar] [CrossRef]
- Borg, C.; Gericke, N.; Höglund, H.-O.; Bergman, E. Subject- and experience-bound differences in teachers’ conceptual understanding of sustainable development. Environ. Educ. Res. 2014, 20, 526–551. [Google Scholar] [CrossRef]
- Uitto, A.; Saloranta, S. Contribution of secondary school subject teachers on the education for sustainable development. Part 8: Environmental, health and Informal-Outdoor Science education; Ossevoort, M., Carvalho, G., Co-eds. In E-Book Proceedings of the ESERA 2011 Conference: Science learning and Citizenship; Bruguière, C., Tiberghien, A., Clément, P., Eds.; European Science Education Research Association: Lyon, France, 2011; pp. 134–139. Available online: http://www.esera.org/media/ebook/ebook-esera2011.pdf (accessed on 30 October 2016).
- UNESCO. Education for Sustainable Development Lens: A Policy and Practice Review Tool; Education for Sustainable Development in Action Learning & Training Tools No. 2-2010; UNESCO Education Sector: Paris, France, 2010; Available online: http://unesdoc.unesco.org/images/0019/001908/190898e.pdf (accessed on 30 October 2016).
- Breiting, S.; Mayer, M.; Mogensen, F. Quality Criteria for ESD-Schools, Guidelines to Enhance the Quality of Education for Sustainable Development; SEED—Austrian Federal Ministry of Education, Science and Culture: Vienna, Austria, 2005; Available online: http://www.ensi.org/global/downloads/Publications/208/QC-GB.pdf (accessed on 30 October 2016).
- Eco-School Program. Engaging the youth of today to protect the climate of tomorrow. Available online: http://www.ecoschools.global/ (accessed on 30 October 2016).
- Loukola, M.-L. Aihekokonaisuudet Perusopetuksen Opetussuunnitelmassa; Opetushallitus: Helsinki, Finland, 2004. (In Finnish) [Google Scholar]
- OKKA Foundation. Sustainable Development Certification of Educational Establishments. 2016. Available online: http://www.koulujaymparisto.fi/sivu.php?id=1820 (accessed on 30 October 2016).
- Cohen, J. Statistical Power Analysis for the Behavioral Sciences; Erlbaum: Hillsdale, NJ, USA, 1988. [Google Scholar]
- Summers, M.; Childs, A.; Corney, G. Education for Sustainable Development in Initial Teacher Training: Issues for Interdisciplinary Collaboration. Environ. Educ. Res. 2005, 11, 623–647. [Google Scholar] [CrossRef]
- Hesselink, F.; van Kempen, P.P.; Wals, A. (Eds.) ESDebate International Debate on Education for Sustainable Development; IUCN: Gland, Switzerland; Cambridge, UK, 2000.
- Stuckey, M.; Hofstein, A.; Mamlok-Naaman, R.; Eilks, I. The meaning of ‘relevance’ in science education and its implications for the science curriculum. Stud. Sci. Educ. 2013, 49, 1–34. [Google Scholar] [CrossRef]
- Kervinen, A.; Uitto, A.; Kaasinen, A.; Portaankorva-Koivisto, P.; Juuti, K.; Kesler, M. Developing a Collaborative Model in Teacher Education—An Overview of a Teacher Professional Development Project. LUMAT 2016, 4, 67–86. Available online: http://lumat.fi/index.php/lumat/article/view/33/25 (accessed on 30 December 2016). [Google Scholar]
- Tolppanen, S. Creating a Better World: Questions, Actions and Expectations of International Students on Sustainable Development and Its Education. Ph.D. Dissertation, Unit of Chemistry Teacher Education, Department of Chemistry, Faculty of Science, University of Helsinki, Helsinki, Finland, 2015. [Google Scholar]
- Henderson, K.; Tilbury, D. Whole-School Approaches to Sustainability: An International Review of Sustainable School Programs; Report Prepared by the Australian Research Institute in Education for Sustainability (ARIES) for The Department of the Environment and Heritage; Australian Government: Sydney, Australia, 2004. Available online: http://daten.schule.at/dl/international_review2.pdf (accessed on 30 October 2016).
Figure 1.
The frequency of ecological and economic ST of the different subject teachers. White bars = ecological sustainability; gray bars = economic sustainability. Boxplots show the median, interquartile range, outliers (circles), and extreme cases (stars) of individual variables.
Figure 1.
The frequency of ecological and economic ST of the different subject teachers. White bars = ecological sustainability; gray bars = economic sustainability. Boxplots show the median, interquartile range, outliers (circles), and extreme cases (stars) of individual variables.

Figure 2.
The frequency of social, well-being, and cultural ST of the different subject teachers. Dark gray bars = social sustainability; light gray bars = well-being; white bars = cultural sustainability.
Figure 2.
The frequency of social, well-being, and cultural ST of the different subject teachers. Dark gray bars = social sustainability; light gray bars = well-being; white bars = cultural sustainability.

Figure 3.
The frequency of holistic approaches in ST (challenges between ecological, economic, and social SD) carried out by different teacher groups. Black rectangle = Eco.–Soc.; White square = Eco.–Econ.; Black square = Soc.–Eco.; White triangle = Soc.–Econ.; Black star = Econ.–Eco.; White circle = Econ.–Soc.

Figure 4.
Teachers’ conceptions of their knowledge about the cross-curricular theme “Responsibility for the environment, wellbeing and sustainable future”.
Figure 4.
Teachers’ conceptions of their knowledge about the cross-curricular theme “Responsibility for the environment, wellbeing and sustainable future”.

Figure 5.
Teachers’ perceptions of their competence (means and standard deviations) to manage different aspects of sustainability in their teaching. Black circle = ecological, white circle = economic, black square = social, and white square = cultural sustainability.
Figure 5.
Teachers’ perceptions of their competence (means and standard deviations) to manage different aspects of sustainability in their teaching. Black circle = ecological, white circle = economic, black square = social, and white square = cultural sustainability.

Figure 6.
Frequency of different ST dimensions taught by four age groups of the teachers. White = economic, gray = ecological, vertical lines = cultural, horizontal lines = social, checked = wellbeing.
Figure 6.
Frequency of different ST dimensions taught by four age groups of the teachers. White = economic, gray = ecological, vertical lines = cultural, horizontal lines = social, checked = wellbeing.


| Teachers | Women | Men | Total |
|---|---|---|---|
| Mother tongue | 34 | 1 | 35 |
| Swedish | 22 | 1 | 23 |
| Other languages | 14 | 2 | 16 |
| English | 31 | 3 | 34 |
| Biology | 22 | 8 | 30 |
| Geography | 7 | 3 | 10 |
| Physics | 7 | 9 | 16 |
| Chemistry | 14 | 5 | 19 |
| Mathematics | 22 | 12 | 34 |
| History | 13 | 24 | 37 |
| Religion | 19 | 7 | 26 |
| Home economics | 35 | 3 | 38 |
| Physical & health education | 18 | 16 | 34 |
| Music | 14 | 8 | 22 |
| Visual arts | 17 | 4 | 21 |
| Crafts | 22 | 11 | 33 |
| Missing | 8 | 6 | 14 |
| Total | 319 | 123 | 442 |
Table 2.
Cronbach alfa, factor loadings, means, and standard deviations of different ST factors and their items.
| ST Variables Found in EFA | Factor Loading | M | SD |
|---|---|---|---|
| Factor 1. Ecological sustainability (Alpha 0.91) | 2.72 | 0.87 | |
| Environmental influences of industry, traffic, and power production. | 0.92 | 2.79 | 1.13 |
| Environmental influences of the use of natural resources. | 0.88 | 2.98 | 1.12 |
| Prerequisites of the well-being of living nature (e.g., sufficiency and good quality of habitat). | 0.86 | 2.70 | 1.13 |
| Nearby nature and its function (e.g., elements’ cycling, energy flow). | 0.79 | 2.71 | 1.18 |
| Environmental influences of agriculture. | 0.76 | 2.14 | 1.10 |
| Built environment and its function (e.g., population, mills, traffic lanes). | 0.68 | 2.58 | 1.10 |
| Environmentally responsible ways to travel. | 0.54 | 2.55 | 1.06 |
| Recycling of goods. | 0.39 | 3.35 | 1.09 |
| Factor 2. Cultural sustainability (Alpha 0.91) | 2.86 | 0.98 | |
| Scandinavian cultural heritage. | 0.95 | 2.72 | 1.16 |
| European cultural heritage. | 0.95 | 2.84 | 1.22 |
| Finnish cultural heritage. | 0.85 | 3.19 | 1.21 |
| Cultural identity and its formation. | 0.73 | 2.98 | 1.22 |
| Multiculturalism in Finland. | 0.62 | 2.89 | 1.08 |
| The cultural heritage of the school neighborhood. | 0.62 | 2.57 | 1.11 |
| Factors 3. Social sustainability (Alpha 0.87) | 3.28 | 0.81 | |
| Democratic school community. | 0.84 | 2.95 | 1.10 |
| Preventing alienation. | 0.73 | 3.15 | 1.06 |
| Democratic society. | 0.67 | 2.70 | 1.11 |
| Preventing and intervening in bullying. | 0.61 | 3.81 | 0.93 |
| Human rights and equality. | 0.57 | 3.27 | 1.07 |
| Tolerance. | 0.53 | 3.78 | 0.96 |
| Factor 4. Well-being (Alpha 0.89) | 3.46 | 1.03 | |
| Physical wellbeing (e.g., health). | 0.85 | 3.53 | 1.14 |
| Mental wellbeing (e.g., mental health). | 0.85 | 3.29 | 1.19 |
| Social wellbeing (e.g., social issues, relationships between people). | 0.82 | 3.55 | 1.07 |
| Factors 5. Economic sustainability (Alpha 0.87) | 2.65 | 0.97 | |
| Consumption habits and their importance for one’s own finances. | 1.05 | 2.64 | 1.18 |
| Personal economy (e.g., planning and care of one’s own budget). | 0.73 | 2.53 | 1.26 |
| Consumption habits and their importance for sustainable development. | 0.64 | 2.52 | 1.12 |
| Lifestyles and consumption habits. | 0.53 | 2.92 | 1.05 |
Table 3.
Means (M) and standard deviations (SD) of teachers’ ST, when calculated as an average of the items in each SE factor.
| Teacher/ST | Ecological | Economic | Social | Well-Being | Cultural | |||||
|---|---|---|---|---|---|---|---|---|---|---|
| M | SD | M | SD | M | SD | M | SD | M | SD | |
| Mother tongue | 2.15 | 0.61 | 2.40 | 0.77 | 3.34 | 0.74 | 3.28 | 0.86 | 3.37 | 0.75 |
| Swedish | 2.19 | 0.69 | 2.14 | 0.67 | 3.04 | 0.69 | 3.20 | 0.76 | 3.13 | 0.78 |
| English | 2.19 | 0.74 | 2.18 | 1.11 | 3.18 | 0.93 | 3.11 | 0.88 | 2.69 | 0.91 |
| Other languages | 2.06 | 0.68 | 1.94 | 0.77 | 2.68 | 1.02 | 3.02 | 1.01 | 2.70 | 0.64 |
| Biology | 4.04 | 0.45 | 3.08 | 0.74 | 3.29 | 0.61 | 4.22 | 0.63 | 2.93 | 0.76 |
| Geography | 4.00 | 0.56 | 2.65 | 1.10 | 3.13 | 0.67 | 4.03 | 0.87 | 2.67 | 0.67 |
| Physics | 3.22 | 0.73 | 2.38 | 1.10 | 2.85 | 0.78 | 2.57 | 0.98 | 1.80 | 0.85 |
| Chemistry | 3.09 | 0.68 | 2.21 | 0.85 | 2.58 | 0.65 | 2.23 | 0.63 | 1.47 | 0.47 |
| Mathematics | 2.90 | 0.67 | 2.42 | 0.81 | 2.82 | 0.79 | 2.66 | 0.81 | 1.83 | 0.77 |
| History | 2.71 | 0.92 | 3.30 | 0.93 | 3.71 | 0.76 | 3.18 | 0.94 | 3.34 | 0.85 |
| Religion | 2.50 | 0.58 | 2.83 | 0.87 | 3.81 | 0.74 | 3.83 | 0.97 | 3.55 | 0.65 |
| Home economics | 2.85 | 0.63 | 3.50 | 0.67 | 3.39 | 0.81 | 4.23 | 0.68 | 2.95 | 0.88 |
| Physical & health education | 2.59 | 0.73 | 2.47 | 0.91 | 3.54 | 0.58 | 4.48 | 0.67 | 2.44 | 0.73 |
| Music | 1.86 | 0.77 | 2.01 | 0.99 | 3.65 | 0.71 | 3.83 | 0.90 | 3.73 | 0.85 |
| Visual arts | 2.83 | 0.70 | 2.55 | 0.95 | 3.39 | 0.96 | 3.27 | 0.98 | 3.85 | 0.66 |
| Crafts | 2.82 | 0.80 | 2.98 | 0.84 | 3.28 | 0.61 | 3.29 | 0.74 | 2.79 | 0.74 |
| Total | 2.72 | 0.88 | 2.64 | 0.98 | 3.27 | 0.82 | 3.44 | 1.02 | 2.87 | 0.99 |
Note: Highest means are bold (M ≥ 3.2).
| Dimensions of ST | F | df | p | Partial Eta Squared |
|---|---|---|---|---|
| Ecological sustainability | ||||
| Subject | 16.95 | 15 | <0.001 | 0.40 |
| Age | 6.22 | 3 | <0.001 | 0.04 |
| Economic sustainability | ||||
| Subject | 7.34 | 15 | <0.001 | 0.22 |
| Age | 8.43 | 3 | <0.001 | 0.06 |
| Social sustainability | ||||
| Subject | 6.24 | 15 | <0.001 | 0.20 |
| Age | 3.85 | 3 | NS | - |
| Well-being | ||||
| Subject | 14.47 | 15 | <0.001 | 0.36 |
| Age | 3.00 | 3 | NS | - |
| Cultural sustainability | ||||
| Subject | 18.99 | 15 | <0.001 | 0.43 |
| Age | 2.65 | 3 | 0.049 | 0.02 |
| Main Type of Challenge Relation | Items |
|---|---|
| Ecological–Social (Eco.–Soc.) | The challenges caused by the environmental changes to human living conditions (e.g., refugees, conflicts, famine). |
| Ecological–Economic (Eco.–Econ.) | The challenges caused by the environmental changes to the economy (devolution of economic activity, poverty). |
| Social–Ecological (Soc.–Eco.) | The challenges caused by human activities to the condition of the environment (e.g., climate change). |
| Social–Economic (Soc.–Eco.) | The challenges caused by human activities to the stability of the economy (e.g., market crash, warfare). |
| Economic–Ecological (Econ.–Eco.) | The challenges caused by the economic growth to the condition of environment (e.g., exhaustion of natural resources). |
| Economic–Social (Econ.–Soc.) | The challenges caused by economic growth to human wellbeing (e.g., the uneven distribution of material wellbeing). |
Table 6.
Spearman’s correlation coefficients (rho, p < 0.01) between different SE dimensions, holistic SE approaches in ST, and SE competences of all subject teachers.
| 1 | 2 | 3 | 4 | 5 | 6 | 7 | 8 | 9 | 10 | 11 | 12 | 13 | 14 | 15 | |
|---|---|---|---|---|---|---|---|---|---|---|---|---|---|---|---|
| SE dimensions | |||||||||||||||
| 1 Ecological | |||||||||||||||
| 2 Economic | 0.57 | ||||||||||||||
| 3 Social | 0.30 | 0.51 | |||||||||||||
| 4 Well-being | 0.32 | 0.41 | 0.59 | ||||||||||||
| 5 Cultural | 0.15 | 0.40 | 0.58 | 0.33 | |||||||||||
| Holistic approaches in ST | |||||||||||||||
| 6 Ecol.–Soc. | 0.57 | 0.49 | 0.46 | 0.41 | 0.39 | ||||||||||
| 7 Ecol.–Econ. | 0.57 | 0.61 | 0.45 | 0.31 | 0.36 | 0.75 | |||||||||
| 8 Soc.–Ecol. | 0.70 | 0.42 | 0.27 | 0.26 | 0.17 | 0.68 | 0.66 | ||||||||
| 9 Soc.–Econ. | 0.50 | 0.52 | 0.48 | 0.31 | 0.42 | 0.68 | 0.78 | 0.58 | |||||||
| 10 Econ.–Ecol. | 0.64 | 0.49 | 0.32 | 0.19 | 0.23 | 0.67 | 0.73 | 0.74 | 0.70 | ||||||
| 11 Econ.–Soc. | 0.50 | 0.51 | 0.43 | 0.31 | 0.41 | 0.70 | 0.75 | 0.60 | 0.77 | 0.76 | |||||
| SE competences | |||||||||||||||
| 12 Ecological | 0.52 | 0.30 | NS | 0.22 | NS | 0.40 | 0.32 | 0.46 | 0.29 | 0.40 | 0.33 | ||||
| 13 Economic | 0.39 | 0.36 | 0.20 | 0.20 | 0.15 | 0.36 | 0.38 | 0.31 | 0.39 | 0.36 | 0.36 | 0.61 | |||
| 14 Social | 0.21 | 0.24 | 0.37 | 0.36 | 0.35 | 0.33 | 0.27 | 0.20 | 0.29 | 0.18 | 0.30 | 0.47 | 0.59 | ||
| 15 Cultural | 0.15 | 0.22 | 0.37 | 0.29 | 0.52 | 0.30 | 0.26 | 0.16 | 0.25 | 0.14 | 0.28 | 0.33 | 0.41 | 0.73 | |
| 16 Curricular | 0.48 | 0.37 | 0.24 | 0.28 | 0.22 | 0.35 | 0.37 | 0.36 | 0.35 | 0.34 | 0.33 | 0.52 | 0.52 | 0.45 | 0.44 |
Note: Strongest correlations (rho≥ 0.5) are presented in bold; NS, Not significant.
| SE Dimensions/Subgroups | Ecological | Economic | Social | Wellbeing | Cultural |
|---|---|---|---|---|---|
| 1 | 3.08 (0.82) | 2.48 (0.91) | 2.75 (0.80) | 2.52 (0.82) | 1.78 (0.77) |
| MA, BG, PH, GE, CH, HI, VIA, CR, HOE | MA, PH, MOT, GE, VIA, PHE | MA, PH, OL, CH | MA, PH, CH | MA, PH, CH | |
| 2 | 2.14 (0.71) | 2.96 (0.82) | 3.27 (0.75) | 4.31 (0.67) | 2.99 (0.80) |
| MOT, SW, OL, EN, MU | BG, RE, CR | BG, MOT, SW, EN, GE, VIA, CR, HOE | BG, PHE, HOE | BG, SW, HOE | |
| 3 | 2.54 (0.66) | 2.12 (0.91) | 3.67 (0.70) | 3.20 (0.86) | 3.52 (0.78) |
| RE, PHE | SW, OL, EN, CH, MU | RE, HI, MU, PHE | MOT, SW, OL, EN, HI, VIA, CR | MOT, RE, HI, MU, VIA | |
| 4 | - | 3.38 (0.81) | - | 3.87 (0.91) | 2.68 (0. 78) |
| HI, HOE | GE, RE, MU | OL, EN, GE, CR, PHE |
Note: MOT = mother tongue; SW = Swedish; EN = English; OL = other language; MA = mathematics; PH = physics; CH = chemistry; BG = biology; GE = geography; HI = history; RE = religion; MU = music; VA = visual arts; CR = crafts; HOE = home economics; PHE = physical & health education. Values are means and standard deviations (in parentheses).
© 2017 by the authors; licensee MDPI, Basel, Switzerland. This article is an open access article distributed under the terms and conditions of the Creative Commons Attribution (CC-BY) license ( http://creativecommons.org/licenses/by/4.0/).
Share and Cite
MDPI and ACS Style
Uitto, A.; Saloranta, S. Subject Teachers as Educators for Sustainability: A Survey Study. Educ. Sci. 2017, 7, 8. https://doi.org/10.3390/educsci7010008
AMA Style
Uitto A, Saloranta S. Subject Teachers as Educators for Sustainability: A Survey Study. Education Sciences. 2017; 7(1):8. https://doi.org/10.3390/educsci7010008
Chicago/Turabian StyleUitto, Anna, and Seppo Saloranta. 2017. "Subject Teachers as Educators for Sustainability: A Survey Study" Education Sciences 7, no. 1: 8. https://doi.org/10.3390/educsci7010008
Note that from the first issue of 2016, this journal uses article numbers instead of page numbers. See further details here.