Article

An Investigation of Students’ Use of a Computational Science Simulation in an Online High School Physics Class

by
Joshua M. Rosenberg
* and
Michael A. Lawson
Department of Theory and Practice in Teacher Education, College of Education, Health, and Human Sciences, University of Tennessee, Knoxville, TN 37996, USA
*
Author to whom correspondence should be addressed.
Educ. Sci. 2019, 9(1), 49; https://doi.org/10.3390/educsci9010049
Submission received: 1 February 2019 / Revised: 22 February 2019 / Accepted: 24 February 2019 / Published: 7 March 2019

Abstract

:
Science educators have begun to explore how students have opportunities to not only view and manipulate simulations, but also to analyze the complex sources of data they generate. While scholars have documented the characteristics and the effects of using simulations as a source of data in face-to-face, K-12 classrooms, how simulations can be taken up and used in such a way in fully-online classes is less-explored. In this study, we present results from our initial qualitative investigation of students’ use of a simulation in such a way across three lessons in an online, Advanced Placement high school physics class. In all, 13 students participated in the use of a computational science simulation that we adapted to output quantitative data across the lesson sequence. Students used the simulation and developed a class data set, which students then used to understand, interpret, and model a thermodynamics-related concept and phenomenon. We explored the progression of students’ conceptual understanding across the three lessons, students’ perceptions of the strengths and weaknesses of the simulation, and how students balanced explaining variability and being able to interpret their model of the class data set. Responses to embedded assessment questions indicated that a few developed more sophisticated conceptual understanding of the particle nature of matter and how it relates to diffusion, while others began the lesson sequence with an already-sophisticated understanding, and a few did not demonstrate changes in their understanding. Students reported that the simulation helped to make a complex idea more accessible and useful and that the data generated by the simulation made it easier to understand what the simulation was representing. When analyzing the class data set, some students focused on fitting the data, not considering the interpretability of the model as much, whereas other students balanced model fit with interpretability and usefulness. In all, findings suggest that the lesson sequence had educational value, but that modifications to the design of the simulation and lesson sequence and to the technologies used could enhance its impact. Implications and recommendations for future research focus on the potential for simulations to be used to engage students in a variety of scientific and engineering practices in online science classes.

1. Introduction

Recent science, technology, engineering, and mathematics (STEM) curriculum reform efforts focus on engaging students in discipline-based practices. These practice standards shift educators’ focus from what students should know to what students should be doing. A practice standard that cuts across STEM is making sense of data cuts across standards [1,2]. This practice is not only important for STEM disciplines, but also in our everyday lives. For instance, today, data are a powerful tool for understanding and often explaining abstract ideas and concepts. These STEM practices also include developing and using models, analyzing and interpreting data, obtaining, evaluating, and communicating information, and using mathematics and computational thinking, each of which presents an opportunity to begin uncovering practice-based overlap between STEM fields.
There are many implications of the focus on engaging students in practices for K-12 science and STEM education. For example, by providing students with opportunities to think about and use data, students will be able to question what data are and how they were collected. This provides students with not only access to scientific knowledge but also the capacity to understand science by engaging in the knowledge-building processes and practices used by scientists [3]. Moreover, by preparing students to think about and with data, students can begin imagining the use of data to solve problems, better understand phenomena, and answer questions that are relevant and interesting to them.
In science, it is quite possible for students to engage in work with data in any learning environment—face-to-face, blended, or fully online. One affordance for engaging students in data related practices in an online environment is that today’s digital tools can provide teachers and students the ability to access, model, and create figures of data [4]. Building on this opportunity to use digital tools that are already available to students in online classes, this paper describes our initial investigation into preparing students to work with data through three lessons focused on the use of a computational science simulation. In particular, the purpose of this paper is to explore how students can not only use a simulation, but also analyze the complex data sources they generate.

2. Literature Review

For this study, we reviewed research on models and simulations in science education, the role of working with data in the context of simulations, and their use in online science classes. We then propose a novel framework for the use of a computational science simulation in online learning environments.

2.1. Models and Simulations in Science Education

Scientists often investigate very large, small, far away, or otherwise hard to study phenomena. Many times, this requires students to explore stand-ins, or models, for the systems under investigation [5,6]. In this study, we consider modeling in terms of constructing, evaluating, and revising representations of scientific processes and mechanisms [1,7,8,9]. Additionally, simulations have an extensive history in science education and have been found to support learners’ understanding of scientific ideas and the ability to engage in scientific practices [10,11,12,13,14,15,16]. As Honey and Hilton report, simulations “enable learners to see and interact with representations of natural phenomena that would otherwise be impossible to observe” [6] (p. 1).
Early research on simulations in science, often in physics and chemistry [15], focused on both students’ conceptual understanding and their understanding of what underlies the models and simulations [17]. Wider use of simulations in science has taken place along with more accessible platforms and the availability of simulations in content areas beyond physics and chemistry. The PhET simulations are an influential example of how developers are creating more realistic simulations and models that extend beyond simplified, visual representations, and act “much as scientists view their research experiments” [18] (p. 682).
The research base around simulations and models in online science education is vibrant and ever growing. Brinson ‘s [19] recent systematic review reported that virtual laboratories—including simulations and take-home laboratories—generally led to as good or better learning outcomes for students in relation to students’ conceptual understanding of scientific phenomena. Fan and Geelan [20] paint a more complex portrait of simulation through their review of the effects of simulations, concluding that online simulations will not likely replace teachers and traditional laboratories and that it is the quality of simulations that ought to be an emphasis of new research into their use.
In addition to the quality of simulations in terms of their design, the quality of the pedagogical approaches involved in their use also matter. Fan, Geelan, and Gillies [21] showed that when simulations are used in a particular way—wherein students pose questions, make predictions, use simulations to test ideas, and justify and critique the reasoning of others [22]—students demonstrated significantly greater changes in their understanding and their capability to engage in STEM-based practices. Such an approach to the use of simulation is similar to other inquiry- and modeling-based pedagogical strategies (i.e., the Guided Inquiry and Modeling Instructional Framework [23]).
Finally, there are now a number of online and digital platforms that provide access to science simulations. For example, general platforms such as NetLogo [24], Gizmos [25], and Sage Modeler [26] are widely used by those in education. There are also tools designed not as a platform but for exploring a single idea, such as evolution by way of natural selection (e.g., Frog Pond). These simulation tools—and associated pedagogical approaches—can help learners to develop many of the capabilities recent science education reform efforts aim to promote, particularly students’ conceptual understanding, but also their motivation, and their engagement in scientific practices [6]. These ideas point to the potential for online learning environments to embrace virtual simulations as a means to investigate phenomena, bringing our focus to understand better how to adapt existing simulations together with the aim of enhancing student learning.

2.2. Work with Data in the Context of Simulations

Past research on work with data in science and mathematics classrooms indicates that doing so is educationally powerful and valuable on its own, involving demanding (and engaging) reasoning skills and engagement in practice [4,27]. In science education, however, opportunities for students to analyze quantitative data in K-12 settings are often limited by the time it takes to engage in data collection and analysis [4]. While mathematics is used in science, and scientific questions provide a context for some problem-based work in mathematics, how to meaningfully learn both about and how to do science and mathematics has been a challenge for us as educators and educational researchers.
When scientists use simulations, they interpret not only visual output, but also the quantitative data that forms the basis for visualizations [5]. Scientists—and learners, too, “must apply all the usual tools of experimental science for analyzing data: Visualization, statistics, data mining, and so on” [28] (p. 33). One way to provide opportunities for students to work with data in the context of simulations is for students to model and account for variability in data, as doing so can help students understand individual-level behaviors as data-generating processes or mechanisms [29,30]. Recent empirical studies suggest our need to understand better how learners analyze and interpret output from simulations, as part of back-and-forth reasoning between the learner, teacher, simulation, and scientific ideas, and anticipate challenges in student understanding of the mathematical formalisms underlying simulations’ output [28,31,32,33]. While scholars emphasize the importance of evaluating data from simulations, more research is needed on how learners analyze and interpret their output, as such evaluations are “typically of a qualitative rather than a quantitative nature” [34].

2.3. Using Simulations in Online Science Classes

One way that scholars have proposed for engaging students in science using digital tools is through virtual laboratories. This work differs from face-to-face simulations as it aims to reproduce the experience of doing a physical laboratory [35]. This is different from virtual laboratories, which proport to expose students to phenomena so that they can approach their use like scientists approach their research, as simulations add a greater focus on the construction of a simulation’s rules, its starting values, and its processes [18].
Recent work has begun to address the question of what it means to do science in online classes. One study surveyed 386 students enrolled in online, undergraduate science laboratory classes in biology, chemistry, and physics, where students indicated using a mix of hands-on kits, virtual laboratories, and virtual simulations [36]. Overall, the authors reported that students perceived that their online science laboratories are comparable or preferable to face-to-face courses. Moreover, a majority of students who used both virtual and hands-on laboratories reported that they helped them to understand better the lecture material and perceived their labs in online courses to be lower-stress than face-to-face laboratories. Students felt they were better able to quickly iterate between experimental parameters, focus more on the investigation, and move past logistic details such as the gathering of equipment or clean-up.
This past research suggests that there are some benefits and affordances to students’ use of simulations in online post-secondary science courses. However, the body of research on simulations in K-12 science classes tends to focus on face-to-face learning environments rather than the growing field of online K-12 science classes. Particularly, as recent reform efforts emphasize K-12 students engagement in STEM practices [1,2], and the challenge of creating, modifying, and analyzing data generated from simulations in online classes, it is important that we know more about how students use simulations and model the data they generate in online learning environments.

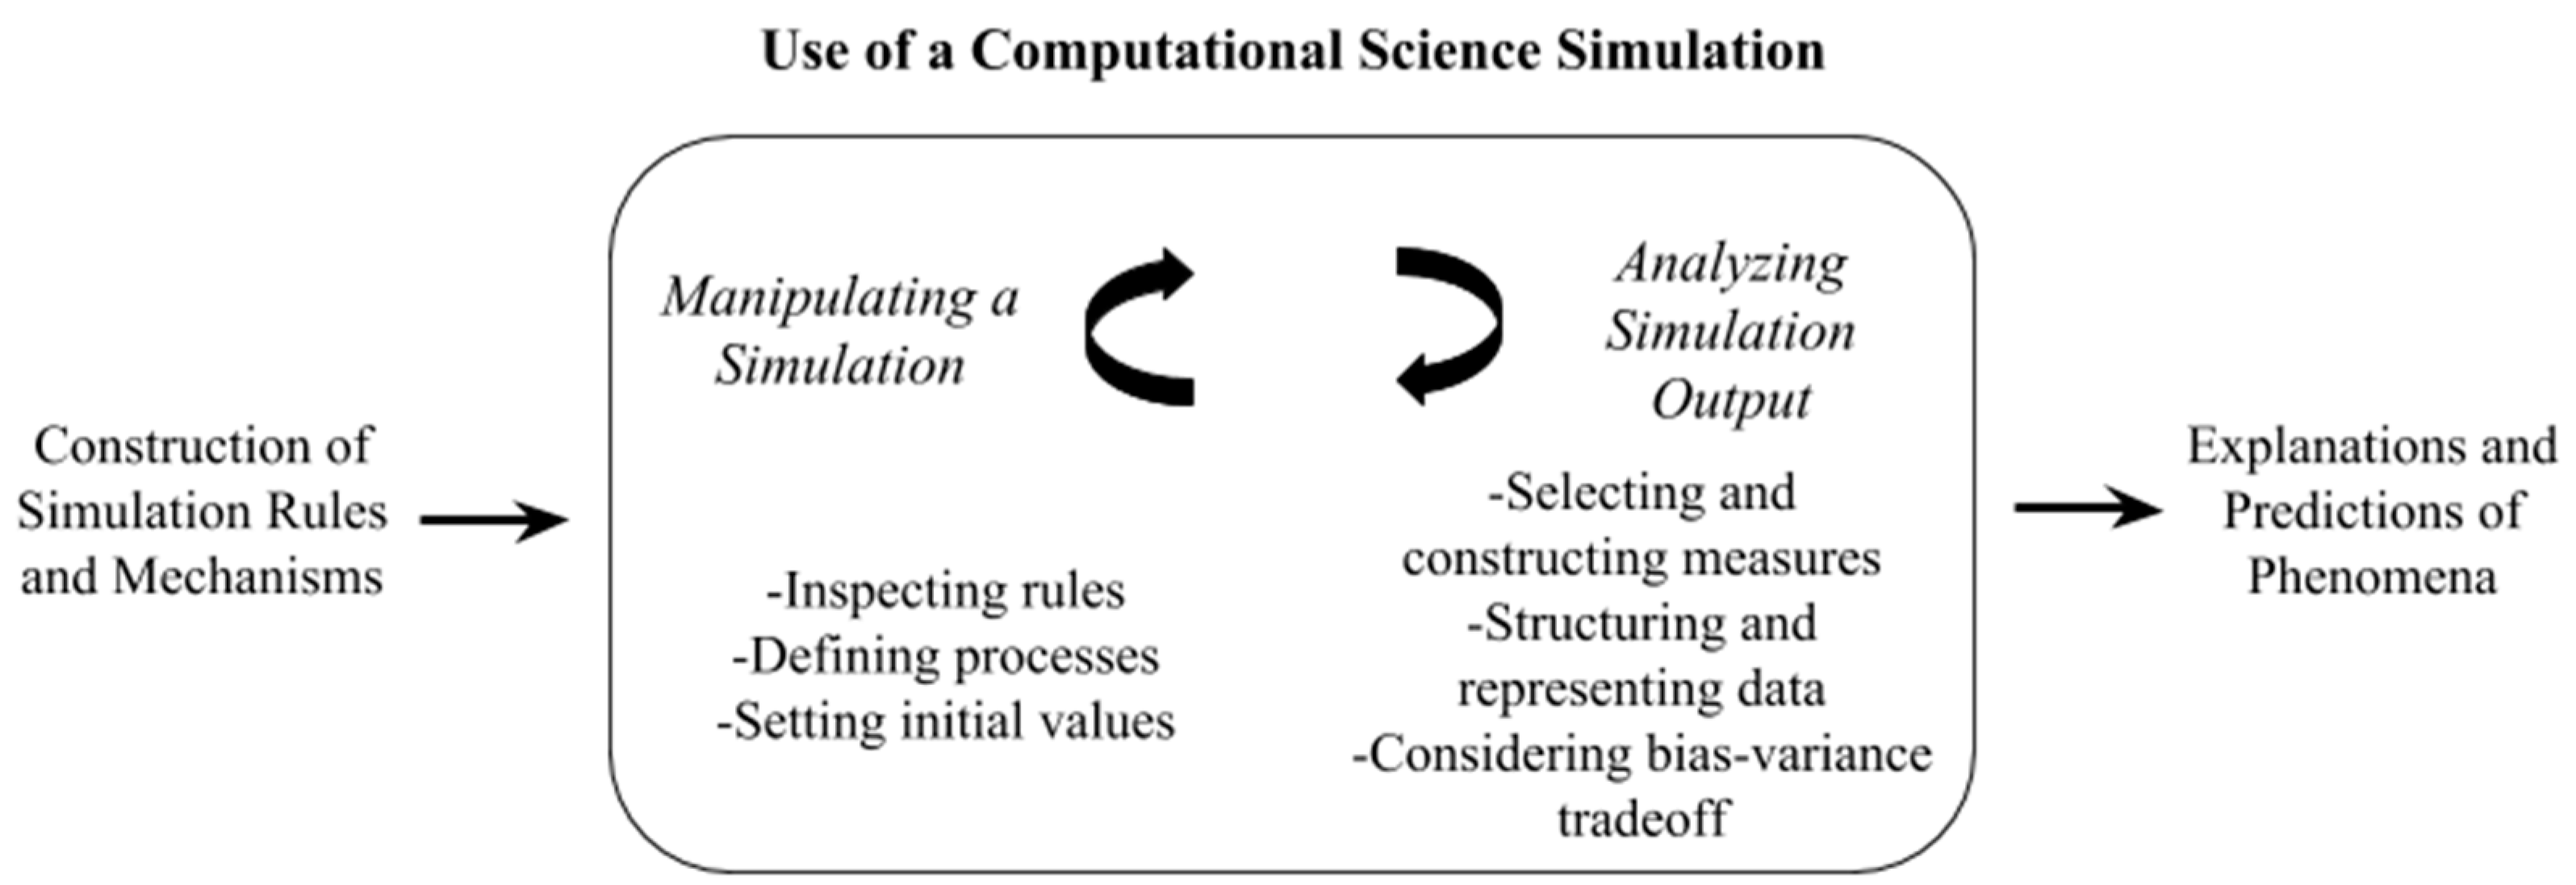
2.4. Framework for Using a Computational Science Simulation

Drawing on research on modeling and simulations, we developed a conceptual framework for the use of a computational science simulation (Figure 1) that considers simulations as being constructed using what is known about a phenomenon based on prior research, experience, and model-building principles [5,37]. To distinguish this type of simulation (that is based on physical rules and processes), we use the term computational science simulation. This model is similar to (and draws closely from) accounts of the use of simulation by practicing scientists [5,37,38]. It is also similar to accounts of the use of simulations for teaching and learning, in particular, Xiang and Passmore’s [31] framework for student’s construction use, and interpretation of agent-based models, yet differs by considering analyzing simulation output not in terms of interpreting output with respect to the world, but rather selecting and constructing measures, structuring and representing data, and considering the tradeoff between bias and variance. One way this framework is different from accounts of building simulations is its focus on the use of a simulation, rather than the construction of one. While the construction of simulation rules and mechanisms is a powerful context to learn about scientific phenomena [39], scientists often modify or use existing simulations [28], and so it may not necessarily be detrimental for students to modify or use existing simulations (instead of constructing their own).
This framework guided the design of the simulation and lesson sequence used for this study by focusing students’ use of a simulation on two processes. First, manipulating a simulation and analyzing output [38]. Manipulating a simulation is a critical component of the use of simulations not only as pedagogical tools but also for studying a target system or group of systems and consists of inspecting the rules built during construction of the simulation, defining processes, and setting initial values. Analyzing simulation output is essential because, without this component, simulations generate an abundance of raw data [5]. Analyzing output consists of selecting and constructing measures, structuring and representing data, and considering the bias (use of a simpler model that does not reflect the underlying patterns in the data) versus variance (use of a model that is fit very closely to its underlying data but may not generalize to other datasets) tradeoff for fitting statistical models. Use of simulations generates explanations and predictions about phenomena that are interpreted in light of the construction of the simulation and its use [34].

3. Research Questions

To summarize, past research has documented the potential for simulations to help students to develop their conceptual understanding of phenomena [6,19,20,22], especially when students can use simulations as a part of a complete process of investigating a phenomenon [21]. Our first aim, then, is to describe students’ conceptual understanding in order to provide information about the effectiveness of the particular lesson sequence designed for the present study. Past research on the use of simulations in online settings has shown that students report many benefits from their use [36], but this work has been carried out at the post-secondary level. Accordingly, our second aim is to understand students’ perceptions of the strengths and weaknesses of the simulation they used. Finally, research has shown that students can analyze the data that computational science simulations generate [31,32,33], though there is no research that we are aware of on using simulations in such a way in online classes. Our third aim, then, is to explore students’ involvement in a key aspect of data analysis: how students’ approach modeling variability in the data set they use. In light of these study goals, the following research questions guided this study:
  • RQ1: How do students’ explanations change over the course of three lessons that involve using a simulation and modeling its output?
  • RQ2: What do students perceive the strengths and weaknesses of using the simulation to be?
  • RQ3: How do students approach modeling the classroom data set to account for its variability?

4. Methods

4.1. Participants and Context

The setting of the study was a college-level AP Physics 2 class. This class was offered for the first time during the 2016–2017 academic year to junior and senior students through [school name blinded for review], which provides individual online classes to [state-name blinded for peer review] public school students. The school used the Blackboard Learning Management System as the platform for students’ access to the course. Students enrolled in this class were not fully-online students, but instead were taking one (or more) classes online in addition to the classes that they took at their local school.
The study participants consisted of 13 students enrolled in the course. The content of the unit was thermodynamics, in particular, the particle theory of matter and diffusion. This study occurred during the second unit of the class, with three lessons serving as a unit-long supplement to the existing instruction. In this lesson sequence, all students were, as a class, required to complete the first two lessons by a deadline. This allowed students in the class to develop a class dataset to be used in the third lesson. Institutional Review Board (IRB) approval was obtained through the [University name removed for peer review] IRB.

4.2. Simulation Design

To plan and design the simulation (and the lesson sequence), we worked closely with the instructor of the course. The instructor had extensive expertise in the science content and the use of modeling and simulations in science education. For the simulation, we used a Lab Interactive, which is described by the Concord Consortium as the integration of “both simulations running in multiple modeling engines and data collection from sensors and probes” [XX]. In addition, the simulation used in this lesson sequence was based on an underlying physics engine that is a part of the Lab Interactive platform.
Adapting and hosting the simulation was made possible by the Concord Consortium’s platform, and the process involved making a number of changes, conceptually and technically, to an existing simulation. In particular, to the existing simulation, adding quantitative output based on the underlying Physics model for the a) temperature, b) volume of the container, c) pressure, and d) making it possible to add multiple ‘smell’ molecules. The simulation can be found online (see Rosenberg, 2016) [40] and the code for the simulation and the underlying model can be found in Supplementary Materials C1 and C2.
The target conceptual understanding for students’ understanding of the particle nature of matter and diffusion was as follows: The kinetic energy of molecules is proportional to the average temperature of the molecules [41]; gas molecules with higher kinetic energy and temperature collide more frequently. Increased kinetic energy and temperature means molecules are colliding with the walls of a container with greater speed, and, a greater pressure. If the pressure of a gas is in a container that can expand and is at a high enough pressure, the volume of the container increases, and pressure decreases.

4.3. Lesson Sequence

Based on the instructor’s input, the activities were designed around the existing curriculum in one of the first units of the year-long course. The primary goal of the activities was for students to develop model-based explanations to answer the question: What affects the time it takes for a smell to travel across the room? This question was the “driving question” for the activities and drew from the goals of an existing unit from the Investigating and Questioning our World Through Science and Technology Project (IQWST; [42]). This unit was designed around questions which “provide a context to motivate and apply the science students learn” [8] (p. 639). Lessons 1 and 2 focus primarily on the ‘manipulation a simulation’ part of their use and lessons 2 and 3 focus more on ‘analyzing simulation output’ (see Figure 1 for the framework for the use of a simulation used in the present study). The following three lessons (see Supplementary Materials L1–L3) used materials that included the Lab Interactive and Google Sheets accessed through activity sheets through Blackboard.

4.3.1. Lesson 1: Tinker with the Simulation

The aim of this activity was to provide the chance for students to be introduced to the simulation and to have time to tinker with it. The phenomenon was introduced in the following way:
Think about when a classmate of yours peels an orange, or, in science class, when a yucky smell is introduced or encountered in an investigation. Classmates who are close to the source of this smell initially report its presence. Gradually, the smell makes its ways throughout the room, and everyone has sensed it. What’s going on? How exactly does smell move through the room? Can we describe these phenomena based on our prior experiences - or do we need to conduct an experiment? Can the way that smell moves through the room be represented in a graphical depiction or even a formula? Is there some “speed of smell?”
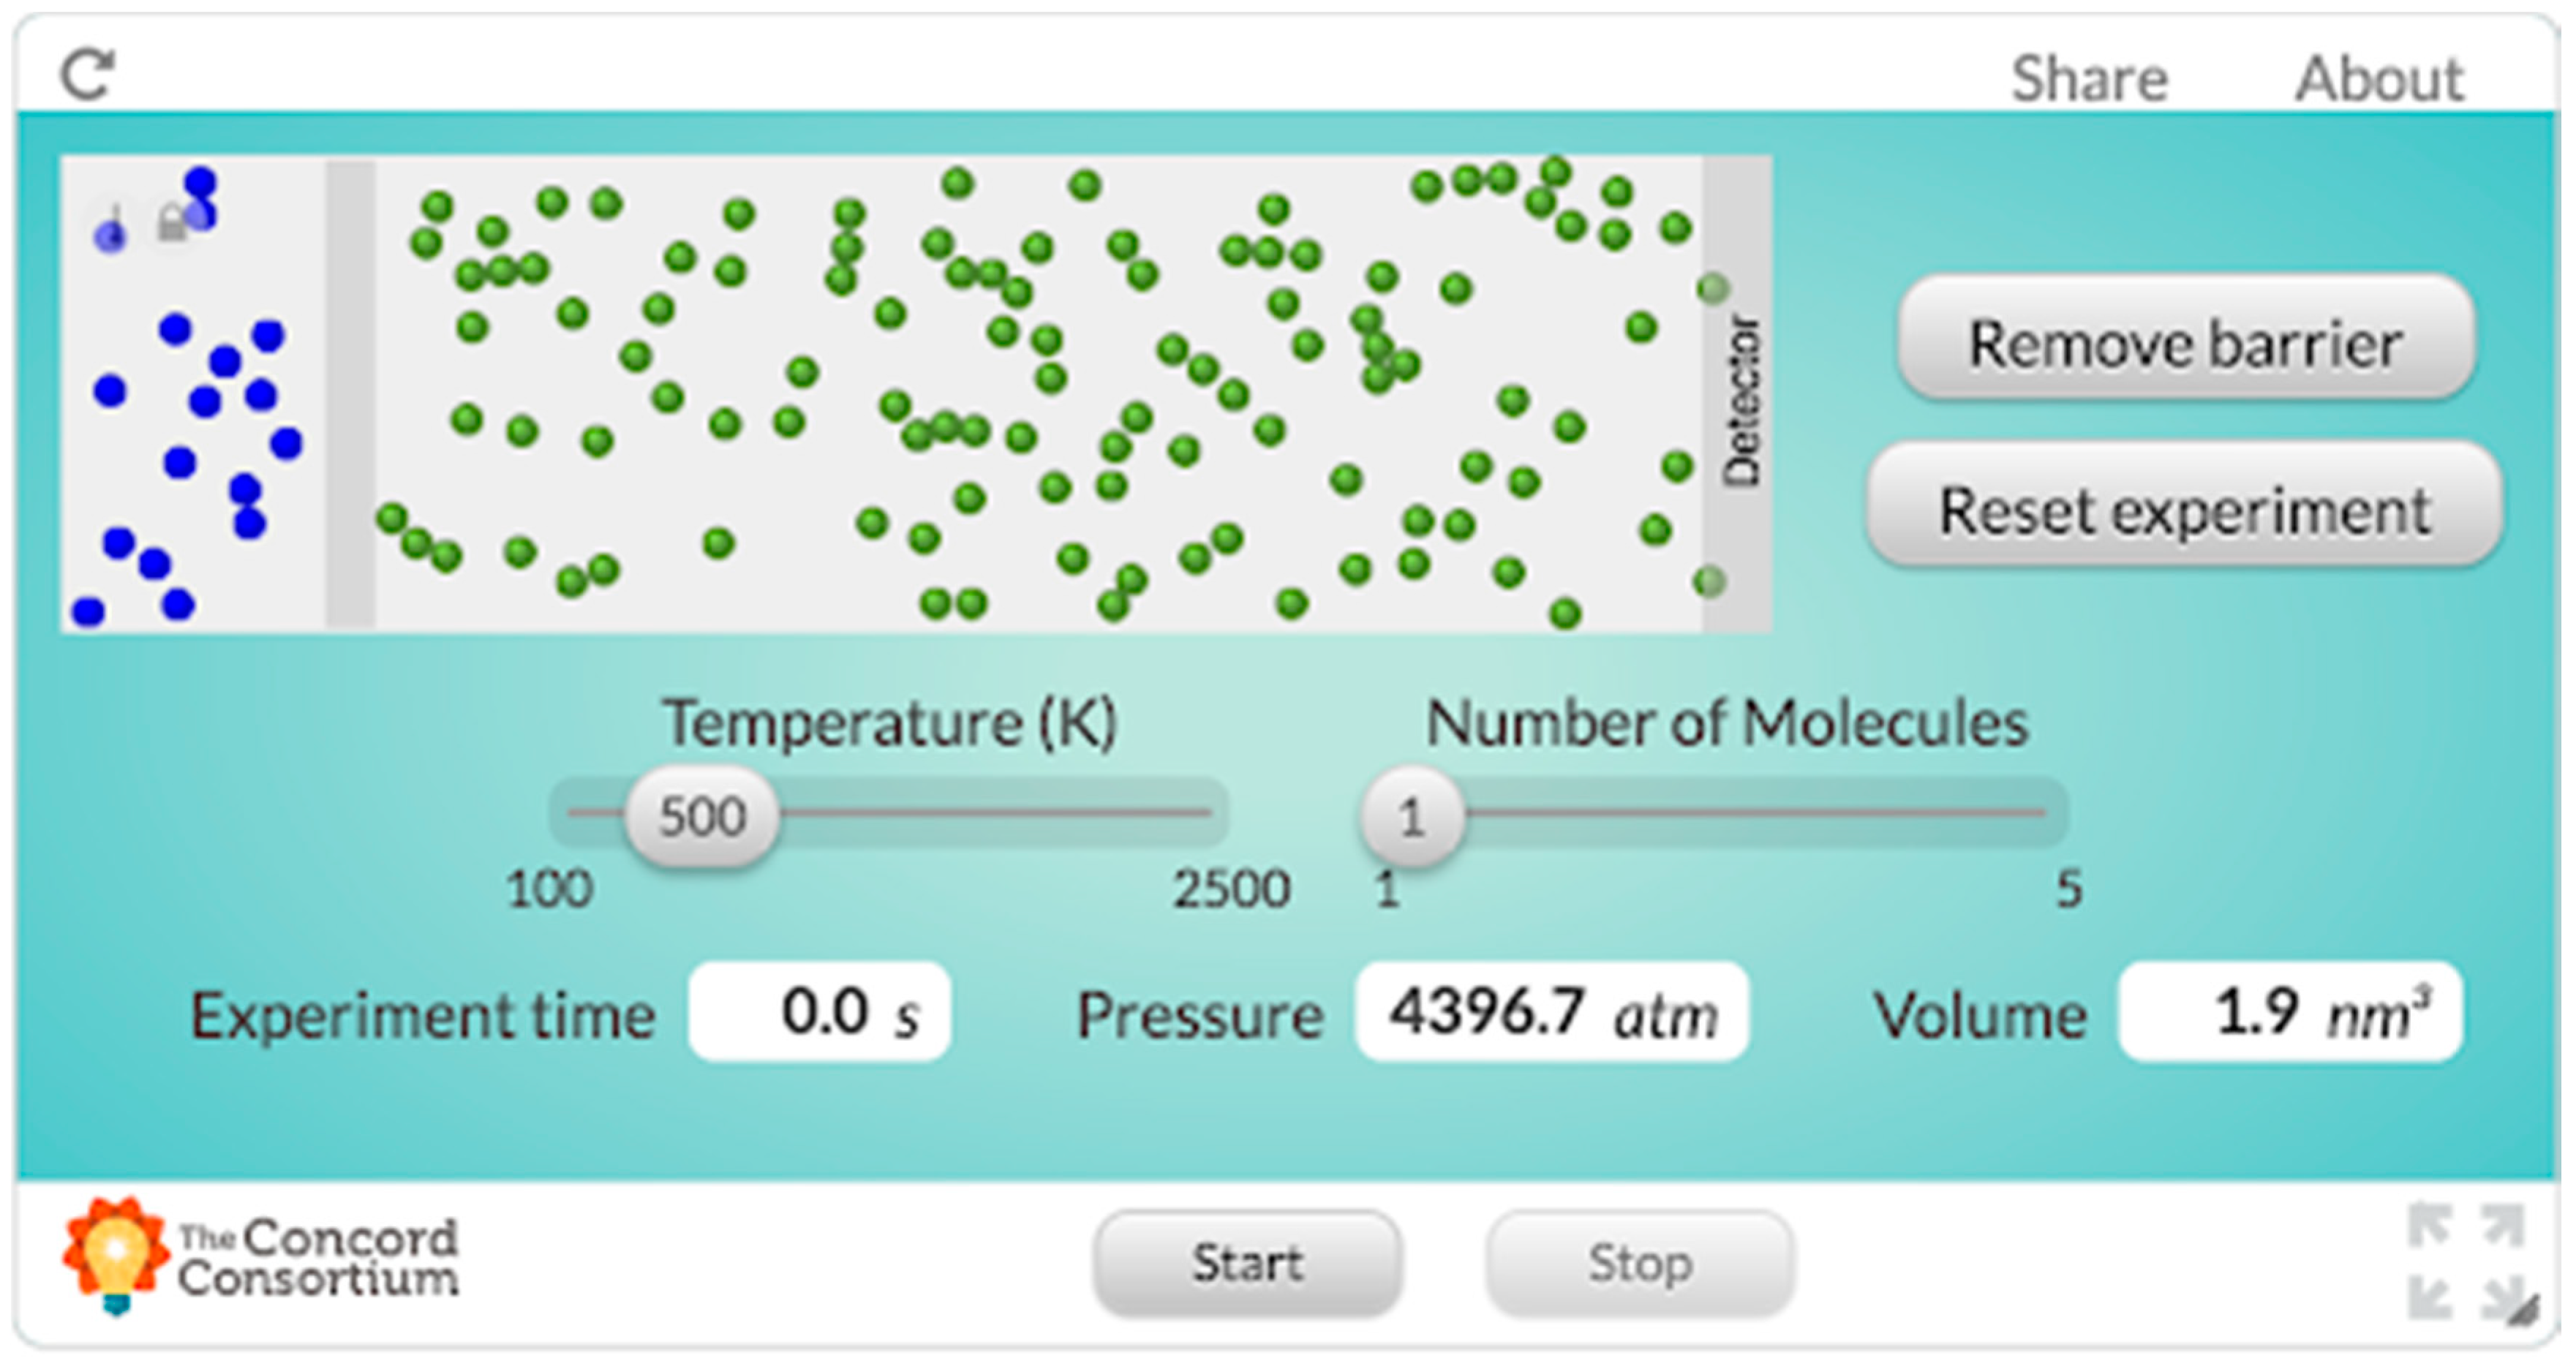
In this activity, students accessed the simulation (presented in Figure 2; see Rosenberg, 2016, [40] for a link to the simulation).
The simulation and the model it’s based on were described in the following way:
In our model, you are free to think of all molecules as solid billiard balls that can collide with each other as they move randomly in straight lines through the room. The collisions between the billiard balls are “elastic,” so the total velocity (and mass) of all of the molecules is specified to be the same throughout the simulation remains the same, as well as the total kinetic energy of all the molecules. The green billiard balls on the right represent the air molecules throughout the room, the gray wall represents the closed perfume jar, and the blue billiard balls on the left represent tiny molecules of perfume floating in the air which (when the jar is opened, and the wall is removed) will eventually make their way toward the “gas sensor” also known as your nose. All of the molecules have the same mass.
Students responded to questions that prompted them to generate ideas about what they understood about how temperature, pressure, and volume are related and what they thought would happen in the simulation both before and after tinkering with it.

4.3.2. Lesson 2: Collect Data from the Simulation

The aim of this activity was for students to generate a plan for collecting data and to collect the data for a class dataset and to prompt students to think about the underlying model rules for the simulation. The simulation was described in greater precision, as follows:
This simulation is not programmed with any gas laws or thermodynamic equations. It is simply modeling the motion of gas particles as though they were rigid billiard balls colliding with one another. Different pieces of information are available to us, from the total kinetic energy, in electron volts, to the pressure, volume, and temperature. We could use this simulation to examine the relationship between temperature and pressure. We could also examine the relationship between kinetic energy and temperature; since the volume, which here represents the volume of the container (including the volume behind the barrier); to calculate the volume, a depth 1 molecule deep is used. This simulation could be much more complex with greater depth!
Students were prompted to answer questions about how they would collect the data (what temperatures and what number of molecules needed to stop the detector they would specify and how many runs of the simulation they would carry out). After collecting the data, students were asked to share a Google Sheets file, with the sole requirement being that students collected (at a minimum) information on the temperature and experiment time.

4.3.3. Lesson 3: Generate a Model-based Explanation Using a Class Dataset

The aim of this activity was to describe the idea of a statistical (or data model) and for students to use the class dataset to generate a model of the data and a model-based explanation as an answer to the driving question. Models of the data were introduced in terms of a simple model, as follows:
Imagine you want to “model” a relationship, such as how the number of likes of your photos on your social network is related to the number of times you post each day. One way you could do this is through a “line of best fit,” or a linear model. A line of best fit is a simple but powerful model: This model is simply a straight line through a scatterplot of data. If you look at the individual data points, you may notice that some are above the line, and some are below it; overall, the distance from the line to each point above the line and the distance from the line to each point below it will equal zero; as a result, if you have data points that are way higher than the other points, or way lower, they can affect where the line is. Something we can use to determine how well a line fits is called the coefficient of determination, or R2. The closer R2 is to 1 (which means the lines fits perfectly through every point!), the better. The R2 for the line above is 0.60.
Students were asked to explore the data in any way they like, such as through calculating descriptive statistics for the data or creating figures. They were prompted to model the relationship between temperature and experiment time using a scatter-plot and a line of best fit and to generate an explanation for the relationship between the temperature and the experiment time in light of the model they selected.

4.4. Data Sources and Collection

The data sources for this project included student responses to embedded assessment questions in the lesson sequence. The embedded assessment questions appeared throughout the lesson sequence. Table 1 summarizes the linking of the embedded assessment questions with the research questions they are intended to collect data about. The data were obtained from students typed responses to the questions embedded in Google Docs that students downloaded, entered their responses into, and then submitted to the instructor of the course. Students’ responses were then transcribed into a spreadsheet (see Supplementary Materials D1 for the anonymous embedded assessment responses).

4.5. Data Analysis

Students’ responses were transcribed and analyzed between students and across time in an exploratory manner [43] to analyze the data. This focused the authors’ analysis around what parts of the activities supported students’ conceptual understanding and understanding and experience in relation to the online conceptual science simulation.
Initially, the data were coded independently by each author using structural and in vivo coding frames [44]. After initial coding, the authors met to compare and discuss the data and then develop pattern coding [44]. The pattern codes afforded the opportunity to summarize the data into a smaller number of sets and themes. Additionally, meeting to discuss coding allowed the authors to ask provocative questions each had not considered and work through various data analytic dilemmas we faced.
In the end, the meetings and two rounds of coding led to a thematic analysis of the data, where student responses were highlighted to explain the shorter codes.

5. Findings

In this section, we present findings for each of the RQs in relation to student responses to each of their respective embedded assessment questions and subsequent qualitative analysis.

5.1. Findings for RQ1: Development of Student Responses Over the Course of the Lesson Sequence

The lesson sequence was designed to support student’s progression from an intuitive to a more sophisticated understanding of the phenomenon. In our analysis of students’ responses to questions designed to elicit their conceptual understanding (see the questions associated with RQ1 in Table 1), we identified three groups of student responses: (1) Students who began with sophisticated conceptual understandings (2) students who showed improvement in sophistication, and (3) students who showed little improvement in sophistication. Representative responses for each of these groups is presented in Table 2 and the three groups are described in the remainder of the section.

5.1.1. Students Who Began with Sophisticated Conceptual Understanding

First, four of the students’ responses began and stayed sophisticated throughout the lesson sequence. This level of student response is detailed by their formal use of scientific knowledge and academic language. For instance, when first asked about the relationship between temperature and smell molecules, Student 6 responded that:
Because the temperature of a substance is proportional to its kinetic energy. Also, the kinetic energy of a substance is proportional to its mass and velocity. And velocity is what we are interested in if we want to know how quick a gas will reach another place. If the perfume has a lower temperature, the air will transfer its temperature with collisions, causing the perfume to go at a higher speed.
Additionally, Student 2 (Table 2) is an example of a student who began with what we think was a sophisticated understanding of the target phenomenon. This student wrote that the perfume moved more quickly because, “... higher temperature means that the gas particles vibrate more quickly (have more kinetic energy) so they move faster and can get across the room in less time.” Later, Student 2 develops a response that highlights an understanding of how this happens in terms of collisions between molecules and providing a more illustrative than descriptive response. Student 2 and 6 are representative of this group of students who began and continued writing responses that indicate a high level of academic language and scientific knowledge.

5.1.2. Students Who Showed Improvement in Sophistication

Two students showed some progress in developing sophisticated responses. For instance, as these students began working with the content through the lesson sequence, they also started to provide responses that indicate a more concise and clearer understanding of thermodynamics, often using mathematical functions. This is exemplified by the sequence of responses by Student 7 (Table 2). In their responses, Student 7 demonstrated growth in sophistication as intended. Initially, Student 7 wrote responses that focused on what happened: “Temperature is directly related to energy: as temperature increases, the energy of the system increases.” This response represents as a relatively simple account: higher temperature implies higher kinetic energy. The student then shifts to writing responses that indicate a level of understanding of how something happened: “Higher temperature → more energy → more collisions in a given amount of time → gets across the fixed distance faster.”

5.1.3. Students Who Showed Little Improvement in the Sophistication of Their Responses

The use or development of formal academic language with a scientific understanding was not the case for all students. Two students did not gain in their sophistication over the course of the lesson sequence and continued in the what phase of understanding. These students’ responses stayed descriptive, focusing on the what of the question at hand rather than the how and why (e.g., Student 8 in Table 2).

5.2. Findings for RQ2: Strengths and Weaknesses of the Computational Science Simulation

The students indicated the benefits of using the simulation and their data models that were created as a product of the simulation. A common response from students was that the simulation made a complex phenomenon more accessible in an online learning environment. As Student 2 wrote, “The major benefit of this model is that it is easy to see what is going on and to understand how the molecules propagate through the room.” However, this benefit was not without some cost. Among some others, Student 1 indicated that the model could over-simplify complex concepts and miss providing an authentic representation of what is happening. Other students also hinted at this by hoping for more “realistic” representations, while some still enjoyed having to take the simulation and map it to the world around them.
Another benefit students described went beyond simplifying a complex phenomenon to being able to use the simulation to make predictions. For example, Student 3 wrote “This model of gas makes it much easier to calculate and make predictions on how the gas will behave. By making all collisions elastic and having all particles being the same mass, it is much easier to calculate the resulting velocities of collisions between gas particles.” This idea suggests that some students experienced the computational science simulation as a tool that could be used, much like physical experimental tools, to generate data that can be used to understand a real-world phenomenon. In contrast, Student 2 wrote that the model, “isn’t accurate for real life [sic] gas behavior and can’t be used to directly model how the world really works.” Student 7 echoed this comment by noting that, “this model does not give any definite numbers, meaning the accuracy of the diagram may not be as reliable as needed in a science experiment.”
Finally, students saw the data they were able to generate as a benefit of the simulation. As Student 8 indicates, “I can have quantitative data to provide the speed of the molecules… [and] if I were to put the data points on a graph, I could analyze its relationship.” Other students reported that the data were helpful because their mathematical nature is precise, while others described the importance of being able to graph the data and to interpret the graph to understand better what the simulation represented.

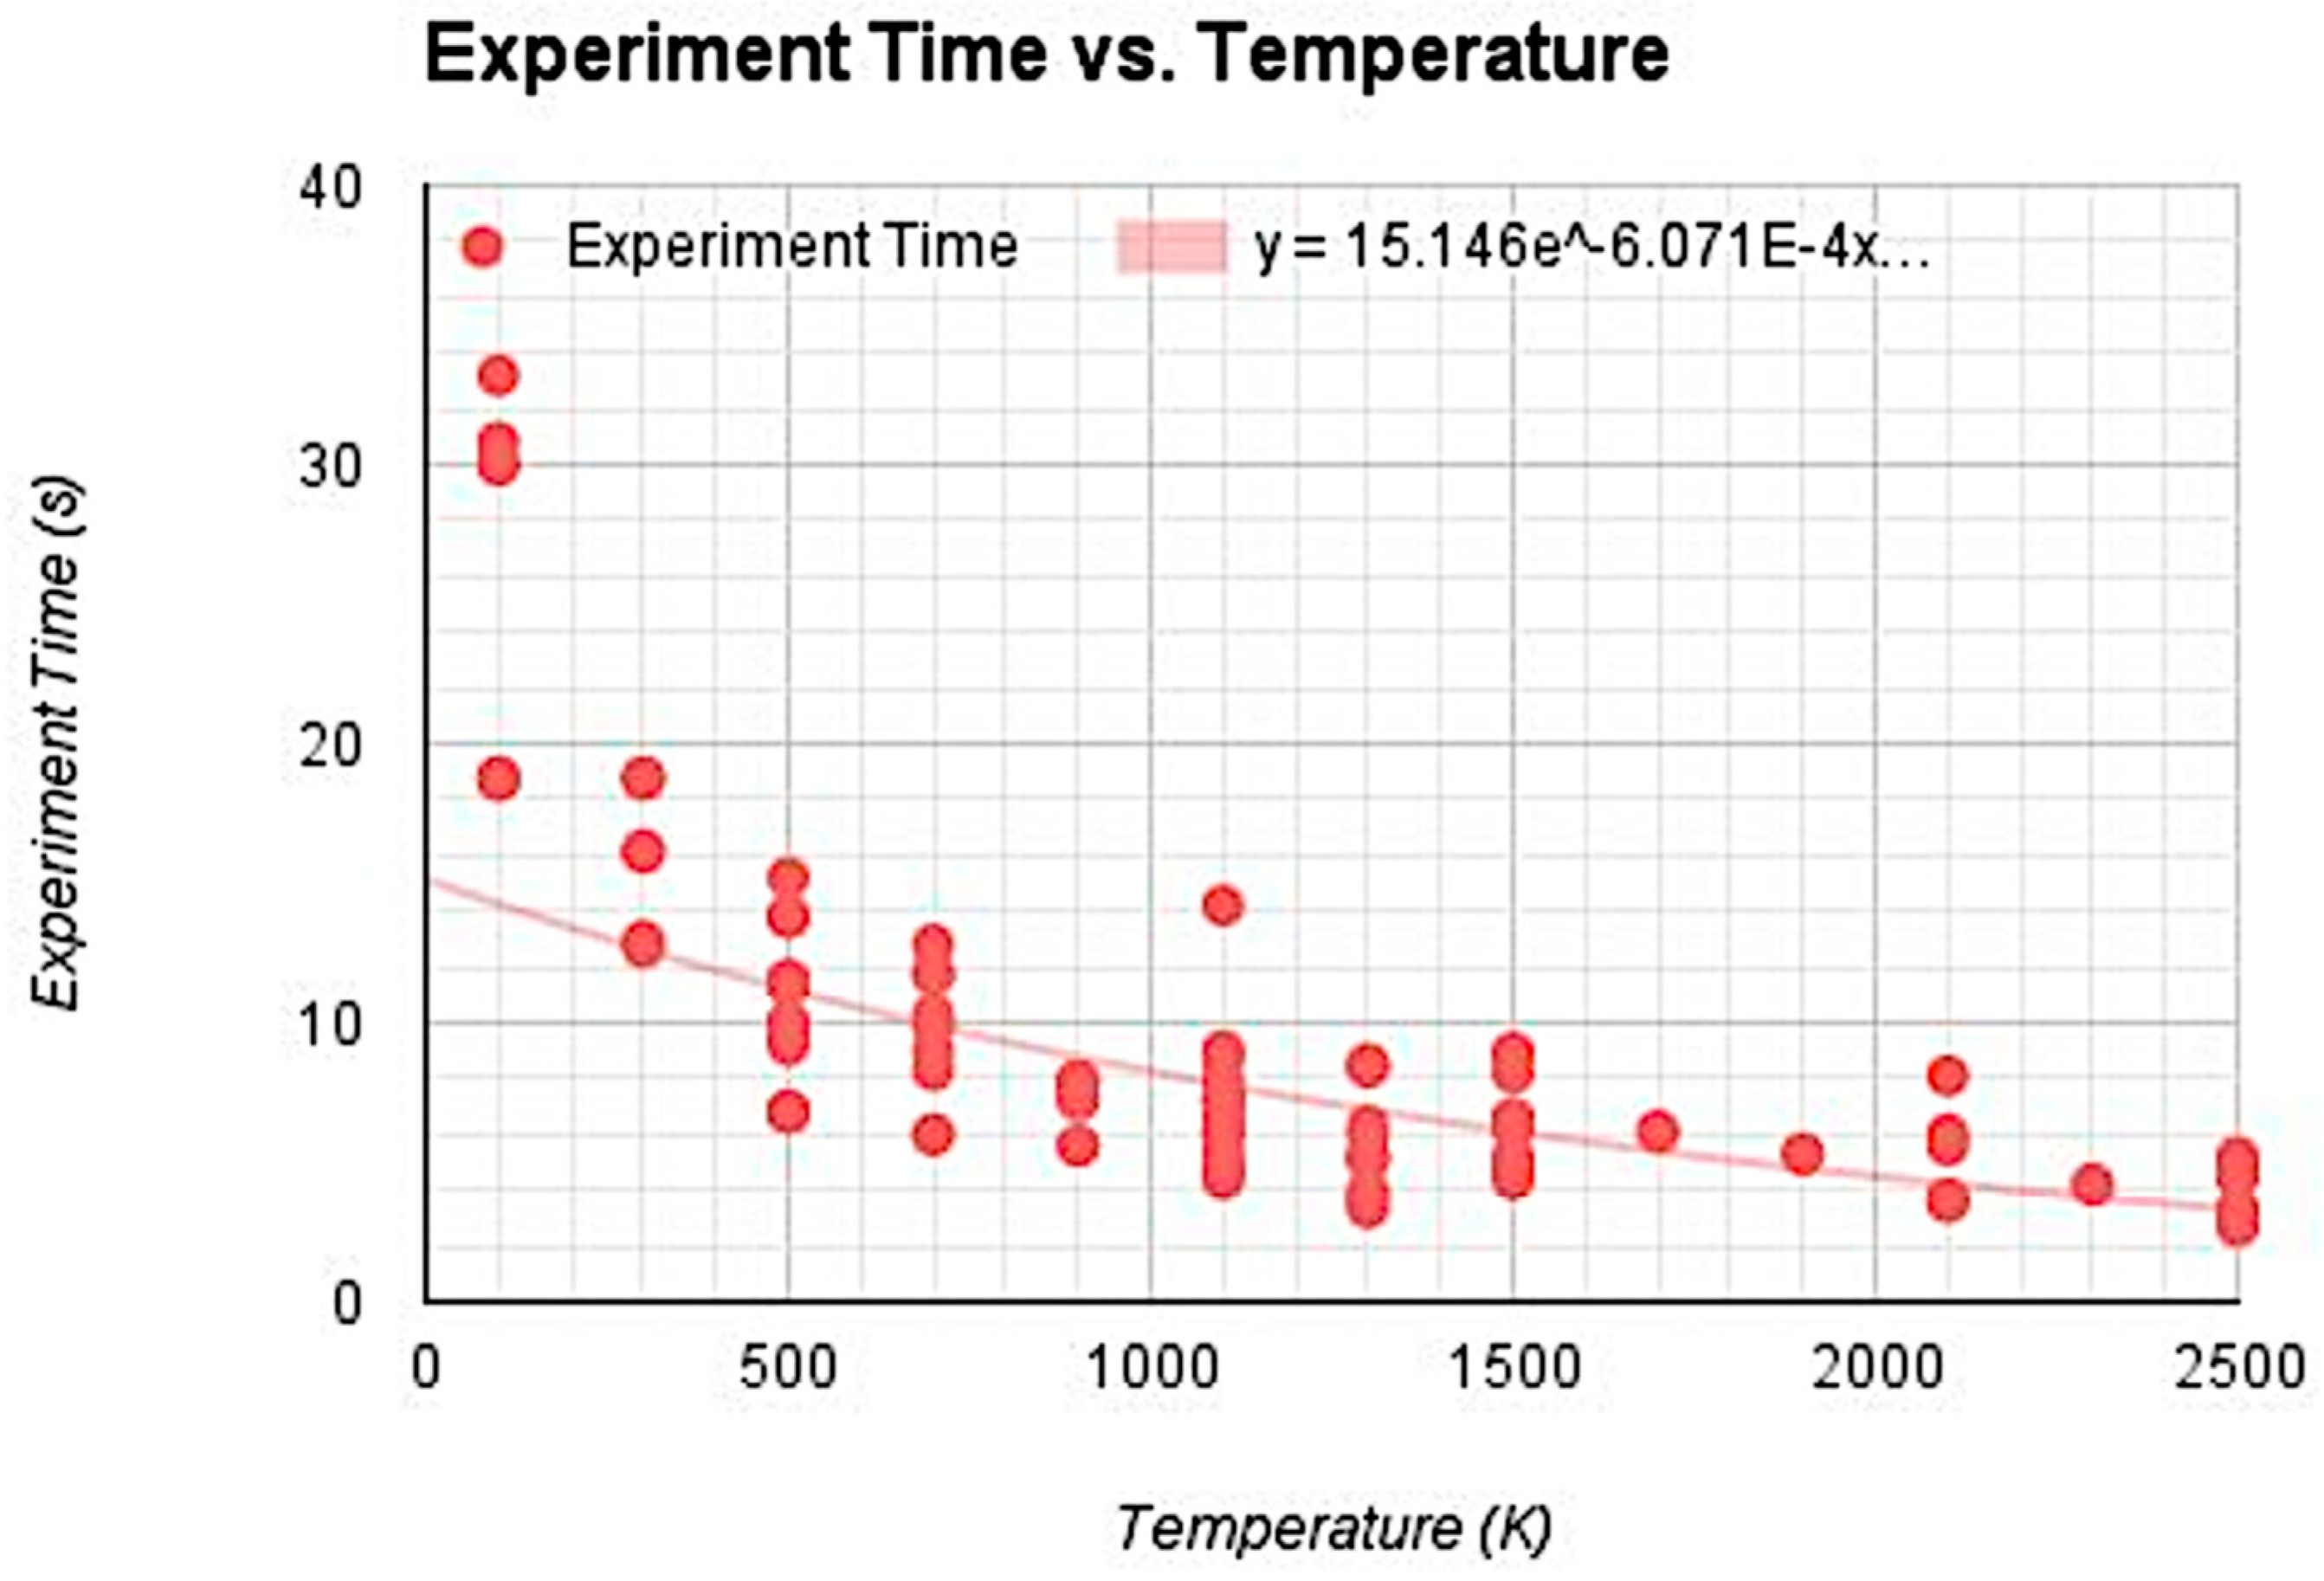
5.3. Findings for RQ3: How Students Approached Modeling the Data to Account for its Variability

Overall, students struggled with combining the principles of modeling with their understanding of statistical rules. This was noteworthy in how students approached modeling the classroom data set while accounting for variability, where we often found students relying on the strict definition of r-squared in relation to function fitting, consistently attempting to fit the data maximally. For example, Student 2 responded by saying, “I selected this model to show the line of best fit since it was closest to one on R2. I used the 6th degree of the polynomial function, this is the most accurate for the scatter plot since a polynomial of the 6th degree is more ‘flexible’ than other functions.”
However, other students showed an understanding that balanced the concept of over- and under-fitting models to data. Student 2 provides an example of a more flexible understanding of the principles of modeling data. They wrote:
I used this 4th power polynomial function because it had a much higher R2 value than the linear, exponential, and lower degree functions. Though some of the higher degree functions had better R2 values, it only increased from 0.809 to 0.815 which is pretty insignificant. Any degree function lower than 4 and the R2 values began to drop significantly, close to around 0.7 and below. Having a polynomial function with a higher degree of 4 makes it really laborious to manipulate and use to predict values.
This response indicates that the student balanced between modeling as much of the variability as possible (using a 4th-degree polynomial function), but still considered the practicality of their model in terms of being able to make meaningful predictions about phenomena (either phenomena represented within the simulation or the wider world outside of the simulation). Student 8 demonstrated through the creation of their model (see Figure 3) a similar consideration between modeling the variability in the data and choosing a model that was interpretable in light of the data.
This student reported that they selected their model on the basis of both the R2 value relative to other candidate models and how well it visually fit the data. This student wrote, “I chose the exponential function because it had the second closest R2,” explaining, “I didn’t choose the first highest, the polynomial function, because the trend line started dipping up in the end and the data points didn’t follow the trend.”

6. Discussion

In this study, we sought to understand how students in online science classes can take up the use of a simulation to develop their conceptual understanding of a phenomena and to serve as a context for analyzing a complex, quantitative source of data. Drawing upon past research on the impacts of students’ use of simulations, their use in (post-secondary) online settings, and working with data in the context of simulations, we sought to understand how students’ conceptual understanding developed, what they perceived to be the affordances and constraints of the simulation, and how they approached modeling variability as a key aspect of working with data.
The data collected indicated that the lesson sequence could serve as a starting point for affording opportunities for students to explore the mechanism and develop topic related knowledge about thermodynamics. While two students did not develop in their conceptual understanding, and four students began the activity with what we interpreted as an already-sophisticated understanding of the particle nature of matter and how it applies to diffusion, we noted two students whose explanations became more sophisticated over the course of the lesson sequence. For one student, this progression took the form of an explanation which initially described what was happening with respect to the phenomenon, and then later explained how the phenomenon worked. This progression could be interpreted in terms of the students’ response becoming more mechanistic. Mechanism is an idea from science—and the philosophy of science—that contends that phenomena can be explained in terms of physical interactions (however complex) between physical matter [45]. Russ, Scherr, and Hammer [46] advanced an influential framework for understanding how mechanistic students’ discourse is. Other scholars have used—or adapted—this framework for understanding interview data [47] as well as for embedded assessment data [3,47] in science education.
More mechanistic explanations move from descriptive to causal accounts that include details about how and why a phenomenon behaves the way it does [3]. While we can begin to interpret how students’ understanding may have changed over the lesson sequence in terms of mechanistic reasoning, past research suggests that while students showed improvements, their response could be even more sophisticated. For example, student 7 explained how higher temperatures led to higher energy and therefore molecules crossing the container more quickly; additional opportunities for students to consider why higher energy molecules move more quickly.
Findings with respect to the strengths and weaknesses of simulations speak to this goal and add to the research base on the use of simulations in online classes and virtual laboratories. Of note is that the students’ perceptions of the strengths of simulations aligned with Rowe et al.’s [36] survey results, indicating that students found the simulations to ease access to scientific ideas. We believe that by designing opportunities to initially “tinker” with the simulation, before adding formal structure around its use, allowed students to make sense of the ideas gradually and supported their “ease” of understanding.
With respect to work with data, we found that students were able to effectively use a class data set in a data model—one that contained more observations and variability than the data any one student collected on their own. This activity, and particularly students’ choices with respect to how simple or complex a data model to fit, elicited different student work and provided insight to how well students understand not only the scientific ideas but the underlying mathematical principles. Some students chose to explain the maximal amount of variability (leading to a model that was hard to interpret), whereas others balanced how well the model fit with their capability to use the model to explain the relationship between temperature and time. We think these findings are notable as some of the first to begin to explore the sophistication of the models that K-12 students generate in both mathematics and science courses. Past research has shown that opportunities to model phenomena with complex, highly-variable data is educationally valuable [48,49]. These findings suggest that when it is possible for students to use more complex models that they are given guidance on considering how complex their model should be. This consideration is important because, by their nature, models and simulations simplify the phenomena and students’ responses about their strengths and weaknesses generally reflect this while also noting that models can diminish the complexity of the world. However, not having a teacher present when the student is working on the simulation, or the ability to work with a peer, limits our chance to facilitate and guide student thinking about data modeling in-the-moment. Thus, this study highlights that there is a tradeoff between modeling the data students generate between two or more variables and exposing students to the actual work carried out by STEM professionals.

6.1. Limitations

We anticipated some of the challenges in taking an idea of a computational science simulation to an online environment but did not anticipate the challenges of doing so for the first time and working with a class of students. For instance, the virtual school that we worked with took their charter to teach students very seriously and were cautious about turning their online classes into research sites if doing so had any detrimental effects on student learning. Thus, we found that an initial limitation to the study was cooperative buy-in from the site and research team. However, as the relationship was cultivated mutual agendas were being met.
There were not many students in the class—even though the class was offered by a state-wide provider serving many students. Because of this, the findings should be considered with the small number of students (and the qualitative data and analysis) that they were based on. We suggest that scholars interpret these findings as one step toward understanding how students use simulations in online science classes—a context that may grow in importance, but, apart from Rowe et al.’s [36] investigation at the post-secondary level, is one that has not yet been an emphasis of past research.
Relatedly, we note that the measures used to collect data were not as strong as we would have liked. We analyzed students’ embedded assessment responses—around a half-dozen per student at each time point—using qualitative methods. Other data sources would help us to gain more insight about students’ use of the simulation and what they learned from using it. Part of the challenge of collecting other data sources is due to the fact that obtaining parental consent for data-rich interviews was discouraged by the stakeholders at the research site. Instead, together with the stakeholders, we decided to modify an existing unit with the permission of the instructor of the course and the administration—and to primarily use data from embedded assessments with our Institutional Review Board and the virtual school agreeing for us to use an informed consent agreement given the anonymous nature of the data and the minimal risk involved in using students’ responses. This made it a challenge to say more about, for example, students’ understanding of the mechanism underlying particle nature of matter and the process of diffusion. This is one of the challenges of doing research in online courses: other scholars have also found that despite the promise of doing research in online classes, it is also hard—especially in public schools.

6.2. Recommendations for Future Research

First, we recommend that science education researchers consider the use of simulations in fully-online classes. Such classes present both opportunities and challenges in terms of engaging students in the types of scientific and engineering practices called for in recent reform efforts. While this study was an initial attempt at expanding the way in which simulations are used, more research and development in the online setting is needed in order to ensure that students in these classes have access to high-quality activities.
With respect to the use of simulations in particular, we defined the use of a simulation as manipulating a simulation and analyzing simulation output. While students did not themselves construct the rules comprising the simulation, opportunities for learners to reflect on them may help them to understand how they compare to how they might think to construct a simulation [14]. Therefore, we suggest that future research explore how learners see and understand model rules may support understanding phenomena in terms of individual-level molecular behaviors.
More generally, we recommend that researchers, instructional designers, and teachers consider tools for analyzing data that are seamless—or easily connected to—the simulation used. We chose to use Google Sheets because students were familiar with it; however, the Lab Interactive simulation we designed integrates with the Common Online Data Analysis Platform (CODAP), a tool for learners to analyze data. In particular, for Lab Interactives, data can stream directly from the simulation into data tables—which can then be plotted. This presents a potentially powerful context for reasoning about how the simulation creates data, which can then be represented through figures. The decision to use Google Sheets made it possible for students to quickly begin to work with the data and to choose not to use a tool which students might only use for one lesson sequence is understandable. In any case, using tools more sophisticated than Google Sheets—such as CODAP—may have had some benefits to learners. Moreover, the use of tools that allow students to collaborate around collecting and analyzing data may be especially useful in online classes.
Advanced students such as those involved in this study may be able to move from “what” mechanistic accounts to “how and why” accounts quickly; or, they may already possess sophisticated accounts. We suggest that scholars continue to examine how students who are not already interested in a discipline—like many of the students in this study—because of the potential for simulations to motivate students to learn. Games with science content (and scientific practices) embedded within them may be especially motivating for students who may not think of themselves as being interested in science [6].
Finally, we recommend that scholars explore how tools other than simulations might support engaging students in scientific and engineering practices in online classes. To engage students in working with data, how students can use, for example, virtual reality tools to observe phenomena [48,49] How such tools are used to support not only making observations but also as a context to create and to even model data, may support students’ ability to think of and with data.

6.3. Implications for Practice

First, we see the use of larger, even “messy” sources of data as having benefits to students’ learning. While it is important to weigh the benefits for students of the use of more complex data with how practical it is to collect and model these sources of data, it may be important for students to make decisions about how to model the type of data encountered in advanced coursework (and many occupations).
In terms of working with data, we suggest that instructional designers and teachers use a combination of general (i.e., Google Sheets) and specialized (i.e., the Common Online Data Analysis Platform) tools when appropriate to engage students in modeling data from simulations. Tools that are specially-designed as educational tools for data analysis, such as the Common Online Data Analysis Platform (CODAP), can connect directly to sources of data (such as the Lab Interactive simulation we used) and make it even more intuitive for students to model and create graphs from data.
Finally, when simulations are used, we point out that having students “tinker” with them first may have benefits. While “tinkering” or playing with a science simulation takes time, these opportunities can provide students with a chance to start to generate ideas about how the simulation works. Many times, students set the simulation to its limits (i.e., to the lowest or highest temperature for the simulation we used) to “break it.” However, this can (potentially) support students’ effort to understand how well the simulation corresponds to the real-world in both every day and extreme situations.

7. Conclusions

Being able to think of and with data is a powerful capability, not only in science but also in other areas of study and many occupations. We view student work with data, particularly collecting and modeling data, as a means to connect many of the scientific and engineering practices described in recent curriculum reform efforts. Taken together, the findings from this study suggest that the lesson sequence had educational value, but that modifications to the design of the simulation and lesson sequence and to the technologies used could enhance its impact. As students increasingly learn science and explore science topics in online and other technology-supported contexts, we expect that science educators will increasingly bring ambitious learning activities to online classes—and may, in the future, even create activities in online classes that they choose to bring to face-to-face classes, too.

Supplementary Materials

The following are available online at https://www.mdpi.com/2227-7102/9/1/49/s1, File L1: Lesson One; File L2: Lesson 2; File L3: Lesson 3; File C1: Simulation Code; File C2: Model Code; Data F1: Embedded Assessment Responses.

Author Contributions

Each co-author takes equal responsibility for the following aspects of research and manuscript preparation: Conceptualization, methodology, validation, formal analysis, investigation, resources, writing—original draft preparation, writing—review and editing, visualization. Author 1 takes credit for the following aspects of the research and manuscript preparation: Funding acquisition, project administration, data collection.

Funding

This research received funding from the Michigan State University Research Expenses Fellowship and the Michigan Virtual Learning Research Institute Dissertation Fellowship.

Acknowledgments

We would like to acknowledge Daniel Damelin (Concord Consortium) and collaborating teacher and participating students at Michigan Virtual School.

Conflicts of Interest

The authors declare no conflict of interest. The funding agencies had no role in the design of the study; in the collection, analyses, or interpretation of data; in the writing of the manuscript, or in the decision to publish the results.

References

  1. NGSS Lead States. Next Generation Science Standards: For States, by States; National Academies Press: Washington, DC, USA, 2013. [Google Scholar]
  2. Common Core State Standards Initiative. Common Core State Standards for Mathematics; National Governors Association Center for Best Practices and the Council of Chief State School Officers: Washington, DC, USA, 2010. [Google Scholar]
  3. Berland, L.K.; Schwarz, C.V.; Krist, C.; Kenyon, L.; Lo, A.S.; Reiser, B. Epistemologies in practice: Making scientific practices meaningful for students. J. Res. Sci. Teach. 2016, 53, 1082–1112. [Google Scholar] [CrossRef]
  4. Lehrer, R.; Schauble, L. The development of scientific thinking. Handb. Child Psychol. Dev. Sci. 2015, 2, 671–714. [Google Scholar]
  5. Weisberg, M. Simulation and Similarity: Using Models to Understand the World; Oxford University Press: Oxford, UK, 2012. [Google Scholar]
  6. Honey, M.A.; Hilton, M. (Eds.) Learning Science Through Computer Games and Simulations; The National Academies Press: Washington, DC, USA, 2011. [Google Scholar]
  7. National Research Council. A Framework for K-12 Science Education: Practices, Crosscutting Concepts, and Core Ideas; The National Academies Press: Washington, DC, USA, 2012. [Google Scholar]
  8. Schwarz, C.V.; Reiser, B.J.; Davis, E.A.; Kenyon, L.; Achér, A.; Fortus, D.; Shwartz, Y.; Hug, B.; Krajcik, J. Developing a learning progression for scientific modeling: Making scientific modeling accessible and meaningful for learners. J. Res. Sci. Teach. 2009, 46, 632–654. [Google Scholar] [CrossRef] [Green Version]
  9. Stewart, J.; Cartier, J.L.; Passmore, C.M. Developing understanding through model-based inquiry. In How Students Learn: Science in the Classroom; Donovan, M., Bransford, J., Eds.; The National Academies Press: Washington, DC, USA, 2005; pp. 515–565. [Google Scholar]
  10. Clark, D.B. Longitudinal conceptual change in students’ understanding of thermal equilibrium: An examination of the process of conceptual restructuring. Cogn. Instr. 2006, 24, 467–563. [Google Scholar] [CrossRef]
  11. Jacobson, M.J.; Taylow, C.; Richards, D.; Lai, P. Computational scientific inquiry with virtual worlds and agent-based models: New ways of doing science to learn science. Interact. Learn. Environ. 2015, 24, 2080–2108. [Google Scholar] [CrossRef]
  12. Roschelle, J.; Kaput, J.; Stroup, W. SimCalc: Accelerating students’ engagement with the mathematics of change. In Educational Technology and Mathematics and Science for the 21st Century; Jacobson, M., Kozma, R., Eds.; Erlbaum: Mahwah, NJ, USA, 2000; pp. 470–475. [Google Scholar]
  13. Smetana, L.K.; Bell, R.L. Computer simulations to support science instruction and learning: A critical review of the literature. Int. J. Sci. Educ. 2012, 34, 1337–1370. [Google Scholar] [CrossRef]
  14. White, B.Y. ThinkerTools: Causal models, conceptual change, and science education. Cogn. Instr. 1993, 10, 1–100. [Google Scholar] [CrossRef]
  15. White, B.Y.; Frederiksen, J.R. Inquiry, modeling, and metacognition: Making science accessible to all students. Cogn. Instr. 1998, 16, 3–118. [Google Scholar] [CrossRef]
  16. White, B.Y.; Schwarz, C.V. Alternative approaches to using modeling and simulation tools for teaching science. In Modeling and Simulation in Science and Mathematics Education; Feurzeig, W., Roberts, N., Eds.; Springer: New York, NY, USA, 1999; pp. 226–256. [Google Scholar]
  17. Schwartz, C.V.; White, B.Y. Metamodeling knowledge: Developing students’ understanding of scientific modeling. Cogn. Instr. 2005, 23, 165–205. [Google Scholar] [CrossRef]
  18. Wieman, C.E.; Adams, W.K.; Perkins, K.K. PhET: Simulations that enhance learning. Science 2008, 322, 682–683. [Google Scholar] [CrossRef] [PubMed]
  19. Brinson, J.R. Learning outcome achievement in non-traditional (virtual and remote) versus traditional (hands-on) laboratories: A review of the empirical research. Comput. Educ. 2015, 87, 218–237. [Google Scholar] [CrossRef]
  20. Fan, X.; Geelan, D.R. Enhancing students’ scientific literacy in science education using interactive simulations: A critical literature review. J. Comput. Math. Sci. Teach. 2013, 32, 125–171. [Google Scholar]
  21. Fan, X.; Geelan, D.; Gillies, R. Evaluating a novel instructional sequence for conceptual change in physics using interactive simulations. Educ. Sci. 2018, 8, 29. [Google Scholar] [CrossRef]
  22. Geelan, D.R.; Fan, X. Teachers using interactive simulations to scaffold inquiry instruction in physical science education. In Science Teachers Use of Visual Representations; Eilam, B., Gilbert, J., Eds.; Springer International Publishing: Basel, Switzerland, 2014; pp. 249–270. [Google Scholar]
  23. Schwarz, C.V.; Gwekwewere, Y.N. Using a guided inquiry and modeling instructional framework (EIMA) to support preservice K-8 science teaching. Sci. Educ. 2005, 91, 158–186. [Google Scholar] [CrossRef]
  24. Wilensky, U.; Resnick, M. Thinking in levels: A dynamic systems approach to making sense of the world. J. Sci. Educ. Technol. 1999, 8, 3–19. [Google Scholar] [CrossRef]
  25. Cholmsky, P. Why GIZMOS Work: Empirical Evidence for the Instructional Effectiveness of Explore Learning’s Interactive Content. 2003. Available online: https://www.explorelearning.com/View/downloads/WhyGizmosWork.pdf (accessed on 31 January 2019).
  26. Damelin, D.; Krajcik, J.; McIntyre, C.; Bielik, T. Students making systems models: An accessible approach. Sci. Scope 2017, 40, 78–82. [Google Scholar] [CrossRef]
  27. Lee, V.R.; Wilkerson, M. Data Use by Middle and Secondary Students in the Digital Age: A Status Report and Future Prospects; National Academies of Sciences, Engineering, and Medicine, Board on Science Education, Committee on Science Investigations and Engineering Design for Grades 6–12: Washington, DC, USA, 2018. [Google Scholar]
  28. Winsberg, E. Science in the Age of Computer Simulation; University of Chicago Press: Chicago, IL, USA, 2010. [Google Scholar]
  29. Lehrer, R.; Schauble, L. Modeling natural variation through distribution. Am. Educ. Res. J. 2004, 41, 635–679. [Google Scholar] [CrossRef]
  30. Petrosino, A.J.; Lehrer, R.; Schauble, L. Structuring error and experimental variation as distribution in the fourth grade. Math. Think. Learn. 2003, 5, 131–156. [Google Scholar] [CrossRef]
  31. Xiang, L.; Passmore, C. A framework for model-based inquiry through agent-based programming. J. Sci. Educ. Technol. 2015, 24, 311–329. [Google Scholar] [CrossRef]
  32. Dickes, A.C.; Sengupta, P.; Farris, A.V.; Basu, S. Development of mechanistic reasoning and multilevel explanations of ecology in third grade using agent-based models. Sci. Educ. 2016, 100, 734–776. [Google Scholar] [CrossRef]
  33. Wilkerson-Jerde, M.H.; Wilensky, U.J. Patterns, probabilities, and people: Making sense of quantitative change in complex systems. J. Learn. Sci. 2015, 24, 204–251. [Google Scholar] [CrossRef]
  34. Wilensky, U.; Reisman, K. Thinking like a wolf, a sheep, or a firefly: Learning biology through constructing and testing computational theories: An embodied modeling approach. Cogn. Instr. 2006, 24, 171–209. [Google Scholar] [CrossRef]
  35. Potkonjak, V.; Gardner, M.; Callaghan, V.; Mattila, P.; Guetl, C.; Petrović, V.M.; Jovanovic, K. Virtual laboratories for education in science, technology, engineering: A review. Comput. Educ. 2016, 95, 309–327. [Google Scholar] [CrossRef]
  36. Rowe, R.J.; Koban, L.; Davidoff, A.J.; Thompson, K.H. Efficacy of online laboratory science courses. J. Form. Des. Learn. 2017, 2, 56–67. [Google Scholar] [CrossRef]
  37. Winsberg, E. Values and uncertainties in the predictions of global climate models. Kennedy Inst. Ethics J. 2012, 22, 111–137. [Google Scholar] [CrossRef] [PubMed]
  38. Morrison, J.; Roth McDuffie, A.; French, B. Identifying key components of teaching and learning in a STEM school. Sch. Sci. Math. 2015, 115, 244–255. [Google Scholar] [CrossRef]
  39. Wilensky, U.; Jacobson, M.J. Complex systems and the learning sciences. In The Learning Sciences; Sawyer, R.K., Ed.; Cambridge University Press: Cambridge, UK, 2014; pp. 319–338. [Google Scholar]
  40. Rosenberg, J.M. Diffusion & Temperature—AP Physics 2 (MVS) [Lab Interactive Simulation]. Available online: http://lab.concord.org/interactives.html#interactives/external-projects/msu/temperature-diffusion.json (accessed on 31 January 2019).
  41. Shankar, R. Fundamentals of Physics: Mechanics, Relativity, and Thermodynamics; Yale University Press: New Haven, CT, USA, 2014. [Google Scholar]
  42. Shwartz, Y.; Weizman, A.; Fortus, D.; Krajcik, J.; Reiser, B. The IQWST experience: Coherence as a design principle. Elem. Sch. J. 2008, 109, 199–219. [Google Scholar] [CrossRef]
  43. Hatch, J.A. Doing Qualitative Research in Educational Settings; State University of New York Press: Albany, NY, USA, 2002. [Google Scholar]
  44. Saldaña, J. The Coding Manual for Qualitative Researchers, 3rd ed.; Sage: London, UK, 2015. [Google Scholar]
  45. Godfrey-Smith, P. Darwinian Populations and Natural Selection; Oxford University Press: New York, NY, USA, 2011. [Google Scholar]
  46. Russ, R.S.; Scherr, R.E.; Hammer, D.; Mikeska, J. Recognizing mechanistic reasoning in student scientific inquiry: A framework for discourse analysis developed from philosophy of science. Sci. Stud. Sci. Educ. 2008, 92, 499–525. [Google Scholar] [CrossRef] [Green Version]
  47. Schwarz, C.V.; Ke, L.; Lee, M.; Rosenberg, J.M. Developing mechanistic explanations of phenomena: Case studies of two fifth grade students’ epistemologies in practice over time. In Learning and Becoming in Practice: The International Conference of the Learning Sciences (ICLS) 2014; Polman, J.L., Kyza, E.A., O’Neill, K., Tabak, I., Penuel, W.R., Jurow, A.S., D’Amico, L., Eds.; ISLS: Boulder, CO, USA, 2014; Volume 1, pp. 182–189. [Google Scholar]
  48. Parong, J.; Mayer, R.E. Learning science in immersive virtual reality. J. Educ. Psychol. 2018, 110, 785–797. [Google Scholar] [CrossRef]
  49. Lamb, R.; Antonenko, P.; Etopio, E.; Seccia, A. Comparison of virtual reality and hands on activities in science education via functional near infrared spectroscopy. Comput. Educ. 2018, 124, 14–26. [Google Scholar] [CrossRef]
Figure 1. Use of a computational science simulation as manipulating and analyzing simulation output to explain and predict phenomena.
Education 09 00049 g001
Figure 2. The Lab Interactive simulation that we designed for this study based on an existing simulation about the diffusion of molecules.
Education 09 00049 g002
Figure 3. Student 8’s model of the relationship between experiment time and temperature using the class dataset.
Education 09 00049 g003
Table 1. Data sources for each research question.
Research Questions and Sub QuestionsEmbedded Assessment Questions (Lesson Collected)
RQ1: How do students’ explanations change over the course of three lessons that involve using a simulation and modeling its output?When the temperature of the room is increased, the perfume particles reach the gas sensor more quickly. Explain why you think this happens. (Lesson 1)
Based on your observations of the simulation, explain why the perfume particles reach the gas sensor more quickly when the temperature of the room is increased. (Lesson 1)
Earlier, we asked you why when the temperature of the room is increased the perfume particles reach the gas sensor more quickly. Please explain why this happens now, knowing what you know from working through data from the simulation. (Lesson 3)
RQ2: What do students perceive the strengths and weaknesses of using the simulation to be?What are some of the benefits of this model of a gas? And what are some of its weaknesses? (Lesson 1)
How does your model of data help you explain what is going on? Why? (Lesson 3)
RQ3: How do students approach modeling the classroom data set to account for its variability?Explain why you selected this mathematical model as the best fit to the data. (Lesson 3)
Table 2. Representative student responses to content related questions regarding thermodynamics.
Time CollectedGroup 1 (Student 2)Group 2 (Student 7)Group 3 (Student 8)
Lesson 1: Before exploring the simulationThis happens because a higher temperature means that the gas particles vibrate more quickly (have more kinetic energy) so they move faster and can get across the room in less time.Temperature is directly related to energy: as temperature increases, the energy of the system increases. This results in an increase in kinetic energy, and since mass is constant, the velocity will increase throughout the whole system, reducing the time it takes to travel across a fixed distance.I think that when the temperature rises, the molecules have more energy and move faster, hitting each other more often.
Lesson 1: After the exploring the simulationThis seems to be the case because the molecules do move less when they are cold, so it takes longer for the smell to work its way across the chamber. When they are hot the move much more quickly and are able to bounce around from one side of the room to the other quite easily.Higher temperature → more energy → more collisions in a given amount of time → gets across the fixed distance fasterWhen the temperature is increased there is more energy in the particles, so they move faster and hit each other and other surfaces more often, so the gas reaches the sensor sooner.
Lesson 3: After completing the lesson sequence.This happens because the particles are travelling at a greater velocity. Since velocity is distance over time, and they have to cover the same distance, the time must decrease to factor in this increased velocity. Though there are particles in the way of the perfume and the sensor, they are physically able to travel faster, so assuming the bounces that they go through are random in each scenario, this should slow each temperature particles equally, and so it comes down to the velocity of the particles.The model shows us that as temperature increases the time for the particles to reach the sensor decreases. Not only does this model show us this visually, but it also gives us an equation to predict the time it would take a particle to reach the sensor given a temperature. We know that this equation fits our data and model due to the r squared value. The R squared value is a sort of measurement of the accuracy of our equation on a scale from 0-1. The closer the r squared is to one, the better our equation.I now know through the simulation that the particles move faster and bump around more often the higher the temperature. The more they bump around, the faster particles travel and take up more space.

