ARCS and RGT Integrated High-Efficiency E-Books

Southern Taiwan University of Science and Technology, Yungkang Dist., Tainan City 710, Taiwan
*
Author to whom correspondence should be addressed.
Educ. Sci. 2019, 9(2), 94; https://doi.org/10.3390/educsci9020094
Submission received: 27 February 2019
/
Revised: 24 April 2019
/
Accepted: 25 April 2019
/
Published: 29 April 2019
(This article belongs to the Special Issue Selected Papers from the Eurasian Conference on Educational Innovation 2019)
Abstract
:This study used the attention, relevance, confidence, and satisfaction (ARCS) method and Kelly’s repertory grid technique (RGT) to develop a high-efficiency e-book. Its main design concepts were to use the ARCS model to create a highly interactive human–machine interface and multimedia learning content that would enhance the learning motivation of users, and to use RGT and a knowledge map to supplement the learning strategy and help users effectively build personalized knowledge. This study adopted Taiwanese cherry blossoms as the learning objectives and recruited 70 freshmen from a university in Tainan as research participants. During the experiment, the students were divided into a control group, which used websites on cherry blossoms, and an experimental group, which used the system developed for this study. Learning outcome assessments and questionnaires were conducted on the pre- and post- learning test data of both groups. The learning outcomes were analyzed using a t-test. In the questionnaire, the assessments and discussions were focused on the four constructs of ARCS. The results show that the improvement of learning outcomes was more significant in the experimental group than in the control group. All dimensions of the questionnaire achieved significant results. Therefore, the learners provided positive reviews of the proposed high-efficiency e-book.
1. Introduction
Unlike conventional books and other traditional sources of information, e-books are presented in multimedia format, the layouts are animated and interesting, and the contents are richer. This format has the advantages of being attractive to users, which enhances their willingness to read and enables them to gain more knowledge. In the past, a variety of names were used for these products, such as online books, file-books, and e-text [1]. Researchers have proposed different definitions for e-books. Suarez and Woudhuysen [2] stated that an e-book is a type of text- and image-based digital publication that can be read on a computer or other digital carriers. Rawlins [3] emphasized that e-books include audio, animation, and automatic cross-referencing. They are easy to distribute, feature-rich, adaptable, viewable in real-time, and easy to search. In summary, e-books still have pages, with covers, tables of contents, content layouts, and chapters, resembling paper-based books in the arrangement of their basic elements.
In recent years, many scholars have reported the positive results of using e-books in fields such as nature and life science technology, language, and mathematics. The researchers have used its advantages to tackle inadequate learning among students, using it as a tool to assist in learning. For example, Korat and Segal-Drori [4] held that multimedia e-books, such as those with animation, music, sound effects, and audio narration, can be of great help to children with language disabilities. Most studies have been positive about e-book penetration, but Stoeckle [5] showed that although e-books can enhance the reading skills and motivation of students, special attention must be paid to students using e-books during class, as the students may be easily distracted, thereby leading to poor learning. Wang and Yang [6] discussed the effect of the interactive design of e-books on the outcomes of Chinese lessons for grade four students. The results showed that in character writing, the focus and satisfaction of students who used low-interaction e-books were significantly higher than those of students who used high-interaction e-books. This may have been because the students were only 10 years old, and their cognitive and processing abilities for multimedia learning were limited.
The current content design of e-books was examined in the present study. Some e-books had only words and images, and were categorized as novel-type e-books. Some e-books presented their content in animated form. However, this design was not based on any concept but simply narrated the story. The learning motivations and outcomes of the students could not be determined. The human–machine interface design did not have any interactive features, containing only simple event buttons. There was only one way to turn the pages, and the configuration of the buttons was not uniform but scattered over the pages. The only means of determining their function was to click on them. In other words, the e-books lacked high interactivity and lesson contents that attracted students, leading to poor learning motivation and lack of concentration, and thus could not enhance learning outcomes.
In summary, the current e-book design has only words and images, and is categorized as novel-type e-books, i.e., this design is not based on any concept but simply narrates a story. The learning motivations and outcomes of the students cannot be determined. In addition, the e-books lack high interactivity and lesson contents that attract students, leading to poor learning motivation and lack of concentration, and thus they cannot enhance learning outcomes.
ARCS motivation is the model framework proposed by Keller, with the objective of enabling students to focus more on learning motivation, leading to enhanced learning outcomes [7,8]. The theoretical basis of the RGT was derived from the personal construct theory (PCT) proposed by Kelly [9,10]. Kelly held that everyone is a scientist. People develop unique explanations based on their fields of experience, and these explanations generate knowledge concepts that form the basis for how they judge events. Kelly considered the process of PCT to be a course of projection, where the unique construct in each entity is reflected in the construction of the grid. In other words, the contents and results of the grid construction represented the cognitive system in the entity, and researchers analyzed the process and results of these constructions [11,12].
Spring is coming, the cherry blossoms are open! Taiwan is full of flowers, especially the cherry blossoms. Whenever the cherry blossom season arrives, everyone is competing to book tickets to Japan or Taiwan’s Alishan, Wuling Farm and other cherry blossom spots to appreciate this rare beauty. The cherry blossoms that are common in Taiwan include Taiwanese Mountain Sakura (Taiwan Cherry), Yaezakura (Multiple Petals Taiwan Cherry), Wusheh Cherry, and Pink Lady. Although there are not many types of cherry blossoms in Taiwan, there are 15 kinds of cherry blossoms, and they are different during flowering. It usually blooms at the end of December each year. It is mainly pink, pink, white, and the green hills are dotted with purple and red. The cherry blossoms usually bloom at the end of December each year, mainly in red, pink, white, and the hills are dotted with these beautiful flowers.
Therefore, this study hoped to use the ARCS motivation model to enhance learning motivation and the RGT assisted learning strategy to help students to effectively build personalized knowledge through learning. A high-efficiency Taiwan Cherry Blossom e-book was designed to let students read and learn through the e-book method and enhance their motivation to learn about cherry blossoms, enabling the students to improve their understanding of cherry blossoms and identify the different varieties, including flower names, images, primary colors, traits, common locations, and flowering periods (learning outcomes). Hence, this study investigated the following questions: (1) Can the proposed Taiwan Cherry Blossom e-book enhance students’ learning motivation? (2) Can the proposed Taiwan Cherry Blossom e-book enhance students’ learning outcomes?
2. Related Works
2.1. ARCS Motivation Model and Application
The attention, relevance, confidence, and satisfaction (ARCS) model has been applied in numerous fields of education. Hamzah et al. [13] proposed that this was a model for a learning environment that could encourage students and maintain their learning motivation through problem-solving. Kaneko et al. [14] used an ARCS-based mobile platform (iOS, Android) to develop and assess a game-based learning environment. The experimental group applied the ARCS model when designing the game whereas the control group used an e-learning method. The analysis results showed no significant difference in learning outcomes, but the use of the ARCS model enabled more focus on the learning environment. Akpokodje and Ukwuoma [15] assessed the effect of the use of ARCS in e-books on the reading motivation of higher education institution students in Nigeria. The research results showed that many students believed that their reading motivation was enhanced. Annamalai [16] used the ARCS model to design multimedia e-books for language learning. The results showed that it enhanced students’ reading motivation and improved their proficiency in the language. Wang et al. [17] proposed integrating TIxNUI and ARCS in the learning footnotes of future classrooms. The experimental results showed that such an integration provided significant learning motivation to students who had lower learning outcomes. Sarsar and Harmon [18] investigated the effectiveness of emotional, motivational feedback messages (EMFEM) in an online learning environment by using a variety of data collection strategies, such as a lesson interest survey, IT attitude survey, and open questionnaire. The results showed an increase in student learning motivation. Chang and Hsu [19] held that applying the ARCS model in teaching methods was effective and advantageous in an e-learning environment. It is a feasible innovative teaching method that can generate positive learning outcomes. Therefore, integration of ARCS in instruction has been proven to enhance the learning motivation of students.
2.2. Repertory Grid Technique (RGT) and Application
Scholars who studied the application of RGT discovered the following results. Lin et al. [20] used RGT to study two science teachers’ argumentation instruction of meta-strategy knowledge. One teacher was experienced in teaching the topic, and the other had little relevant experience. The experienced teacher noticed that most of the students were capable of generating an argument, but very few knew how to carry out an argument based on evidence. Therefore, the researchers helped the students gather data from various sources, and recommended that they build their own knowledge frame, to enhance the students’ ability to integrate their scientific knowledge and understanding into their argumentation. García-Mieres et al. [21] studied the possibility of using RGT to understand paranoid psychosis and determine the possible symptoms of patients with schizophrenia. Through RGT, these messages were primarily used to construct key clinical hypotheses, with critical fields, such as self-concept and family relationships, as possible treatment objectives.
RGT is divided into four steps as follows. Element elicitation can include a person’s name or an event, concept, or idea [22,23]. For construct elicitation, the traditional Kelly’s repertory grid has a group of three elements. These elements were compared, and which two elements were similar and how the third element was different were identified to obtain the matching attribute group. Rating involves filling the grade for the form (element, attributes). The grade reflects the rating and represents its difference from other elements. Analysis and discussion involve explaining the results of the grid. The study followed these steps to construct a cherry-blossom-related RGT for students’ learning.
3. Methodology of Research
3.1. General Background of Research
The scope of this research was concerned with the application of the ARCS method and RGT to improve learners’ learning motivation and learning outcomes This study adopted Taiwanese cherry blossoms to create an e-book. Learning outcome assessments and questionnaires were conducted on the pre- and post- learning test data of both groups. The learning outcomes were analyzed using a t-test. In the questionnaire, the assessments and discussions were focused on the four constructs of ARCS.
3.2. Sample of Research
This study recruited 70 freshmen students from the department of information management at a university in Tainan as research participants. The 35 students in the experimental group used the proposed e-book and the 35 students in the control group used web-based learning.
3.3. Instrument and Procedures
The objective of this study was to examine the effects of the combination of ARCS and RGT in interactive e-books on the learning outcomes and motivation of students. The research design and system architecture and design are shown as follows.
Research Design
The research design was divided into three phases: preparation, experimental implementation, and research analysis, the latter two phases are explained as follows.
1. Experimental implementation phase
- Experiment period: 18–23 May 2017, 140 min per group.
- Implementation steps:
Stage 1: The motivation and objectives of the study were explained to the students. The implementation time was 10 min.
Stage 2: A 15-min pre-test was conducted.
Stage 3: Experimental group: The students were taught how to use the system. Time taken was 10 min. Then, the students used the e-book for 70 min.
Control group: Received an explanation of web-based learning. Time taken was 10 min. Then, the students engaged in relevant learning (e.g., https://www.storm.mg/article/94340 and https://goo.gl/qsTk8t) for 70 min.
Stage 4: A 15-min post-test was conducted.
Stage 5: The experimental group completed a questionnaire and interview. Time taken was 20 min.
Control group: Participated in interviews, time taken was 20 min.
Note that, the titles of the websites are (https://www.storm.mg/article/94340 and https://goo.gl/qsTk8t) are ”Taiwanese Mountain Sakura, Yaezakura, Yoshino, etc., do you know how many kinds of cherry blossoms are there in Taiwan?” and “What is this cherry blossom?”, respectively. The two websites also introduce the cherry blossoms in Taiwan, but the contents of the websites are both presented by words and pictures. The design of the current websites was not based on any concept but simply had only words and images to narrate the story.
2. Research analysis phase
After the experiment, the post-test results and questionnaires of the experimental group were collated for analysis and discussion, and learning motivation and outcomes were evaluated. Finally, conclusions were drawn and recommendations were proposed.
3.4. System Architecture and Design
The objective of this study was to design a high-efficiency e-book, the Cherry Blossoms e-book, to enable students to effectively learn about the 15 varieties of cherry blossoms in Taiwan.
3.4.1. E-Book Feature Design
The contents of the Cherry Blossoms e-book were divided into six sections: home, user instructions, contents, cherry blossom learning material, cherry blossom distribution map, and a quiz, as shown in Figure 1 and described as follows.
- Home: The cover, demonstrating the contents of the e-book: “What cherry blossom is this? Learn the 15 varieties of cherry blossoms of Taiwan.”
- User instructions: Explain the operation of the e-book, including text and illustrations.
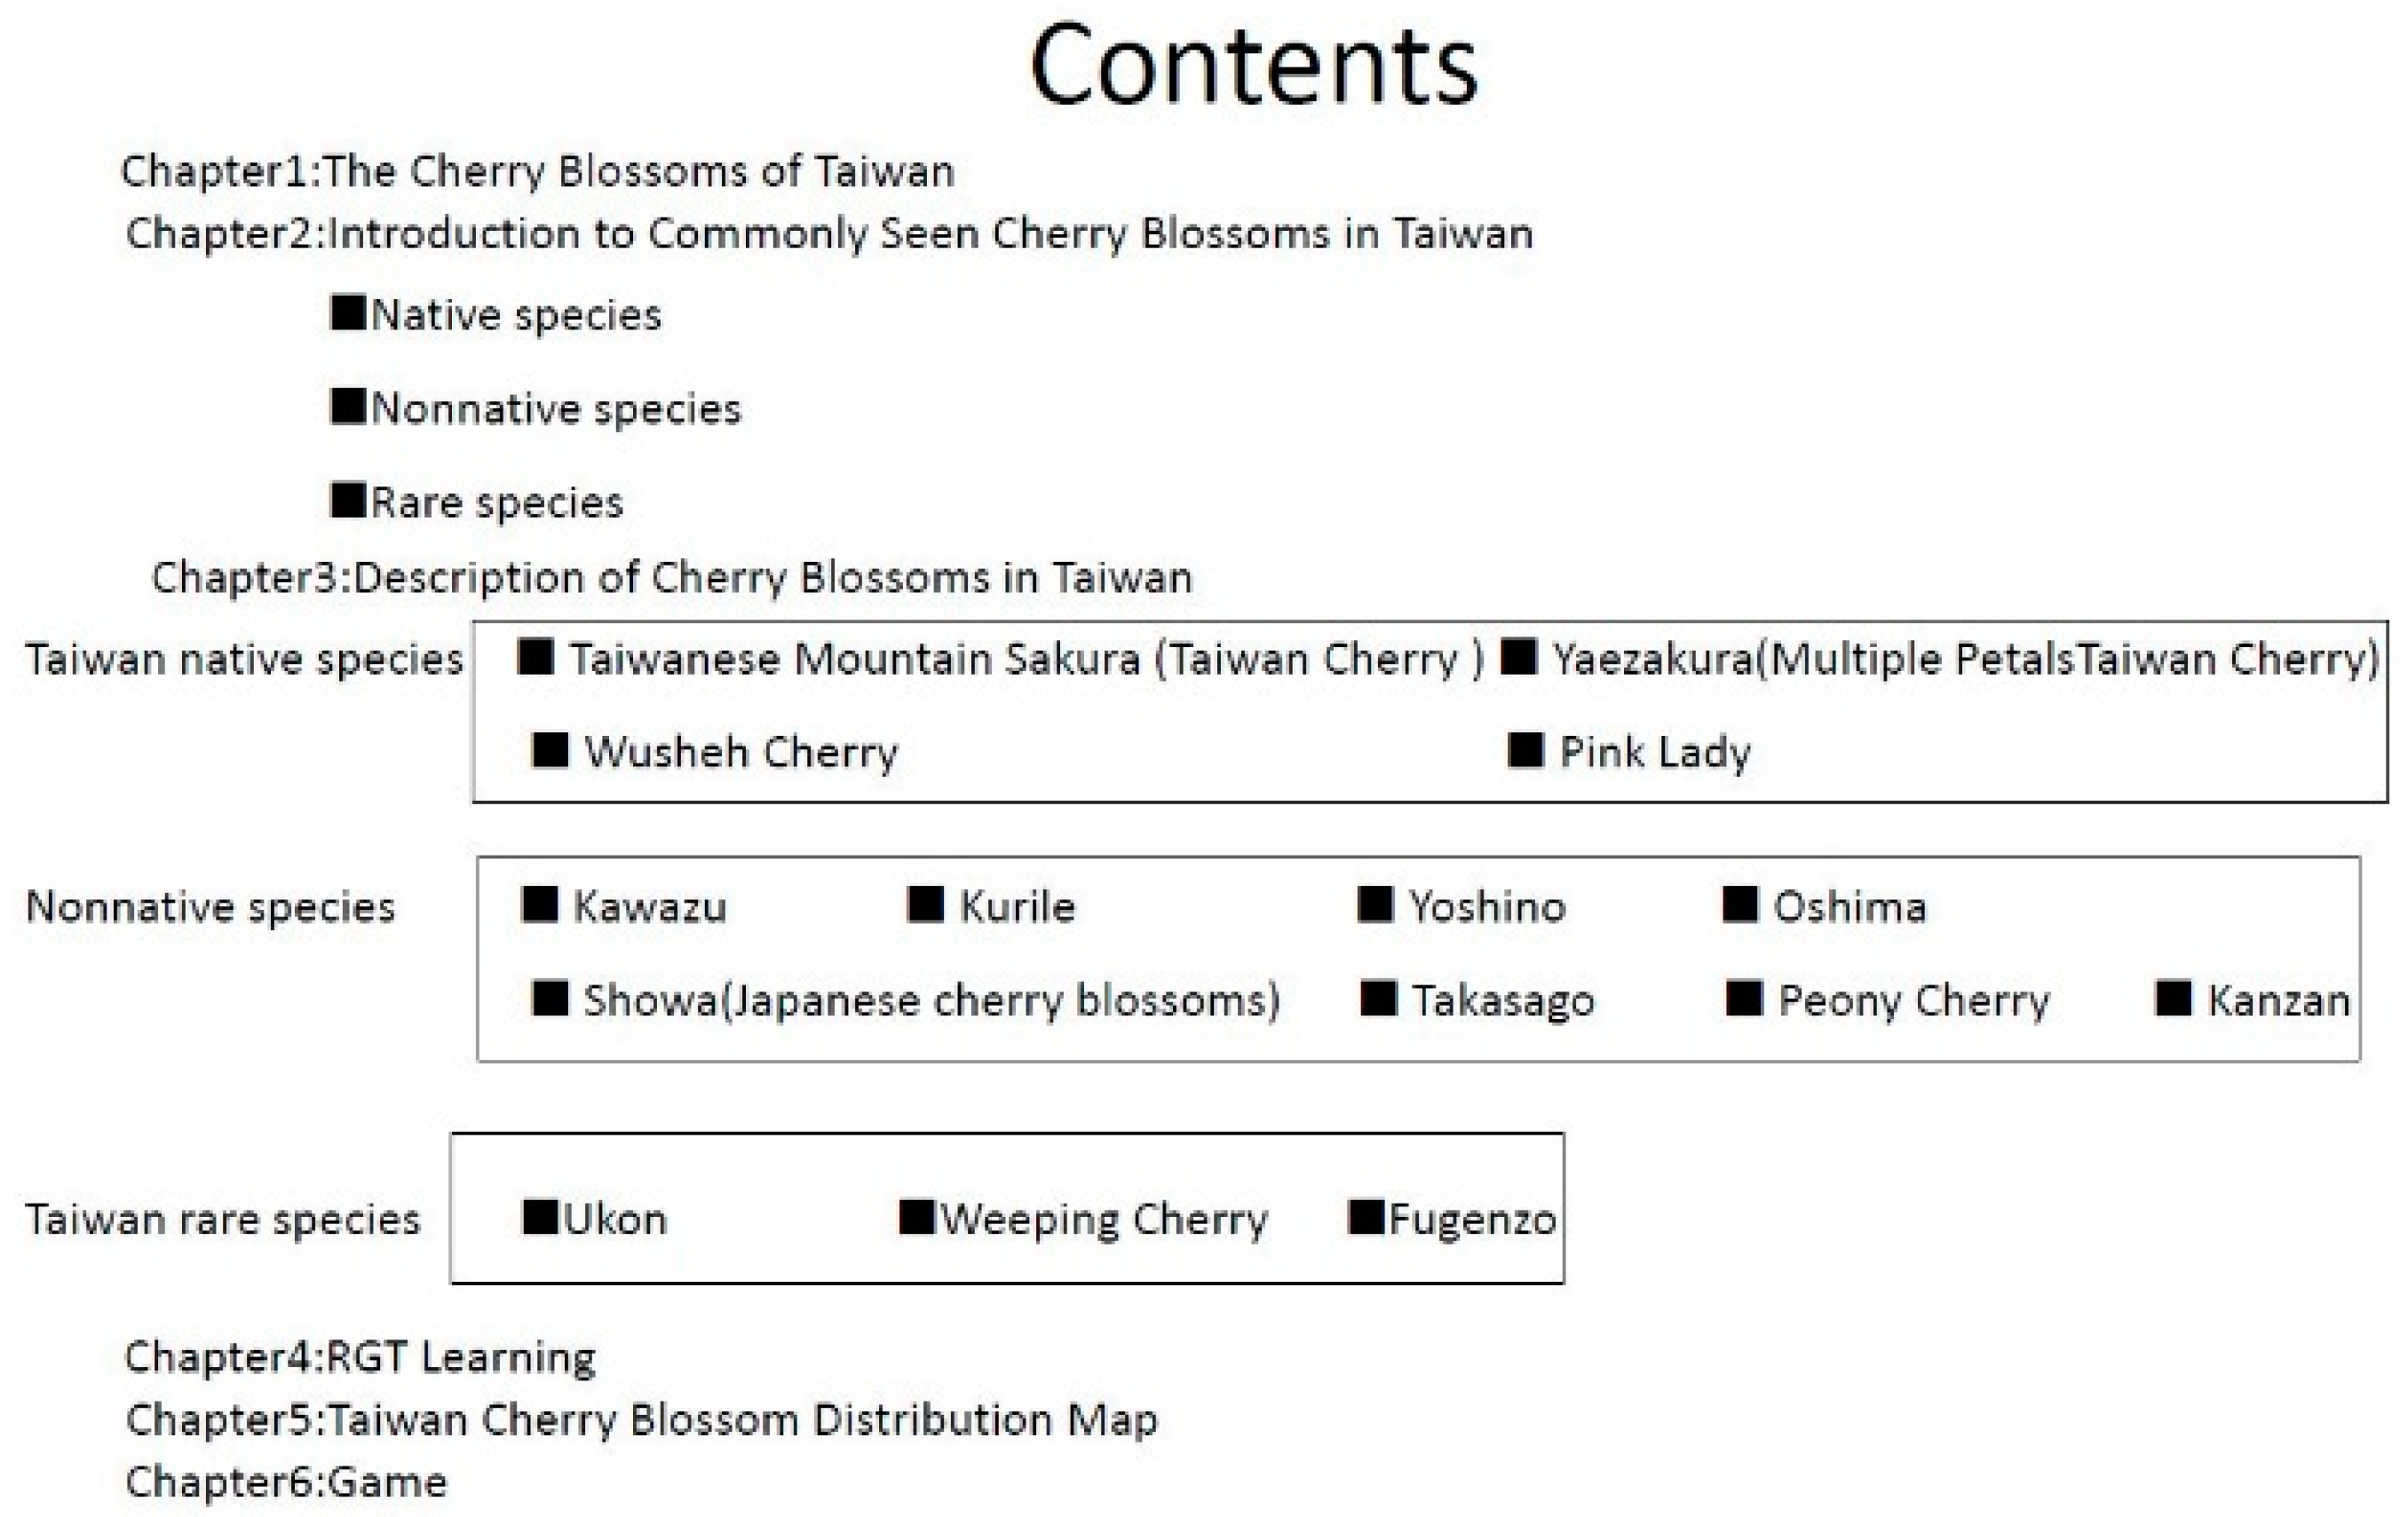
- Contents: Chapter 1 introduced the cherry blossoms of Taiwan. Chapter 2 discussed commonly seen cherry blossoms in Taiwan (Taiwanese native species, nonnative species, and rare species). Chapter 3 described the various Taiwanese cherry blossoms in detail. Chapter 4 contained RGT learning. Chapter 5 provided a distribution map of Taiwanese cherry blossoms. Chapter 6 contained a quiz.
- Cherry blossom learning material: The topic was the 15 varieties of cherry blossoms in Taiwan. The varieties of cherry blossoms seen in Taiwan were categorized into three types: native, nonnative, and rare species. The learning material was presented in three sections: text and images, videos, and RGT learning material, as shown in Figure 2. The content of each section was planned as follows:
- (a)
- Text and images: a tabular method was used to present information on the different varieties of cherry blossoms, including flower names, images, primary colosr, traits, common locations, and flowering periods.
- Native cherry blossom species: Taiwanese Mountain Sakura (Taiwan Cherry), Yaezakura (Multiple Petals Taiwan Cherry), Wusheh Cherry, and Pink Lady.
- Nonnative species: Kawazu, Kurile, Yoshino, Oshima, Showa (Japanese cherry blossoms), Takasago, Peony Cherry, and Kanzan.
- Rare species: Ukon, Weeping Cherry, and Fugenzo.
For example, Table 1 lists relevant information on the native species Taiwan Cherry and Yaezakura. - (b)
- Video learning material: Images and text were used to describe the varieties of cherry blossoms in detail. The video content included flower color and detailed trait information. The key points are presented in red font. For example, for the Taiwanese Mountain Sakura, the audio content and text are shown as follows: “The Taiwanese Mountain Sakura, also called Taiwan Cherry, is a magenta cherry blossom that blooms during the cold winter. It is the most widespread cherry blossom variety. Its traits are bell-shaped flowers, long stalks, regular flowers, and open petals. The tree bears edible fruits after the flower fades, and the leaves have a serrated edge. The flowering period is from January to February. It is the earliest-blooming cherry blossom in Taiwan.”
- (c)
- RGT learning material: RGT was constructed according to the color and traits of the cherry blossoms. Mutual comparison enabled students to identify the similarities and differences between the varieties of cherry blossoms more easily and amass and build their own knowledge to achieve more favorable learning outcomes.
- Cherry blossom distribution map (knowledge map): This map used different colored markers for cherry blossom varieties to enable students to easily learn their distribution. Students could click on the markers to view images of the cherry blossoms. For example, purple markers represented Yoshino, and dark blue markers represented Yaezakura (Multiple Petals Taiwan Cherry).
- Quiz: This was the post-test used to determine students’ learning outcomes.
We integrate the ARCS model design into the learning material to promote learning motivation. The design concepts are:
- Attention: The human–machine interface design and video content of e-books will attract students to learn. Unlike conventional books, e-books can enhance students’ learning motivation.
- Relevance: The cherry blossom distribution on the Taiwan knowledge map enables students to relate the cherry blossom distribution to their surroundings.
- Confidence: Presenting the lesson in video format enabled students to more easily grasp the key points of the lesson, and RGT learning enabled students to learn quickly and feel a sense of accomplishment.
- Satisfaction: Using the newly amassed knowledge to complete the test enabled students to feel satisfaction and created a different learning experience.
3.4.2. Operation Interface Design
The human–machine interface design can facilitate students’ learning. The design is as shown below:
- Use of text and images to design the user instructions: Enabled students to clearly understand the operation of the e-book. The following 11 instructions are designed: Click on the image to enlarge it. Click on the volume button to play the audio. Click on the stop button to stop the audio. Click on Contents to go to the page. Click on this button to go back to the previous page. Click on this button to go to the next page. Click on the play button to play the video. Click on the pause button to stop the video. Click on this button to go back to Contents. Click on the markers to view the image. Click and hold on any of the four corners to turn the page.
- Clear and detailed arrangement of contents: Enabled students to easily find what they were looking for. Students could click on the text in the contents page to go directly to the page containing the lesson, without needing to keep turning pages, as shown in Figure 3.
- Comprehensive learning guide planning: All lesson pages have a “Back to Contents” button to return to the contents page, where students can then choose their desired content.
- Simple and convenient operation method: The four corners can be clicked to turn the page. There are “previous” and “next” buttons on the bottom right corners, which students can also click on to turn the page.
3.4.3. Production of Audio Teaching Material
For the audiovisual learning materials in the e-book, the ITRI TTS Web Service [24] was used to generate the audio files, which were then placed in the video. The ITRI TTS Web Service used a robust prosody synthesis system with Chinese word segmenting fault tolerance capability to generate synthetic speech with clear, unattenuated, and cadenced intonation, as well as to provide pronunciations that are close to those produced by a human voice. The audio options included combinations of Chinese and English, switching between Chinese and English, male voice, female voice, volume control, read-aloud speed, and pitch.
3.4.4. RGT Design
The four steps were generated according to RGT as follows:
- Element elicitation: The elements were primarily based on the 15 varieties of cherry blossoms commonly seen in Taiwan.
- Construct elicitation: After referencing online data and comparing and collating the data, we set five traits for identifying cherry blossoms, namely color, type, stalk, number of petals, and fragrance, as the learning constructs.
- Rating: Between one and five.
- Conclusions: Finally, we designed the various corresponding RGTs according to the learning objects for the three main types of cherry blossoms. Table 2 depicts the post-design RGT of native cherry blossom species.
3.4.5. Quiz Design
Flash was used to create 30 multiple-choice questions. Each question had four options, including textual question-and-answer and imagery question-and-answer. When users took the test, the system randomly selected 10 questions for them to answer. After the users completed the test, they could immediately find out how many of their answers were correct. If users wanted to take the test again, they could click on the retest button. For example,
Question: Which one is the most widely distributed cherry blossoms in Taiwan?
- (A)
- Yaezakura (Multiple Petals Taiwan Cherry)
- (B)
- Taiwanese Mountain Sakura (Taiwan Cherry)
- (C)
- Kurile
Question: Which one is the Yoshino?

3.4.6. Cherry Blossom Distribution Map (Knowledge Map)
The main objective was to enable users to clearly understand the distribution of cherry blossoms in Taiwan, the design is shown in Figure 4. The data on the right side are the types and marker colors of the 15 varieties of cherry blossoms, so that users could conveniently find the geographical locations of the cherry blossoms. In the map, each colored marker and place name represents the regional distribution of the cherry blossom, the user can click on the markers to view the images of the cherry blossoms. There are left and right buttons at the bottom right of the page clicking on the right button will lead to the next page and clicking on the left button will lead to the previous page. The button on the top left corner of the page takes the user back to the contents page.
3.5. Data Analysis
The research objective of this study was to verify whether the Taiwan Cherry Blossom e-book helped the students learn about the topic at hand. The learning outcomes were analyzed using a t-test. In the questionnaire, the assessments and discussions were focused on the four constructs of ARCS. The questionnaire was designed to include the four constructs of ARCS. Each construct had six questions, for a total of 24 questions. The questions were answered using a five-point Likert scale from “strongly agree” to “strongly disagree,” equivalent to five and one points, respectively. The questionnaires were distributed to the 35 students in the experimental group. All were returned and deemed valid, for a 100% response rate. The study took SD = 1 as the standard, for example, if the SD was greater than one, there was a varied understanding of that question among students, if the SD was less than one, the students had a similar understanding of that question.
4. Results of Research
4.1. Analysis of Learning Outcomes
1. Analysis of the pre-test results of the experimental and control group
Before the start of the experiment, the prerequisite knowledge of the students in both groups was determined with regard to the learning material. An independent samples t-test was used to analyze the pre-test results of the two groups. The results are shown in Table 3. The mean pre-test score of the experimental group was 42.571, with a standard deviation (SD) of 16.687. The mean pre-test score of the control group was 38.000, with an SD of 14.307. The p-value of 0.223 did not achieve the 0.05 significance level, indicating that the pre-test scores of the experimental and control groups did not differ significantly. Hence, the groups’ basic capability was the same.
2. Analysis of the pre- and post-test results of the experimental group
These results were analyzed using a paired samples t-test. The experimental results are provided in Table 4. The mean score of the pre-test results was 42.571 and the SD was 16.687. The mean score of the post-test results was 65.714 and the SD was 21.731. The p-value of 0.000 achieved the 0.001 level of significance, indicating that the pre- and post-test scores differed significantly in the experimental group.
3. Analysis of the pre- and post-test results of the control group
The pre- and post-tests for the control group were analyzed using a paired samples t-test. The experimental results are shown in Table 5. The mean score of the pre-test results was 38.000 and the SD was 14.307. The mean score of the post-test results was 47.428 and the SD was 17.547. The p-value of 0.012 achieved the 0.05 significance level, indicating improvement in the control group between the pre- and post-test scores.
4. Post-test analysis
Post-test analysis of the experimental and control groups was performed using an independent samples t-test, and the experimental results are shown in Table 6. The analysis demonstrated that the post-test scores of the experimental group were higher than those of the control group, with the mean scores of the two groups differing by 18 points. The p-value of 0.000 achieved the 0.001 significance level, indicating that the post-test scores of the experimental and control groups differed significantly.
4.2. Questionnaire Analysis
1. Reliability analysis
The reliability analysis used Cronbach’s α to examine the consistency of the scale, α > 0.7 indicated high reliability. The results of the reliability analysis are shown in Table 7. All the constructs had α > 0.7, and that of the entire scale was 0.887, showing that the scale had a certain degree of reliability.
2. Descriptive statistics analysis
The analysis results of the Attention construct are shown in Table 8. The average score of the six questions was 4.000 and the average SD was 0.603, indicating that the students strongly agreed that the system could elicit their attention.
The analysis results of the relevance construct are shown in Table 9. The average score of the six questions was 4.1119 and the average SD was 0.582, indicating that the lesson was presented in a relatable way in this system.
The analysis results of the confidence construct are shown in Table 10. The average score of the six questions was 4.048 and the average SD was 0.678, indicating that the system could help the students enhance their self-confidence in learning.
The analysis results of the satisfaction construct are shown in Table 11. The average score of the six questions was 4.091 and the average SD was 0.552, showing that using the system enabled the students to gain a feeling of satisfaction.
3. Discussion
From the results of the analysis of learning outcomes (Table 6), a comparison of the pre- and post-test scores among the two groups indicates that the Taiwan Cherry Blossom e-book improve the learning outcomes of students more effectively. In the questionnaire analysis, among the various questions regarding attention, A-5, “The human–machine interface design attracts my attention” obtained the highest mean score (4.171) and lowest SD (0.453), indicating that the design of the e-book’s human–machine interface strongly attracted the attention of the students. Another question, A-4, “The RGT learning method enables me to easily focus on the lesson content” had a relatively low mean score. Among the questions of relevance, R-4, “The content in the knowledge map made me more aware to understand the distribution of cherry blossoms” obtained the highest mean score (4.343) and lowest SD (0.482), indicating that the design and presentation of the knowledge map helped the students to clearly understand the cherry blossoms’ regional distributions, providing them with clear directions if they wanted to view the cherry blossoms. Another question, R-5, “Learning through RGT can help me gain knowledge of cherry blossoms,” had a relatively low mean score. Among the questions regarding confidence, C-4, “The audiovisual learning method enabled me to grasp the key points of the lesson” obtained the highest mean score (4.286) and lowest SD (0.458), indicating that the e-book’s presentation of learning content in the audiovisual format helped the students to understand the key points of the lesson more easily. Another question, C-5, “The use of RGT learning improved my confidence in identifying cherry blossoms,” had a relatively low mean score among the questions for this construct. Among the questions regarding satisfaction, S-6, “The e-book method of learning gave me a different learning experience” obtained the highest mean score (4.257) and lowest SD (0.443). This indicates that the students believed that the human–machine interface design and the audiovisual contents of the proposed e-book differed from existing learning methods, and delivered a novel experience.
Questions on RGT mostly received lower scores in the questionnaire. The mean scores of A-4, R-5, and C-5 were relatively low among questions pertaining to their relevant constructs. However, the mean score of 3.9 was close to four, the “agree” level, indicating that RGT was useful at building personalized knowledge. The following opinions were obtained after an interview with the students on RGT learning.
- Because the students were using RGT learning for the first time, they were not very familiar with it.
- Using RGT to build cherry blossom knowledge required a longer learning time.
5. Conclusions
The study combined ARCS and RGT to develop the Taiwan Cherry Blossoms e-book. The students learned through the audiovisual contents, clear human–machine interface design, RGT, and cherry blossom knowledge map, gaining a novel learning experience. The e-book also enhanced the students’ interest in learning about cherry blossoms in Taiwan and increased their learning motivation on this topic. Additionally, analyses of the independent sampled t-tests on the post-test scores indicate that in comparison with the test results for conventional web-based learning, the Taiwan Cherry Blossoms e-book enhanced the students’ learning outcomes more effectively. Furthermore, the analysis results of the questions on the ARCS questionnaire show that the ARCS model enhanced students’ learning motivation, achieving the research objective. Since our research participants were 18-year-old freshmen, the conclusion that the low-interaction control group outperformed the high-interaction experimental group, which Wang and Yang [6] arrived at, was not supported by our experimental results.
The qualitative analysis shows that the acceptance rate of the test content was relatively low. This was because we provided a question-and-answer test, whereas the students expected a test that included interesting and relevant games, meaning that the test fell short of the students’ expectations. Therefore, creating situational games or including level designs that could enable students to integrate themselves into the scenario and gain more cherry blossom knowledge would further enhance students’ learning motivations and outcomes. Additionally, the qualitative analysis shows that the learning strategy of using RGT to supplement teaching content had relatively low scores because the students were unfamiliar with RGT, and therefore, needed more time to learn how to use it to build relevant knowledge. Therefore, if the concept of RGT and instructions on how to apply the technique could be taught to the students before they began learning, and a few examples provided so that the students could practice, then a more favorable learning result could be achieved. Finally, we hoped to add an audio search feature. If students could use audio features to search for their desired content, it would enhance their willingness to use the e-book as well as their learning motivation and additionally promote interactivity.
Author Contributions
Writing original draft, Y.-H.C. and P.-C.C., writing, review& editing, Y.-H.C. and R.-J.F., Corresponding, Y.-H.C.
Funding
This paper received no external funding.
Conflicts of Interest
The authors declare no conflict of interest.
References
- Sohn, W.S.; Ko, S.K.; Lee, K.H.; Kim, S.H.; Lim, S.B.; Choy, Y.C. Standardization of eBook documents in the Korean industry. Comput. Stand. Interfaces 2002, 24, 45–60. [Google Scholar] [CrossRef]
- Suarez, M.F.; Woudhuysen, H.R. (Eds.) The Oxford Companzion to the Book; Oxford University Press: Oxford, UK; New York, NY, USA, 2010; Volume 2. [Google Scholar]
- Rawlins, G.J. Publishing over the next decade. J. Am. Soc. Inf. Sci. 1993, 44, 474. [Google Scholar] [CrossRef]
- Korat, O.; Segal-Drori, O. Electronic (E)-Books as a Support for Young Children’s Language and Early Literacy. Technology in Early Childhood Education 2016. pp. 1–4. Available online: http://www.child-encyclopedia.com/sites/default/files/textes-experts/en/4738/electronice-books-as-a-support-for-young-childrens-language-and-early-literacy.pdf (accessed on 20 March 2018).
- Stoeckle, K. Page Turning and Mouse Clicking: A Comparison of eBooks and an Adult Reader on Comprehension Measures. Ebook Effects Compr. 2011, 5, 1–19. [Google Scholar]
- Wang, P.Y.; Yang, H.C. The impact of e-book interactivity design on children’s Chinese character acquisition. Interact. Learn. Environ. 2016, 24, 784–798. [Google Scholar] [CrossRef]
- Keller, J.M. Strategies for stimulating the motivation to learn. Perf. Improv. 1987, 26, 1–7. [Google Scholar] [CrossRef]
- Keller, J.M. How to integrate learner motivation planning into lesson planning: The ARCS model approach. In Proceedings of the VII Semanario, Santiago, Cuba, February 2000; pp. 1–13. [Google Scholar]
- Burr, V.; Butt, T. Invitation to Personal Construct Psychology; Whurr Publishers: London, UK, 1992. [Google Scholar]
- Kelly, G.A. The Psychology of Personal Constructs; Norton: New York, NY, USA, 1955. [Google Scholar]
- Fransella, F.; Bell, R.D.; Bannister, D. A Manual for Repertory Grid Technique, 2nd ed.; John Wiley & Sons: Chichester, UK, 2004. [Google Scholar]
- Kurz, T.L.; Middleton, J.A. Using a functional approach to change preservice teachers’ understanding of mathematics software. J. Res. Technol. Educ. 2006, 39, 45–65. [Google Scholar] [CrossRef]
- Hamzah, W.A.F.W.; Ali, N.H.; Saman, M.Y.M.; Yusoff, M.H.; Yacob, A. Enhancement of the ARCS model for gamification of learning. In Proceedings of the IEEE 3rd International Conference on User Science and Engineering (i-USEr), Shah Alam, Malaysia, 2–5 September 2014; pp. 287–291. [Google Scholar]
- Kaneko, K.; Saito, Y.; Nohara, Y.; Kudo, E.; Yamada, M. A Game-Based Learning Environment Using the ARCS Model at a University Library. In Proceedings of the IEEE 4th International Congress on In Advanced Applied Informatics (IIAI-AAI), Okayama, Japan, 12–16 July 2015; pp. 403–408. [Google Scholar]
- Akpokodje, V.N.; Ukwuoma, S.C. Evaluating the Impact of eBook on Reading Motivation of Students of Higher Learning in Nigerian Universities. In Proceedings of the IFLA WLIC 2016, Columbus, OH, USA, 13–19 August 2016. [Google Scholar]
- Annamalai, S. Implementing ARCS Model to Design a Motivating Multimedia E-Book for Polytechnic ESL Classroom. J. Telecommun. Electron. Comput. Eng. (JTEC) 2016, 8, 57–60. [Google Scholar]
- Wang, S.M.; Lin, S.X.; Huang, C. Smart TV tangible interaction natural user interface design in the scenario of future classroom. In Proceedings of the IEEE International Conference on Consumer Electronics-Taiwan (ICCE-TW), Nantou, Taiwan, 27–29 May 2016; pp. 1–2. [Google Scholar]
- Sarsar, F.; Harmon, S. Student and Instructor Responses to Emotional Motivational Feedback Messages in an Online Instructional Environment. TOJET 2017, 16, 115–127. [Google Scholar]
- Chang, N.C.; Hsu, H.Y. A Study on Integrating Problem-based Learning into the Innovative Teaching in Information Literacy and Ethics. J. Educ. Media Lib. Sci. 2016, 53, 200–209. [Google Scholar]
- Lin, Y.R.; Hung, C.Y.; Hung, J.F. Exploring teachers’ meta-strategic knowledge of science argumentation teaching with the repertory grid technique. Int. J. Sci. Educ. 2017, 39, 105–134. [Google Scholar] [CrossRef]
- García-Mieres, H.; Ochoa, S.; Salla, M.; López-Carrilero, R.; Feixas, G. Understanding the paranoid psychosis of James: Use of the repertory grid technique for case conceptualization. World J. Psychiatry 2016, 6, 381. [Google Scholar] [CrossRef] [PubMed]
- Chitsabesan, P.; Corbett, S.; Walker, L.; Spencer, J.; Barton, J.R. Describing clinical teachers’ characteristics and behaviors using critical incidents and repertory grids: Clinical teaching. Med. Educ. 2006, 40, 645–653. [Google Scholar] [CrossRef] [PubMed]
- Jankowicz, D. The Easy Guide to Repertory Grids; John Wiley & Sons: Chichester, UK, 2004. [Google Scholar]
- ITRI TTS Web Service. Text-To-Speech Web Service (ITRI TTS@Web). Available online: http://tts.itri.org.tw/ (accessed on 1 March 2017).
Figure 1.
Cherry Blossoms e-book feature map.

Figure 2.
Concept diagram of the learning material.

Figure 3.
Contents of the Cherry Blossoms e-book.

Figure 4.
Taiwan cherry blossom distribution map.


Table 1.
Native Taiwanese cherry blossom species.
| Flower Name | Image | Primary Color | Traits | Common Locations | Flowering Period |
|---|---|---|---|---|---|
| Taiwanese Mountain Sakura |  | Magenta | Bell-shaped flowers, long stalk, regular flowers, open petals, non-fragrant | Across Taiwan | January to February |
| Yaezakura |  | Magenta | Bell-shaped flowers, long stalk, regular flowers, overlapping petals, non-fragrant | Yangmingshan, Formosan Aboriginal Culture Village | February to March |
Table 2.
RGT of native cherry blossom species.
| Taiwan Native Species | Taiwanese Mountain Cherry (Taiwan Cherry) | Yaezakura (Multiple Petals Taiwan Cherry) | Wusheh Cherry | Pink Lady | |
|---|---|---|---|---|---|
| Magenta | 1 | 1 | 5 | 4 | Non-magenta |
| Large flower | 3 | 3 | 5 | 3 | Small flower |
| Long stalk | 1 | 1 | 1 | 5 | Short stalk |
| Open petals | 1 | 5 | 1 | 1 | Overlapping petals |
| Fragrant | 5 | 5 | 5 | 1 | Non-fragrant |
Examples: Deep pink, long stalk, open petals, and non-fragrant → Taiwanese Mountain Cherry (Taiwan Cherry). Deep pink, long stalk, overlapping petals, and non-fragrant → Yaezakura (Multiple Petals Taiwan Cherry).
Table 3.
Analysis of the independent samples t-test of the experimental and control.
| Pre-test | Number | Mean | SD | T Value |
|---|---|---|---|---|
| Experimental Group | 35 | 42.571 | 16.687 | 1.180 |
| Control Group | 35 | 38.000 | 14.307 |
p > 0.05.
Table 4.
Analysis of the paired samples t-test of the experimental group.
| Experimental Group | Number | Mean | SD | T Value |
|---|---|---|---|---|
| Pre-test | 35 | 42.571 | 16.687 | −5.116 |
| Post-test | 35 | 65.714 | 21.731 |
p < 0.001.
Table 5.
Analysis of the paired samples t-test of the control group.
| Control Group | Number | Mean | SD | T Value |
|---|---|---|---|---|
| Pre-test | 35 | 38.000 | 14.307 | −2.657 |
| Post-test | 35 | 47.428 | 17.547 |
p < 0.05.
Table 6.
Analysis of the independent samples t-tests of the experimental and control groups.
| Post-test | Number | Mean | SD | T Value |
|---|---|---|---|---|
| Experimental Group | 35 | 65.714 | 21.731 | 3.873 |
| Control Group | 35 | 47.428 | 17.547 |
p < 0.001.
Table 7.
Analysis of the reliability of the questionnaire.
| Dimension | NO. | Cronbach’s α |
|---|---|---|
| Attention | 6 | 0.846 |
| Relevance | 6 | 0.883 |
| Confidence | 6 | 0.852 |
| Satisfaction | 6 | 0.965 |
| Avg. | 0.887 |
Table 8.
Basic statistical table for the attention-related questions.
| Question No. | Questions | Mean | SD |
|---|---|---|---|
| A-1 | E-books that have audiovisual content attract my attention. | 4.114 | 0.631 |
| A-2 | The presentation of the knowledge map will help me learn. | 4.143 | 0.455 |
| A-3 | The content layout of an e-book can elicit my interest. | 4.000 | 0.804 |
| A-4 | The RGT learning method enables me to easily focus on the lesson content. | 3.929 | 0.689 |
| A-5 | The human–machine interface design attracts my attention. | 4.171 | 0.453 |
| A-6 | The test unit in the e-book motivates me to use this e-book. | 3.943 | 0.684 |
| Average | 4.000 | 0.603 |
Table 9.
Basic statistical table for the relevance-related questions.
| Question No. | Questions | Mean | SD |
|---|---|---|---|
| R-1 | The e-book content was helpful in learning about cherry blossoms. | 4.314 | 0.483 |
| R-2 | The design of the contents page of the e-book made me more aware to clearly grasp the learning objectives. | 4.086 | 0.507 |
| R-3 | The audiovisual presentation of the content made me more aware to easily learn about cherry blossoms. | 4.085 | 0.658 |
| R-4 | The content in the knowledge map made me more aware to understand the distribution of cherry blossoms. | 4.343 | 0.482 |
| R-5 | Learning through RGT can help me gain knowledge related to cherry blossoms. | 3.914 | 0.710 |
| R-6 | The user instructions in the e-book made me more aware to clearly understand the operation method. | 4.171 | 0.664 |
| Average | 4.119 | 0.582 |
Table 10.
Basic statistical table for the confidence-related questions.
| Question No. | Questions | Mean | SD |
|---|---|---|---|
| C-1 | Learning with the e-book improved my confidence in learning. | 4.057 | 0.765 |
| C-2 | Learning was easier with the e-book than with conventional books and web-based learning. | 4.171 | 0.664 |
| C-3 | The e-book content design enabled an easier understanding of key points. | 4.028 | 0.663 |
| C-4 | The audiovisual learning method enabled me to grasp the key points of the lesson. | 4.286 | 0.458 |
| C-5 | The use of RGT learning improved my confidence in identifying cherry blossoms. | 3.857 | 0.905 |
| C-6 | After using the e-book, I have a better understanding of cherry blossoms. | 4.086 | 0.612 |
| Average | 4.048 | 0.678 |
Table 11.
Basic statistical table for the satisfaction-related questions.
| Question No. | Questions | Mean | SD |
|---|---|---|---|
| S-1 | The e-book method made learning more interesting and convenient. | 4.057 | 0.539 |
| S-2 | After using the e-book, I have acquired more knowledge of cherry blossoms. | 4.143 | 0.445 |
| S-3 | I felt a sense of satisfaction when I passed the test. | 3.829 | 0.785 |
| S-4 | I could gain knowledge on cherry blossoms from the knowledge map in the e-book. | 4.200 | 0.473 |
| S-5 | I am very satisfied with the design and learning method of this e-book. | 4.075 | 0.639 |
| S-6 | The e-book method of learning gave me a different learning experience. | 4.257 | 0.443 |
| Average | 4.091 | 0.552 |
© 2019 by the authors. Licensee MDPI, Basel, Switzerland. This article is an open access article distributed under the terms and conditions of the Creative Commons Attribution (CC BY) license (http://creativecommons.org/licenses/by/4.0/).
Share and Cite
MDPI and ACS Style
Chang, Y.-H.; Chao, P.-C.; Fang, R.-J. ARCS and RGT Integrated High-Efficiency E-Books. Educ. Sci. 2019, 9, 94. https://doi.org/10.3390/educsci9020094
AMA Style
Chang Y-H, Chao P-C, Fang R-J. ARCS and RGT Integrated High-Efficiency E-Books. Education Sciences. 2019; 9(2):94. https://doi.org/10.3390/educsci9020094
Chicago/Turabian StyleChang, Yi-Hsing, Pin-Chun Chao, and Rong-Jyue Fang. 2019. "ARCS and RGT Integrated High-Efficiency E-Books" Education Sciences 9, no. 2: 94. https://doi.org/10.3390/educsci9020094
Note that from the first issue of 2016, this journal uses article numbers instead of page numbers. See further details here.