Label-Free LC-MS Profiling of Skeletal Muscle Reveals Heart-Type Fatty Acid Binding Protein as a Candidate Biomarker of Aerobic Capacity

 ,
, 
Abstract
:1. Introduction
2. Experimental
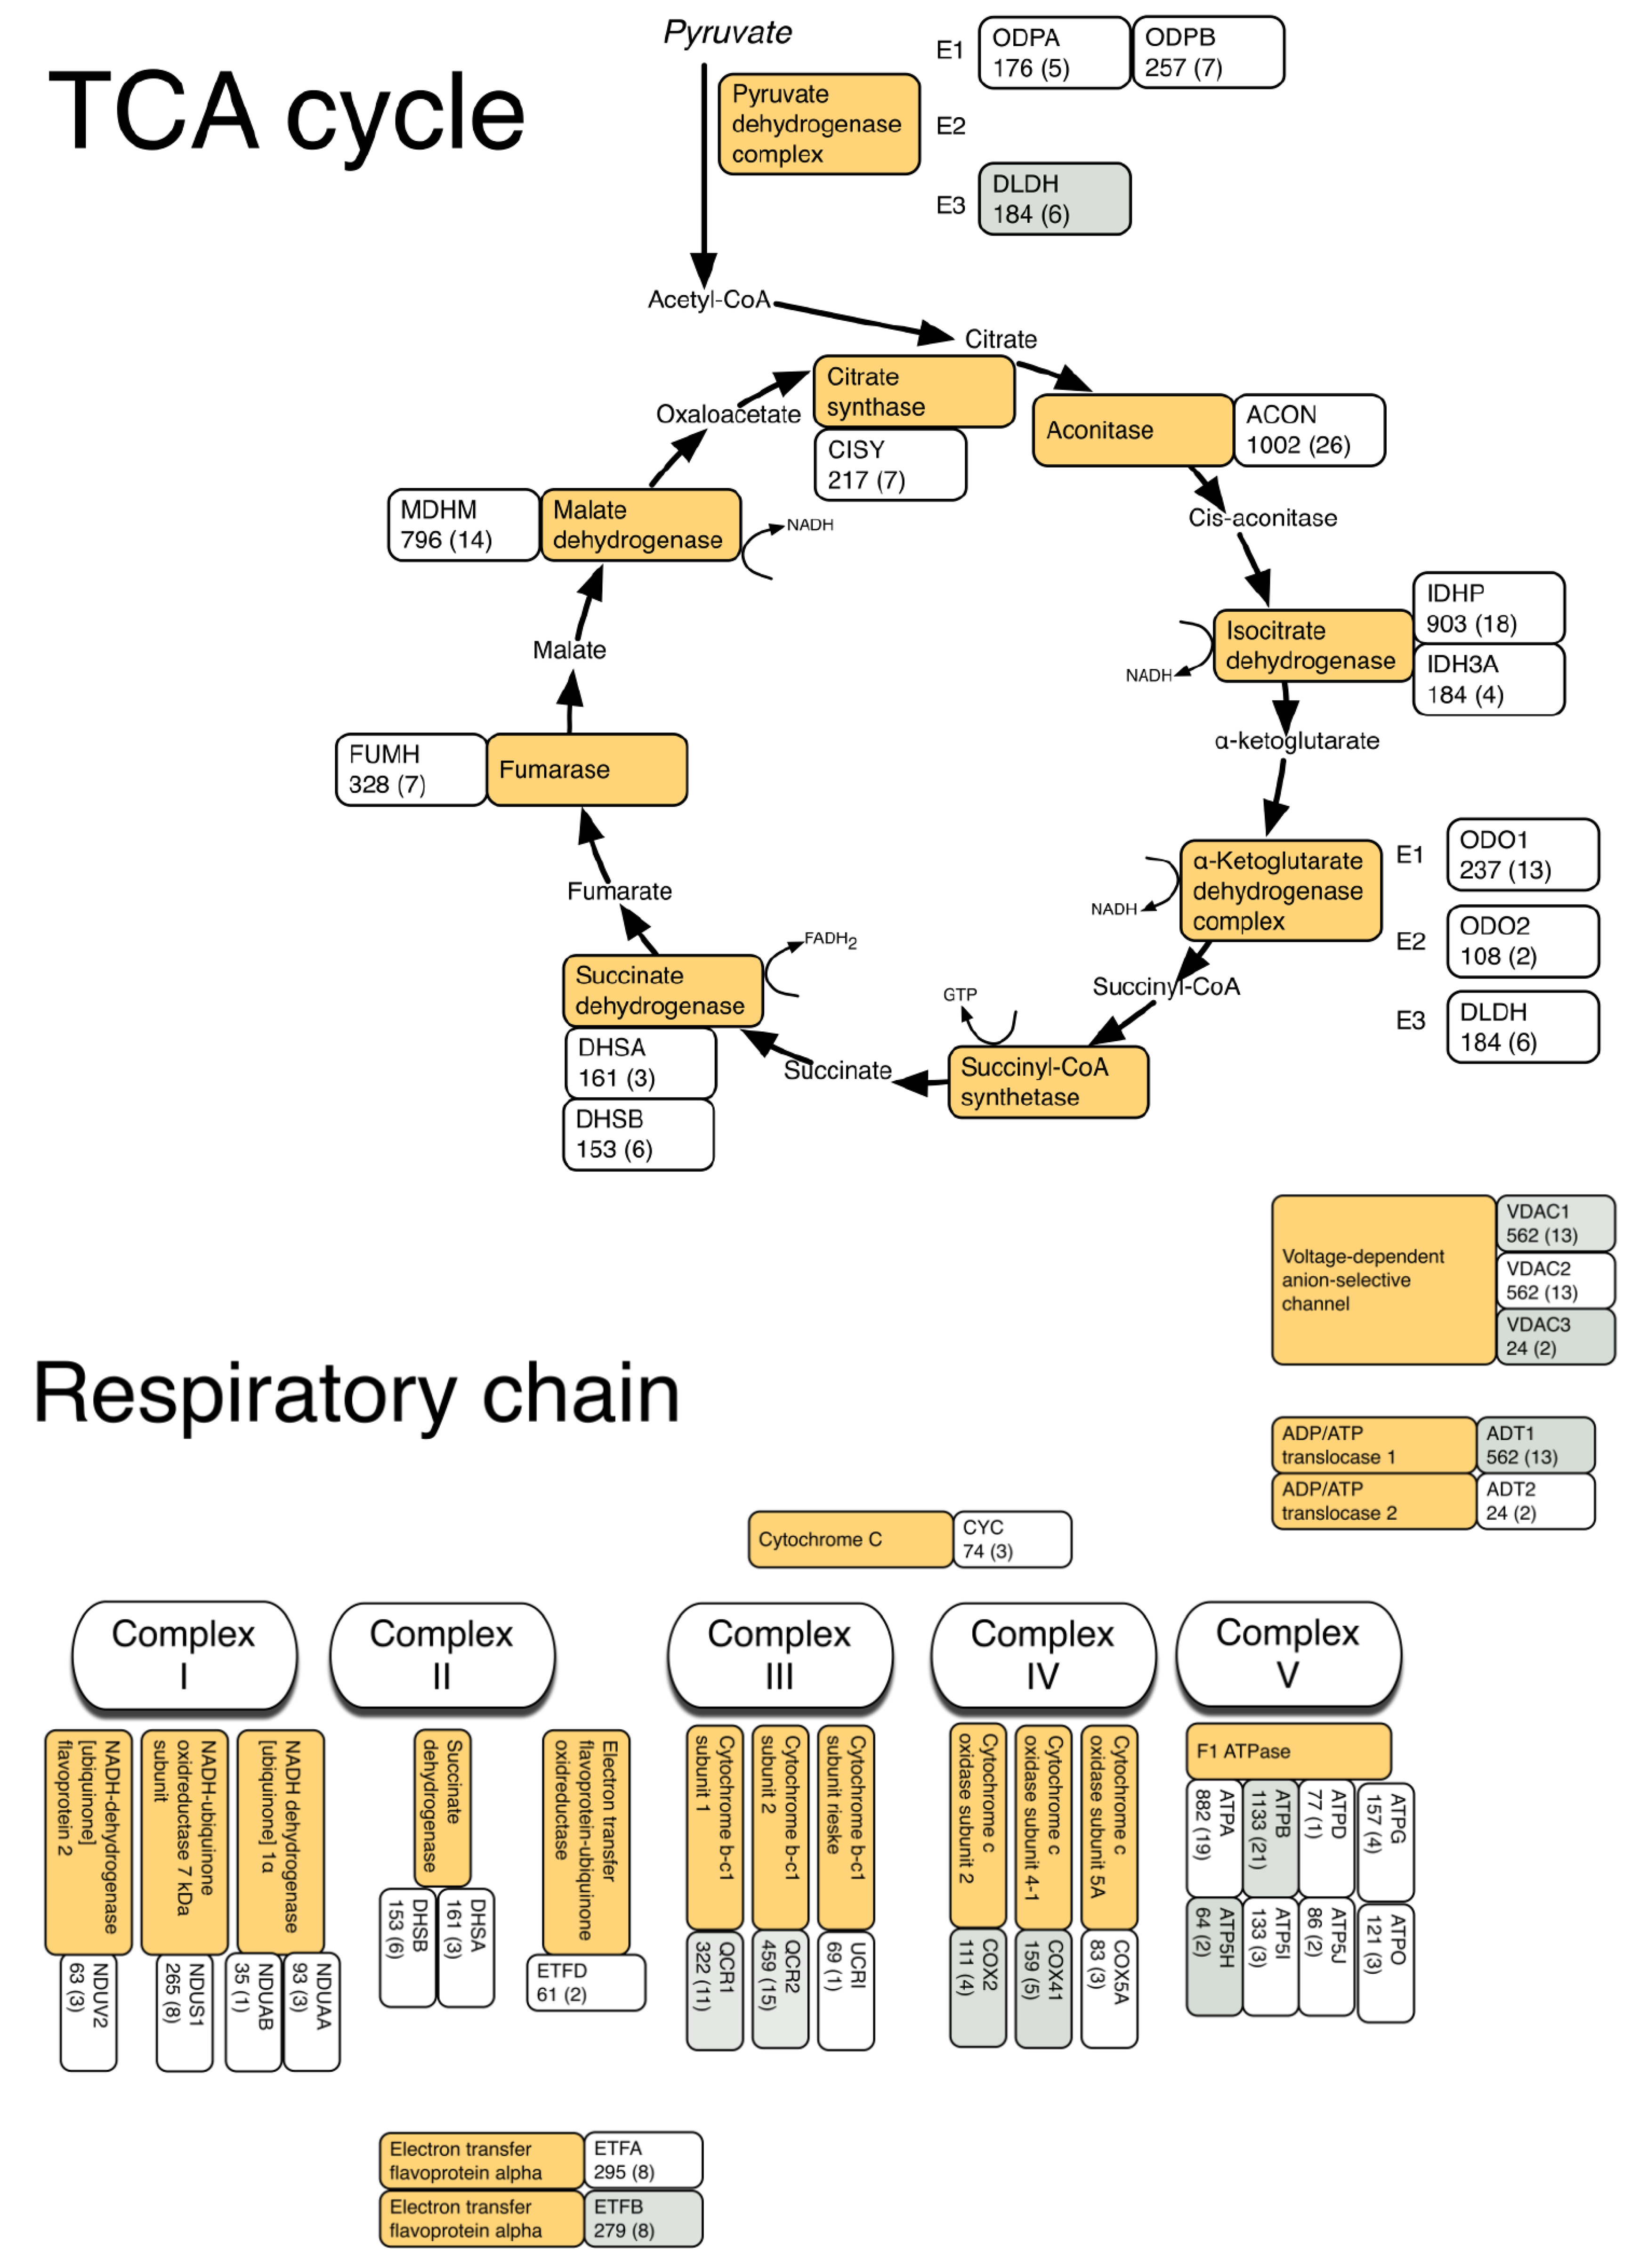
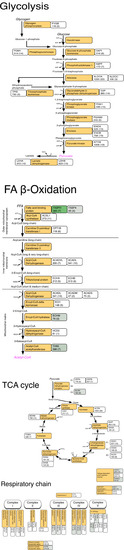
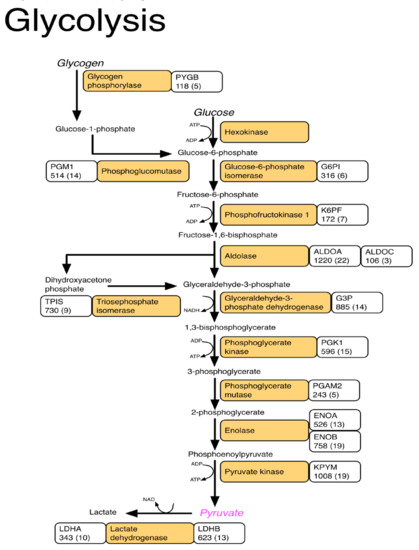
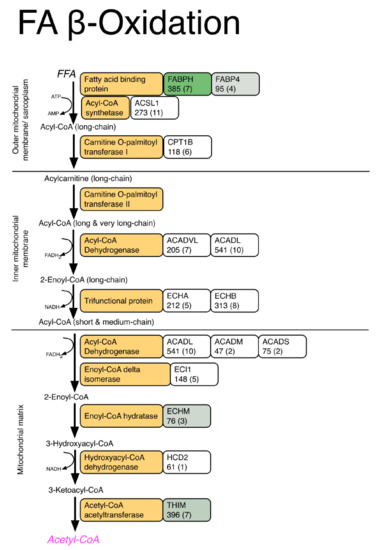
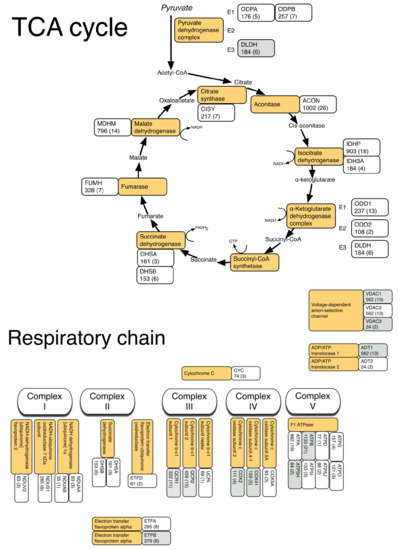
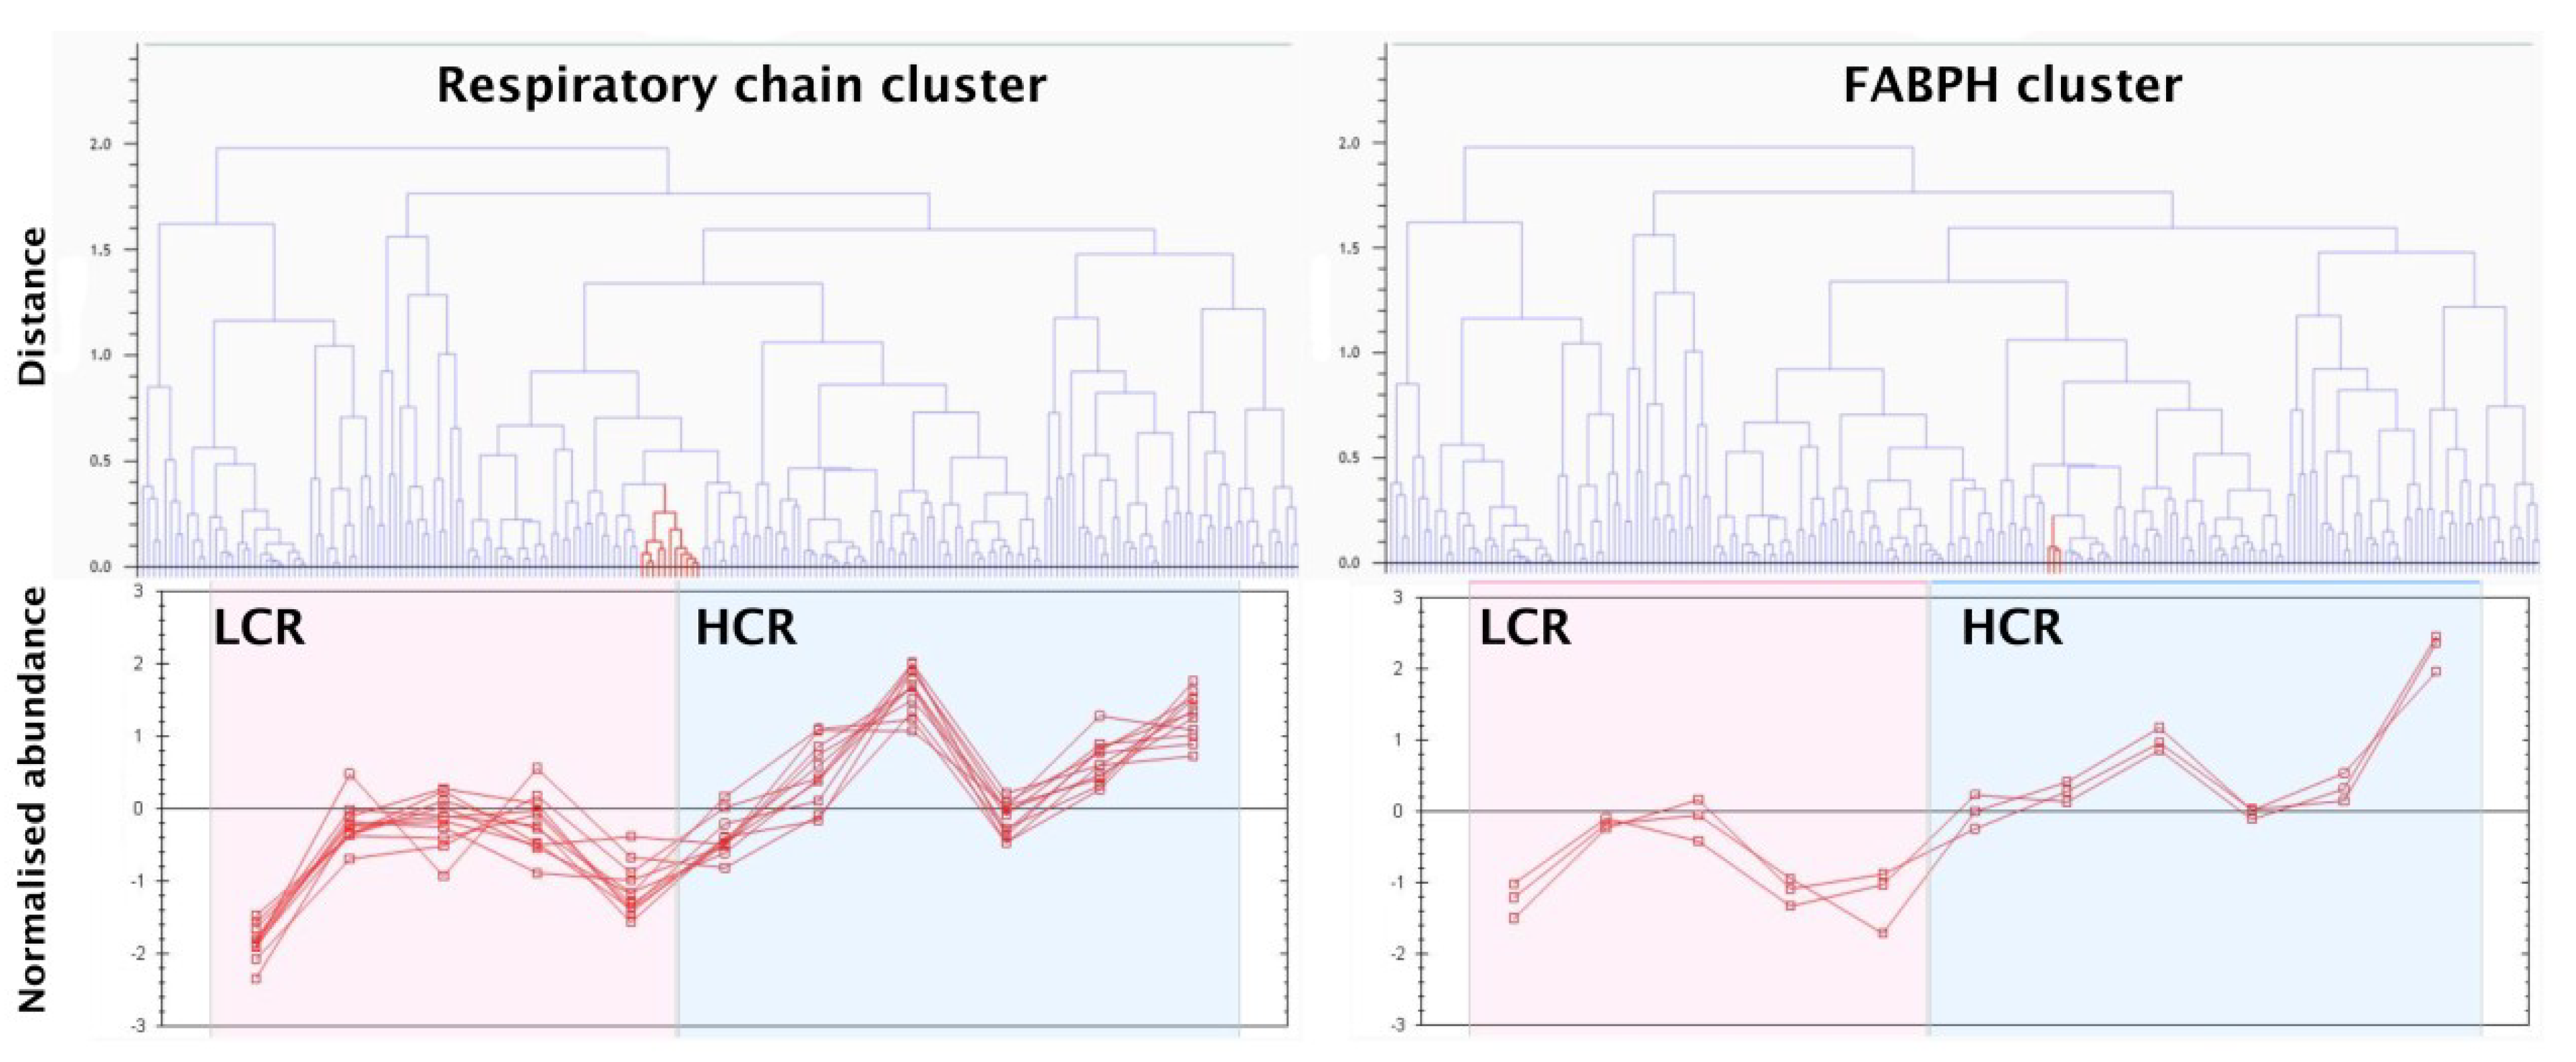
3. Results
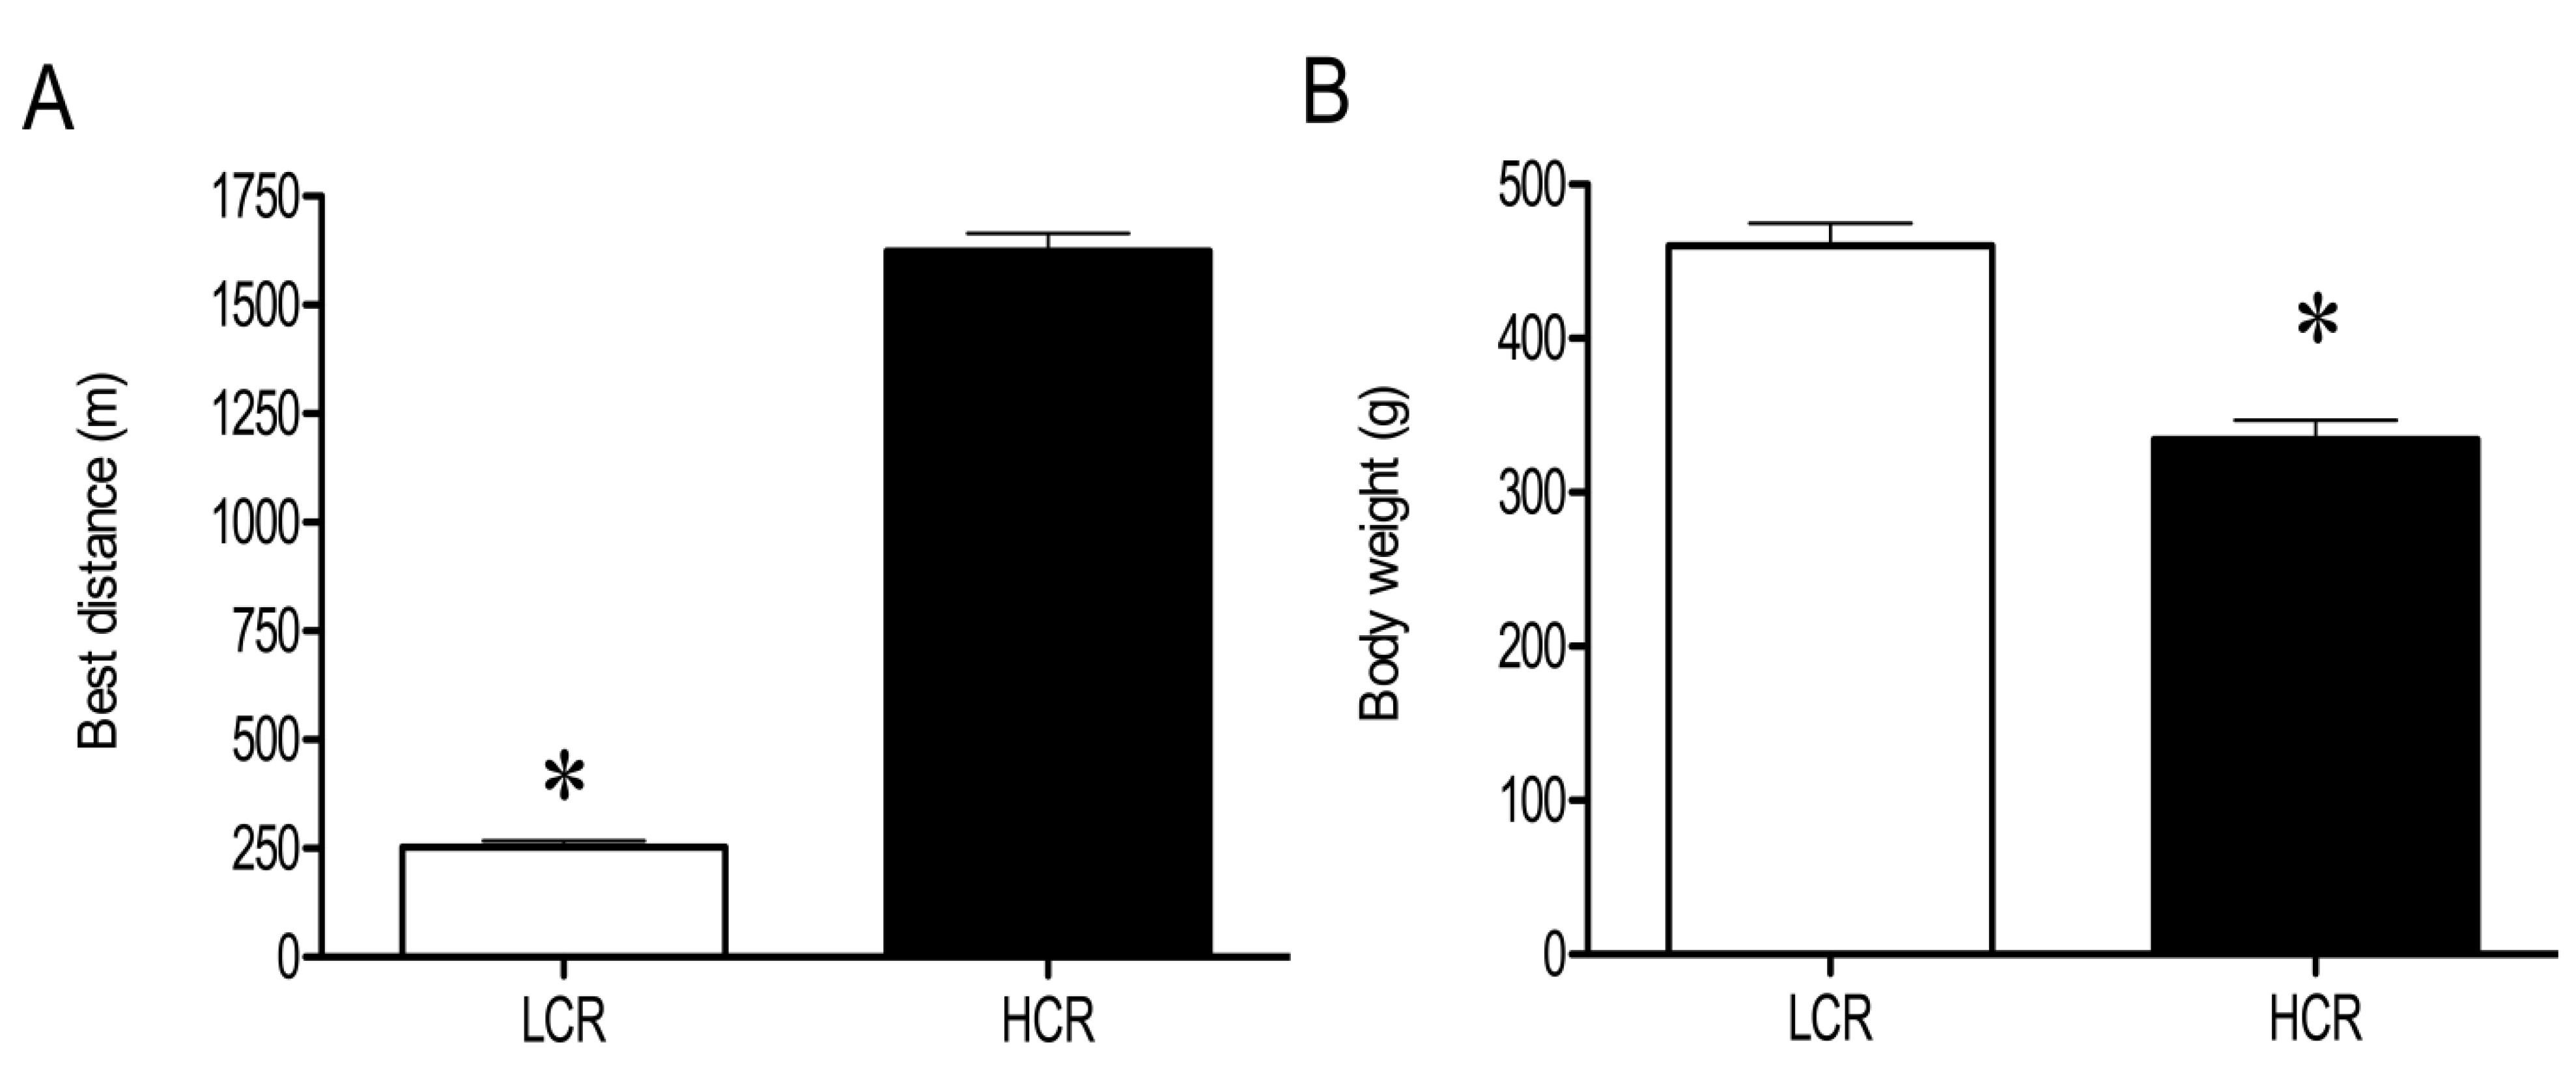
3.1. Physical and Physiological Characteristics of HCR and LCR Rats
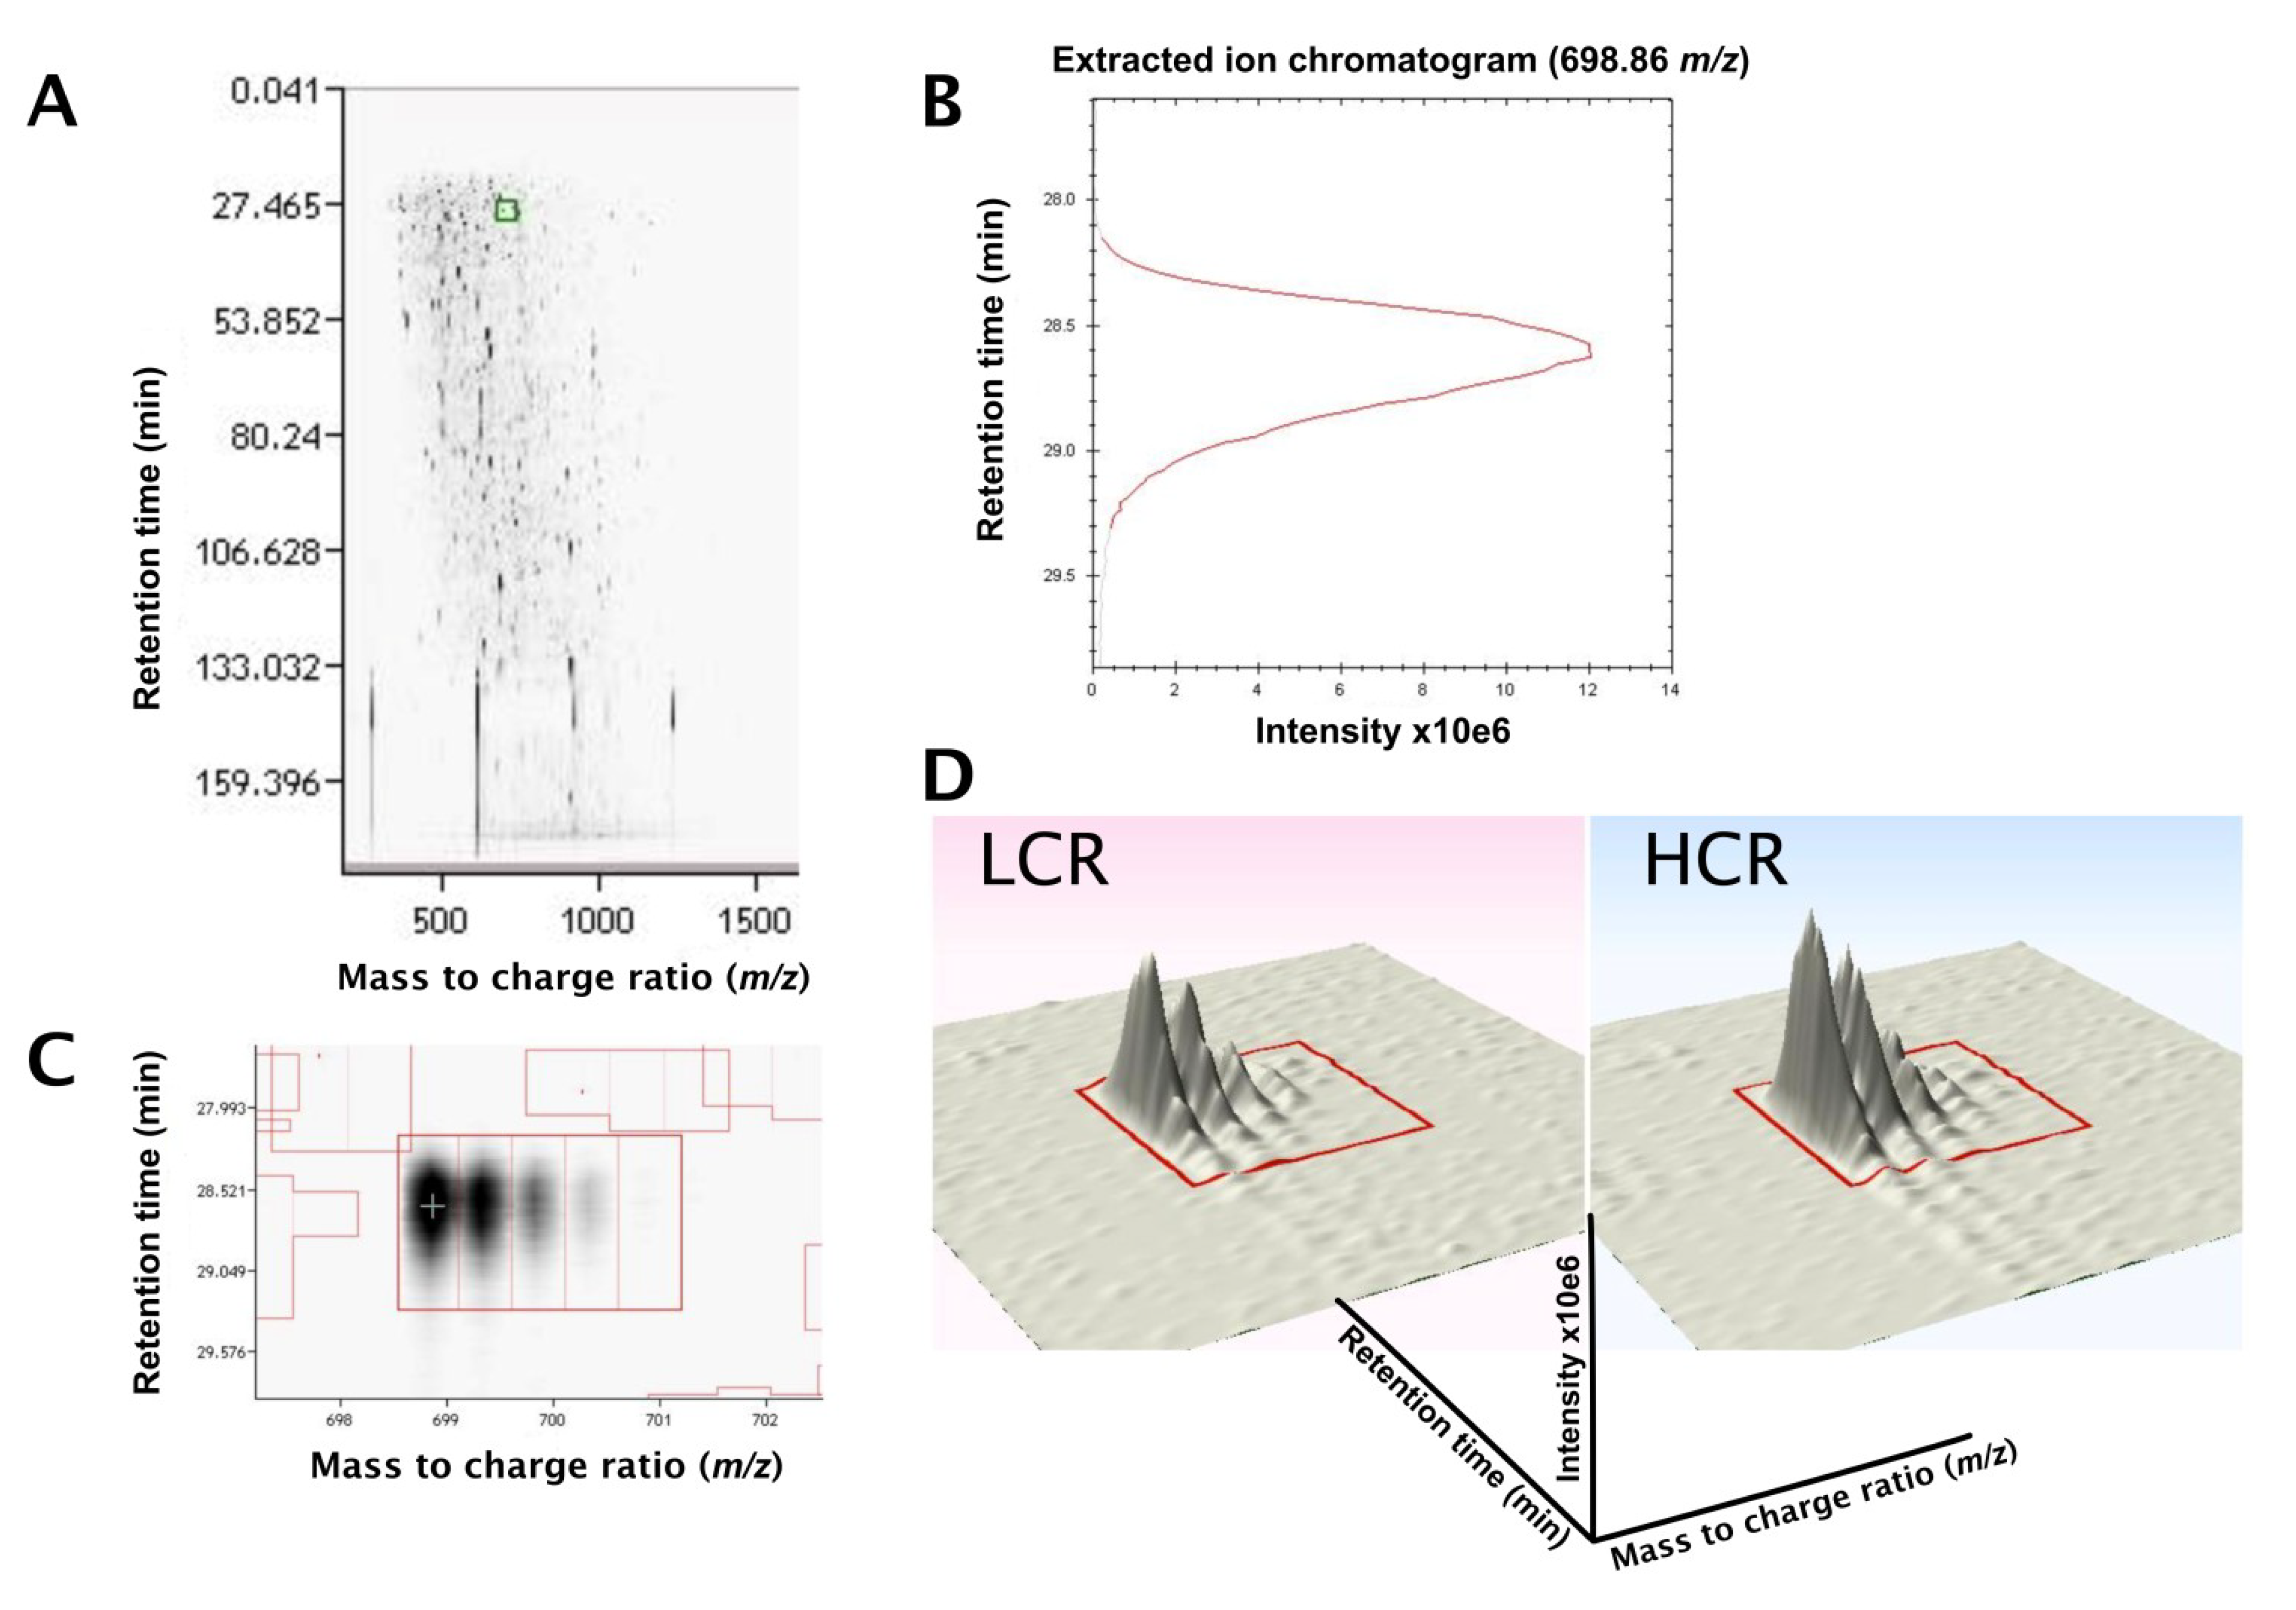
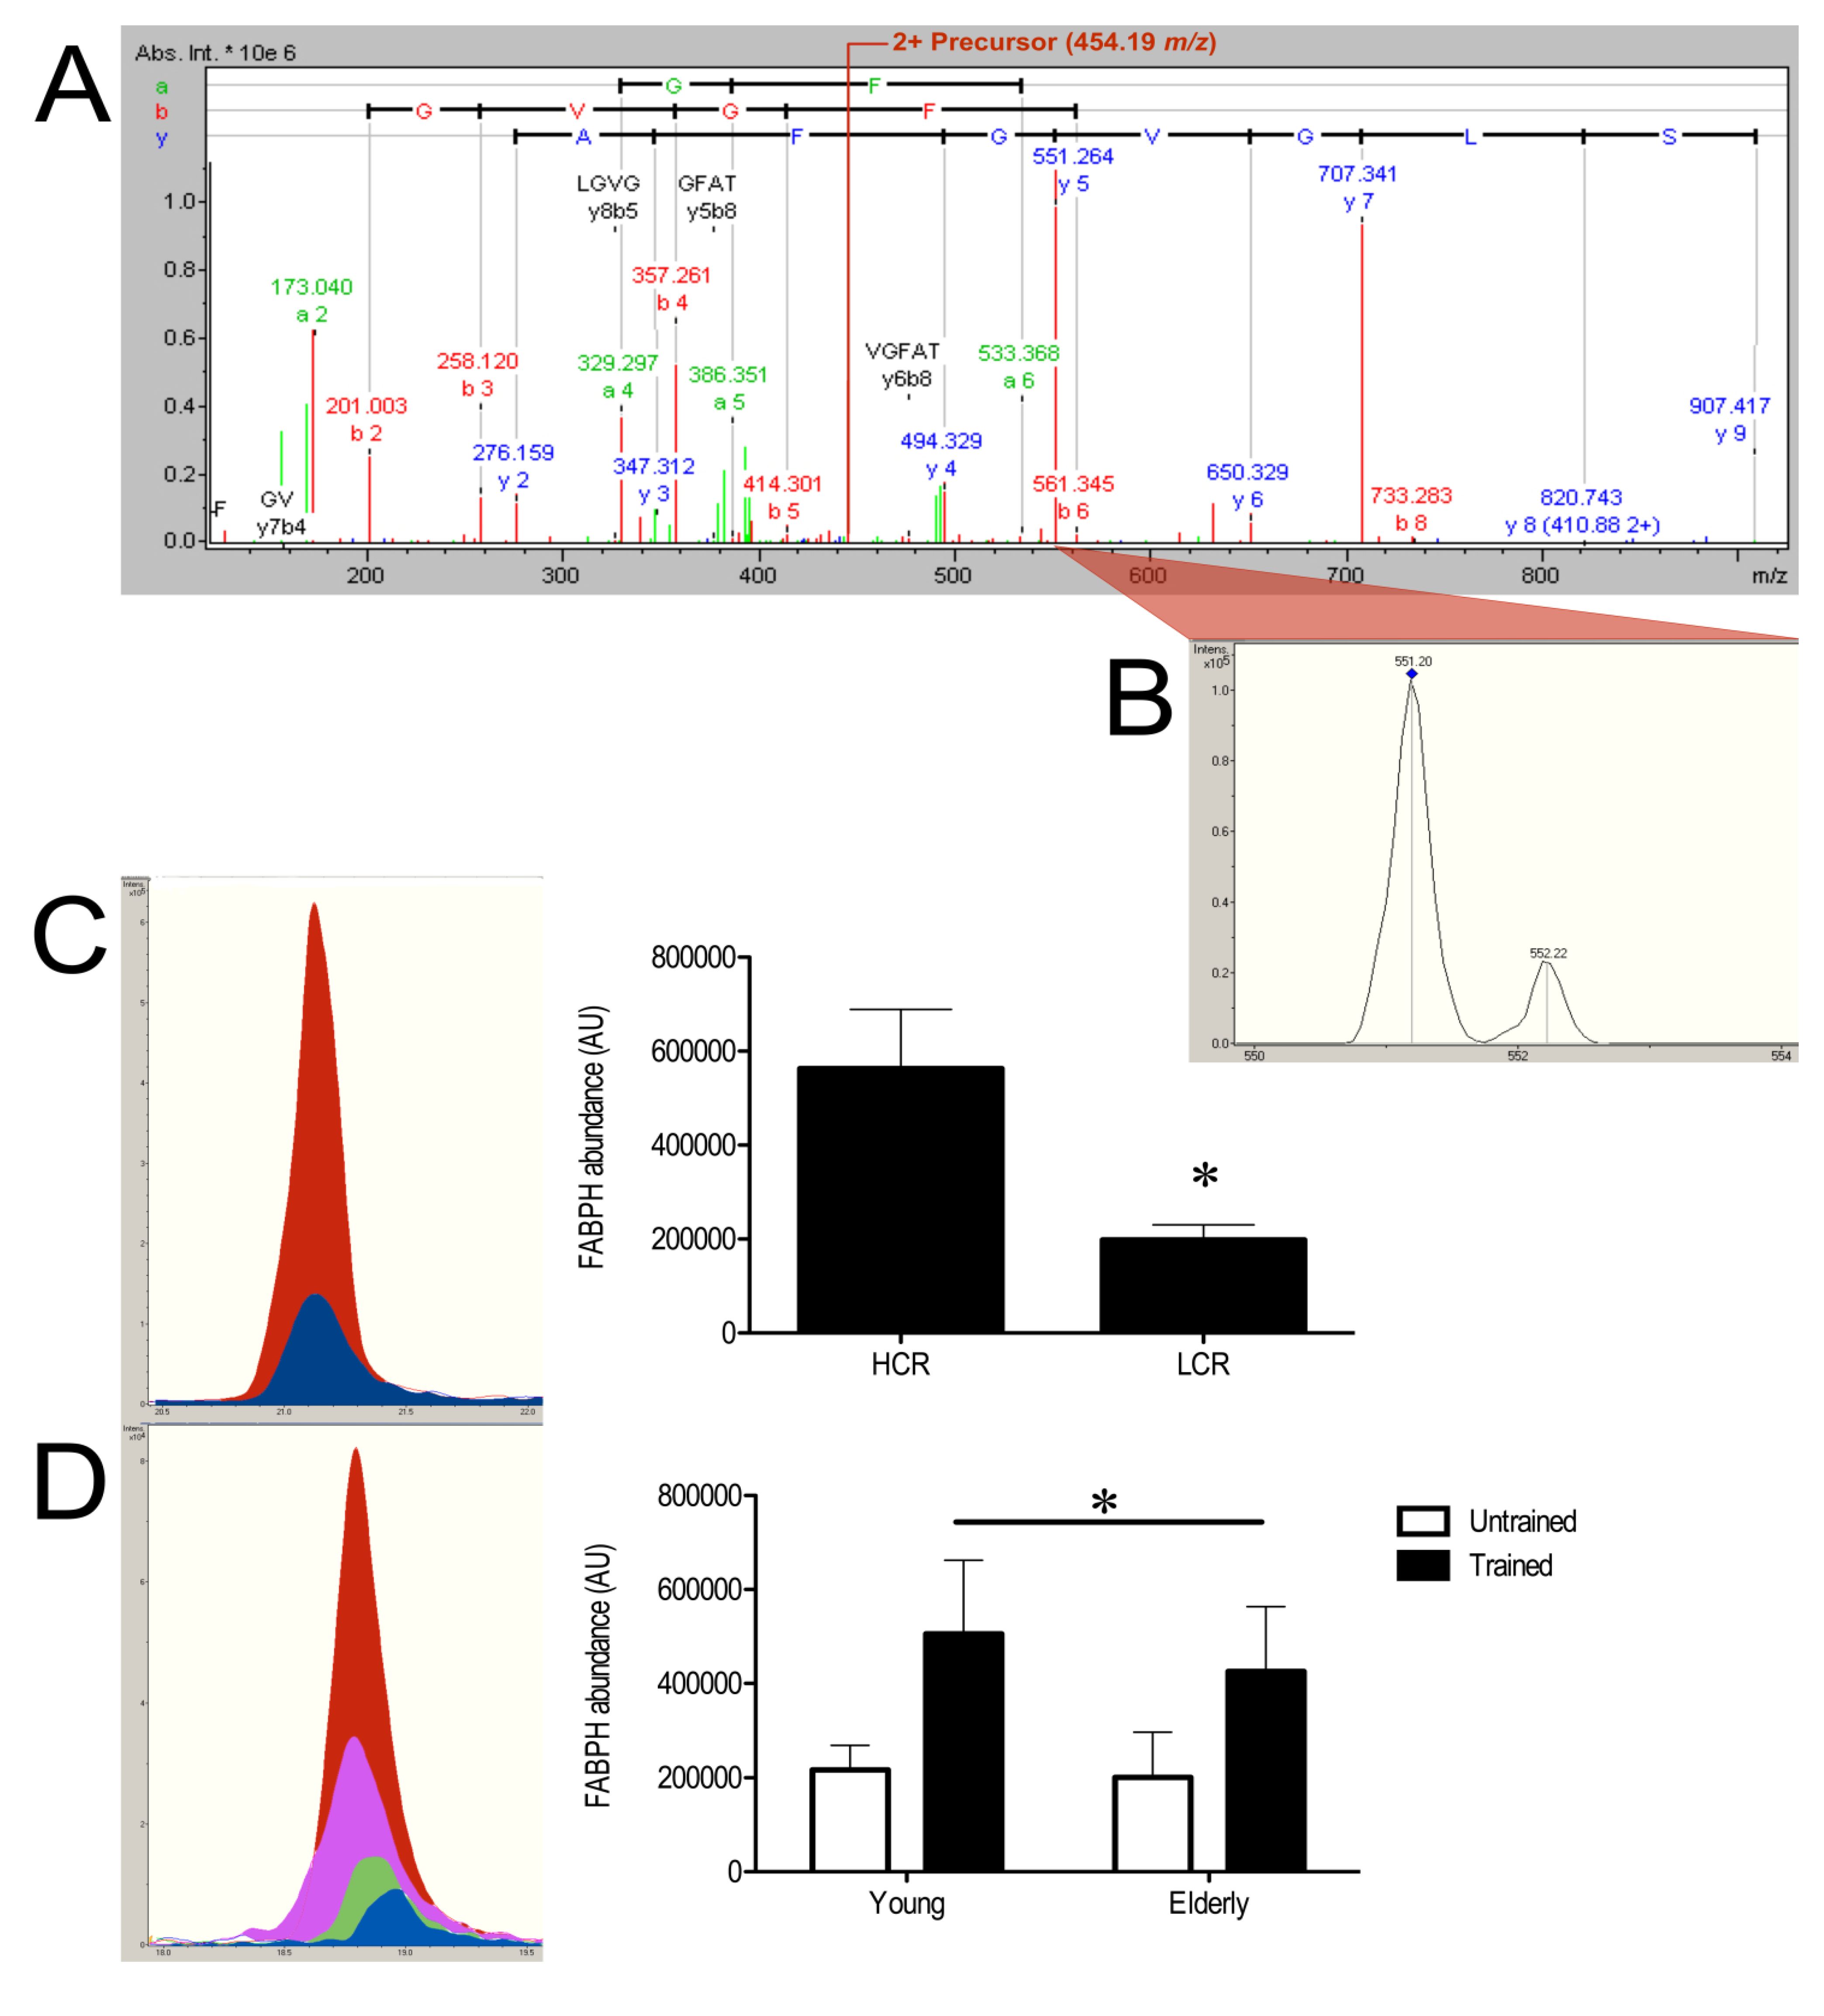
3.2. LC-MS Profiling of Soluble Muscle Proteins


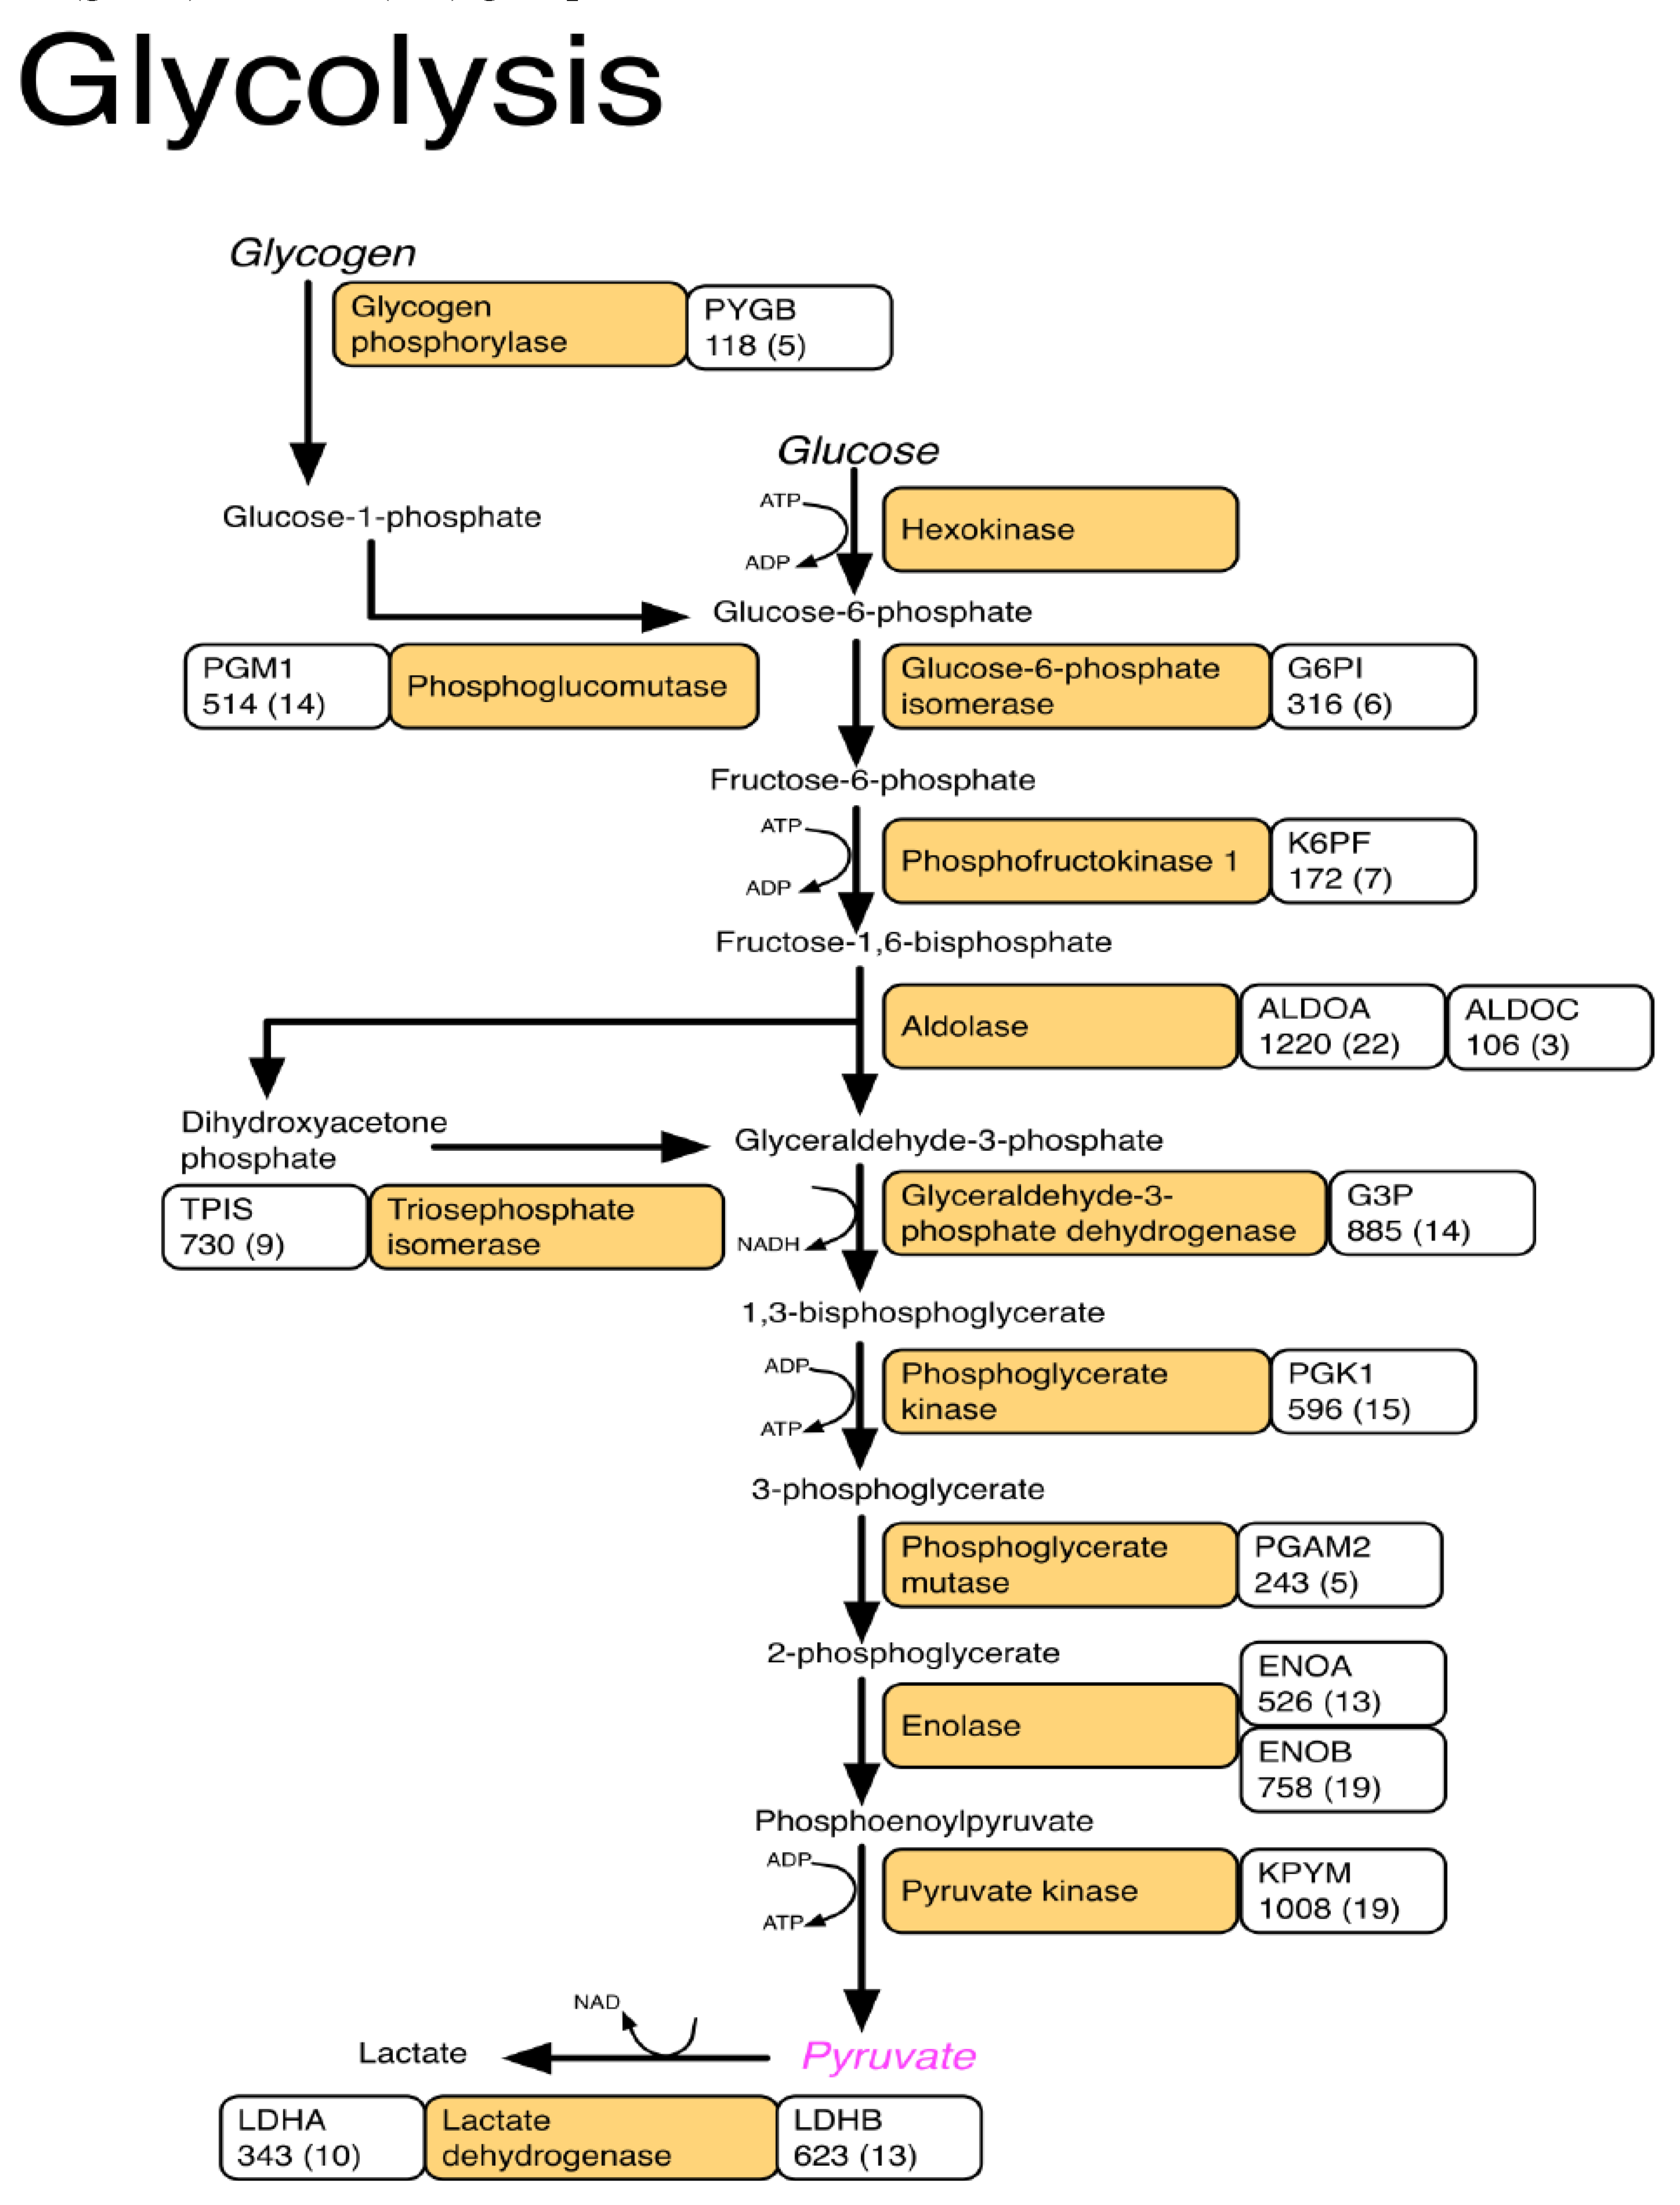
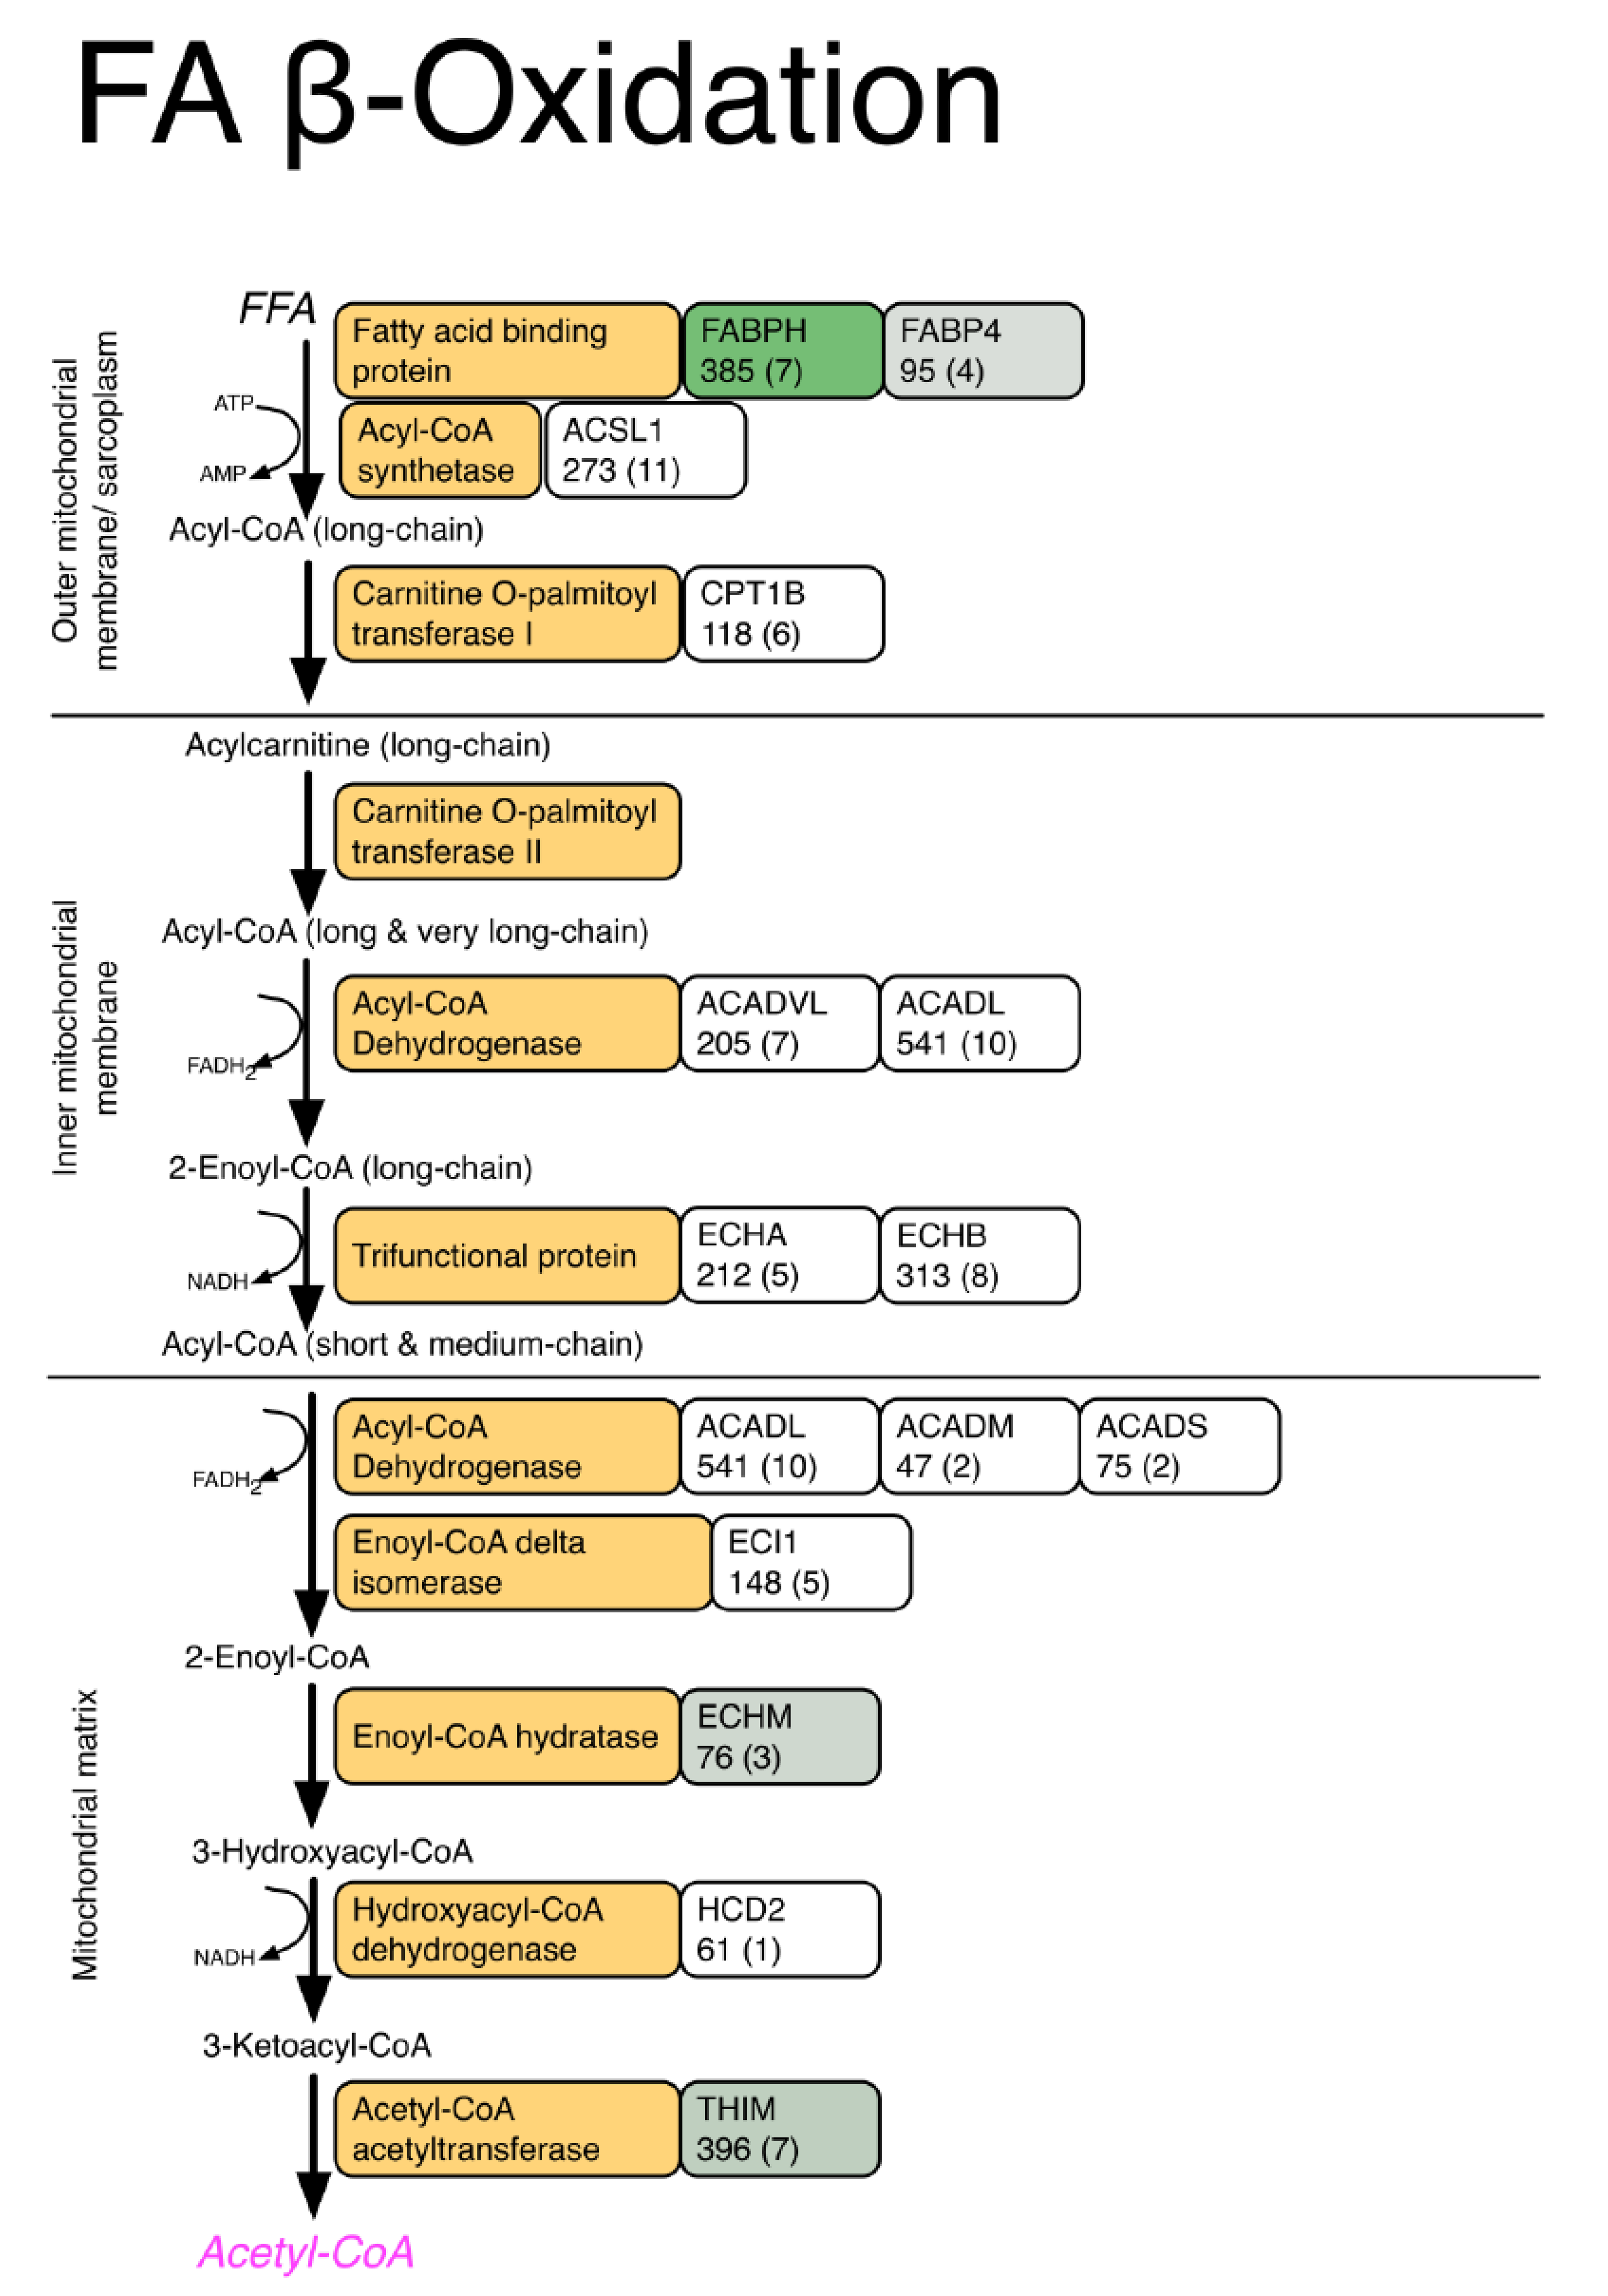
| Description | Database ID | MOWSE (peptides) | Relative Abundance LCR | Relative Abundance HCR | Fold Diff. | p value |
|---|---|---|---|---|---|---|
| Respiratory chain | ||||||
| Complex III | ||||||
| Cytochrome b-c1 complex subunit 1 | QCR1 | 322 (11) | 109.87 ± 8.8 | 121.26 ± 5 | 1.10 | 0.0274 |
| Cytochrome b-c1 complex subunit 2 | QCR2 | 459 (15) | 166.77 ± 10.6 | 182.25 ± 8.7 | 1.09 | 0.0290 |
| Complex IV | ||||||
| Cytochrome c oxidase subunit 2 | COX2 | 111 (4) | 50.93 ± 4.2 | 58.16 ± 5.9 | 1.14 | 0.0458 |
| Cytochrome c oxidase subunit 4 isoform 1 | COX41 | 159 (5) | 68.78 ± 5 | 79.39 ± 7.3 | 1.15 | 0.0206 |
| Complex V | ||||||
| ATP synthase subunit beta | ATPB | 1185 (21) | 740.15 ± 66.1 | 843.71 ± 69.4 | 1.14 | 0.0326 |
| ATP synthase subunit d | ATP5H | 64 (2) | 40.96 ± 2.8 | 47.47 ± 3.4 | 1.16 | 0.0081 |
| ADP/ATP translocase 1 | ADT1 | 562 (10) | 457.55 ± 45.4 | 528.89 ± 40.5 | 1.16 | 0.0232 |
| Voltage-dependent anion-selective channel protein 1 | VDAC1 | 412 (12) | 197.73 ± 13.1 | 221.68 ± 11.3 | 1.12 | 0.0111 |
| Voltage-dependent anion selective channel protein 3 | VDAC3 | 53 (4) | 45.82 ± 3.7 | 52.94 ± 3.9 | 1.16 | 0.0137 |
| Electron transfer flavoprotein subunit beta | ETFB | 279 (8) | 113.23 ± 8.6 | 128.03 ± 10.4 | 1.13 | 1.13 |
| Fatty acid transport | ||||||
| Fatty acid-binding protein, heart | FABPH | 349 (7) | 328.72 ± 62.3 | 504.97 ± 116.5 | 1.54 | 0.0064 |
| Fatty acid-binding protein, adipocyte | FABP4 | 95 (4) | 48.06 ± 5.2 | 55.47 ± 5.7 | 1.15 | 0.0426 |
| Methylmalonate-semialdehyde dehydrogenase | MMSA | 115 (5) | 55.59 ± 2 | 58.63 ± 5 | 1.05 | 0.0235 |
| Dihydrolipoyl dehydrogenase | DLDH | 184 (6) | 57.83 ± 3.8 | 66.78 ± 4.9 | 1.15 | 0.0077 |
| 3-Ketoacyl-CoA thiolase | THIM | 396 (7) | 89.21 ± 10.6 | 111.88 ± 11.4 | 1.25 | 0.0071 |
| Enoyl-CoA hydratase | ECHM | 76 (3) | 21.76 ± 2.2 | 25.97 ± 3.1 | 1.19 | 0.0245 |
3.3. SRM Verification of FABPH

4. Discussion
5. Conclusions
Supplementary Materials
Supplementary File 1Acknowledgments
Conflicts of Interest
References and Notes
- Holloway, K.V.; O’Gorman, M.; Woods, P.; Morton, J.P.; Evans, L.; Cable, N.T.; Goldspink, D.F.; Burniston, J.G. Proteomic investigation of changes in human vastus lateralis muscle in response to interval-exercise training. Proteomics 2009, 9, 5155–5174. [Google Scholar] [CrossRef]
- Staunton, L.; Zweyer, M.; Swandulla, D.; Ohlendieck, K. Mass spectrometry-based proteomic analysis of middle-aged vs. aged vastus lateralis reveals increased levels of carbonic anhydrase isoform 3 in senescent human skeletal muscle. Int. J. Mol. Med. 2012, 30, 723–733. [Google Scholar]
- Moriggi, M.; Vasso, M.; Fania, C.; Capitanio, D.; Bonifacio, G.; Salanova, M.; Blottner, D.; Ritweger, J.; Felsenberg, D.; Cerretelli, P.; et al. Long term bed rest with and without vibration exercise countermeasures: Effects on human muscle protein dysregulation. Proteomics 2010, 10, 3756–3774. [Google Scholar] [CrossRef]
- Hittel, D.S.; Hathout, Y.; Hoffman, E.P.; Houmard, J.A. Proteome analysis of skeletal muscle from obese and morbidly obese women. Diabetes 2005, 54, 1283–1288. [Google Scholar] [CrossRef]
- Isfort, R.J.; Hinkle, R.T.; Jones, M.B.; Wang, F.; Greis, K.D.; Sun, Y.; Keough, T.W.; Anderson, N.L.; Sheldon, R.J. Proteomic analysis of the atrophying rat soleus muscle following denervation. Electrophoresis 2000, 21, 2228–2234. [Google Scholar] [CrossRef]
- Donoghue, P.; Doran, P.; Wynne, K.; Pedersen, K.; Dunn, M.J.; Ohlendieck, K. Proteomic profiling of chronic low-frequency stimulated fast muscle. Proteomics 2007, 7, 3417–3430. [Google Scholar] [CrossRef]
- Jungblut, P.; Holzhütter, H.; Apweiler, R.; Schlüter, H. The speciation of the proteome. Chem. Cent. J. 2008, 2, 1–10. [Google Scholar] [CrossRef]
- Parker, K.C.; Walsh, R.; Salajegheh, M.; Amato, A.; Krastins, B.; Sarracino, D.A.; Greenberg, S.A. Characterization of human skeletal muscle biopsy samples using shotgun proteomics. J. Proteome Res. 2009, 8, 3265–3277. [Google Scholar] [CrossRef]
- Hojlund, K.; Yi, Z.; Hwang, H.; Bowen, B.; Lefort, N.; Flynn, C.R.; Langlais, P.; Weintraub, S.T.; Mandarino, L.J. Characterization of the human skeletal muscle proteome by one-dimensional Gel electrophoresis and HPLC-ESI-MS/MS. Mol. Cell. Proteomics 2007, 7, 257–267. [Google Scholar] [CrossRef]
- Hussey, S.E.; Sharoff, C.G.; Garnham, A.; Zhengping, Y.; Bowen, B.P.; Mandarino, L.J.; Hargreaves, M. Effect of exercise on the skeletal muscle proteome in patients with type 2 diabetes. Med. Sci. Sports Exerc. 2012, 45, 1069–1076. [Google Scholar]
- Pette, D. Metabolic heterogeneity of muscle fibres. J. Exp. Biol. 1985, 115, 179–189. [Google Scholar]
- Gelfi, C.; Vigano, A.; Ripamonti, M.; Pontoglio, A.; Begum, S.; Pellegrino, M.A.; Grassi, B.; Bottinelli, R.; Wait, R.; Cerretelli, P. The human muscle proteome in aging. J. Proteome Res. 2006, 5, 1344–1353. [Google Scholar] [CrossRef]
- Holloszy, J.O. Biochemical adaptations in muscle. Effects of exercise on mitochondrial oxygen uptake and respiratory enzyme activity in skeletal muscle. J. Biol. Chem. 1967, 242, 2278–2282. [Google Scholar]
- Kornberg, M.D.; Sen, N.; Hara, M.R.; Juluri, K.R.; Nguyen, J.V.K.; Snowman, A.M.; Law, L.; Hester, J.D.; Snyder, S.H. GAPDH mediates nitrosylation of nuclear proteins. Nat. Cell. Biol. 2010, 12, 1094–1100. [Google Scholar] [CrossRef]
- Koch, L.G.; Britton, S.L. Artificial selection for intrinsic aerobic endurance running capacity in rats. Physiol. Genomics 2001, 5, 45–52. [Google Scholar]
- Burniston, J.G.; Kenyani, J.; Wastling, J.M.; Burant, C.F.; Qi, N.R.; Koch, L.G.; Britton, S.L. Proteomic analysis reveals perturbed energy metabolism and elevated oxidative stress in hearts of rats with inborn low aerobic capacity. Proteomics 2011, 11, 3369–3379. [Google Scholar] [CrossRef]
- Kivelä, R.; Silvennoinen, M.; Lehti, M.; Rinnankoski-Tuikka, R.; Purhonen, T.; Ketola, T.; Pullinen, K.; Vuento, M.; Mutanen, N.; Sartor, M.A.; et al. Gene expression centroids that link with low intrinsic aerobic exercise capacity and complex disease risk. FASEB J. 2010, 24, 4565–4574. [Google Scholar] [CrossRef]
- Huang, D.A.W.; Sherman, B.T.; Lempicki, R.A. Systematic and integrative analysis of large gene lists using DAVID bioinformatics resources. Nat. Protoc. 2009, 4, 44–57. [Google Scholar]
- Kanehisa, M.; Goto, S. KEGG: Kyoto encyclopedia of genes and genomes. Nucleic Acids Res. 2000, 28, 27–30. [Google Scholar] [CrossRef]
- Zhen, E.Y.; Berna, M.J.; Jin, Z.; Pritt, M.L.; Watson, D.E.; Ackermann, B.L.; Hale, J.E. Quantification of heart fatty acid binding protein as a biomarker for drug-induced cardiac and musculoskeletal necroses. Proteomics Clin. Appl. 2007, 1, 661–671. [Google Scholar] [CrossRef]
- Cobley, N.; Bartlett, J.D.; Kayani, A.; Murray, S.W.; Louhelainen, J.; Donovan, T.; Waldron, S.; Gregson, W.; Burniston, J.G.; Morton, J.P.; et al. PGC-1α transcriptional response and mitochondrial adaptation to acute exercise is maintained in skeletal muscle of sedentary elderly males. Biogerontology 2012, 13, 621–631. [Google Scholar] [CrossRef]
- Koch, L.G.; Kemi, O.J.; Qi, N.; Leng, S.X.; Bijma, P.; Gilligan, L.J.; Wilkinson, J.E.; Wisloff, H.; Hoydal, M.A.; Rolim, N.; et al. Intrinsic aerobic capacity sets a divide for aging and longevity. Circ. Res. 2011, 109, 1162–1172. [Google Scholar] [CrossRef]
- Rivas, D.A.; Lessard, S.J.; Saito, M.; Friedhuber, A.M.; Koch, L.G.; Britton, S.L.; Yasoelkis, B.B.; Hawley, J.A. Low intrinsic running capacity is associated with reduced skeletal muscle substrate oxidation and lower mitochondrial content in white skeletal muscle. Am. J. Physiol. Regul. Integr. Comp. Physiol. 2011, 300, R835–R843. [Google Scholar] [CrossRef]
- Seifert, E.L.; Bastianelli, M.; Aguer, C.; Moffat, C.; Estey, C.; Koch, L.G.; Britton, S.L.; Harper, M.-E. Intrinsic aerobic capacity correlates with inherent mitochondrial oxidative and H2O2 emission capacities without major shifts in myosin heavy chain isoform. J. Appl. Physiol. 2012, 113, 1624–1634. [Google Scholar]
- Noland, R.C.; Thyfault, J.P.; Henes, S.T.; Whitfield, B.R.; Woodlief, T.L.; Evan, J.R.; Lust, J.A.; Britton, S.L.; Koch, L.G.; Dudek, R.W.; et al. Artificial selection for high-capacity endurance running is protective against high-fat diet-induced insulin resistance. Am. J. Physiol. Endocrinol. Metab. 2007, 293, E31–E41. [Google Scholar] [CrossRef]
- Wisloff, U.; Najjar, S.M.; Ellingsen, O.; Haram, P.M.; Swoap, S.; Al-Sahre, Q.; Frenstrom, M.; Razaei, K.; Lee, S.J.; Koch, L.G.; et al. Cardiovascular risk factors emerge after artificial selection for low aerobic capacity. Science 2005, 307, 418–420. [Google Scholar] [CrossRef]
- Burniston, J.G.; Hoffman, E.P. Proteomic responses of skeletal and cardiac muscle to exercise. Expert Rev. Proteomics 2011, 8, 361–377. [Google Scholar] [CrossRef]
- Bell, R.; Hubbard, A.; Chettier, R.; Chen, D.; Miller, J.P.; Kapahi, P.; Tarnopolsky, M.; Sahasrabuhde, S.; Melov, S.; Hughes, R.E. A human protein interaction network shows conservation of aging processes between human and invertebrate species. PLoS Genet. 2009, 5, e1000414. [Google Scholar] [CrossRef]
- Han, B.; Higgs, R.E. Proteomics: From hypothesis to quantitative assay on a single platform. Guidelines for developing MRM assays using ion trap mass spectrometers. Brief. Funct. Genomic Proteomic. 2008, 7, 340–354. [Google Scholar] [CrossRef]
- Binas, B.; Erol, E. FABPs as determinants of myocellular and hepatic fuel metabolism. Mol. Cell. Biochem. 2007, 299, 75–84. [Google Scholar] [CrossRef]
- Shearer, J.; Fueger, P.T.; Rottman, J.N.; Bracy, D.P.; Binas, B.; Wasserman, D.H. Heart-type fatty acid-binding protein reciprocally regulates glucose and fatty acid utilization during exercise. Am. J. Physiol. Endocrinol. Metab. 2005, 288, E292–E297. [Google Scholar] [CrossRef]
- Shaw, C.S.; Clark, J.; Wagenmakers, A.J. The effect of exercise and nutrition on intramuscular fat metabolism and insulin sensitivity. Annu. Rev. Nutr. 2010, 30, 13–34. [Google Scholar] [CrossRef]
- Doran, P.; Donoghue, P.; O’Connell, K.; Gannon, J.; Ohlendieck, K. Proteomics of skeletal muscle aging. Proteomics 2009, 9, 989–1003. [Google Scholar] [CrossRef]
- Gannon, J.; Doran, P.; Kirwan, A.; Ohlendieck, K. Drastic increase of myosin light chain MLC-2 in senescent skeletal muscle indicates fast-to-slow fibre transition in sarcopenia of old age. Eur. J. Cell. Biol. 2009, 88, 685–700. [Google Scholar] [CrossRef]
© 2013 by the authors; licensee MDPI, Basel, Switzerland. This article is an open access article distributed under the terms and conditions of the Creative Commons Attribution license (http://creativecommons.org/licenses/by/3.0/).
Share and Cite
Malik, Z.A.; Cobley, J.N.; Morton, J.P.; Close, G.L.; Edwards, B.J.; Koch, L.G.; Britton, S.L.; Burniston, J.G. Label-Free LC-MS Profiling of Skeletal Muscle Reveals Heart-Type Fatty Acid Binding Protein as a Candidate Biomarker of Aerobic Capacity. Proteomes 2013, 1, 290-308. https://doi.org/10.3390/proteomes1030290
Malik ZA, Cobley JN, Morton JP, Close GL, Edwards BJ, Koch LG, Britton SL, Burniston JG. Label-Free LC-MS Profiling of Skeletal Muscle Reveals Heart-Type Fatty Acid Binding Protein as a Candidate Biomarker of Aerobic Capacity. Proteomes. 2013; 1(3):290-308. https://doi.org/10.3390/proteomes1030290
Chicago/Turabian StyleMalik, Zulezwan A., James N. Cobley, James P. Morton, Graeme L. Close, Ben J. Edwards, Lauren G. Koch, Steven L. Britton, and Jatin G. Burniston. 2013. "Label-Free LC-MS Profiling of Skeletal Muscle Reveals Heart-Type Fatty Acid Binding Protein as a Candidate Biomarker of Aerobic Capacity" Proteomes 1, no. 3: 290-308. https://doi.org/10.3390/proteomes1030290