1. Introduction
Skeletal muscle accounts for ~40% of adult body mass and, in addition to its obvious function in movement, muscle has important roles in glucose homeostasis and protein metabolism. For example, in healthy individuals muscle is responsible for >75% of insulin-mediated glucose disposal and ~60% of total body protein turnover. Therefore, maintaining adequate muscle mass and function are important factors that impact long-term health. Age-related losses in muscle mass lead to frailty and loss of independence, and so directly impact an individual’s quality of life. Moreover, those individuals with the greatest level of muscle loss are more likely to be obese or suffer from metabolic disorders including impaired glucose tolerance [
1]. Furthermore, because skeletal muscle is the major repository of protein/amino acids that can be mobilised during starvation or injury, muscle loss is also an independent predictor of mortality in cachexia associated with diseases such as cancer and chronic heart failure [
2].
Muscle mass is determined by the historical balance between the synthesis and degradation of its constituent proteins. Synthesis of new protein
in vivo has traditionally been investigated by metabolic labelling using tracers such as the stable isotope labelled amino acid
l-[
ring-
13C
6]-phenylalanine e.g., [
3]. This enables the fraction of newly synthesised protein to be calculated from the precursor: product ratio. Incorporation of stable-isotope labelled amino acids in to protein
in vivo is most commonly combined with gas-chromatography mass spectrometry (GC-MS) analysis of hydrolysed amino acids to measure the average rate of synthesis in protein mixtures extracted from skeletal muscle of humans and non-human animal models [
4]. In rats, the average half-life of proteins is approximately 14 days in mixed-fibre locomotive muscles, whereas in slow-twitch postural muscles protein half-life is estimated to be 7 days [
5]. These values represent averages across the entire proteome and so are a gross simplification of events at an individual protein level. Indeed the average turnover rate may be misleading because turnover of the mitochondrial protein, cytochrome c, is more rapid in fast- than slow-twitch muscle [
6].
Protein synthesis and degradation are each intricate processes that are regulated independently and on a protein by protein basis to maintain homeostasis or to facilitate muscle adaptation. A greater understanding of synthesis rates at the individual protein level could significantly advance knowledge regarding differences in muscle phenotype and the adaptation of muscle to physiological and pathophysiological stimuli. Watt
et al. [
7] reports differences between fast-twitch muscle extensor digitorum longus (EDL) and slow-twitch soleus in rats during a 2-week regimen of high-intensity jump training. The growth rate of both EDL and soleus increased up to 70% when compared to control, but growth of the fast-twitch muscle was primarily achieved through greater (28%) protein synthesis, whereas in the soleus muscle protein synthesis did not change but there was a 38% decrease in protein degradation. While it is likely some proteins may not have followed these overall trends, until recently it has not been possible routinely to measure isotope incorporation (
i.e., synthesis) in large numbers of individual proteins. However, the application of proteomic separation techniques in striated muscle [
8] along with advances in the sensitivity of mass spectrometers now enable such work to be undertaken. For example, Jaleel
et al. [
9] reports metabolic labelling with
l-[
ring-
13C
6]-phenylalanine
in vivo and analysis of muscle mitochondria using 2-dimensional gel electrophoresis (2DGE). Gel spots were identified by peptide mass spectrometry, whereas incorporation of the stable isotope label was measured in mixtures of hydrolysed amino acids using GC-MS. The marriage of these established techniques enabled synthesis rates to be calculated for 68 mitochondrial proteins in rat skeletal muscle. Jaleel
et al. confirms the synthesis of proteins within a muscle differs on a protein by protein basis. Of the proteins investigated beta enolase had the greatest synthesis rate (11%/day) while myosin light chain regulatory had the lowest (3%/day), indicating an approximate 10-fold variation in protein synthesis rates across the proteins investigated.
A major shortcoming of amino acid tracer studies is that it is impractical to measure the true enrichment of the precursor pool (
i.e., aminoacyl-tRNA) directly. This combined with uncertainties regarding the transport of amino acids between intracellular and extracellular compartments, and recycling of amino acids from protein degradation, gives rise to uncertainty regarding the calculation of the renewal rate of the protein products. Secondly, amino acid tracers require intravenous infusion, which is invasive and therefore necessarily restricts the duration of such investigations. As a consequence, it is likely the average synthesis rates calculated from mixtures of muscle proteins are skewed toward that of the more rapidly synthesised proteins. Moreover, linear extrapolation of short-term (e.g., 30 min) incorporation of an amino acid tracer e.g., [
10] to longer time periods (e.g.,%/day) will further lead to overestimation because incorporation of labelled amino acid in to the protein product exhibits first-order (rise-to-plateau) kinetics. These shortcomings can be entirely overcome through the use of deuterium oxide (
2H
2O or “D
2O”) to label macromolecular precursors, including amino acids,
in vivo [
11].
2H
2O has the fundamental advantage that it can be administered via drinking water and labelling can be conducted in free-living animals over experimental periods spanning days or months [
12].
2H
2O equilibrates within the body water compartment rapidly (<30 min; in rodents) and H–C bonds of amino acids (principally alanine) become
2H-labelled intracellularly via transamination and/or de novo synthesis [
13]. Therefore, unlike amino acid tracers, enrichment of the precursor pool is not affected by amino acid metabolism, membrane transport or dilution effects from protein degradation. After incorporation in to newly synthesised protein the
2H-label is irreversible [
14] and can be quantified by GC-MS of amino acid hydrolysates (e.g., [
14]) or by peptide mass spectrometry of tryptic digests. For example, Xiao
et al. [
15] reports a method for determining protein synthesis using
2H
2O labelling
in vivo and matrix-assisted laser desorption ionisation–time of flight mass spectrometry (MALDI-TOF MS) of rat serum proteins. We have used a similar approach to investigate the synthesis of eight proteins in four striated muscles, including the heart, diaphragm, extensor digitorum longus (EDL) and soleus.
Striated muscles are highly specialised tissues that exhibit a broad range of different phenotypic properties particularly with regard to speed of contraction and fatigue resistance [
16]. The diversity of muscle phenotypes is largely due to differential expression of different isoforms of key contractile proteins, which concomitantly dictates the relative abundance of enzymes involved in substrate utilisation and energy production. In the past, we have reported the relative abundance of proteins in various rat striated muscles using proteomic techniques including 2DGE and MALDI-TOF MS e.g., [
17,
18,
19] but there is currently a lack of equivalent data regarding synthesis rates of rat muscle proteins. In particular, we sought to investigate whether the rank order of synthesis rates for a selection of proteins is similar across different striated muscles or if enzymes that exist at a greater concentration in a particular muscle also exhibit a more rapid rate of renewal.
2. Materials and Methods
Experimental procedures were conducted under the British Home Office Animals (Scientific Procedures) Act 1986 and were approved by the local ethical review committee. Male Wistar rats (352 ± 30 g body weight) were bred in-house in a conventional colony, housed in controlled conditions of 20 °C, 45% relative humidity, and a 12 h light (0600–1800 hours) and 12 h dark cycle, with water and food available ad libitum.
Animals were assigned to four groups (n = 3, in each), including a control group and three groups that received deuterium oxide (2H2O) for either 4 days, 7 days or 14 days. Deuterium administration was initiated by an intraperitoneal injection of 10 μL.g 99% 2H2O-saline, and was maintained by administration of 5% (v/v) 2H2O in drinking water, which was refreshed daily. Animals were asphyxiated with a rising concentration of CO2 and killed by cervical dislocation. Samples of the heart (HRT) and diaphragm (DIA), and the entire extensor digitorium longus (EDL) and soleus (SOL) were isolated. Each muscle was cleaned of fat and connective tissue and then weighed before being frozen in liquid nitrogen and stored at −80 °C.
Muscles were ground under liquid nitrogen and a portion (~100 mg) homogenised on ice in 10 volumes of 7 M urea, 2 M thiourea, 4% (w/v) CHAPS, 40 mM Tris pH 7.4 including phosphatase inhibitor and complete protease inhibitor cocktails (Roche, Indianapolis, USA). After centrifugation at 12,000× g, 4 °C for 45 min the supernatant was decanted and the protein concentration of a 5 μL aliquot measured using a modified “microtitre plate“ version of the Bradford assay (Sigma, Poole, Dorset, UK).
Muscle homogenates were prepared for 2-dimensional gel electrophoresis (2DGE) as described previously [
18]. An aliquot of each supernatant was precipitated in acetone and resuspended in 7 M urea, 2 M Thiourea, 2% (
w/
v) CHAPS, 20 mM dithiothreitol, 0.5% (
v/
v) ampholytes. Samples, containing 250 mg protein, were loaded on to 13 cm pH 3–11 nonlinear IPG strips (GE Healthcare, Chalfont St Giles, UK) and focused using an “active rehydration” and isoelectric focusing protocol comprising: 150 Vh at 30 V, 300 Vh at 60 V, 500 Vh at 500 V, 1000 Vh at 1000 V and 48 000 Vh at 8000 V; conducted on an IPGPhor II (GE Healthcare) at 20 °C, maximum 50 mA per strip. IPG strips were equilibrated in 50 mM Tris-HCl pH 8.8, containing 6 M urea, 30% (
v/
v) glycerol, 70 mM SDS and a trace of bromophenol blue. DTT (65 mM) was present as a reducing agent in the first equilibration and iodoacetamide (135 mM) in the second. Proteins were electrophoresed through 16 cm linear 12% polyacrylamide gels at 20 °C; at a constant current of 15 mA per gel for 30 min, then 30 mA per gel until the tracking dye reached the bottom edge of the gel. Gels were washed and stained with colloidal Coomassie blue (Bio-Safe; BioRad, Hercules, CA, USA) according to the manufacturer’s instructions.
Gel spots were cut and processed using an Xcise robot (Proteome Systems, North Ryde, Australia) directed by the gel analysis software. Gel plugs destained in three changes of 25 mM ammonium bicarbonate in 50% acetonitrile were dehydrated before being incubated with 35 µL of 1.25 mg/mL porcine trypsin (Promega, Madison, WI, USA) in 50 mM ammonium bicarbonate. Peptide solutions were de-salted and concentrated (Zip-tips; Millipore, Billercia, MA, USA) before being mixed with matrix (5 mg/mL α-cyano-4-hydroxcinnamic acid in 50:50 acetonitrile and 0.1% trifluoroacetic acid) and spotted on to 384-well stainless steel target plates. A calibration mix (Laserbio Labs, Sophia Antipolis, France) consisting of angiotensin II (
m/z 1046.2), angiotensin I (
m/
z 1296.5), neurotensin (
m/
z 1672.9), ACTH fragment {1–17} (
m/
z 2093.5) and ACTH fragment {18–39} (
m/
z 2465.19) was mixed 1:1 with matrix solution and spotted (0.5 µL) between every four sample-wells. Peptide mass spectra were recorded using a matrix-assisted laser desorption ionisation tandem time of flight (MALDI-TOF/TOF) mass spectrometer (Axima TOF
2; Shimadzu Biotech, Manchester, UK) in positive reflectron mode over a mass/charge (
m/
z) range of 900–3000. Data were smoothed (Gaussian, 2 chan peak width), baseline subtracted (100 chan peak width) and an adaptive (8.0×) threshold applied. Peptide mass lists (restricted to 20 peptides over 900–3000
m/z) were produced using the peak selection tool of the instrument's Launchpad software (Version 2.8.4) and searched against the Swiss-Prot database restricted to “Rattus” using the online MASCOT (
www.matrixscience.com) server. The enzyme specificity was set as trypsin allowing one missed cleavage, carbamidomethyl modification of cysteine (fixed), oxidation of methionine (variable) and an
m/z error of ±0.3 Da.
The amount of newly synthesised protein was calculated in deuterium labelled samples using mass isotopomer distribution analysis [
20]. Peptides were resolved to mass isotopomer envelopes. The pattern of mass isotopomers from deuterium-enriched samples was used to calculate the molar percent enrichment (MPE) of deuterium (
2H) in the precursor pool (p) as well as the fraction of newly synthesised protein. Essentially, the enrichment of “heavy“ isotopomers (e.g., m
2/m
1) provides information on the level of
2H in the precursor pool, whereas the incorporation of
2H “heavy” isotopes in to newly synthesised protein causes the relative abundance of the monoisotopic peak (m
0) to decline. Raw mass spectra were exported in mzXML format and mMass software (Version 5.5.0,
http://www.mmass.org) was used to measure the intensities of mass isotopomers (m
0, m
1, m
2) of peptides of interest, and to calculate the elemental composition of each peptide. The number (
N) of exchangeable H–C bonds in each peptide was estimated from [
21] and subsequent data handling was performed in R (
www.R-project.org). Mass isotopomer intensities were converted to relative abundance of each mass isotopomer envelope and mass isotopomer distribution analysis (MIDA) tables were created using multinomial distribution, reported in detail in [
20]. When the number of exchangeable H–C bonds and the elemental composition of the peptide are known, the level of precursor enrichment can be calculated from the ratio of enrichment between “heavy” isotopomers (
i.e., em
2/em
1). When the level of precursor enrichment is known the rise in the m
1/m
0 ratio due to
2H incorporation can be used to calculate fractional synthesis. Fractional synthesis was calculated from the slope of the m
1/m
0 regression line created from modelled data of each peptide based on its natural distribution of C, H, N, O elements, the number of exchangeable H–C bonds and the measured enrichment of
2H in the precursor pool.
Statistical analyses were conducted in Prism v6.02/6.0c (GraphPad, La Jolla, CA, USA); nonlinear one-phase association was used to estimate the rate constant k and half-life of each protein based on the amount of newly synthesised protein measured after 4 days, 7 days and 14 days of deuterium administration. The coefficient of determination (R2 value) was used as a measure of the goodness of the fitted non-linear regression and one-way ANOVA was used to investigate significant differences of individual protein synthesis rates across muscle tissues. The level of statistical significance was set at p < 0.05.
3. Results
Protein synthesis in vivo was investigated in the diaphragm, heart, EDL and soleus of rats administered 2H2O for either 4 days, 7 days or 14 days. Control (0-day) muscles were harvested from animals that did not receive deuterium. There was no significant difference in the wet weight of muscles harvested at each of the time points investigated.
Muscle homogenates were separated by 2DGE (
Figure 1) and eight spots matched across each muscle were processed for mass spectrometry. Peptide mass fingerprinting (
Table 1) was used to confirm the identification of albumin (ALBU), actin (ACTS), β-enolase (ENOB), muscle creatine kinase (KCRM), ATP synthase-α (ATPA), tropomyosin α-1 (TPM1), essential myosin light chain (MYL3) and regulatory myosin light chain (MLRV). Soleus muscle samples were used to investigate synthesis of different species of ALBU, ENOB and KCRM that each exhibited similar relative molecular mass but different isoelectric points.
Peptides selected for mass isotopomer distribution analysis (MIDA) were of relatively high intensity and signal:noise ratio, rich in alanine and were specific to the identified protein. With the exception of ATPA (three peptides), five peptides were analysed for each protein.
Table 1 provides details of the sequence, monoisotopic peak and elemental composition of the selected peptides. The number of exchangeable H–C bonds was estimated from published data on tritium incorporation in to amino acids
in vivo [
21].
Figure 2 illustrates changes to the pattern of peptide mass isotopomers due to the incorporation of
2H during protein synthesis
in vivo. Peptides were resolved to mass isotopomer envelopes consisting of the monoisotopic (m
0) peak, and “heavy” isotopomer peaks (m
1, m
2, m
3). The ratio between “heavy“ isotopomers (e.g., m
2/m
1) provides information on the enrichment of
2H in the precursor pool. The incorporation of
2H “heavy” isotopes in to newly synthesised protein causes the relative abundance of the monoisotopic peak (m
0) to decline and the ratio of m
1/m
0 to increase. When the level of precursor enrichment is known the rise in the m
1/m
0 ratio due to
2H incorporation can be used to calculate synthesis.
Whole muscle homogenates resolved by 2-dimensional gel electrophoresis and stained with colloidal Coomassie blue. Protein identities were confirmed by peptide mass fingerprinting (
Table 1) of in-gel digests analysed by matrix-assisted laser desorption ionisation mass spectrometry.
Fractional synthesis was calculated from the slope of the m
1/m
0 regression line created from modelled data, which is equivalent to the use of MIDA tables reported previously [
20]. Briefly, regression was based on the natural distribution of C, H, N, O elements, the number (
N) of exchangeable H–C bonds (H–D in
Table 1) and the molar percent enrichment (MPE) of
2H in the precursor pool (p).
Table 2 provides an example of data modelled from peptide DGFIDKNDLR displayed in
Figure 2. To illustrate the method in this example the molar fraction of mass isotopomers was calculated using multinomial distribution based on the natural abundance of
13C only and the rate of protein degradation was assumed to be constant. Two different scenarios have been modelled. In
Table 2a, differences in the fraction (%) of newly synthesised protein can be seen to alter the ratio between “heavy“ and “light“ (e.g., m
1/m
0) isotopomers while the pattern (ratio) of enrichment between “heavy“ isotopomers (
i.e., em
2/em
1) remains constant. Conversely, in
Table 2b, enrichment of
2H in the precursor pool is varied between 0 and 2.5% while synthesis is held constant (100%). Under these conditions the pattern of enrichment of “heavy“ isotopomers (
i.e., em
2/em
1) changes in accordance with the level of precursor enrichment. This ability to distinguish between the effects of protein synthesis and precursor enrichment is fundamental to the use of MIDA.
MPE of the precursor pool was calculated from the enrichment of the m
2/m
1 isotopomers of a selection of the best quality peptides (
n = ~80). The average MPE from all peptides of
2H
2O treated animals was 2.14% ± 0.2% and did not significantly differ between animals or across the time points (4 days, 7 days, 14 days) investigated. This is consistent with previous investigations, demonstrating rapid (<30 min in rats) equilibration of deuterium oxide in the body water compartment [
13].
Mass spectra were collected from each of the selected gel spots (
Figure 1) in each striated muscle harvested from control animals and rats that received
2H
2O for either 4 days, 7 days or 14 days (
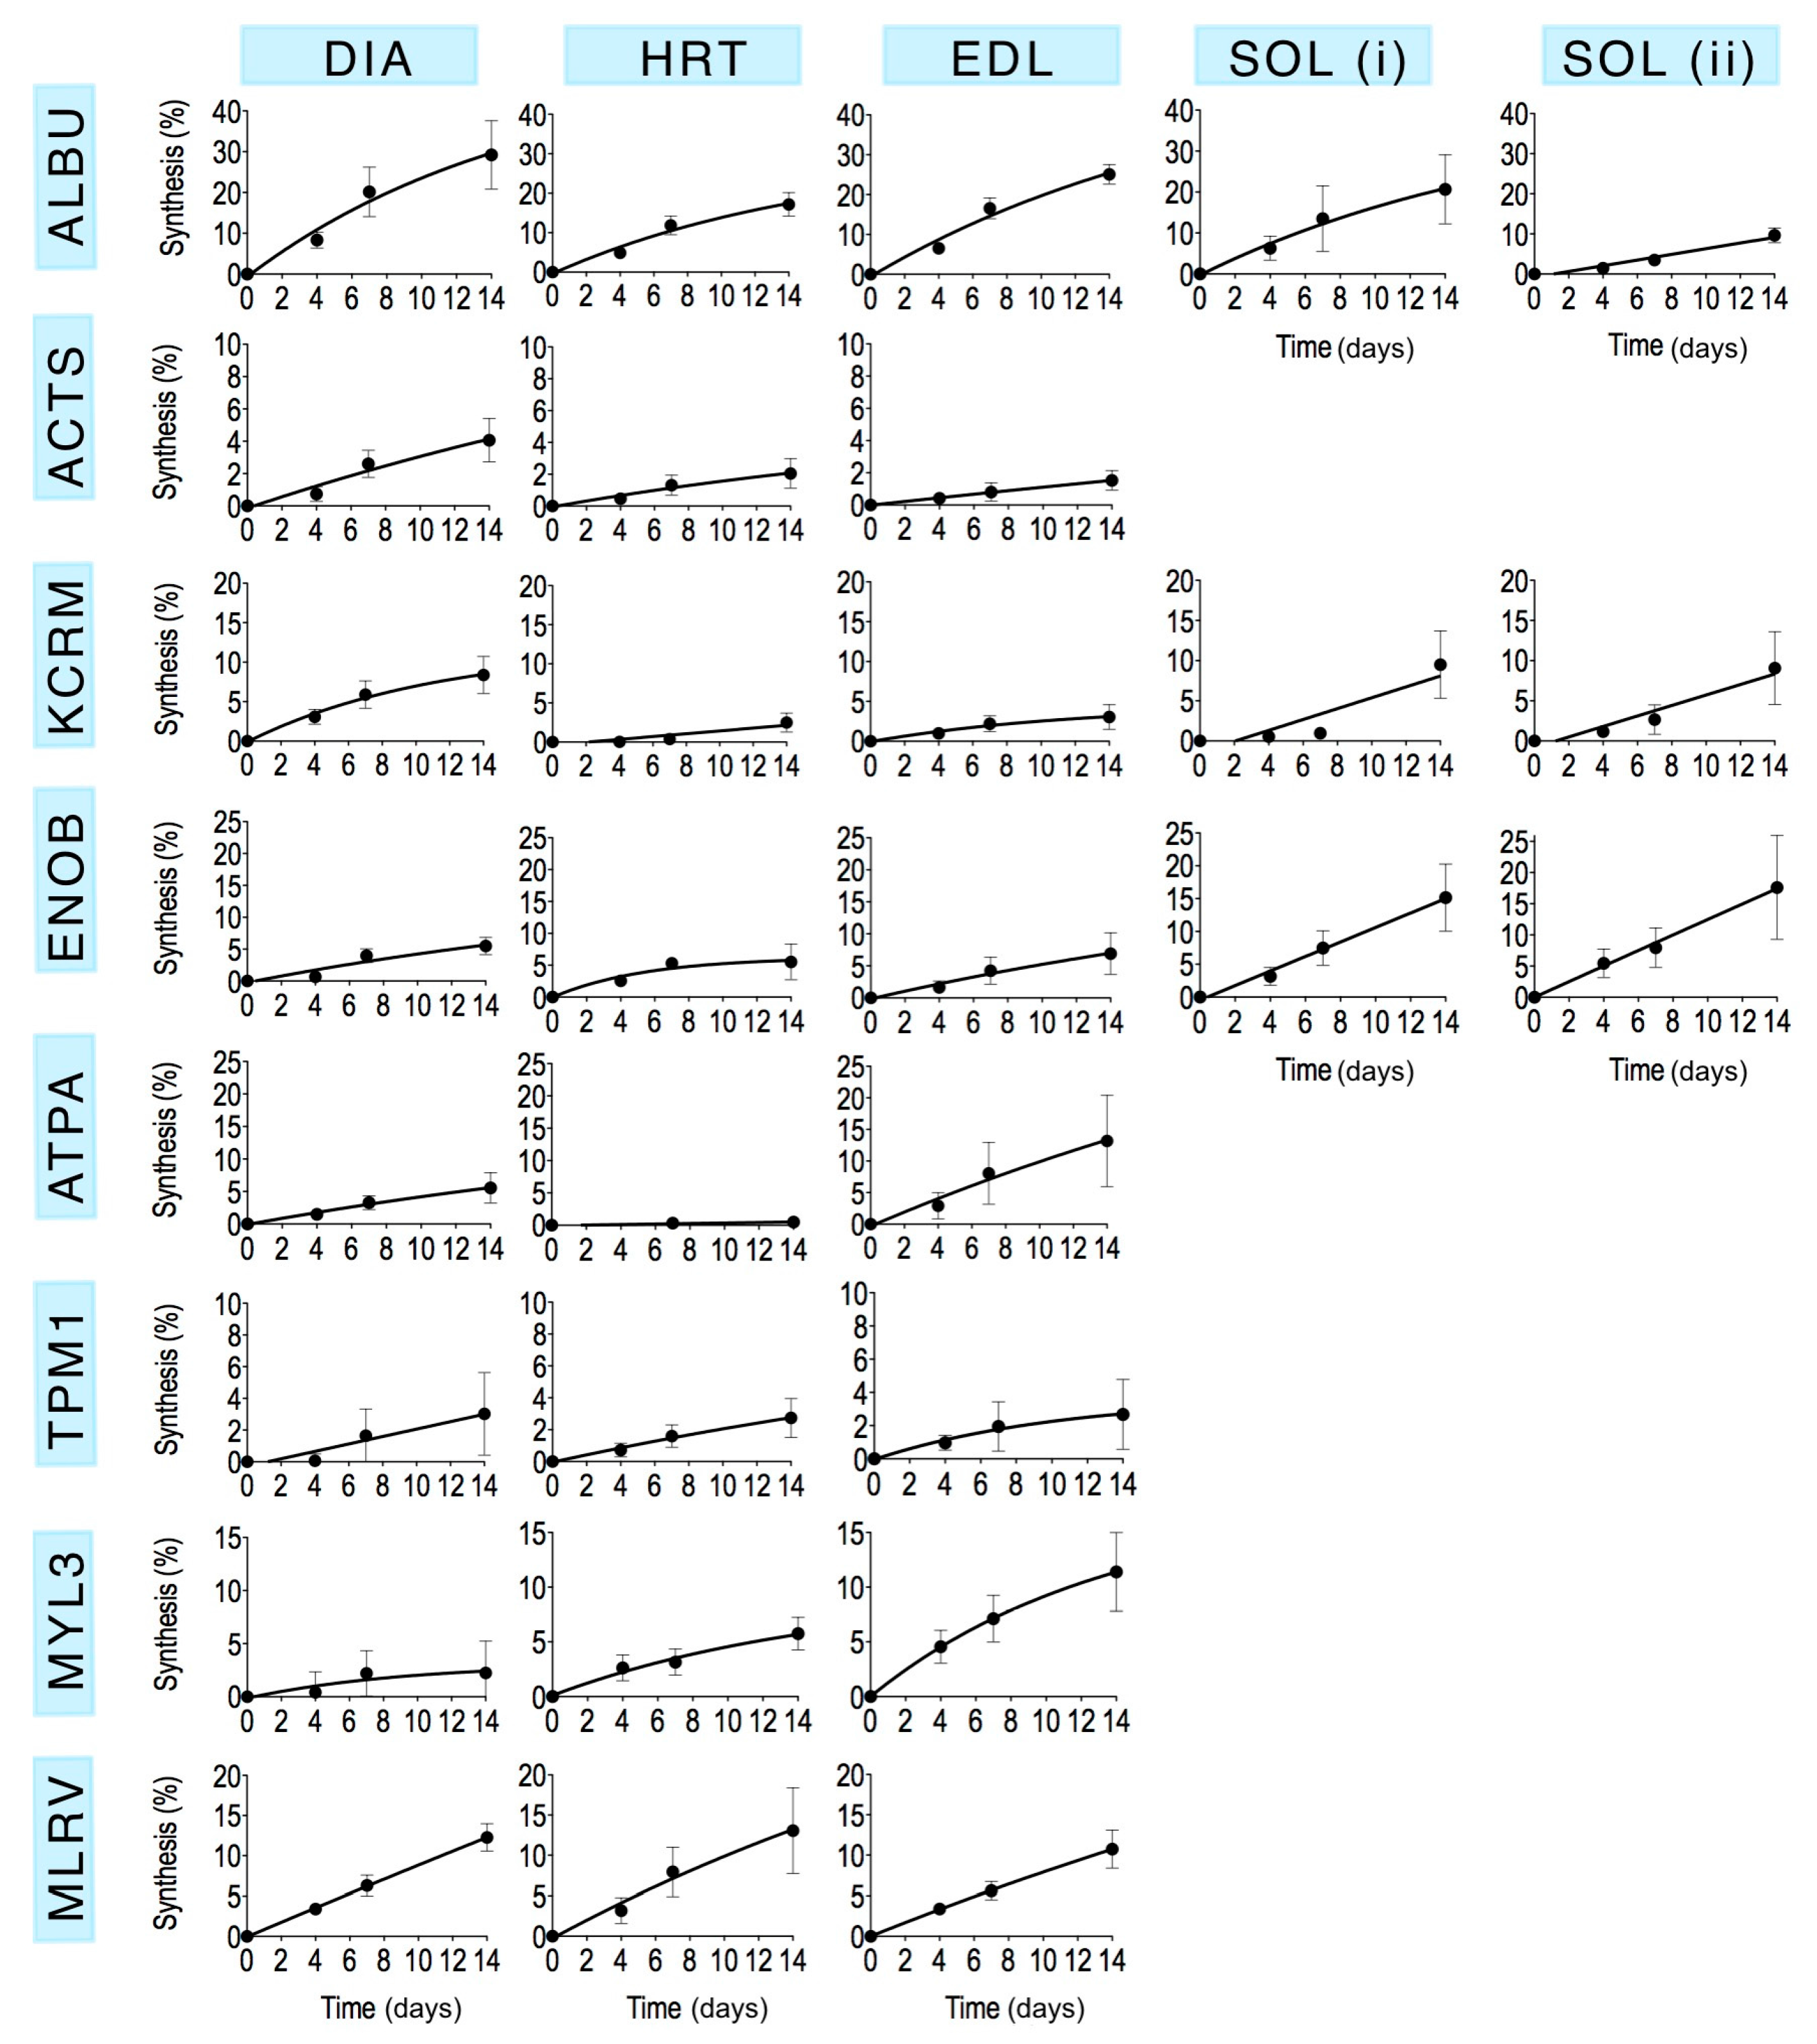
n = 3 in each group). The fraction of newly synthesised protein after 4, 7 and 14 days calculated by MIDA was fitted using nonlinear first-order regression (
Figure 3) to estimate the rate constant (
k) of protein synthesis and the half-time of protein renewal (
Table 3) assuming no change in protein abundance.
The percentage of newly synthesised protein in rat striated muscles after 14 days of
2H
2O administration (
Table 4) spanned from 0.5% ± 0.6% (heart ATP synthase alpha) to 29.2% ± 8.4% (diaphragm albumin). In each muscle investigated the synthesis of albumin was significantly (
p < 0.05) greater than that of the other muscle proteins analysed. With the exception of albumin, the rank order of synthesis (
Figure 4) was different across each of the muscles investigated. Moreover, in the soleus muscle, the synthesis of ALBU spot (i) was significantly (
p < 0.05) greater than ALBU spot (ii), which provides evidence of a functional difference between these protein species.
4. Discussion
We report novel data regarding the synthesis of eight proteins in four striated muscles of the rat using deuterium oxide labelling
in vivo, peptide mass spectrometry and mass isotopomer distribution analysis (MIDA; [
20]). To the best of our knowledge, this is the first work to report the synthesis of individual proteins across a range of different rat striated muscles. One of our major findings was that the amount of protein synthesis measured here in free-living animals across a number of time points during a 14-day period was generally less than reported in previous studies that used short-term (e.g., 30 min) infusion of an amino acid tracer.
In the current work the synthesis of albumin (~23% after 14 days) in each of the muscles investigated was significantly greater than the range (0.5%–15.2% after 14 days) exhibited by the other muscle proteins. Albumin is a prominent feature of the skeletal muscle proteome [
22] but expression of the albumin gene is low in muscle [
23]. Therefore, our findings support the conclusion that albumin extracted from muscle is primarily synthesised in the liver, which typically has a more rapid turnover of proteins than striated muscle [
24]. After removal of the myofibrillar components, albumin is one of the most abundant proteins in skeletal muscle [
22,
25]. Therefore, our data have consequences for the interpretation of previously reported synthesis measurements of mixed proteins from myofibrillar, sarcoplasmic and mitochondrial fractions e.g., [
26]. The high abundance of albumin in the sarcoplasmic fraction of muscle is likely to have artificially raised the average synthesis rate reported for this fraction and may also have masked biologically important changes in the synthesis of less abundant muscle proteins in response to experimental interventions.
Skeletal muscle albumin is primarily localised to the interstitium [
27] and is thought to aid transport of fatty acids in to muscle. The total abundance of albumin in fast-twitch skeletal muscle increases during transformation induced by chronic low frequency stimulation [
28]. Similarly, intensity-controlled endurance training also increases the abundance of a specific species of albumin in the fast-twitch plantaris muscle of rats [
18]. In the current work we investigated the synthesis of different species of three proteins in the soleus muscle (
Figure 1), including albumin. The predominant albumin species {ALBU (i)} had a relatively high level of synthesis (20.6% ± 8.4% after 14 days), consistent with our findings in the other striated muscles (
Table 4). In contrast, synthesis of the more acidic albumin species {ALBU (ii)} was significantly (
p < 0.05) less (9.6% ± 1.8% after 14 days), and it is this species {ALBU (ii)} that is specifically increased in rat plantaris muscle in response to endurance exercise training [
18]. The difference in isoelectric point between the ABLU (i) and ALBU (ii) species is likely to be due to a post-translational modification, and we show this modification is able to affect the turnover of the albumin protein. The modification to albumin may occur directly within the liver or secondarily in the periphery where the shift toward a more acidic isoelectric point might be associated with lesser uptake/residency in the muscle interstitium. Alternatively, because albumin mRNA can be detected (albeit at low levels) in skeletal muscle [
23] the relatively acidic species of albumin {ALBU (ii)} might represent protein that was synthesised and modified in the muscle rather than the liver. In the future, inclusion of hepatic tissue alongside the collection of various striated muscles from endurance-trained or chronically stimulated animals might resolve some of these unanswered questions.
Contrary to our findings for species of albumin in the soleus, there was no difference in synthesis between the two species of either beta-enolase or creatine kinase (
Figure 4). This indicates the post-translational modifications underlying the charge differences in these proteins did not alter their rate of synthesis. Nonetheless, further investigation encompassing all species from a greater number of proteins is needed to determine whether this is generally true for the majority of muscle proteins. Although 2DGE is relatively laborious and has limited scalability, we believe such data will be important to the interpretation of findings from high-throughput tandem mass spectrometry (e.g., LC-MS/MS) analyses of protein digests, which afford greater proteome coverage [
25] but cannot distinguish between the different species of each protein. Wider analysis is also required to build a more complete picture of differences in the synthesis of proteins across different muscles. Our initial finding is that the rank order of renewal of proteins is different in the myocardium, mixed-fibre diaphragm, slow-twitch soleus and fast-twitch EDL (
Figure 4). Of the two proteins (beta-enolase and creatine kinase) investigated in the soleus and EDL, the amount of protein synthesised after 14 d was greater (
NS) in the soleus (
Table 4), which supports previous data [
5,
29] from protein mixtures, supporting the hypothesis that slow-twitch postural muscles have a higher rate of turnover than less frequently activated fast twitch muscles such as EDL. However, on the whole, we found no simple relationship between myofibre phenotype/muscle activity pattern and the synthesis of individual proteins. Of the proteins investigated, the synthesis of tropomyosin (~3% after 14 days) was the most consistent across the different striated muscles whereas ATP synthase-α exhibited more than a 20-fold difference between the heart (0.5% after 14 days) and EDL (13% after 14 days). This finding is in accordance with earlier work [
6] reporting that synthesis of the mitochondrial protein, cytochrome c, is greater in fast- than slow-twitch muscle.
As anticipated, the amount of protein synthesised during a 14-day period was less than predicted from extrapolation of short-term synthesis measurements. For example, Jaleel
et al. [
9] reports the synthesis of TPM1 is 8%/day based on stable isotope incorporation after short-term (~20 min) infusion of ring-[
13C
6] phenylalanine
in vivo. In the current work, the rate constant for TPM1 was 2.7%/day (
Table 3). Because incorporation of label from the precursor pool in to a newly synthesised protein exhibits non-linear first-order kinetics, this discrepancy is most likely due to linear extrapolation of data recorded after 20 min of infusion in [
9]. It is also important to recognise that spots excised from 2DGE often contain multiple proteins [
30]. Therefore, GC-MS analysis of amino acids hydrolysed from 2DGE spots (e.g., Jaleel
et al. [
9]) could include contamination from proteins that share the same relative mass and isoelectric point as the protein of interest. Arguably, the level of contamination may be small but is nonetheless an unknown variable that is able influence the results. In comparison, our current approach offers greater selectivity because both precursor enrichment and protein synthesis were quantified from protein-specific peptides, whereas unidentified peptides (
i.e., potential contaminants) were ignored.
Currently few data exist using comparable proteomic analysis of deuterium-labelled muscle proteins. Kasumov
et al. [
31] reports synthesis rates for 28 proteins in intermyofibrillar and subsarcolemmal mitochondria of the rat heart using
2H
2O labeling and high-resolution peptide mass spectrometry. Protein synthesis was greater in the subsarcolemmal mitochondrial population, therefore, sub-cellular localisation is a further parameter that needs to be considered when investigating the synthesis of individual proteins. Kasumov
et al. [
31] reports the half-life of cardiac ATPA is approximately 27–30 days which is equivalent to the values estimated here in the diaphragm and EDL (
Table 2). More recently,
2H
2O labelling
in vivo has been used to investigate synthesis in the triceps of ovariectomised rats exposed to a selective androgen receptor modulator or vehicle control [
32]. Rats were administered deuterium oxide for a period of 7 days prior to muscle harvesting and peptide mass spectrometry was used to calculate the synthesis of individual proteins.
Table 5 provides a comparison between our 7-day data and equivalent data reported in
Table 2 of Shankaran
et al. [
32]. In most cases, we report less protein synthesis in the hindlimb muscles than Shankaran
et al. report in the triceps. The exception is regulatory myosin light chain, which was synthesised similarly in each of the striated muscles investigated.
An advantage of deuterium oxide labelling compared to infusion of amino acid labelled tracers is that experiments can be conducted over longer durations and therefore provide a better estimation of the rate of protein synthesis. We used a minimum number of time points over the duration of the experiment to fit nonlinear regression curves to our data. However, incorporation of deuterium (
i.e., protein synthesis) did not reach a plateau for any of the proteins investigated during the 14-d period. Therefore, we report estimated rate constants of protein synthesis (
Table 3) of each investigated protein and stress that it may be inappropriate to extrapolate values to estimate half-time for protein renewal or time for complete turnover of the protein pool. Instead, in
Table 4, we report the fraction of newly synthesised protein after 14 days to enable a more robust comparison of the synthesis of individual proteins across the different striated muscles. Based on our current findings, the duration of future experiments should extended >3 weeks in order to capture a more accurate reflection of the individual protein synthesis rates within rat striated muscles.


