1. Introduction
Compromised nutritional status has been linked to pressure ulcer (PrU) development for at least four decades, yet it remains an unresolved risk [
1,
2,
3,
4,
5,
6,
7,
8,
9,
10,
11,
12]. Early observational studies explored the relationship between factors, such as serum albumin, lower hemoglobin, lower dietary calories, and protein intake, with PrU incidence [
1,
2]. More recent studies expanded our understanding of PrU development by examining the link between PrUs and individual demographic characteristics, including body mass index (BMI), unintended weight loss, and medical diagnoses [
3,
4]. Few studies have prospectively observed dietary intake, nutritional risk status, and PrU development to draw conclusions about thresholds of overall intake related to PrU incidence and such studies are time and resource intense [
5,
6,
7,
8]. Much remains to be learned about how to best identify in routine care, nutritional risk as part of PrU prevention in nursing home (NH) residents.
A common approach to determine PrU risk upon NH admission is the use of the Braden Scale for Pressure Sore Risk
© (Prevention Plus, LLC, Omaha, NE, USA) [
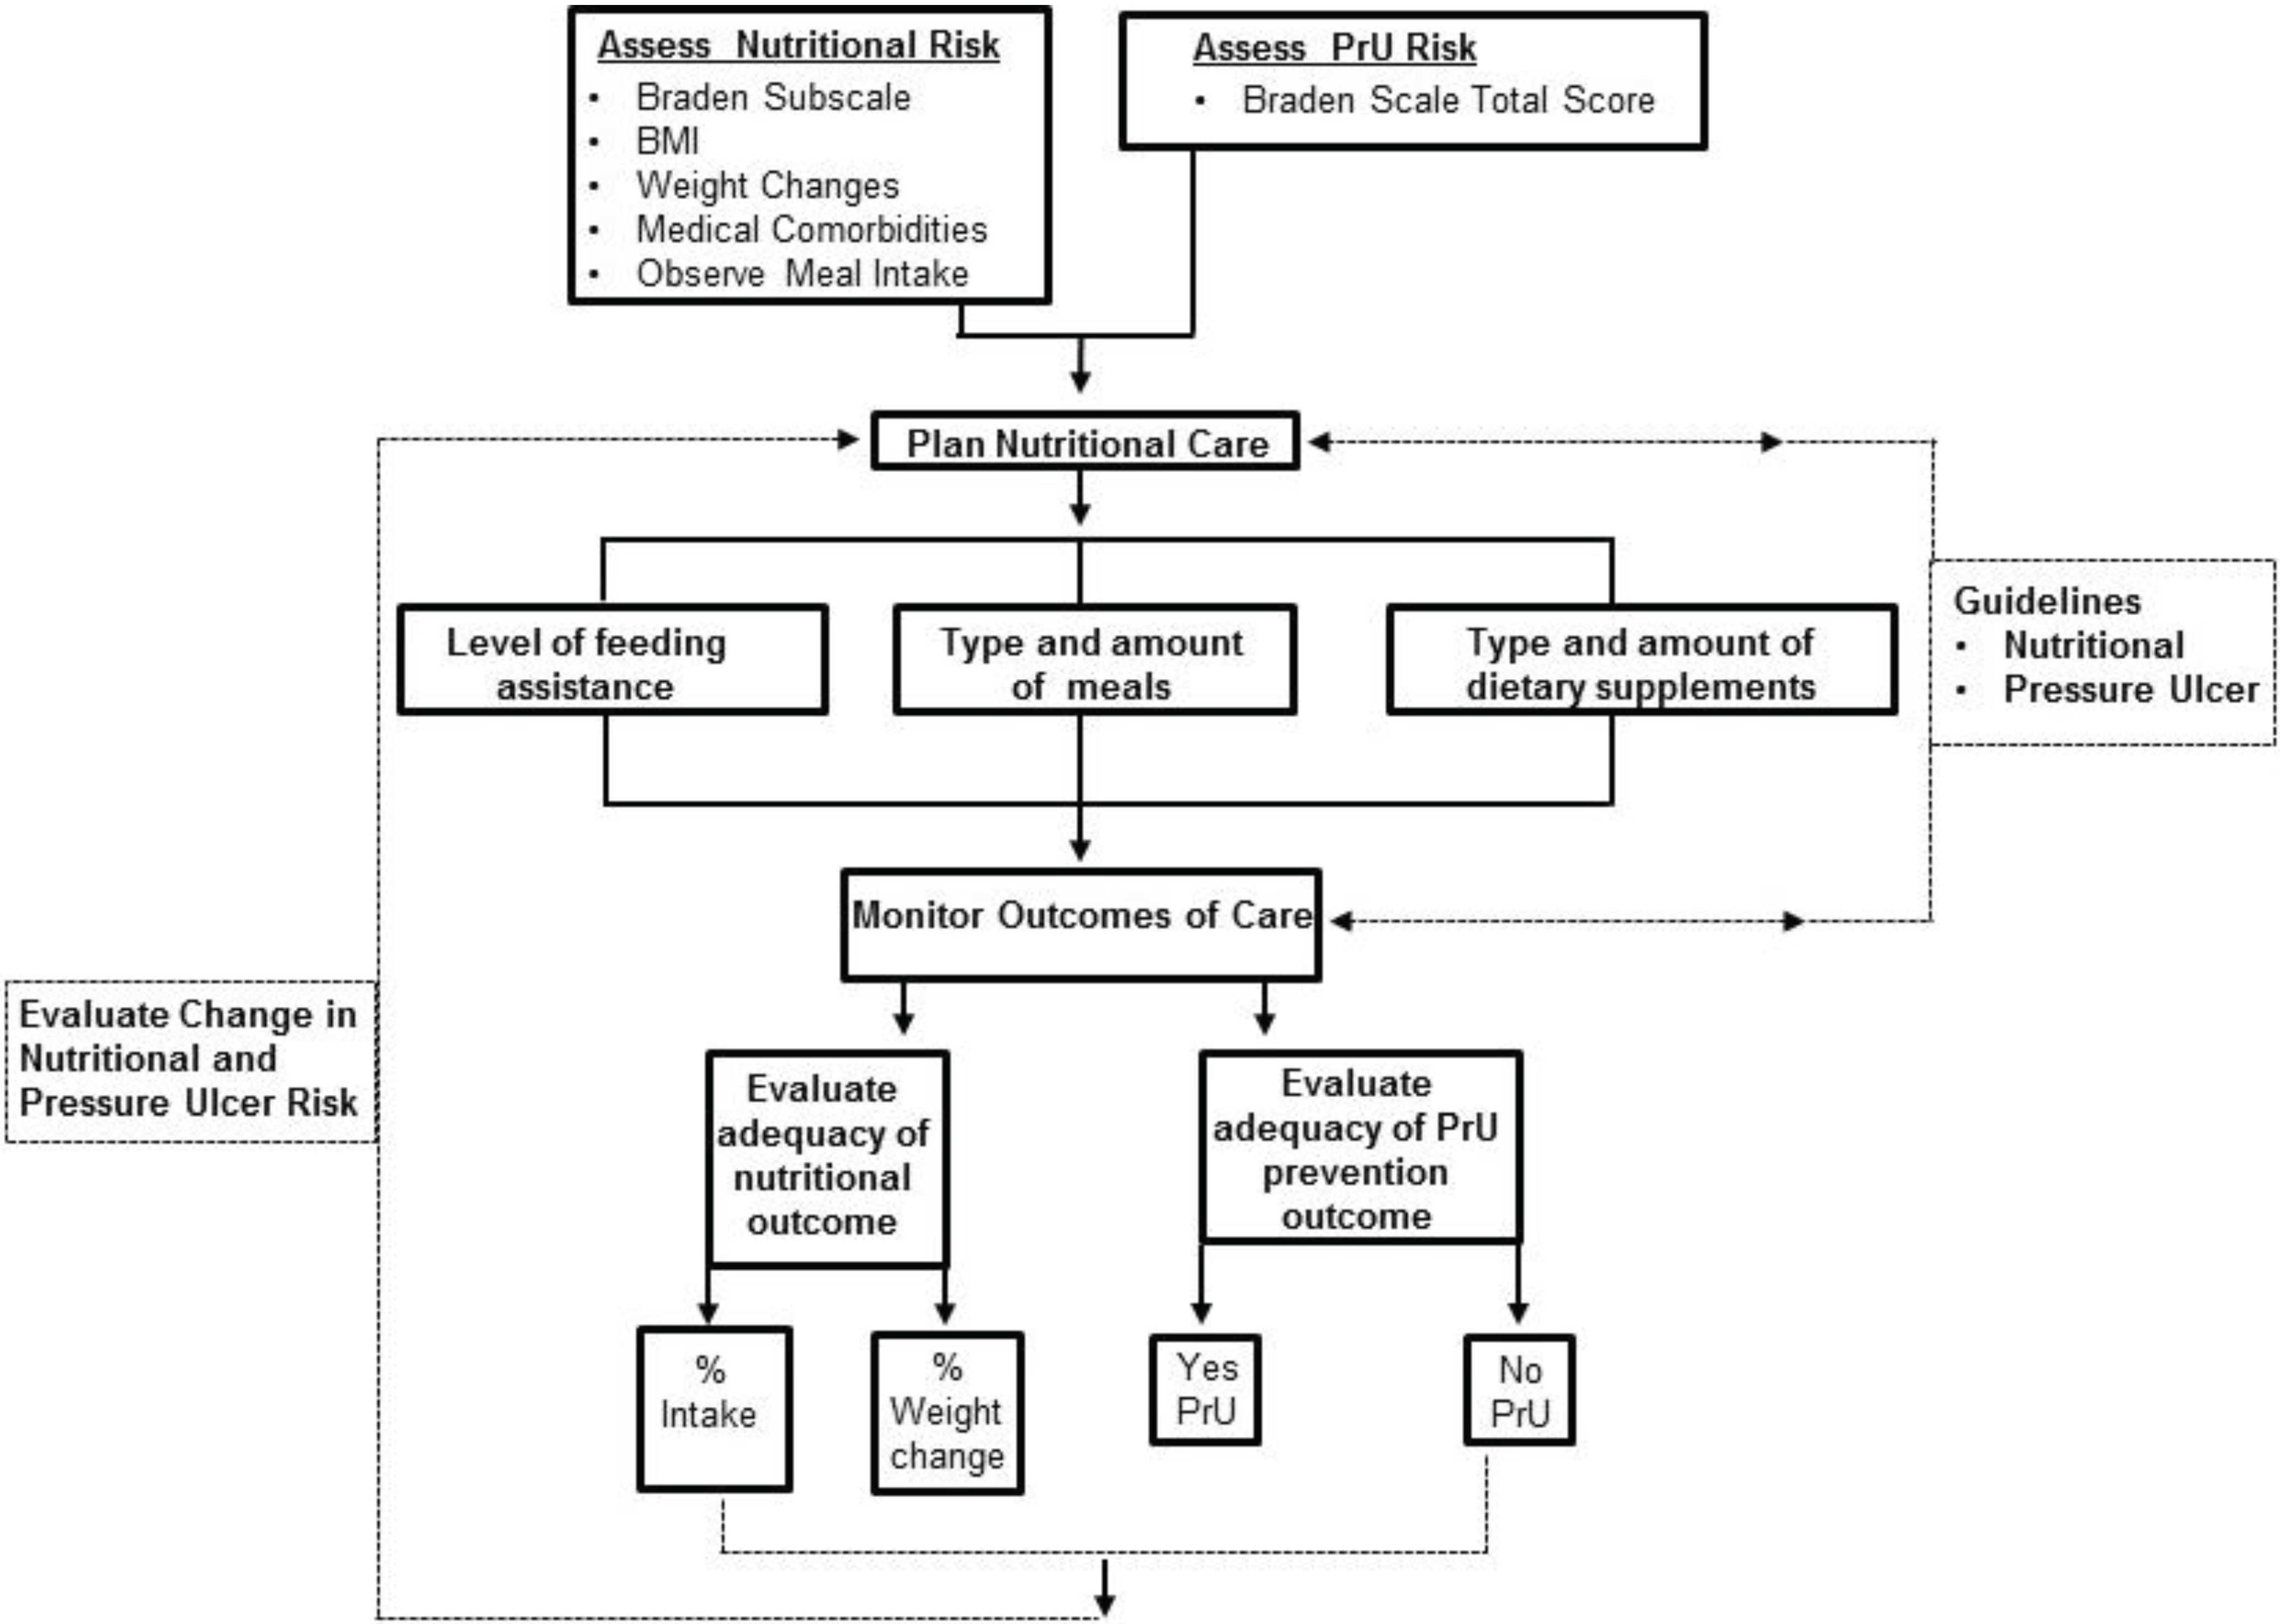
13] (hereafter Braden Scale). The Braden scale serves a dual role as a screening tool: (1) to determine a resident’s overall risk for PrU development; and (2) for estimation of severity of the most significant risk factors for the purpose of guiding care planning. This paper focuses on nutritional risk based on the nutrition subscale, one of the Braden Scale’s six domains used to assess rate overall PrU risk. The nutrition subscale is used by some NHs to screen for common factors leading to nutritional risk, but is not to be considered a comprehensive nutritional assessment. It is often the first method used upon NH admission to screen for adequacy of dietary intake as a potential contributor to overall PrU risk and to signal nursing and dietary staff of the need for a more comprehensive nutritional assessment and potential intervention. We believe that in order to establish successful nutritional interventions consistent with PrU prevention the associations between initial Braden Scale nutrition subscale (hereafter nutrition subscale) screening, dietary intake, and individual outcomes (e.g., BMI and weight change) must be clarified. This manuscript reports on evaluation of the utility of the nutrition subscale as a basis for identifying nutritional intake risk factors through secondary analysis of data from the TURN study’s [
14] investigation of long-stay NH residents who were rated as moderate or high-risk for PrU development. The aims are to: (1) determine if licensed nurse nutritional risk ratings using the nutrition subscale differ significantly from observed risk in relation to intake of meals (breakfast, lunch, dinner), protein meal servings, or dietary supplements; and (2) determine the utility of staff nutritional risk ratings using the nutrition subscale score as an indicator of observed dietary adequacy outcomes, such as intake and weight change (loss, gain).
3. Results
Resident participants in the TURN Study (
n = 942) who were Asian (
n = 101) or short stay (
n = 128) were excluded from this analysis, which included 721 participants who resided in nursing facilities >90 days. Short stay residents are likely different than long stay residents due to recent illnesses leading to transfer from hospital to nursing homes or substantial changes in condition requiring moving from home to nursing home; recent illness and relocation stress may influence dietary intake and inflammatory responses related to nutritional status [
22]. Asian residents were significantly different in body mass index and dietary intake from other residents (
p < 0.001,
p = 0.009, respectively), were removed from the analysis, and will be reported elsewhere. After preliminary analysis, 23 (3.19%) of the 721 subjects were found to have tube feedings during all or part of the study. Although enteral nutrition has many favorable effects, it commonly fails to provide adequate energy requirements for a variety of reasons, including improper feeding tube location, frequent interruption, gastrointestinal intolerance, feeding tube problems, and underprescription by healthcare providers [
20]. For these reasons, tube fed residents were not included in the analysis resulting in 698 residents whose dietary intake was observed for 3 to 42 days (mean = 20.17, median = 21, SD = 3.969). Of the remaining 698 residents, 8 were excluded from the analysis due to missing Braden Scale data, leaving a final sample size of
n = 690.
3.1. Resident Participant Characteristics
Descriptive analyses, correlations, and paired comparisons were used to examine characteristics for residents in this study (
n = 690) including gender, age, BMI, and primary medical diagnoses (
Table 1), which are characteristics often considered to be potential contributors in PrU development. Residents were categorized according to Braden Scale PrU Risk Score moderate (
n = 462) and high risk (
n = 228) categories and according to staff ratings of Braden Scale nutrition subscale risk categories. All 4 nutrition subscale risk categories were represented among the 690 residents: category 1—Very Poor, (
n = 25), category 2—Probably Inadequate (
n = 214), category 3—Adequate (
n = 403), and category 4—Excellent (
n = 48). Mean ages ranged from 80.9 years in category 4 to 87.5 years in category 1 and residents were predominately white females (72%). Nutrition subscale category 1
versus category 4 residents had significantly lower BMI (mean 22.3
versus 27.8 (Kg/m
2), higher percentage of females (84%
versus 70.8%), and lower total Braden Scores (11.8
versus 12.9).
Dementia was the most frequently occurring diagnosis among nutrition subscale risk category 1 residents, but was not significantly more frequent than in other nutritional categories. Cerebrovascular disease and diabetes mellitus occurred more frequently in subscale category 4 residents (39.6% and 35.4%, respectively). Musculoskeletal and thyroid disorders, however, were significantly more common in subscale category 1 residents when compared with other nutrition subscale risk categories (72%, p = 0.015; 36%, p = 0.018, respectively). A diagnosis of nutritional disorder occurred most frequently among category 1 residents (4%). No residents were diagnosed with delirium. Five residents (0.72%) had >10% weight loss during the study; 12 (1.7%) had 5%–10% weight loss; 11 residents (1.6%) had 5%–10% weight gain; the overwhelming majority (662; 95.9%) did not have any weight loss/gain during the study period.
Table 1.
Resident Participant Characteristics Gender, Age, BMI, Diagnoses, and Braden Scale Score Grouped According to Braden Nutrition Subscale Risk Categories (n = 690).
Table 1.
Resident Participant Characteristics Gender, Age, BMI, Diagnoses, and Braden Scale Score Grouped According to Braden Nutrition Subscale Risk Categories (n = 690).
| Resident Characteristic | Nutrition 1 Risk: Very Poor (n = 25, 4%) | Nutrition 2 Risk: Probably Adequate (n = 214, 31%) | Nutrition 3 Risk: Adequate (n = 403, 58%) | Nutrition 4 Risk: Excellent (n = 48, 7%) | p Value | Test |
|---|
| Mean, #, or % | Mean, #, or % | Mean, #, or % | Mean, #, or % | | |
|---|
| Gender: | | | | | | |
| Female | 84% | 86.5% | 76.9% | 70.8% | 0.014 * | Chi-Square |
| Male | 12% | 7.5% | 5.7% | 6.3% | | |
| Age | 87.3 | 87.5 | 84.9 | 80.9 | <0.001 ** | ANOVA + Duncan lines |
| BMI | 22.3 | 23.1 | 26.3 | 27.8 | <0.001 ** | ANOVA + Duncan lines |
| Diagnoses: | | | | | | |
| Cerebrovascular Disease | 28% | 32.7% | 39.4% | 39.6% | 0.905 | Chi-Square |
| Dementia | 84% | 80.1% | 75.1% | 83.3% | 0.293 | Chi-Square |
| Diabetes Mellitus | 12% | 20.9% | 26.4% | 35.4% | 0.059 | Chi-Square |
| Musculoskeletal Disorder | 72% | 61.1% | 52.6% | 41.7% | 0.015 * | Chi-Square |
| Nutritional Diagnosis | 4% | 0% | 1.5% | 2.1% | 0.171 | Chi-Square |
| Thyroid Disorder | 36% | 22.8% | 16.2% | 12.5% | 0.018 * | Chi-Square |
| Race: | | | | | | |
| African American | 12% | 7.5% | 5.7% | 6.3% | 0.619 | Chi-Square |
| Caucasian | 84% | 89.7% | 90.8% | 93.8% | | |
| Hispanic | 4% | 1.4% | 3% | 0% | | |
| Other | 0% | 1.4% | 0.5% | 0% | | |
| Braden Scale (PrU Risk) | 11.8 | 12.6 | 13.1 | 12.9 | <0.001 ** | ANOVA + Duncan lines |
Of the 690 residents studied, 10 (1.5%) developed a PrU. Mean age for these residents was 88.7 years, and mean BMI was 26.7. Similar to the overall sample, all were female and 90% were white. Diagnoses reported included cardiovascular disease (90%), dementia (80%), musculoskeletal disease (70%), diabetes mellitus (40%), cerebrovascular disease (10%), and thyroid disorder (10%). A nutritional diagnosis was only reported in 10%. Mean Braden Scale score was 13, indicating moderate risk for PrU development. Mean Braden Scale subscale scores for sensory perception, moisture, activity, and mobility ranged from 2.0 to 2.7, and the mean friction shear subscale score was 1.44. Most residents developing a PrU were bed bathed (60%) on the majority of days in the week (M = 4.56 baths per week). Help eating was required by most residents (70%) with a new PrU and 70% ate 100% of meals. The mean protein serving per meal was 1.22 and most residents favored meat (0.31) and milk (0.45) as protein sources. In addition, 90% of these residents received a liquid supplement on at least 1 day. On 49% of days, however, residents consumed 63% of the liquid supplement. There was no reported weight loss or gain for these residents.
3.2. Dietary Intake Findings
Dietary intake of 690 residents was monitored by CNAs at the resident’s respective NH. Results of analyses for % of each meal eaten, number of servings of protein eaten at each meal, sources of dietary protein, dietary supplements, and snacks are summarized individually and in relation to Braden Scale PrU risk and Braden nutrition subscale risk categories.
3.2.1. Meal Intake
CNAs reported that 59.2% of high PrU risk and 61.9% of moderate PrU risk residents ate a mean of ≤75% of most meals. There was no significant difference in dietary intake categories between risk levels. Fewer than 18% of residents in both groups were reported to eat less than 50% of meals or refuse meals most days. The mean meal intake estimated by using the midpoint of the reported range for each individual for each meal is 75% (±SD) for high risk and 77% (±SD) for moderate risk residents. The mean intake across meals (breakfast, lunch, and dinner) was highest for breakfast and lower, but nearly identical for lunch and dinner and was not significantly different by meal or PrU risk level. Thirteen residents were reported to be NPO or refuse feedings; the mean percent intake across the study period for these residents ranged from 8.3% to 48%.
Table 2 summarizes mean % of meal intake and Braden Scale PrU Risk Score according to the 4 nutrition subscale risk categories.
The mean % of meal intake varied by the 4 categories of nutritional risk ratings with increases in a stepwise fashion across the categories from Very Poor to Excellent. The range in % mean meal intake was as low as 8.33 in category 2 and as high as 100% in categories 2, 3, and 4. Each of the nutritional risk categories was comprised of residents from both moderate and high PrU risk categories with mean PrU risk score ranging from 11.80 to 13.06. However, average meal intake consumed was not significantly correlated (rho = 0.57, p = 0.138, n = 690) with being at moderate or high Braden Scale PrU risk. The mean Braden Scale PrU risk for those residents (n = 10) who developed a PrU was 13 (moderate risk).
Table 2.
Mean and Range of % Meal Intake and Braden Scale PrU Risk Score Grouped According to Braden Nutrition Subscale Risk Categories (n = 690).
Table 2.
Mean and Range of % Meal Intake and Braden Scale PrU Risk Score Grouped According to Braden Nutrition Subscale Risk Categories (n = 690).
| Braden Nutrition Risk Subscale Category | Mean % (Range) Meal Intake | Braden Scale PrU Risk Mean (Range) Score |
|---|
| 1 = Very poor | 48.67% (19.33 to 88.03) | 11.80 (10 to 14) |
| 2 = Probably Adequate | 65.11% (8.33 to 100) | 12.55 (10 to 14) |
| 3 = Adequate | 82.04% (19.11 to 100) | 13.06 (10 to 14) |
| 4 = Excellent | 92.80% (21.70 to 100) | 12.85 (10 to 14) |
Percent of meal consumed by males and females ranged from 8.33 to 100%. Males with a Braden nutritional risk of 3—Adequate, had a significantly greater mean % of meal consumption (Male = 86.84; Female = 80.59) (Satterthwaite t-test, t = −3.28, p = 0.0013). Analysis of variance showed no significant differences by race (African American, Hispanic, and Caucasian) for Braden Nutrition category 1—Very Poor or 2—Probably Inadequate, however, significant differences observed in relation to categories 3—Adequate and 4—Excellent. Mean % meal intake for Caucasians (94.02) in the excellent category is significantly greater (F = 9.78, p < 0.0031) than for African Americans (72.56) with no Hispanics represented. Mean % meal intake differed significantly (F = 4.11, p = 0.0069) between races for residents in category 3—Adequate, with Hispanics (69.8%) and African Americans (74.8%) having significantly lower intake than residents in the other category (Excellent 97.4%). A diagnosis for a nutritional problem was only present for 8 (1.16%) residents with 6 of these observed as being in the nutritional risk of 3—Adequate category. There was no significant difference (t = 0.87, p = 0.383) in average meal intake for residents with a nutritional diagnosis. Mean age of those whose nutritional risk was deemed to be very poor to probably inadequate was 87; however, age was not significantly correlated (p ≥ 0.05) with average meal intake of residents in these nutritional risk categories.
Braden Scale Activity and Mobility subscale scores were examined in relation to Braden nutritional risk and % meal intake. A low, yet significant correlation (rho = 0.107, p = 0.03) was observed between Braden Activity subscale score and average estimated meal intake (mean 82.04%, 19.11% to 100%) for the group of residents with nutrition risk rating of 3—Adequate (n = 403). Staff rating of nutritional risk corresponded more closely with estimated meal intake for residents whose risk rating was adequate than for the other 3 risk categories. A moderate negative, significant correlation (rho = −0.42, p = 0.04) was observed between Braden Mobility subscale score (mean = 2.12/very limited, range 1 to 3) and average estimated meal intake (mean 48.67%, 19.33% to 88.03%) for the group of residents with nutritional risk rating of 1—Very Poor (n = 25). Staff nutrition subscale risk rating of residents in this group was based on their screening observation that meals were never consumed in their entirety and rarely was 33% intake reached. All of the residents in this nutritional risk group (n = 25) experienced a substantial degree of limitation in their ability to change and control body position, especially to do so independently, which may have contributed to a lower % of meal intake. Additionally, 21 (84%) of residents in the “very poor” nutrition subscale risk category had a diagnosis of dementia and may have been more easily distractible, another factor that may help to explain why achieving a higher % of meal intake was a challenge. The inverse nature of the relationship may be explained by the possibility for residents with fewer mobility limitations to receive less feeding assistance (n = 5 requiring setup only; n = 4 eat independently) suggesting that % of intake in such a situation may be potentially compromised. Data regarding dental status and swallowing function of residents were not collected, thus limiting our ability to explain their potential impact on dietary intake.
3.2.2. Protein Servings and Protein Sources
The mean number of servings and the source of protein reported by CNAs at each meal was adjusted by the percent of the meal eaten. Overall, the estimated mean number of protein servings per meal was 1.3 (±SD = 0.53)
versus 1.4 (±SD = 0.58) for high
versus moderate PrU risk residents and was not significantly different. Sources of protein recorded at each meal varied, but the predominant sources of protein for both moderate and high PrU risk groups were meat, milk, and eggs. Other sources of protein were highly variable. The use of protein supplements added to food was infrequently reported. Nutrition subscale risk categories and the corresponding number of protein servings and protein sources are presented in
Table 3. Number of protein servings per meal increased across the nutritional risk categories. When the mean % intake reached 92.8% for residents rated as being nutrition subscale risk category 4—Excellent, the mean # of protein servings per meal times 3 meals per day yields 5.56, which is consistent with the 4 or more servings recommended per day as part of a standard diet. For residents comprising the Probably Adequate nutrition subscale risk category, the mean # of protein servings per day was 3.36. As with mean % of intake, the # of protein servings per meal (0.71 or 2.13 per day) was lowest for those residents in the Very Poor nutrition subscale risk category.
Table 3.
Mean #, SD, and Sources of Protein Servings Grouped According to Braden Nutrition Subscale Risk Categories (n = 690).
Table 3.
Mean #, SD, and Sources of Protein Servings Grouped According to Braden Nutrition Subscale Risk Categories (n = 690).
| Protein Servings and Sources | Nutrition Risk: Very Poor (n = 25) | Nutrition Risk: Probably Adequate (n = 214) | Nutrition Risk: Adequate (n = 403) | Nutrition Risk: Excellent (n = 48) |
|---|
| Mean # (SD) per Meal | Mean # (SD) per Meal | Mean # (SD) per Meal | Mean # (SD) per Meal |
|---|
| # Protein Servings | 0.71 (0.32) | 1.12 (0.52) | 1.51 (0.54) | 1.67 (0.42) |
| Protein Sources: | | | | |
| Beans | 0.06 (0.06) | 0.11 (0.11) | 0.17 (0.13) | 0.19 (0.12) |
| Cheese | 0.03 (0.03) | 0.07 (0.07) | 0.09 (0.08) | 0.09 (0.07) |
| Egg | 0.12 (0.07) | 0.16 (0.09) | 0.21 (0.09) | 0.22 (0.09) |
| Lunch Meat | 0.03 (0.03) | 0.06 (0.05) | 0.09 (0.07) | 0.09 (0.06) |
| Meat | 0.19 (0.10) | 0.27 (0.14) | 0.38 (0.17) | 0.42 (0.15) |
| Milk | 0.25 (0.15) | 0.4 (0.21) | 0.49 (0.22) | 0.58 (0.22) |
| Nuts | 0.03 (0.07) | 0.04 (0.07) | 0.04 (0.07) | 0.04 (0.07) |
| Protein Powder | 0.00 (0.01) | 0.02 (0.05) | 0.02 (0.07) | 0.02 (0.09) |
| Soy | 0.01 (0.01) | 0.01 (0.04) | 0.02 (0.05) | 0.02 (0.03) |
3.2.3. Intake of Supplements and Snacks
Liquid supplements, either commercial or in facility formulations, were reported at some point during the study for 91% of residents. Those residents who were at high versus moderate PrU risk received supplements on a significantly greater percentage of study days (60.8 ± 34 versus 53.0 ± 34, p = 0.006). Snacks served by the facility or provided by families were given to 58% and 62% of high and moderate risk residents. Less than half of the snack was consumed by those who ate any part of the snack, with those at high risk for a PrU consuming significantly less than moderate risk residents (p = 0.01).
3.3. Braden Nutritional Risk and Dietary Adequacy
Statistically significant differences in weight (loss or gain) did not occur among residents, regardless of the nutrition subscale risk category assigned as part of the nursing staff’s PrU risk screening for all residents in the study. It was very rare for a resident in any nutrition risk category to experience a gain or loss in weight during the study (
Table 4). Change in weight was most likely to occur in residents from the nutrition risk category 1—Very Poor with losses of 5%–10% and >10% being reported by 8% of residents (4% in each loss category). Similarly, the largest number of residents reporting weight gain was from nutrition subscale risk category 1—Very Poor, yet 4% of these residents had a 5%–10% gain in weight during the study period. Using change in weight as the outcome indicator of dietary adequacy, shows that although variation in % meal intake and # of protein servings per day was widespread, weight loss nor weight gain was not observed in 97.4% and 98.1% of residents, respectively. No change in weight was reported for any of the 10 residents who developed a PrU.
Table 4.
Reported Weight Loss or Weight Gain Grouped According to Braden Nutrition Subscale Risk Categories (n = 690).
Table 4.
Reported Weight Loss or Weight Gain Grouped According to Braden Nutrition Subscale Risk Categories (n = 690).
| Braden Nutrition Risk Category | # In Risk Category | Weight Loss | Weight Gain |
|---|
| None | 5%–10% | >10% | None | 5%–10% | >10% |
|---|
| 1 = Very poor | 25 | 88.0% | 8.0% | 4.0% | 96.0% | 4.0% | 0% |
| 2 = Probably Adequate | 214 | 97.2% | 1.4% | 1.4% | 98.2% | 0.9% | 0.9% |
| 3 = Adequate | 403 | 97.8% | 1.8% | 0.5% | 98.3% | 1.7% | 0% |
| 4 = Excellent | 48 | 100% | 0% | 0% | 97.9% | 2.1% | 0% |
| Total | 97.4% | 0.2% | 0.01% | 98.1% | 0.02% | 0.003% |
4. Discussion
Dietary intake of NH residents in relation to PrU risk or PrU status (present/absent) has been reported previously in retrospective and prospective observational studies [
1,
2,
3,
4]. Many of these reports aimed to associate dietary intake and anthropometric or biologic markers of nutritional status with PrU development [
4,
5,
6], or to determine differences between those with and without PrU [
3,
4,
7]. More recently, interventions aimed at increasing dietary intake have been reported [
5,
23,
24]. The residents of the TURN study [
14] are fundamentally different than those in previously reported studies of nutrition and PrUs in that they are documented to be at moderate or high risk for PrUs (Braden Scale), have resided in the NH for 3 months prior to the study, and do not have a PrU at the outset of the study. Previous studies included all residents meeting age, length of stay, and PrU status criteria with the aim of identifying differences in those with PrUs, not always separating those who had PrUs on admission or developed PrUs during their residence in the facility. While there are methodological limitations in scope and specificity of study findings when using secondary data analysis, we believe further examining resident characteristics, nutrition risk, and dietary adequacy data from the randomized controlled trial significantly contribute to our clinical understanding about the utility of the nutrition subscale. The advantages of TURN study data include prospective observation of skin condition to confirm absence of a PrU at the outset of the study, ongoing observation by a nurse blinded to risk level, and daily dietary intake documented by CNAs. CNAs in NHs are responsible for recording the food eaten at each meal. Their training at the NH where employed is often supplemented with pictorials posted in break rooms with pictures of trays with various percentages of food eaten. Orientation to the study included a discussion of how to complete dietary intake forms as a means of minimizing variation and increasing fidelity of measures. As in most clinical studies there is the possibility of variation.
The Braden scale has two primary uses in the care of NH residents, one as a screening tool of resident’s overall risk for PrU development secondly to estimate the severity of risk factors, such as nutrition risk. Residents deemed to be at risk and at low risk for a PrU merit ongoing monitoring throughout their stay, since risk factors vary as overall health condition changes. Similarly, variation in nutrition risk occurs as changes in mobility, activity, and cognition change. Ratings for Braden subscales must be evaluated individually, in combination with each other, and in relation to the overall Braden Scale score in order to meaningfully use risk factor identification to effectively guide care planning. More specifically, this study adds to our understanding of the interrelationships between factors affecting nutrition risk and PrU development in NH residents. The Braden Scale served as a useful screening tool with which to gather information about overall risk for PrU development and information specific to the tool’s subscales. More specifically, we learned that when the 4 nutritional subscale risk categories comprising the Braden nutrition subscale are used for preliminary screening of nutrition risk, the subsequently observed mean meal intake for residents who were at either moderate or high risk for PrU development tended to approximate the intake defined for the respective category. We believe that the insights gained into a resident’s expected pattern of dietary intake suggest that the nutrition subscale may be a useful adjunct to more comprehensive nutritional screening. The presence of a nutritional diagnosis was rare among residents in this sample suggesting that early dietary intervention may not have been sought in the absence of initial nutritional screening through a mechanism such as the Braden Scale. Although not a comprehensive nutritional assessment, results in this study confirm that a meaningful connection exists between assessed nutrition subscale risk category and recent dietary intake and suggests that the Braden Scale’s utility extends beyond that of screening for PrU risk. Although this study did not aim to conduct a comparison of Braden subscale domains and nutritional risk, we believe that the Braden Scale has the potential for broader application by considering the influence of the various subscale domains on nutritional risk. This was especially true in this study, since mobility and activity subscale ratings were associated with nutritional risk for residents with a nutritional risk rating of 1—Very Poor. The results of this study clearly support the need for interpretation of all of the Braden Subscale ratings in combination to derive the greatest benefit from the screening evaluation and should serve as a basis of care planning.
Weight loss frequently occurs in NH residents with 9.9% prevalence according to Minimum Data Set quality reporting (≥5% body weight in 30 days) [
25], is a negative indicator of resident condition, and is a trigger for feeding interventions. Liquid supplements and snacks are used frequently to prevent or treat residents with weight loss. In the study by Simmons and Patel [
9] where supplementation was the focus of the study, 100% of the residents studied had an order for supplements, yet observations showed that 58% did not receive any supplements, and of those who were offered a supplement 16% did not consume the supplement. It was posited by Simmons and Patel that staff time, awareness of supplement orders, of supervision, and lack of specificity of orders may contribute to low delivery and ingestion of supplements [
9]. Other studies also failed to show a benefit from supplementation, perhaps due to delayed utilization or inadequate amounts of supplement to make a difference [
11]. Although residents studied by Simmons and Patel were demographically (gender, race, age, diagnoses) similar to TURN residents, specific data about the type of supplement, amount, and frequency of delivery is unknown for the TURN residents.
In this study, monitoring of dietary intake in conjunction with weight loss or gain as indicators of dietary adequacy proved valuable in further documenting the connections between nutrition risk category, intake, and sustainability of weight. The study period (21 days) was of a relatively short duration and may have been too short to detect significant weight change among those with little nutritional risk. However, residents dietary intake was observed for a long enough period of time to demonstrate that despite mean meal consumption of 82% for those in the nutrition subscale risk category 3—Adequate, the amount consumed was sufficient to sustain body weight. However, when mean intake was below 50% as for those in the nutrition subscale risk category 1—Very Poor, residents were prone to weight loss. Thus, identification of a resident as being in category 1, should signal the need for dietary consult as soon as possible. Even though snacks were given to slightly more than half of all residents studied, consumption of snacks was limited to less than half in most instances. The contribution that snacks were expected to make to overall dietary intake was not realized, raising questions about the efficacy of their use and suggesting the need for further study that explores strategies for making snacks appealing for consumption and examines how use of feeding assistance might lead to an increase in the amount consumed. Feeding assistance has been shown previously to increase the estimated daily intake and results in increasing or maintaining weight compared to a control group [
10]; feeding assistance required on average 42 min for meals and 14 min/resident for snacks [
5].
Protein intake is recognized for its role in helping to maintain skin integrity, thus preventing PrU development, and in its restorative capacity for fostering ulcer healing. All residents, regardless of PrU risk level or nutrition risk category, consumed far fewer protein servings per day than the 4 servings typically associated with dietary adequacy. Despite the ability for most residents to sustain weight during the study period, this shortfall in protein intake is of significant concern to overall health, especially if sustained over longer periods of time. Older adults are known to be susceptible to muscle wasting making adequate protein intake along with appropriate activity critical to their ability to maintain an optimal level of functional well-being.
Little definitive evidence exists to provide clear nutritional conclusions and recommendations for prevention of PrUs due to mixed findings and low quality studies despite the large amount of research concerning nutrition and PrU development. In a recent Cochrane Review [
26], 11 randomized controlled trials tested medical nutrition therapy as an intervention to prevent PrUs. Overall findings were a lower incidence of PrU in control groups, but only one study’s findings reached statistical significance. In a meta-analysis of eight studies, there was no clear evidence to support nutritional supplementation in PrU prevention, concluding that it is unclear if nutritional supplementation reduces PrU development [
26]. Although evidence is lacking to support specific nutritional interventions for PrU prevention, experts historically agree that nutrition should be included in the comprehensive care plan for prevention and management of PrUs [
27]. In 2014, experts from the National Pressure Ulcer Advisory Panel (NPUAP), the European Pressure Ulcer Advisory Panel (EPUAP), and the Pan Pacific Pressure Injury Alliance (PPPIA) collaborative developed evidence-based recommendations for the prevention and treatment of PrUs that could be used worldwide [
28]. The experts of this collaborative effort identified and critically appraised published scientific evidence, and determined specific recommendations in numerous categories for PrU prevention, including risk assessment, skin care, dressings, support surfaces, and medical devices [
29].
Furthermore, the NPUAP/EPUAP/PPPIA practice guidelines include nutrition screening, nutrition assessment, care planning, energy intake, protein intake, hydration, and intake of vitamins and minerals [
29]. Individuals at risk for a PrU or who have a PrU should be provided with a balanced diet that includes good sources of vitamins and minerals and receive vitamin and mineral supplements when nutritional deficiencies are present. It is also recommend that high-calorie, high-protein nutritional supplements should be offered to individuals whose meal intake is inadequate, while renal function is assessed and monitored along with encouragement of adequate daily fluid intake.
Upon admission and with each condition change, NPUAP/EPUAP/PPPIA practice guidelines recommend that a nutritional status screen and assessment should be performed with a valid and reliable nutrition and screening tool [
29]. When nursing staff determine residents are at nutritional risk and/or have an existing PrU, the resident should be referred to a registered dietician (RD) or interprofessional nutrition team for comprehensive nutrition assessment. After nursing staff perform nutritional screening with a tool, such as the Braden Scale’s nutrition subscale, it is recommended that each resident be assessed from a nutritional perspective to include weight status, weight history, and determination of significant weight loss. The importance of taking into consideration the resident’s ability to eat independently and the adequacy of total nutrient intake is emphasized and consistent with the findings in this study.
The Braden Scale nutrition subscale is considered acceptable for use as a nutritional risk screening tool [
27] and can be used for the first level nutrition screening described in the NPUAP/EPUAP/PPPIA practice guidelines, In addition to determining risk level, the usual food intake pattern component of the Braden Scale nutrition subscale offers clues to an individual’s hydration status and adequacy of total nutrient intake, including potential need for protein and nutrient supplementation. These data in conjunction with those from a more comprehensive nutrition assessment performed by the RD or interprofessional nutritional team serve as a valuable foundational resource in development of an individualized nutrition plan that helps to prevent PrU development and contributes to healing of existing PrUs.


