Examining Differential Resilience Mechanisms by Comparing ‘Tipping Points’ of the Effects of Neighborhood Conditions on Anxiety by Race/Ethnicity


Abstract
:1. Introduction
2. Methods
2.1. Study Description
2.2. Measures
2.3. Analysis
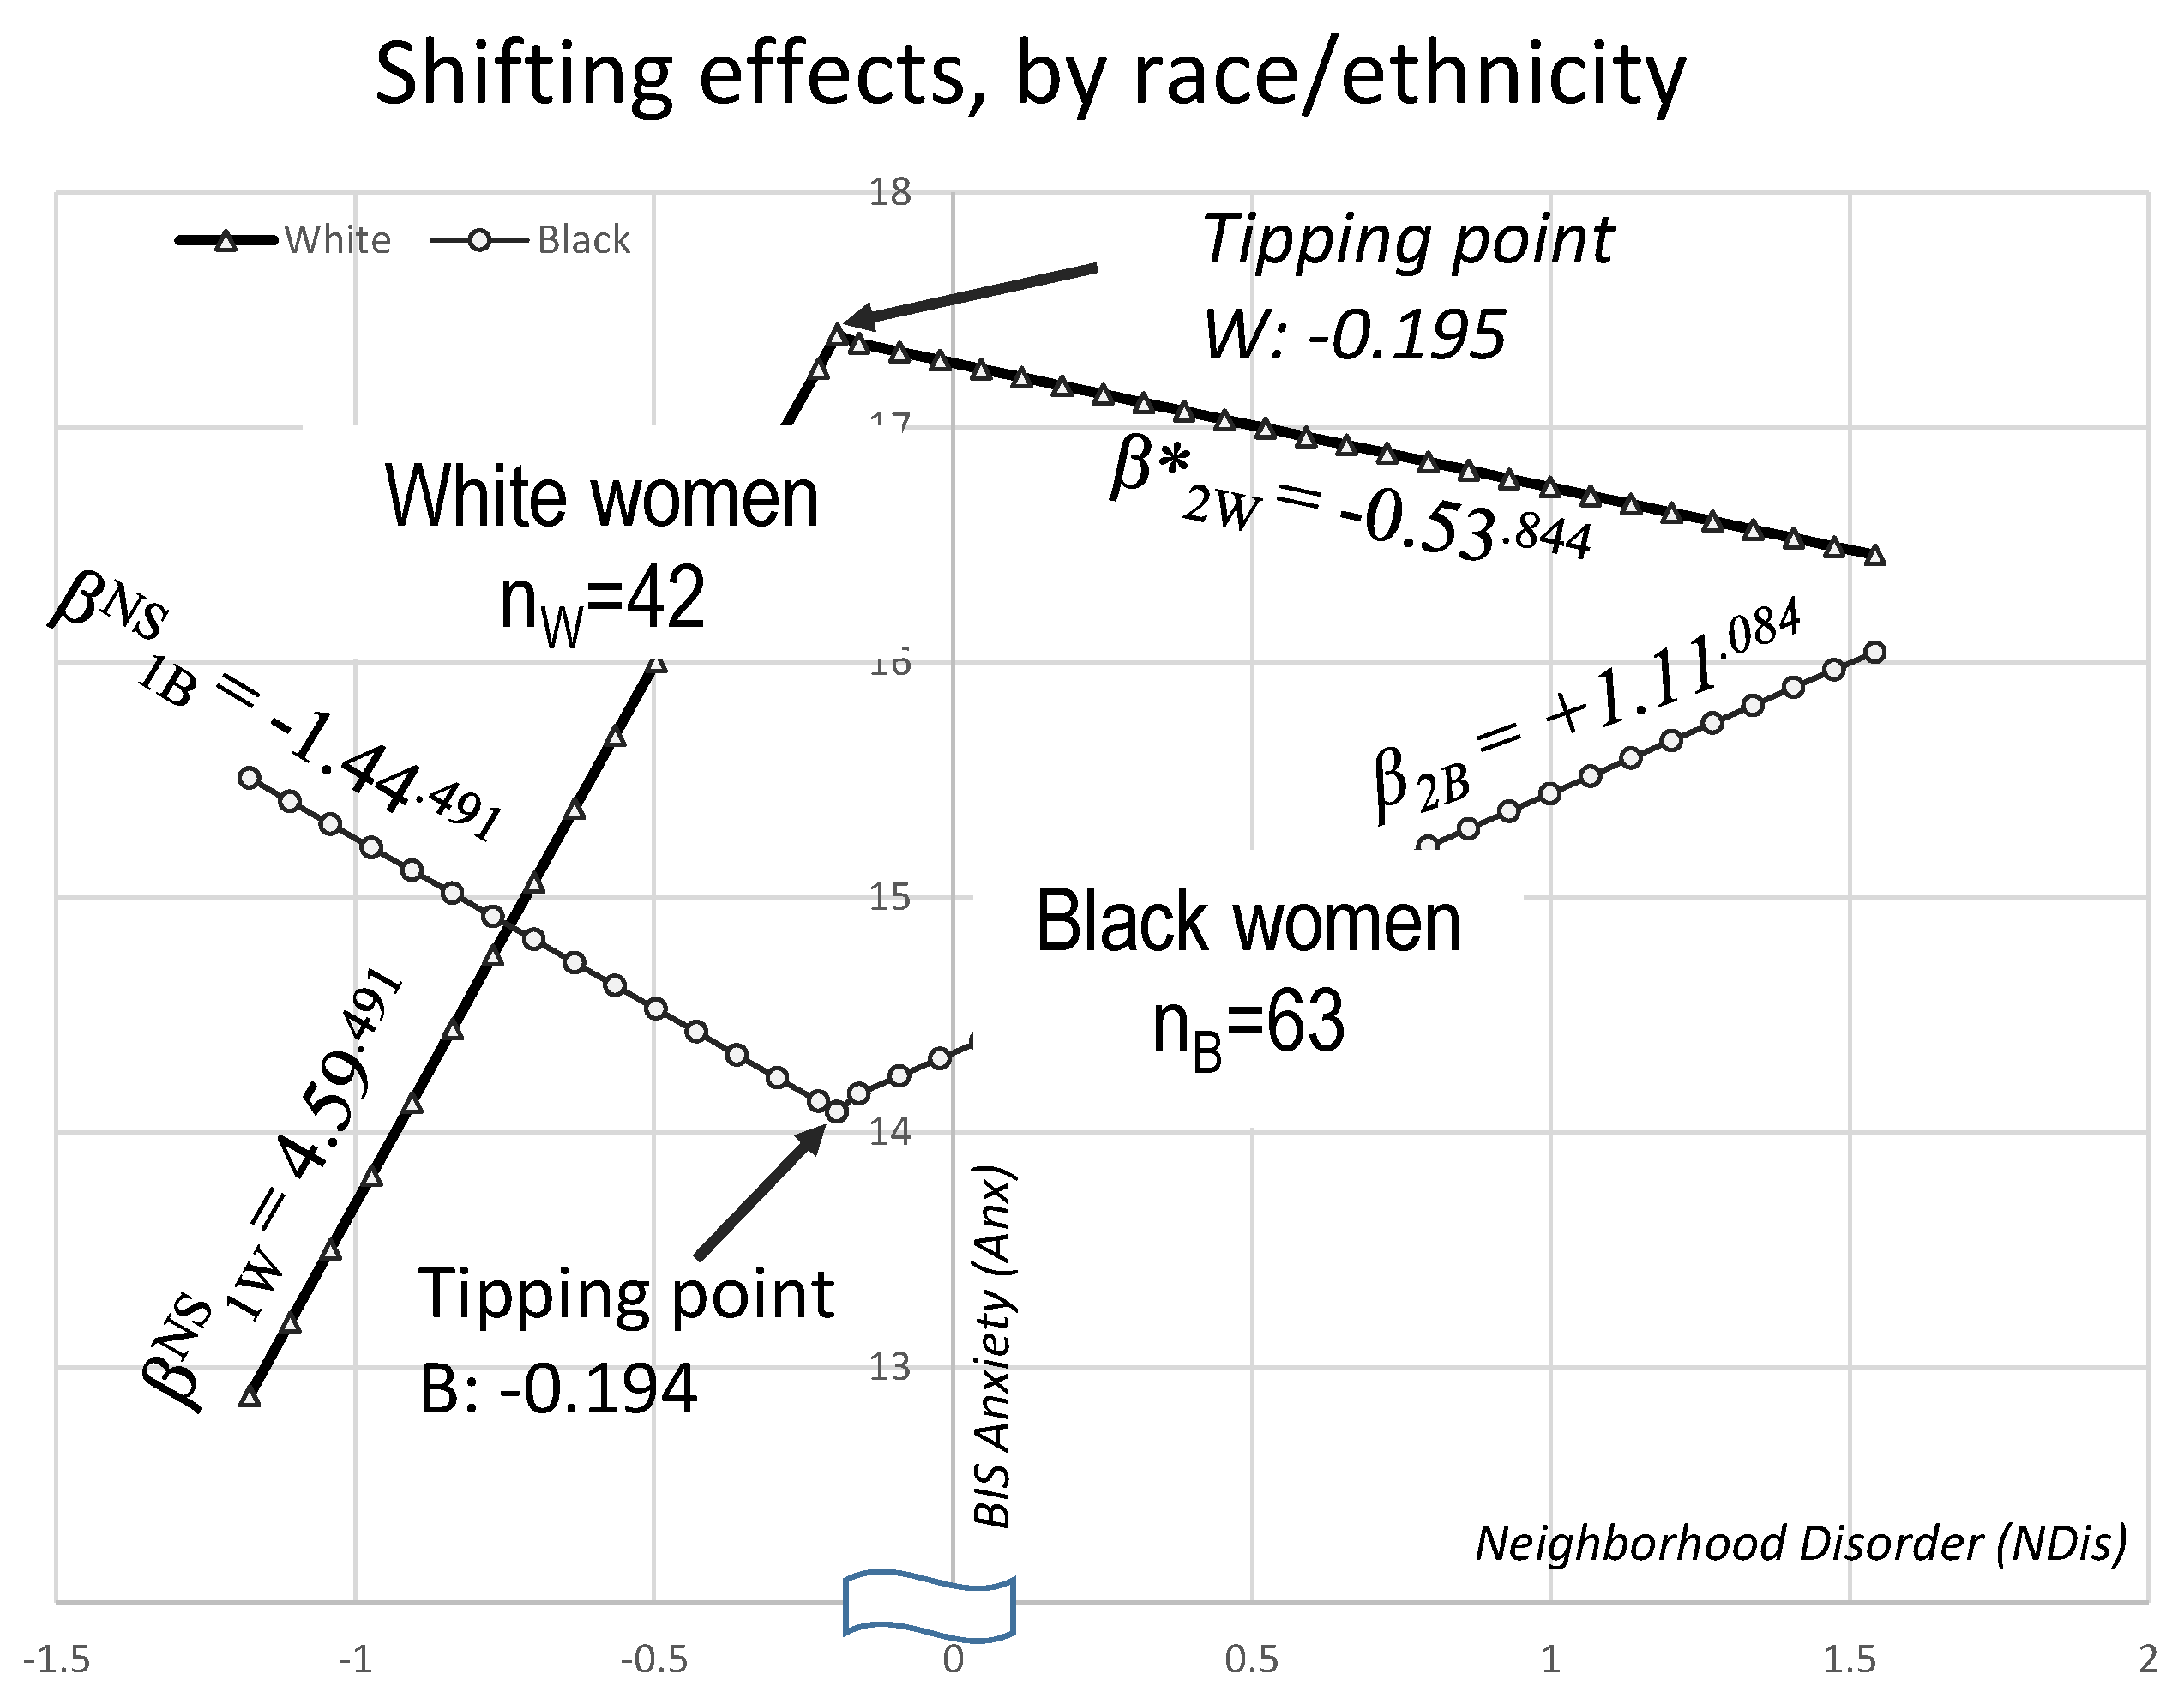
3. Results
4. Discussion
Limitations and Extensions
5. Conclusions
Supplementary Materials
Acknowledgments
Author Contributions
Ethical statement
Conflicts of Interest
References
- Macintyre, S.; Ellaway, A.; Cummins, S. Place effects on health: How can we conceptualise, operationalise and measure them? Soc. Sci. Med. 2002, 55, 125–139. [Google Scholar] [CrossRef]
- Macy, J.T.; Chassin, L.; Presson, C.C. Predictors of health behaviors after the economic downturn: A longitudinal study. Soc. Sci. Med. 2013, 89, 8–15. [Google Scholar] [CrossRef] [PubMed]
- Gold, R.; Michael, Y.L.; Whitlock, E.P.; Hubbell, F.A.; Mason, E.D.; Rodriguez, B.L.; Safford, M.M.; Sarto, G.E. Race/ethnicity, socioeconomic status, and lifetime morbidity burden in the women’s health initiative: A cross-sectional analysis. J. Women’s Health 2006, 15, 1161–1173. [Google Scholar] [CrossRef] [PubMed]
- Power, C.; Hertzman, C. Social and biological pathways linking early life and adult disease. Br. Med. Bull. 1997, 53, 210–221. [Google Scholar] [CrossRef] [PubMed]
- Latkin, C.A.; Curry, A.D. Stressful neighborhoods and depression: a prospective study of the impact of neighborhood disorder. J. Health Soc. Behav. 2003, 44, 34–44. [Google Scholar] [CrossRef] [PubMed]
- Hale, L.; Hill, T.D.; Friedman, E.; Nieto, F.J.; Galvao, L.W.; Engelman, C.D.; Malecki, K.M.; Peppard, P.E. Perceived neighborhood quality, sleep quality, and health status: Evidence from the Survey of the Health of Wisconsin. Soc. Sci. Med. 2013, 79, 16–22. [Google Scholar] [CrossRef] [PubMed]
- Hill, T.D.; Burdette, A.M.; Hale, L. Neighborhood disorder, sleep quality, and psychological distress: Testing a model of structural amplification. Health Place 2009, 15, 1006–1013. [Google Scholar] [CrossRef] [PubMed]
- Wen, M.; Hawkley, L.C.; Cacioppo, J.T. Objective and perceived neighborhood environment, individual SES and psychosocial factors, and self-rated health: An analysis of older adults in Cook County, Illinois. Soc. Sci. Med. 2006, 63, 2575–2590. [Google Scholar] [CrossRef] [PubMed]
- Karb, R.A.; Elliott, M.R.; Dowd, J.B.; Morenoff, J.D. Neighborhood-level stressors, social support, and diurnal patterns of cortisol: The Chicago Community Adult Health Study. Soc. Sci. Med. 2012, 75, 1038–1047. [Google Scholar] [CrossRef] [PubMed]
- Carolyn, E.C.; Gail, W.; Kristin, A.W. Neighborhood Characteristics and Depression: An Examination of Stress Processes. Curr. Dir. Psychol. Sci. 2006, 15, 188–192. [Google Scholar] [CrossRef]
- Jencks, C.; Mayer, S.E. The social consequences of growing up in a poor neighborhood. In Inner-City Poverty in the United States; Lynn, L.E., Jr., McGeary, M.G.H., Eds.; National Academy Press: Washington, DC, USA, 1990; pp. 111–186. [Google Scholar]
- Harding, D.J. Counterfactual models of neighborhood effects: The effect of neighborhood poverty on dropping out and teenage pregnancy. Am. J. Soc. 2003, 109, 676–719. [Google Scholar] [CrossRef]
- Crowder, K.; South, S.J. Spatial and temporal dimensions of neighborhood effects on high school graduation. Soc. Sci. Res. 2011, 40, 87–106. [Google Scholar] [CrossRef] [PubMed]
- Garbarski, D. Racial/ethnic disparities in midlife depressive symptoms: The role of cumulative disadvantage across the life course. Adv. Life Course Res. 2015, 23, 67–85. [Google Scholar] [CrossRef] [PubMed]
- Levine, M.E.; Crimmins, E.M. Evidence of accelerated aging among African Americans and its implications for mortality. Soc. Sci. Med. 2014, 118, 27–32. [Google Scholar] [CrossRef] [PubMed]
- Stewart, D.E.; Yuen, T. A systematic review of resilience in the physically ill. Psychosomatics 2011, 52, 199–209. [Google Scholar] [CrossRef] [PubMed]
- Ford, B.Q.; Mauss, I.B. Culture and emotion regulation. Curr. Opin. Psychol. 2015, 3, 1–5. [Google Scholar] [CrossRef] [PubMed]
- Assari, S. The Benefits of Higher Income in Protecting against Chronic Medical Conditions Are Smaller for African Americans than Whites. Healthcare 2018, 6, 2. [Google Scholar] [CrossRef] [PubMed]
- Assari, S. Whites but Not Blacks Gain Life Expectancy from Social Contacts. Behav. Sci. 2017, 7, 68. [Google Scholar] [CrossRef] [PubMed]
- Boker, S.M.; Montpetit, M.A.; Hunter, M.D.; Bergeman, C.S. Modeling resilience with differential equations. In Learning and Development: Individual Pathways of Change; Molenaar, P., Newel, K., Eds.; American Psychological Association: Washington, DC, USA, 2010; pp. 183–206. [Google Scholar]
- Christensen, K.; Aldao, A. Tipping points for adaptation: connecting emotion regulation, motivated behavior, and psychopathology. Curr. Opin. Psychol. 2015, 3, 70–74. [Google Scholar] [CrossRef]
- Sunder, P.K.; Grady, J.J.; Wu, Z.H. Neighborhood and Individual Factors in Marijuana and Other Illicit Drug Use in a Sample of Low-income Women. Am. J. Community Psychol. 2007, 40, 167–180. [Google Scholar] [CrossRef] [PubMed]
- Wu, Z.H.; Tennen, H.; Hosain, G.M.M.; Coman, E.; Cullum, J.; Berenson, A.B. Stress Mediates the Relationship Between Past Drug Addiction and Current Risky Sexual Behaviour Among Low-income Women. Stress Health 2016, 32, 138–144. [Google Scholar] [CrossRef] [PubMed]
- Carver, C.S.; White, T.L. Behavioral inhibition, behavioral activation, and affective responses to impending reward and punishment: The BIS/BAS Scales. J. Pers. Soc. Psychol. 1994, 67, 319–333. [Google Scholar] [CrossRef]
- Poythress, N.G.; Skeem, J.L.; Weir, J.; Lilienfeld, S.O.; Douglas, K.S.; Edens, J.F.; Kennealy, P.J. Psychometric properties of Carver and White’s (1994) BIS/BAS scales in a large sample of offenders. Pers. Individ. Dif. 2008, 45, 732–737. [Google Scholar] [CrossRef] [PubMed]
- De Leon, C.F.M.; Cagney, K.A.; Bienias, J.L.; Barnes, L.L.; Skarupski, K.A.; Scherr, P.A.; Evans, DA. Neighborhood social cohesion and disorder in relation to walking in community-dwelling older adults: A multilevel analysis. J. Aging Health 2009, 21, 155–171. [Google Scholar] [CrossRef] [PubMed]
- Cagney, K.A.; Glass, T.A.; Skarupski, K.A.; Barnes, L.L.; Schwartz, B.S.; de Leon, C.F.M. Neighborhood-level cohesion and disorder: measurement and validation in two older adult urban populations. J. Gerontol. Ser. B 2009, 64, 415–424. [Google Scholar] [CrossRef] [PubMed]
- Bollen, K.A.; Lennox, R. Conventional wisdom on measurement: A structural equation perspective. Psychol. Bull. 1991, 110, 305–314. [Google Scholar] [CrossRef]
- Bollen, K.A. Multiple indicators: internal consistency or no necessary relationship? Qual. Quant. 1984, 18, 377–385. [Google Scholar] [CrossRef]
- Bollen, K.A.; Bauldry, S. Three Cs in measurement models: Causal indicators, composite indicators, and covariates. Psychol. Methods 2011, 16, 265–284. [Google Scholar] [CrossRef] [PubMed]
- Bacon, D.W.; Watts, D.G. Estimating the transition between two intersecting straight lines. Biometrika 1971, 58, 525–534. [Google Scholar] [CrossRef]
- Stata Corp. Stata Statistical Software: Release 15. StataCorp LP: College Station, TX, USA, 2017. [Google Scholar]
- Lunt, M. “Hockey Stick” Regression 2000. Available online: http://personalpages.manchester.ac.uk/staff/mark.lunt/nlhockey.hlp (accessed on 20 January 2018).
- Grimm, K.J.; Ram, N.; Estabrook, R. Growth Modeling: Structural Equation and Multilevel Modeling Approaches: Guilford Publications; Gullford Press: New York, NY, USA, 2017. [Google Scholar]
- Reese, R.A. Graphical interpretations of data: Walking the line. Significance 2017, 14, 42–43. [Google Scholar] [CrossRef]
- Kohli, N.; Harring, J.R. Modeling growth in latent variables using a piecewise function. Multivar. Behav. Res. 2013, 48, 370–397. [Google Scholar] [CrossRef] [PubMed]
- Ning, L.; Luo, W. Specifying Turning Point in Piecewise Growth Curve Models: Challenges and Solutions. Front. Appl. Math. Stat. 2017, 3. [Google Scholar] [CrossRef]
- Keyes, C.L. The Black–White paradox in health: Flourishing in the face of social inequality and discrimination. J. Pers. 2009, 77, 1677–1706. [Google Scholar] [CrossRef] [PubMed]
- Assari, S.; Caldwell, C. Neighborhood Safety and Major Depressive Disorder in a National Sample of Black Youth; Gender by Ethnic Differences. Children 2017, 4, 14. [Google Scholar] [CrossRef] [PubMed]
- Williams, D.R.; González, H.M.; Neighbors, H.; Nesse, R.; Abelson, J.M.; Sweetman, J.; Jackson, J.S. Prevalence and distribution of major depressive disorder in african americans, caribbean blacks, and non-hispanic whites: Results from the national survey of american life. Arch. Gen. Psychiatry 2007, 64, 305–315. [Google Scholar] [CrossRef] [PubMed]
- Clogg, C.C.; Petkova, E.; Haritou, A. Statistical methods for comparing regression coefficients between models. Am. J. Soc. 1995, 100, 1261–1293. [Google Scholar] [CrossRef]
- Matheson, F.I.; Moineddin, R.; Dunn, J.R.; Creatore, M.I.; Gozdyra, P.; Glazier, R.H. Urban neighborhoods, chronic stress, gender and depression. Soc. Sci. Med. 2006, 63, 2604–2616. [Google Scholar] [CrossRef] [PubMed]
- Assari, S. Unequal gain of equal resources across racial groups. Int. J. Health Policy Manag. 2018, 7, 1–9. [Google Scholar] [CrossRef] [PubMed]
- Assari, S. Health disparities due to diminished return among black Americans: Public policy solutions. Soc. Issues and Policy Rev. 2018, 12, 112–145. [Google Scholar] [CrossRef]
- Burke, J.; O’Campo, P.; Salmon, C.; Walker, R. Pathways connecting neighborhood influences and mental well-being: Socioeconomic position and gender differences. Soc. Sci. Med. 2009, 68, 1294–1304. [Google Scholar] [CrossRef] [PubMed]
- O’Campo, P.; Salmon, C.; Burke, J. Neighbourhoods and mental well-being: What are the pathways? Health Place 2009, 15, 56–68. [Google Scholar] [CrossRef] [PubMed]
- Elwert, F.; Winship, C. Effect heterogeneity and bias in main-effects-only regression models. In Heuristics, Probability and Causality: A Tribute to Judea Pearl; Dechter, R., Geffner, H., Halpern, J.Y., Eds.; College Publications: London, UK, 2010; pp. 327–336. [Google Scholar]
- Muthen, B.; Brown, H.C.; Hunter, A.M.; Cook, I.A.; Leuchter, A.F. General approaches to analysis of course: Applying growth mixture modeling to randomized trials of depression medication. In Causality and Psychopathology: Finding the Determinants of Disorders and Their Cures; Shrout, P.E., Keyes, K.M., Ornstein, K., Eds.; American Psychopathological Association: New York, NY, USA, 2011; pp. 159–178. [Google Scholar]
- Muthén, B.O. Latent Variable Mixture Modeling. In New Developments and Techniques in Structural Equation Modeling: Lawrence Erlbaum; Marcoulides, G.A., Schumacker, R.E., Eds.; Lawrence Erlbaum Associates: Mahwah, NJ, USA, 2001; pp. 1–34. [Google Scholar]
- Lubke, G.H.; Muthén, B. Investigating Population Heterogeneity With Factor Mixture Models. Psychol. Methods 2005, 10, 21–39. [Google Scholar] [CrossRef] [PubMed]
- Muthén, L.K.; Muthén, B.O. Mplus User’s Guide, Version 8; Muthén & Muthén: Los Angeles, CA, USA, 2017. [Google Scholar]
- Helms, J.E.; Parham, T.A. The racial identity attitude scale. In Handbook of Tests and Measurements for Black Populations1996; Jones, R.L., Ed.; Cobb & Henry: Hampton, VA, USA, 1996; pp. 167–174. [Google Scholar]
- Asparouhov, T.; Muthén, B. Auxiliary Variables in Mixture Modeling: Three-Step Approaches Using Mplus. Struct. Equ. Model. 2014, 21, 329–341. [Google Scholar] [CrossRef]
- Elwert, F. Graphical Causal Models. In Handbook of Causal Analysis for Social Research. Morgan; Morgan, S.L., Ed.; Springer: New York, NY, USA, 2013; pp. 245–273. [Google Scholar]

| Race/Ethnicity→ Measures↓ | White (nW = 42) | Black (nB = 63) | |||
|---|---|---|---|---|---|
| N | %s | N | %s | p∆ | |
| Employment | 0.089 | ||||
| Unemployed | 14 | 34 | 25 | 40 | |
| Homemaker | 5 | 12 | 5 | 8 | |
| Part-time | 10 | 24 | 5 | 8 | |
| Full-time | 12 | 29 | 27 | 44 | |
| Education | 0.322 | ||||
| <High school | 12 | 29 | 23 | 37 | |
| High school | 21 | 50 | 33 | 52 | |
| >High school | 9 | 21 | 7 | 11 | |
| Marital status | 0.002 | ||||
| Married | 8 | 19 | 4 | 6 | |
| Cohabitating | 17 | 40 | 14 | 22 | |
| With boyfriend | 10 | 24 | 38 | 60 | |
| No boyfriend | 7 | 17 | 7 | 11 | |
| Mean (M) and SD | M | SD | M | SD | |
| Age | 21.90 | 3.36 | 22.46 | 3.71 | 0.219 |
| Income ($US thousands/year) | 4.39 | 7.50 | 5.27 | 6.96 | 0.306 |
| Neighborhood disorder (NDis) | –0.18 | 0.56 | 0.18 | 0.65 | 0.008 |
| BIS anxiety (Anx) | 14.57 | 2.54 | 13.48 | 2.04 | 0.002 |
| Race/Ethnicity→ Effects↓ | White (nW = 42) | Black (nB = 63) | ||
|---|---|---|---|---|
| Effects and tipping points | Estimate | SE | Estimate | SE |
| Classic NDis →anxiety effect | –0.02 NS | (0.12) | 0.19 A | (0.12) |
| NDis → anxiety effect 1 | 4.59 NS | (3.17) | –1.44 NS | (2.06) |
| NDis tipping point | –0.195 NS | (0.19) | –0.194 * | (0.09) |
| NDis → anxiety effect 2 | –0.53 NS | (2.65) | 1.11 B | (0.61) |
© 2018 by the authors. Licensee MDPI, Basel, Switzerland. This article is an open access article distributed under the terms and conditions of the Creative Commons Attribution (CC BY) license (http://creativecommons.org/licenses/by/4.0/).
Share and Cite
Coman, E.N.; Wu, H.Z. Examining Differential Resilience Mechanisms by Comparing ‘Tipping Points’ of the Effects of Neighborhood Conditions on Anxiety by Race/Ethnicity. Healthcare 2018, 6, 18. https://doi.org/10.3390/healthcare6010018
Coman EN, Wu HZ. Examining Differential Resilience Mechanisms by Comparing ‘Tipping Points’ of the Effects of Neighborhood Conditions on Anxiety by Race/Ethnicity. Healthcare. 2018; 6(1):18. https://doi.org/10.3390/healthcare6010018
Chicago/Turabian StyleComan, Emil Nicolae, and Helen Zhao Wu. 2018. "Examining Differential Resilience Mechanisms by Comparing ‘Tipping Points’ of the Effects of Neighborhood Conditions on Anxiety by Race/Ethnicity" Healthcare 6, no. 1: 18. https://doi.org/10.3390/healthcare6010018
APA StyleComan, E. N., & Wu, H. Z. (2018). Examining Differential Resilience Mechanisms by Comparing ‘Tipping Points’ of the Effects of Neighborhood Conditions on Anxiety by Race/Ethnicity. Healthcare, 6(1), 18. https://doi.org/10.3390/healthcare6010018