Article

Design and Characterization of ITO-Covered Resonant Nanopillars for Dual Optical and Electrochemical Sensing

by
Luca Tramarin
1,2,3,
Rafael Casquel
1,2,3,
Jorge Gil-Rostra
4,
Miguel Ángel González-Martínez
5,
Raquel Herrero-Labrador
1,3,
Ana María M. Murillo
1,2,3,
María Fe Laguna
1,2,3,
María-José Bañuls
5,
Agustín R. González-Elipe
4 and
Miguel Holgado
1,2,3,*
1
Optics, Photonics and Biophotonics Group, Centro de Tecnología Biomédica, Campus de Montegancedo, Universidad Politécnica de Madrid (UPM), 28223 Pozuelo de Alarcón, Spain
2
Departamento de Física Aplicada e Ingeniería de Materiales, Escuela Técnica Superior de Ingenieros Industriales, Universidad Politécnica de Madrid (UPM), C/José Gutierrez Abascal 2, 28006 Madrid, Spain
3
Group of Organ and Tissue on-a-Chip and In-Vitro Detection, Instituto de Investigación Sanitaria del Hospital Clínico San Carlos, IdISSC, C/Profesor Martín Lagos s/n, 4ª Planta Sur, 28040 Madrid, Spain
4
Nanotechnology on Surfaces Group, Instituto de Ciencia de Materiales de Sevilla (ICMS-US-CSIC), Américo Vespucio 49, 41092 Seville, Spain
5
Instituto Interuniversitario de Investigación de Reconocimiento Molecular y Desarrollo Tecnológico (IDM), Departamento de Química, Universitat Politècnica de València, Camino de Vera s/n, 46022 Valencia, Spain
*
Author to whom correspondence should be addressed.
Chemosensors 2022, 10(10), 393; https://doi.org/10.3390/chemosensors10100393
Submission received: 23 August 2022 / Revised: 14 September 2022 / Accepted: 21 September 2022 / Published: 28 September 2022
(This article belongs to the Special Issue Nanophotonic Biosensors: Challenges and Development)

Abstract

:
In this work we present a dual optical and electrochemical sensor based on SiO2/Si3N4 resonant nanopillars covered with an indium tin oxide (ITO) thin film. A 25–30 nm thick ITO layer deposited by magnetron sputtering acts as an electrode when incorporated onto the nanostructured array, without compromising the optical sensing capability of the nanopillars. Bulk sensing performances before and after ITO deposition have been measured and compared in accordance with theoretical calculations. The electrochemical activity has been determined by the ferri/ferrocyanide redox reaction, showing a remarkably higher activity than that of flat thin films of similar ITO nominal thickness, and proving that the nanopillar system covered by ITO presents electrical continuity. A label-free optical biological detection has been performed, where the presence of amyloid-β has been detected through an immunoassay enhanced with gold nanoparticles. Again, the experimental results have been corroborated by theoretical simulations. We have demonstrated that ITO can be a beneficial component for resonant nanopillars sensors by adding potential electrochemical sensing capabilities, without significantly altering their optical properties. We foresee that resonant nanopillars coated with a continuous ITO film could be used for simultaneous optical and electrochemical biosensing, improving the robustness of biomolecular identification.

1. Introduction

Optical sensors have been at the forefront of the technological advances of the last years. The application of devices for biological and chemical sensing by optical measurements has witnessed an extraordinary growth in different directions, demonstrating the importance and flexibility of this increasingly evolving sector [1,2,3,4]. Of all available options, the implementation of sensors with specific micro- and nano-structured morphologies in the form of periodic arrays [5,6] has allowed a precise optical response, which can be tailored relying on both a smart shaping and size selection of the nanostructures (diameter, pitch, thickness) and the adequate selection of the materials integrated in such structures. Optical biosensors based on nanopillars [5,6,7] are a good option in this area because they provide a straightforward interrogation at normal incidence and high sensitivity due to a larger contact surface area with the medium, compared with flat sensors. An advanced and highly performant version of said configuration, developed by Hernández et al., consisted of resonant nanopillars (R-NPs) arrays [8]. These transducers are composed of periodic nanopillars fabricated top-down from a stacked multi-layered structure of two stacked Bragg reflectors (for instance, various pairs of Si3N4/SiO2 reflectors), separated by a central resonant cavity of SiO2. This configuration, when vertically interrogated in reflection mode, shows a pronounced and narrow resonant dip in the visible spectrum. The position of the dip is sensitive to changes in the refractive index (RI) of the surrounding medium, producing a shift in the resonant mode that depends on the conditions of the environment. Since the effective RI of the medium depends on the nature of the liquid, the presence of an analyte, or the condensation and infiltration of vapors [9], R-NPs have demonstrated a high potential as chemical and biological label-free optical sensors.
Among the materials that gained notoriety for their wide applicability and unique proprieties, thin films of indium tin oxide (ITO) have been extensively researched in the last years and used in day-to-day products such as liquid crystal displays, solar cells, LED lightning or electrochemical sensors [10,11,12]. Main features of ITO thin films are high transparency in the visible spectrum, good conductivity, and significant chemical resistance, which, combined with a relatively easy manufacturing procedure compatible with sensitive substrates, make them a good choice for the fabrication of novel devices [13,14]. In particular, during the last two decades, numerous studies on the use of ITO for biological and chemical sensing have been published, both to enhance the response of existing devices—such as optical fibers and resonant cavities—and as main component of different sensor topologies [15,16,17,18]. Working principles of these ITO-based devices encompass the use of surface plasmon polariton features at the interface of ITO thin films, novel electrochemical sensors based on ITO electrodes, or optical switching and coding devices [19,20,21].
The present work explores the possibility to functionalize R-NPs arrays with ITO thin films, in order to merge the electrochemical activity of ITO and the photonic sensing response of the optical device. In this preliminary study, we describe the basic features of the modified sensor, prove that ITO continues acting as a suitable electrode when incorporated in the R-NPs array, and that the latter does not lose its optical sensing performance. For this work, ITO has been deposited on the R-NPs sensor surface by magnetron sputtering (MS) under well-controlled conditions [12]. We designate these modified chips as R-NPs/ITO. Bulk sensing performances of R-NPs before and after ITO coating have been measured and compared by infiltrating the nanostructured array with various RI liquids. Optical simulations have been carried out in order to sustain the evidence found. The electrochemical activity of the R-NPs/ITO arrays has been determined by the conventional ferrocyanide to ferricyanide redox reaction [22], widely used to test electrodes, and compared that with flat thin films of a similar nominal thickness. Furthermore, a label-free biological detection was performed to prove the suitability of the sensor for optical biosensing purposes, where the presence of amyloid-β (Aβ) peptide immobilized on R-NPs/ITO was detected by means of a sandwich-type immunoassay that employs gold nanoparticles (Au-NPs) functionalized with anti-amyloid-β (α-Aβ) antibody. Again, the experimental results have been corroborated by theoretical simulations. To the best of our knowledge, this is the first time that an ITO thin film has been used to cover a R-NPs photonic sensor, demonstrating that the optical properties of a full coated R-NPs array are not significantly altered, and that ITO can be a beneficial component for the design and implementation of R-NPs sensors. We foresee that, in line with recent works using other types of optical detection systems [23,24], R-NPs coated with a continuous ITO film will be used for simultaneous optical and electrochemical sensing, enabling a more robust identification of specific analytes.

2. Materials and Methods

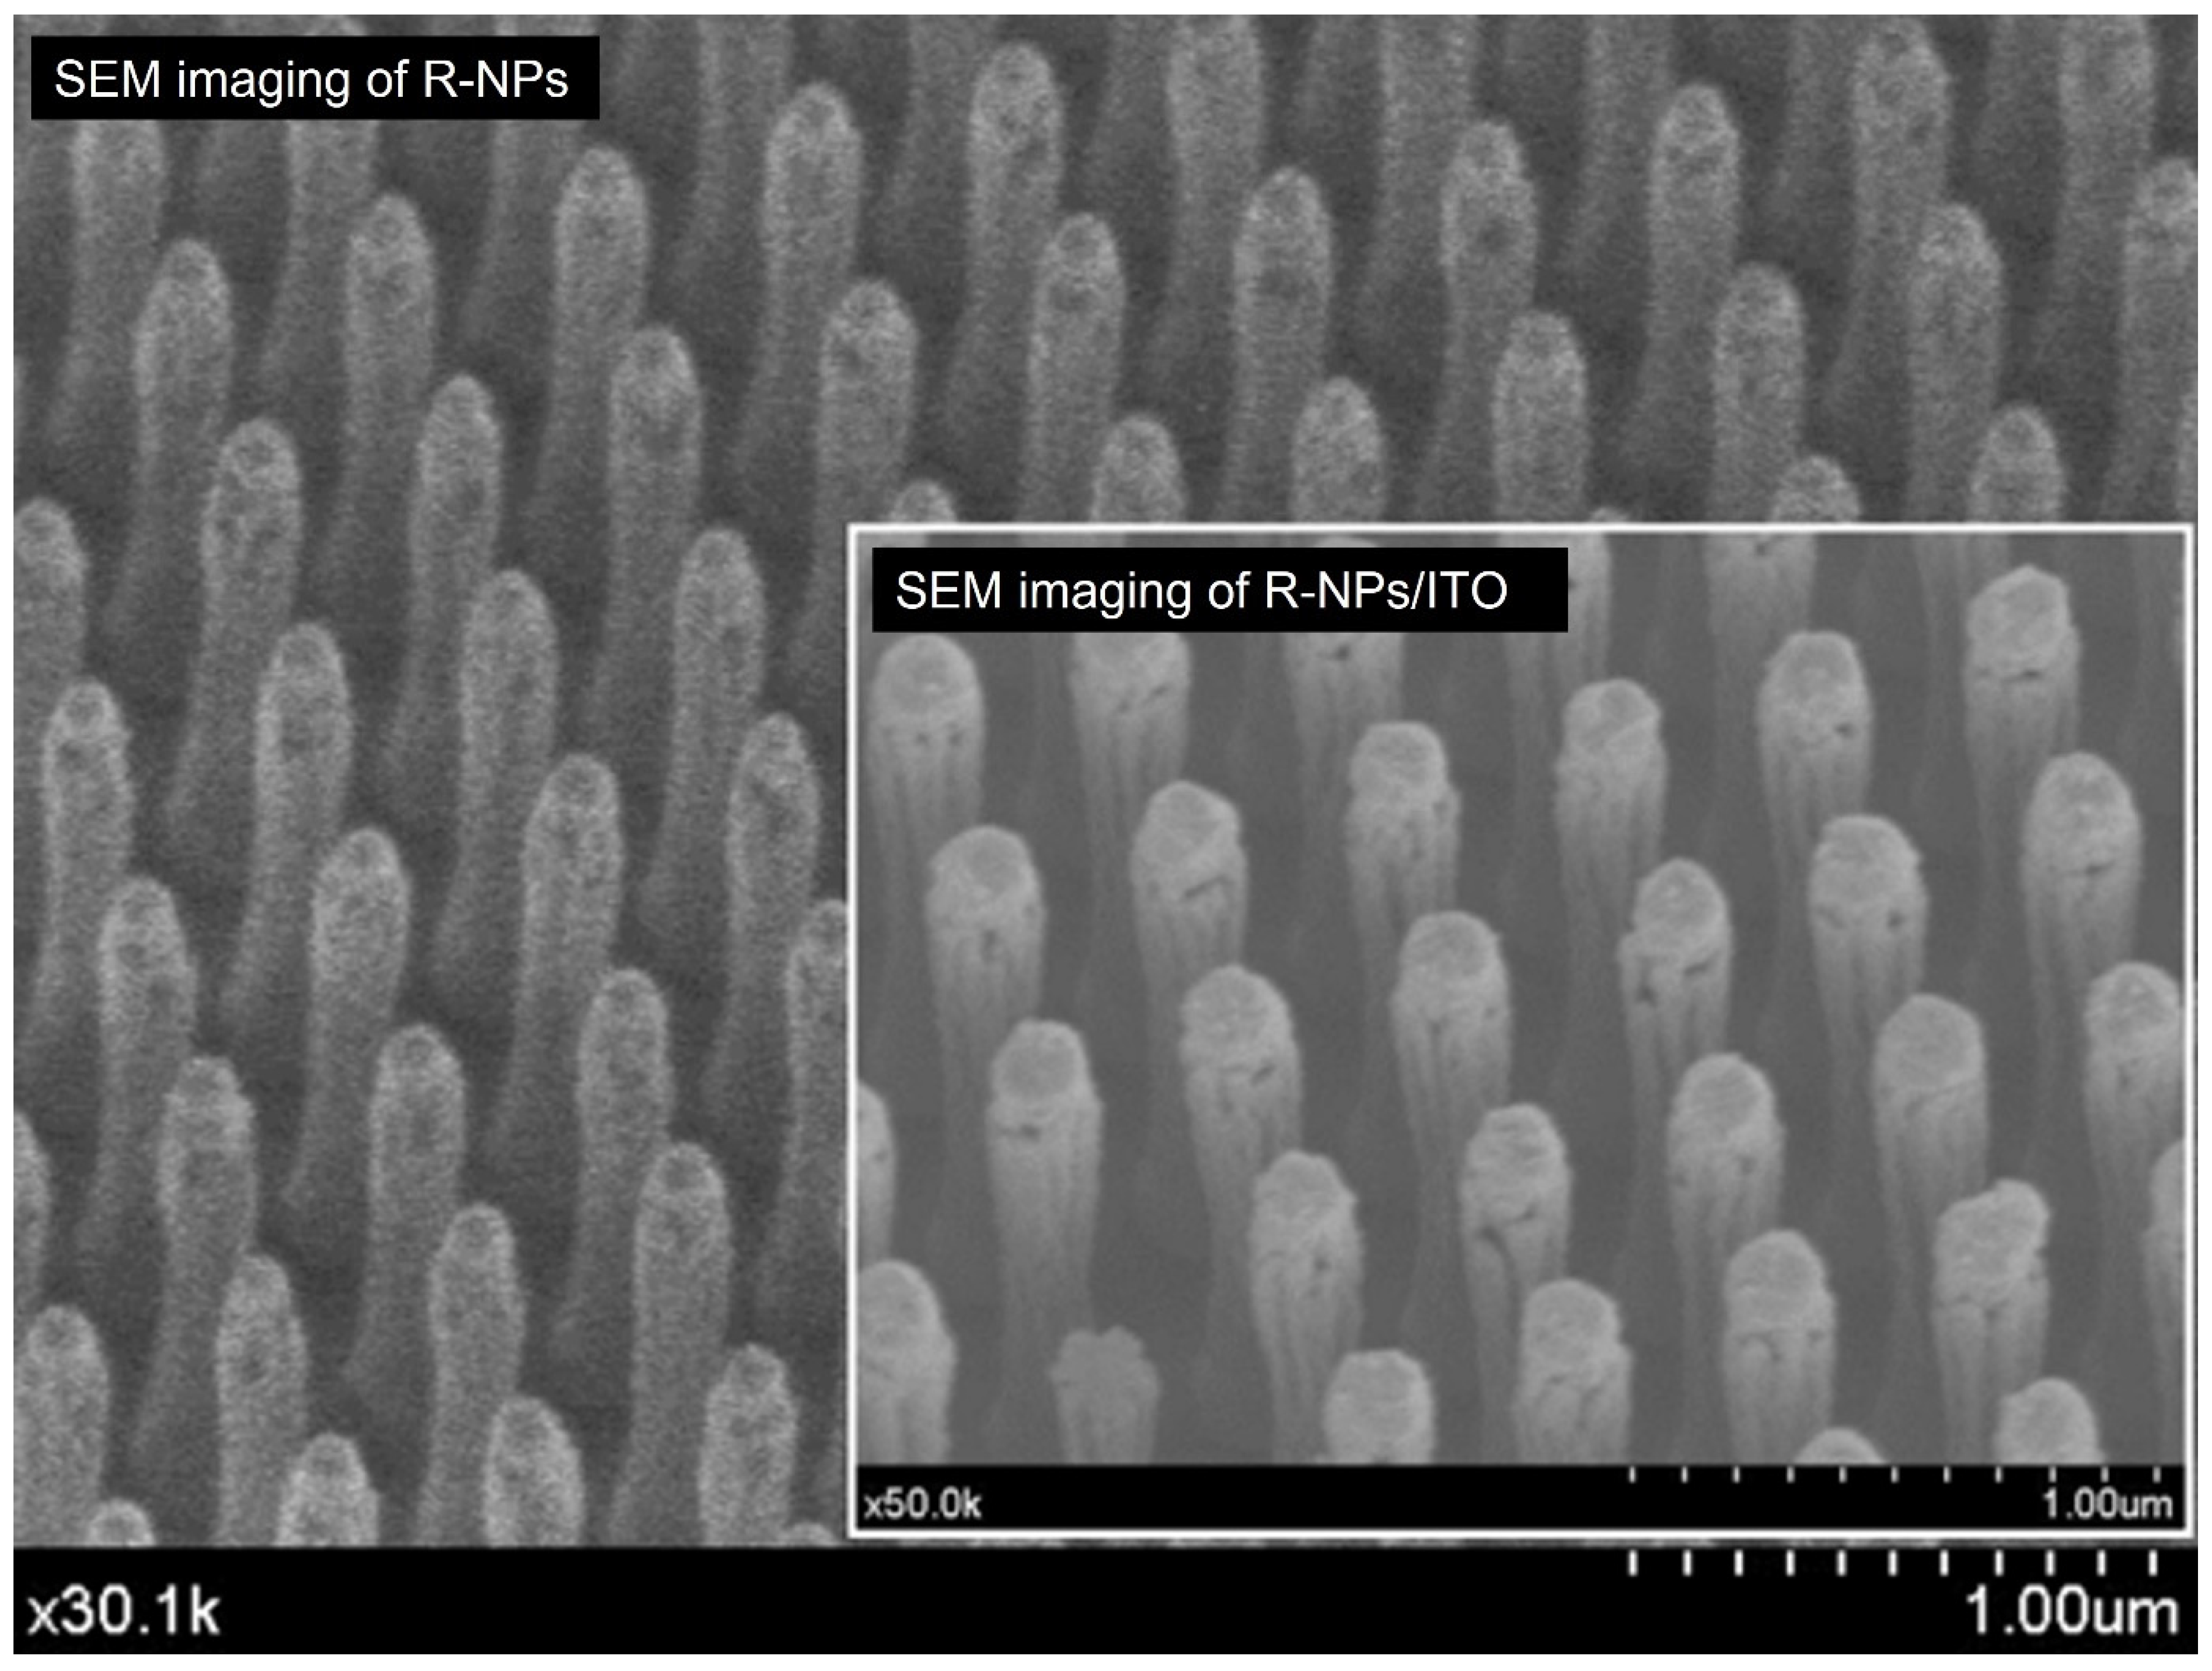
2.1. R-NPs Structure

In this work, we used chips with arrays of R-NPs made of a SiO2/Si3N4 multilayer grown onto a glass substrate. Diameter and period of the nanopillars are ca. 210 nm and 500 nm respectively, while their height is around 2 μm. The multilayer is successively composed of five pairs of SiO2/Si3N4 reflectors, a SiO2 resonant cavity, and five pairs of Si3N4/SiO2 reflectors. The thicknesses of each SiO2 and Si3N4 layer in the reflectors are 110 nm and 97 nm respectively, while the SiO2 resonant cavity thickness is 200 nm. Details on the fabrication of said chips have been previously published [25]. Performances regarding optical and biochemical sensing of the considered structures have been extensively studied, as reported elsewhere [8].

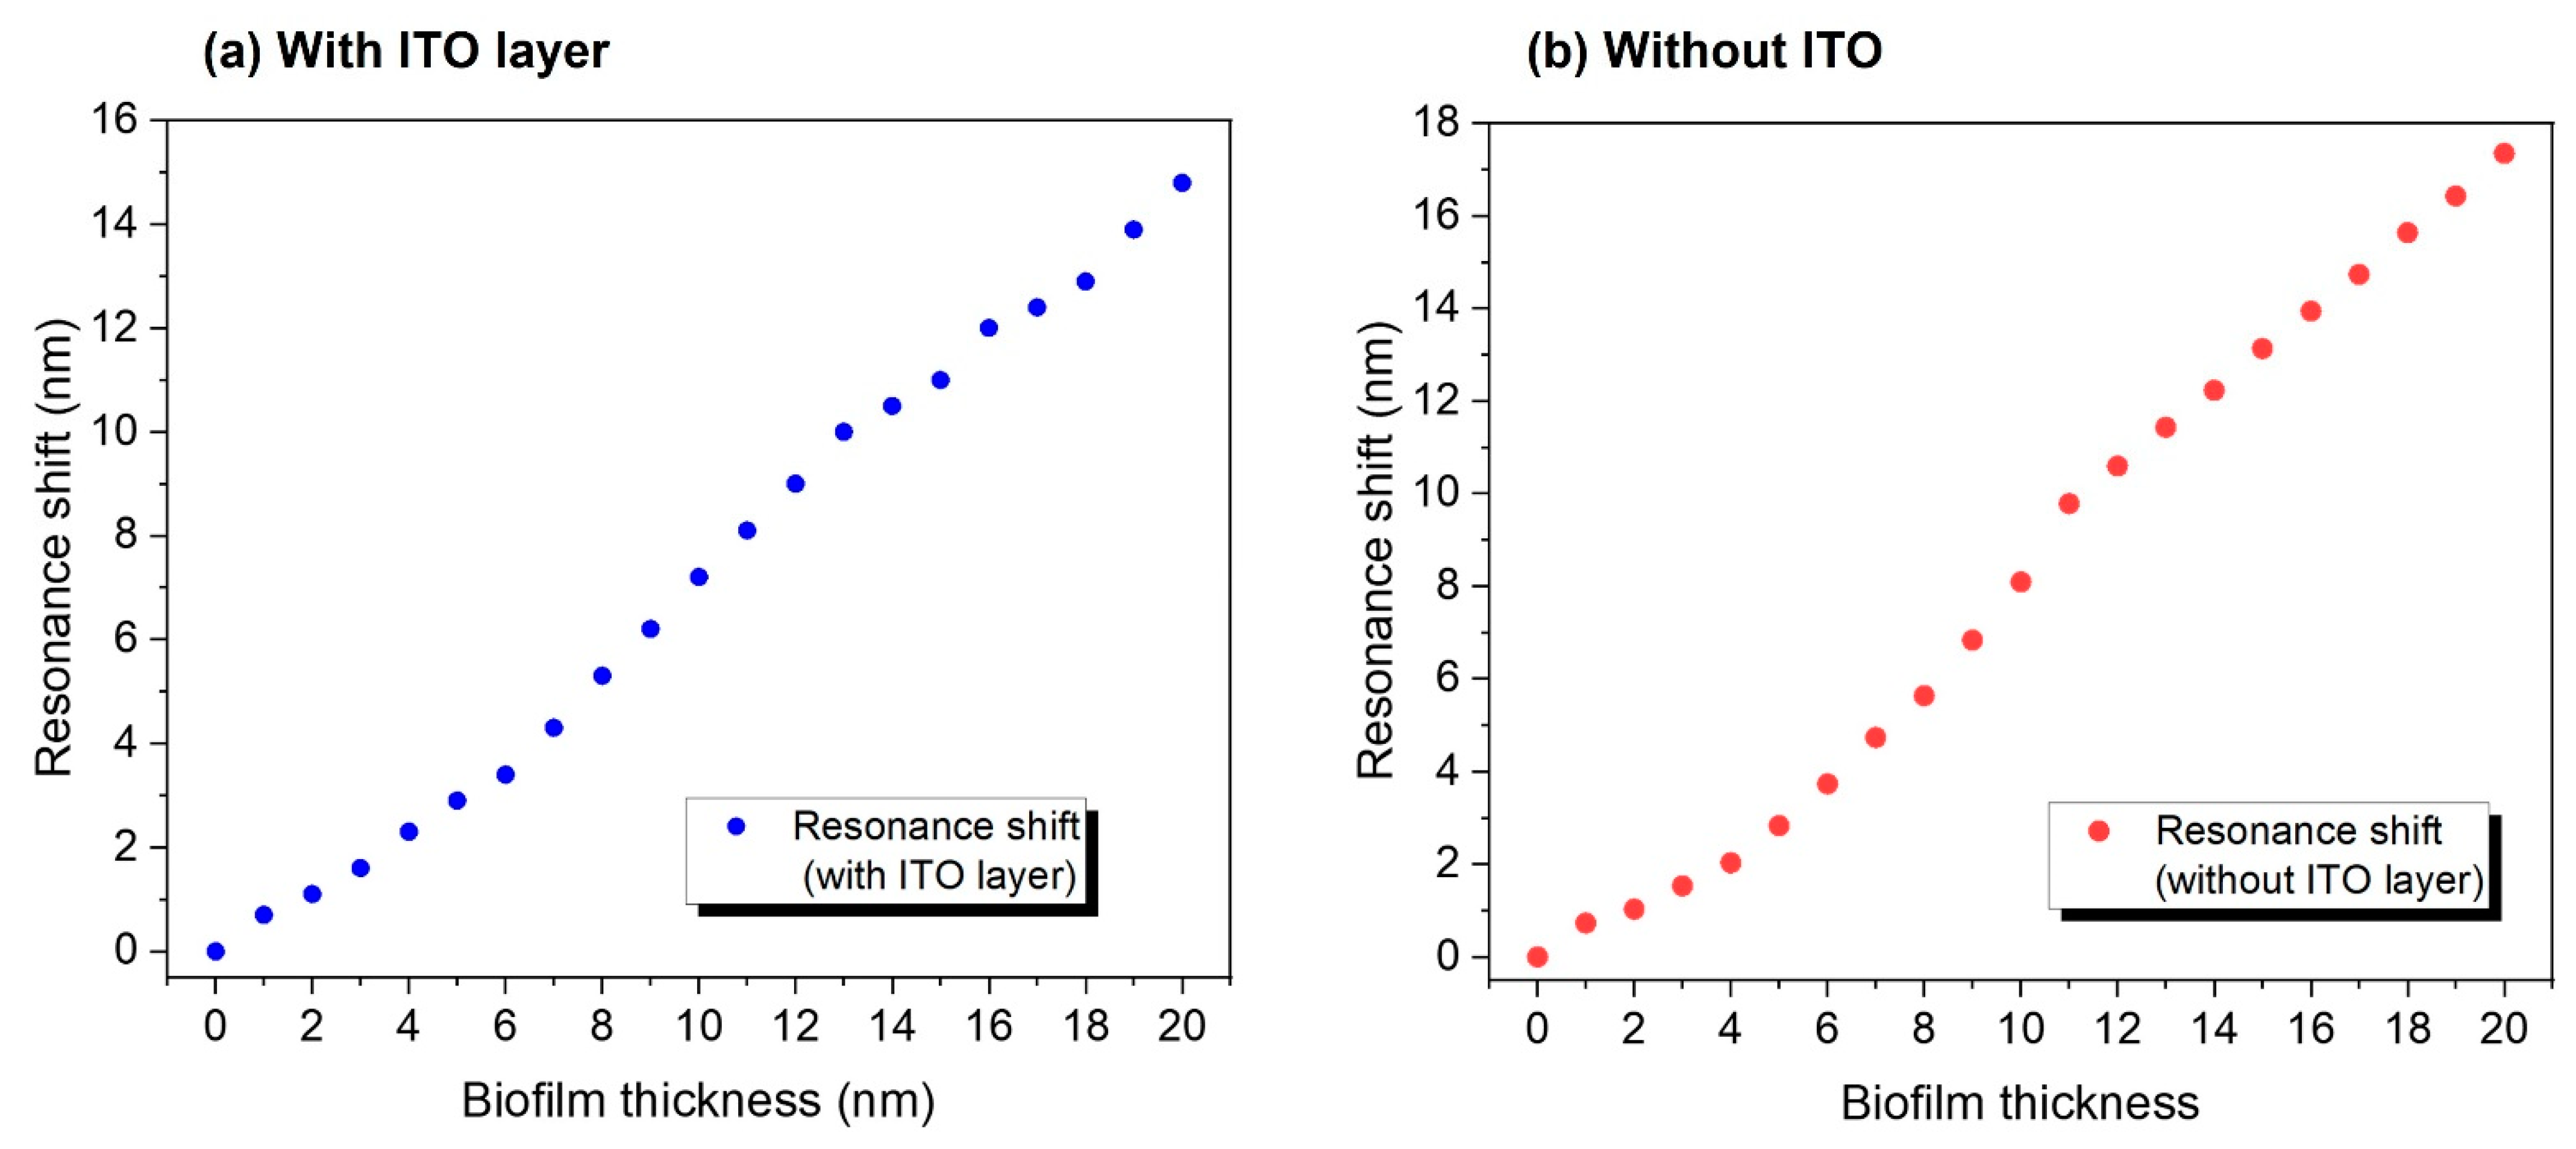
2.2. Optical Simulations

In order to predict the sensors optical response, simulations were carried out using Rsoft (RSoft Photonics CAD Suite, Version 2021.03, Synopsys Inc., Mountain View, CA, USA) and its module Fullwave [26]. This module uses finite difference time domain method for three dimensional calculations, and can be applied to estimate the reflectivity of the R-NPs under a variety of conditions. A particular feature of the software is that it allows the non-uniform gridding of the volume of simulation, reaching a resolution of 1 nm around the surface of the pillars. This is of particular importance for theoretically estimating the response of the material within a biosensing process. We have used this tool to estimate the thickness and RI of the ITO layer, the bulk sensing response before and after ITO, and the biosensing response for an increasing value of biofilm thickness over the pillars and the substrate, with a fixed RI of 1.41 for said biofilm.

2.3. ITO Thin Film Fabrication

ITO thin films were deposited by magnetron sputtering. The plasma gas pressure was regulated using a butterfly valve and controlled using a Pirani pressure meter, the Ar fluxes using a mass flow controller, and the deposition rates and thicknesses were controlled using a quartz microbalance located at a close position from the substrates. A cylindrical magnetron with a 3” ITO disc target (SnO2 10 wt% doped In2O3) (Testbourne Ltd.) was excited by means of a radiofrequency plasma source at 100 W. The reactor was fed with an Ar flux of 30 sccm and the deposition process was kept at a constant pressure of 5 × 10⁻³ mbar.
The substrate holder temperature was controlled at 350 °C, rotating at a spinning velocity of 20 rpm. Thickness deposition was adjusted to 80 nm on a flat substrate. The deposition was carried out simultaneously onto the R-NPs array (i.e., R-NPs/ITO) and onto samples of thin film on a flat silica substrate (TF/ITO) used for reference purposes.

2.4. Electrochemical Testing

All the electrochemical tests were recorded with an Autolab PGSTAT 302N potentiostat in a three-electrode cell, using Ag/AgCl as a reference electrode and a Pt wire as counter electrode. The samples were masked with a polyvinyl chloride (PVC) tape to selectively expose the area defined by the R-NPs arrays to the electrolyte. An image of the setup for electrochemical testing can be found in Supplementary Materials (Figure S1).
For the electrochemical tests Au-NPs were previously deposited on the ITO substrates by cyclic voltammetry (CV) electrodeposition following the conditions reported in previous works [27]. The electrolyte used was a 0.01 M Na2SO4 aqueous solution containing 0.01 M H2SO4 and 1 mM HAuCl4 3·H2O. The deposition was carried out by sweeping the potential of the working electrode between −0.5 V and 1.5 V, at a scan rate of 100 mV s−1 for three cycles.
Standard CV tests have been used to check the electrochemical activity of the ITO coatings, either on TF/ITO sample or onto the R-NPs/ITO sample. Specifically, K3Fe(CN)6 undergoes a reversible redox reaction (Fe(CN)63−/Fe(CN)64−) at various electrodes and is commonly used as a probe to analyze the electrochemical response of different electrode compositions or to compare the effect of a specific electrode microstructure. In this case, the electrolyte was an aqueous solution of 5 mM K3Fe(CN)6 containing 0.1 M KCl. The CV measurements were performed at a scan rate of 50 mV s−1.
The electrochemical surface active area (ECSA) of the samples was also determined by means of CV techniques relying on the Randles Sevcik equation. Polarization of the ITO electrodes was done in the non-faradaic potential range between 0.05 and 0.25 V (vs. Ag/AgCl) at scan rates varying from 10 mV s−1 to 80 mV s−1. A series of scan plots is reported for illustration in Figure S2 in Supplementary Material. The measurements were carried out in a 0.1 M phosphate buffer solution. The double layer capacitance values were obtained from the slope of the linear fit representation of the anodic-cathodic current increment registered as a function of the scan rate.

2.5. Optical Measurement Setup

The characterization of optical responses of R-NPs and R-NPs/ITO arrays was a pivotal point for the measurement of the resonant mode shift at different steps of the experiment. The spectra were collected with a FT-VIS-NIR spectrometer (Bruker Vertex 70) by measuring the reflected light at normal incidence between 476 and 1176 nm (21,008.4 to 8503.5 cm−1). Measurements were carried out using a 4× magnification with a resolution of 2 cm−1 and each observation was repeated five times to determine the uncertainty of the signal [28]. The conditions of data recollection were maintained fixed between each characterization, using silicon as reference and keeping the same number of scans for both background and sample measurements. The optical responses were compared by exposing the arrays of R-NPs to multiple environmental conditions, submerging the nanostructures in liquids of different RIs and then measuring the resonance shifts for each liquid. The chip was interrogated face-down through the glass substrate, using a polymeric holder (Sylgard 184, Dow Corning) with a fillable chamber, so that the patterned face was in contact with the liquid inserted, thus allowing the infiltration inside the nanostructured area. The whole process of immersion in all considered liquids was carried out twice: first for the bare R-NPs and then for the R-NPs/ITO arrays. A picture and a figurative representation of the optical setup (from [1]) can be seen in Figure S3, in Supplementary Materials.

2.6. Biological Detection Setup

The biological detection comprises three different parts. First, α-Aβ-1-16 antibody (clone 6E10, BioLegend Way) was immobilized on ITO surface as capture antibody. Then, Aβ peptide-1-40 (Aβ-40) (BioLegend Way) was incubated over the nanostructured array. Finally, the presence of Aβ peptide was recognized using Au-NPs coated with α-Aβ-1-40 antibody (clone 11A50-B10, BioLegend Way). A negative control sample was carried through the experiment to confirm the specificity of the recognition. The whole experiment (biological detection–negative control) was repeated in order to assure the correctness and faithfulness of the results shown in the present work. After each step, shifts of resonance dip were monitored by collecting the reflectivity spectra.
Antibody immobilization on R-NPs/ITO was performed following a general procedure reported previously [29] with modifications for the thiol-ene coupling click photoattachment. Basically, the support was first activated for 3 min by means of Ar plasma using a surface cleaner (Harrick Plasma, PDC-002-CE, Carson City, NV, USA), and the activation was followed by measuring the decrease in the surface water contact angle (WCA). Further, the chip was allowed to react with vinyltriethoxysilane (VTES) by immersion in a 2% (v/v) VTES solution in toluene, 2 h at room temperature, followed by rinsing with 2-propanol and curing overnight at 60 °C. Correct silanization was checked by measuring the increase in the WCA. Antibody solution in sodium acetate buffer, pH 4.5, was then spotted (40 nL) on the ensing surface by means of a microarrayer (Biodot, Irvine, CA, USA, model AD1500) at 90% humidity. The covalent anchoring was carried out by UV (254 nm) irradiation in a UV surface cleaner (UVOH150 LAB, FHR, Ottendorf-Okrilla, Germany, 50 mW cm−2) for 7 seconds, followed by dark for 30 min. The surface was finally rinsed with phosphate buffer saline containing Tween-20 (0.05%) (PBST), water and air-dried.
Aβ peptide (4 μL) was deposited in droplets at a concentration of 100 µg L−1 and incubated overnight at 4 °C. Phosphate buffer (PB) (pH 7.4) was incubated instead of the peptide as a negative control. A PVC mask was used for maintaining the droplets in their place, avoiding cross-contamination between Aβ. After incubation, the surface was rinsed with PB using a syringe and then air-dried.
Au-NPs recognition was performed by deposition, following the same procedure described previously (droplets of 4 μL, overnight incubation at 4 °C, surface rinsed with PB and dried with air). The concentration of the Au-NPs used was 134 µg L−1. Au-NPs functionalization with recognition antibody was carried out following a procedure previously described [30].

3. Results and Discussion

For the sake of coherence and consequentiality, all the results shown in the main body of the text are taken from a single array of R-NPs selected among the set of available ones. To consult the complete data, please refer to Tables S1 and S2 in Supplementary Materials.

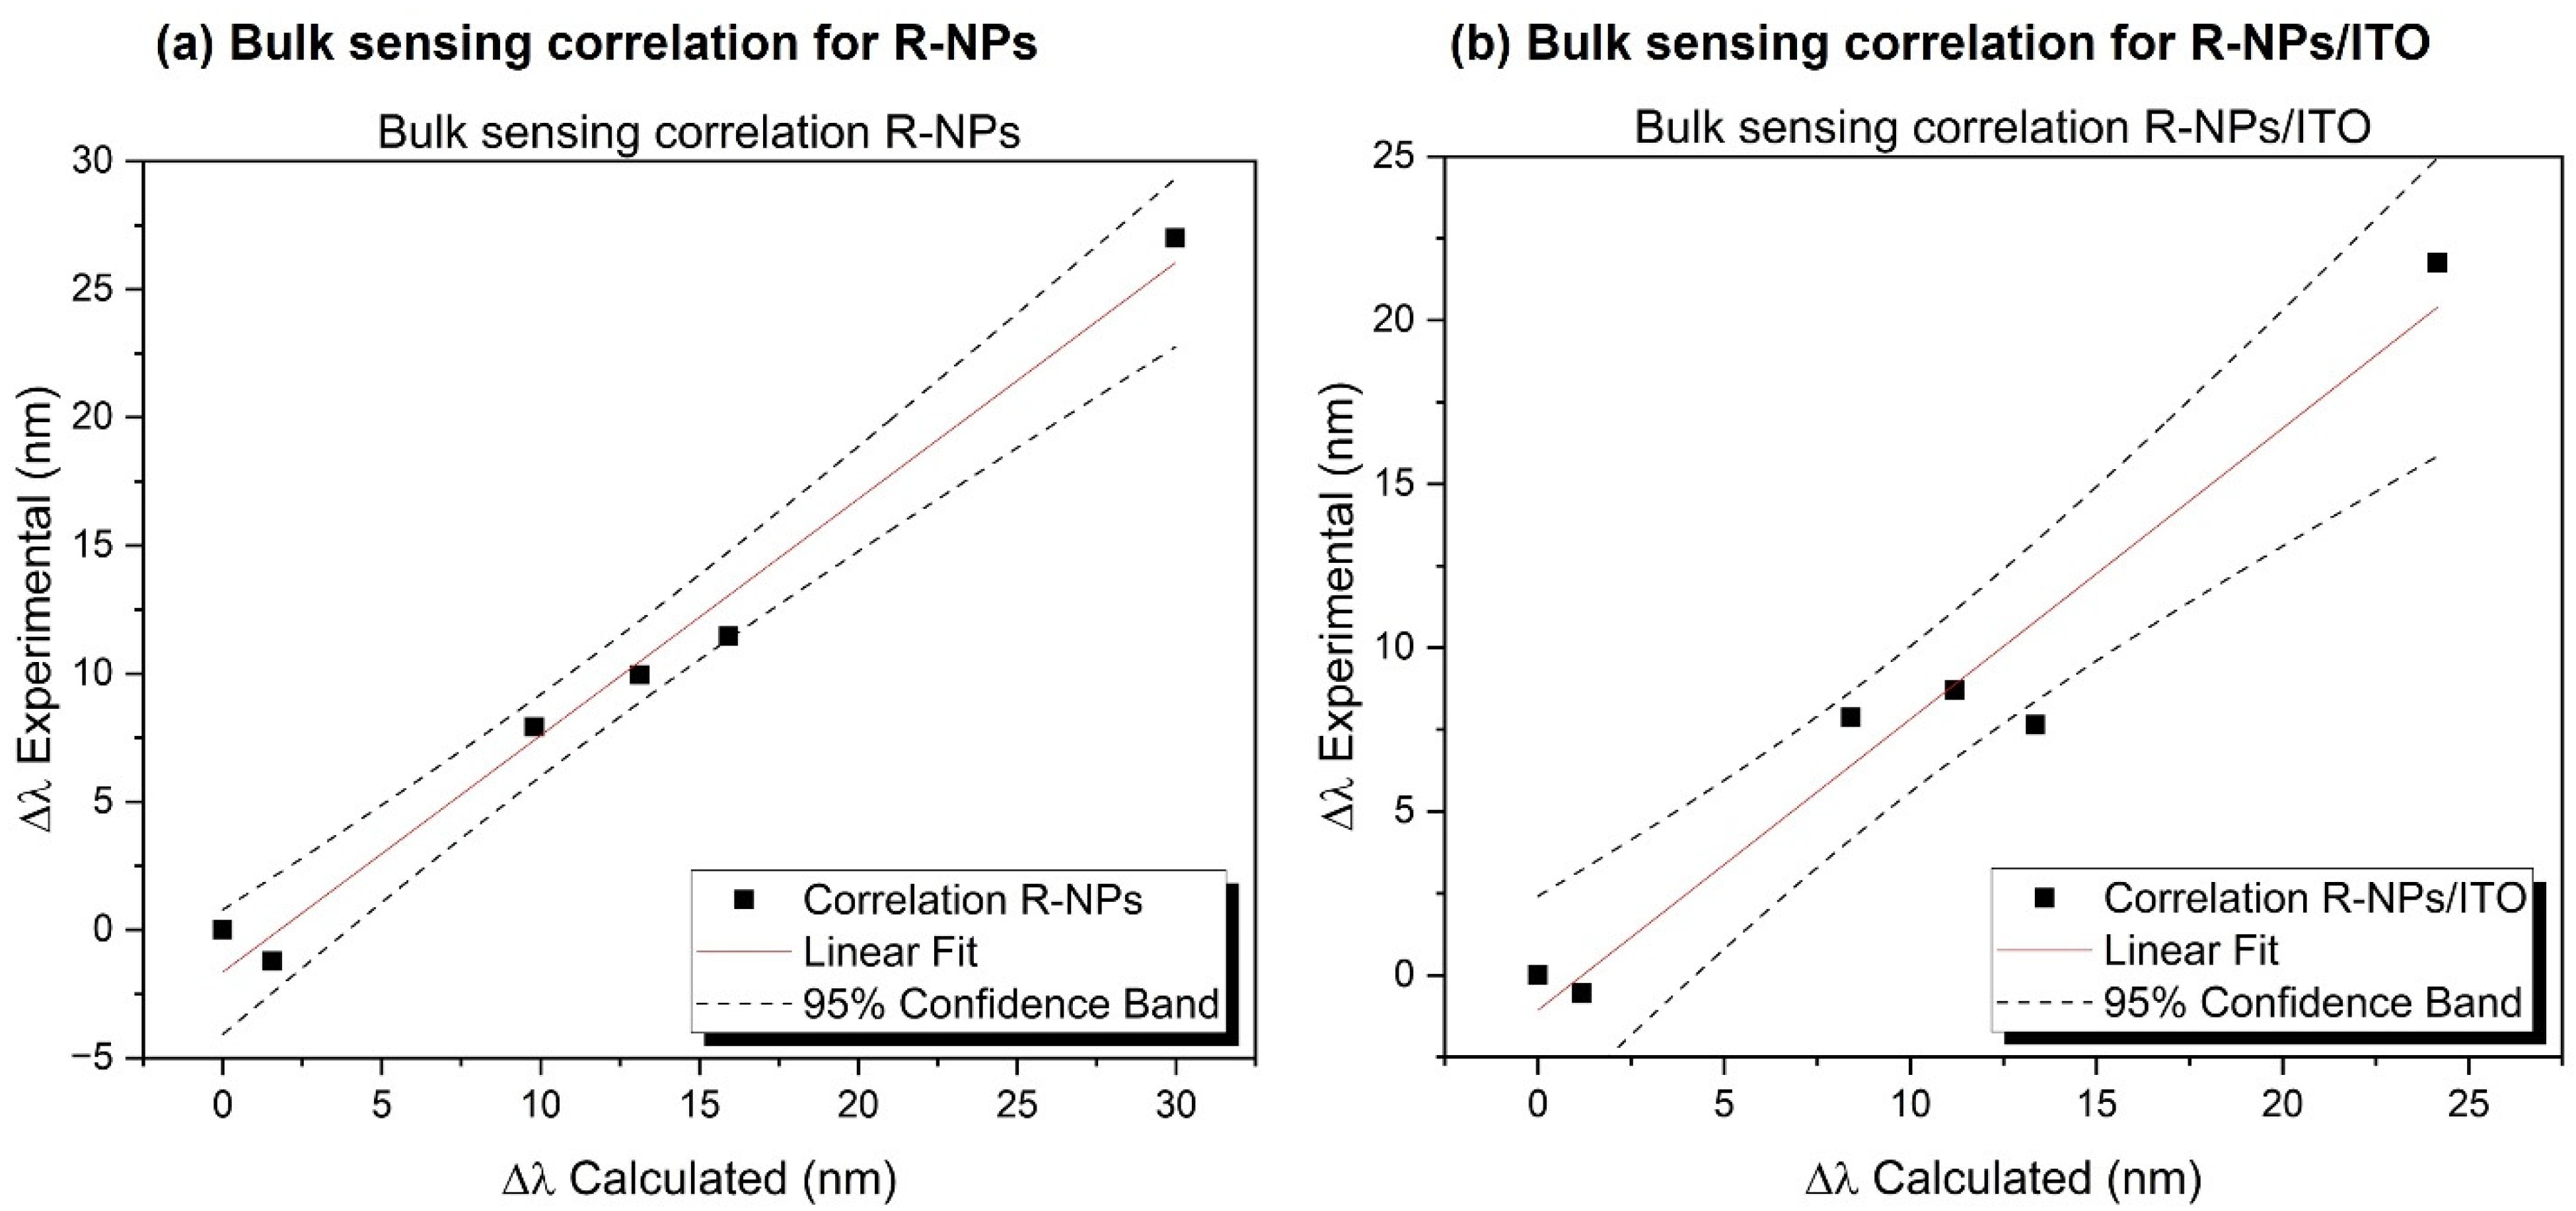
3.1. Bulk Sensing Comparison between R-NPs and R-NPs/ITO and Simulations

In order to compare the optical performance of the R-NPs array before and after ITO deposition, we first studied the optical response of the sensor without the ITO thin film and compared the obtained results with the corresponding optical simulations. We infiltrated the nanostructured array with liquids of different RIs (see Table 1) and measured the corresponding shifts of the resonant dip, as thoroughly explained in the experimental section. Reflectivity spectra of the selected R-NPs array in deionized water and cyclohexane can be seen in Figure 1a. By plotting the position in wavelength (λ) of the resonant dip for each environmental condition against the RI of each liquid used for the experiment, we calculated the sensitivity of the array of R-NPs as the slope of the linear fit of the points in the plot. The sensitivity value of the R-NPs transducer before ITO deposition was 295.04 ± 13.48 nm RIU−1, with a correlation of 0.99 (Figure S4a).
An ITO thin film was deposited onto the R-NPs array following the protocol described in the corresponding paragraph of the experimental section. A comparison of R-NPs images before and after ITO thin film deposition can be seen in Figure 2, as well as in Figure S5. The thickness of ITO film in R-NPs/ITO arrays was estimated by both thin film measurements (Filmetrics F20, KLA Corporation, San Diego, CA, USA) and electronic microscope imaging (SEM). Measurements taken using the former method suggest a thickness in the order of 100 nm for the deposited layer on the flat surface outside the pillars area. However, electronic microscope imaging of the nanostructured arrays showed that the increase of diameter in the pillars after deposition is around 50–60 nm, suggesting that the thickness of ITO thin film surrounding the R-NPs is in the range of 25–30 nm, significantly lower than onto a flat substrate (see Figure 2). Remarkably, after ITO deposition, the R-NPs/ITO chip was also sensitive to changes in the RI of the liquid infiltrating the structure, as illustrated in Figure 1b. While the shape of the spectra is not altered by the deposition of ITO, there is a shift of around 10 nm toward higher values of wavelength, in accordance with the theoretical calculations (as it can be seen in the following Section). For this chip, by repeating the steps previously performed with the same transducer without the thin film covering, we found a sensitivity of 225.59 ± 25.98 nm RIU−1 with a correlation of 0.94 (Figure S4a).
We have used the software Rsoft [26] to indirectly estimate the thickness of the ITO film deposited over the R-NPs. For this purpose, we considered the position of the resonance before and after the ITO deposition, and the shift after depositing the ITO layer (17.04 nm with the pillars immersed in water and 9.55 nm when surrounded by air). The magnitude of these shifts is compatible with an equivalent ITO thickness ranging between 11 and 14 nm, lower than the value estimated from the SEM observations. This difference can be conciliated by supposing that the ITO layer should show a significant porosity as expected by the glancing angle of incidence of the deposition atoms on the sides of the R-NPs [31]. When calculating the RI for a fixed thickness value of 25 nm, as suggested by the SEM observations, we obtained a RI value of 1.585 for the porous layer around the pillars. Using these thickness and RI values, we have calculated bulk sensing response for fluids with RI values ranging from 1.32 to 1.43 (Figure S4b). A linear fitting of the simulated results gives a sensitivity of 306.2 nm RIU−1 for R-NPs, and 261.2 nm RIU−1 for R-NPs/ITO (compared with 295.65 and 225.80 nm RIU−1 respectively for experimental results). This variation corresponds to a reduction of the sensitivity from R-NPs to R-NPs/ITO of 15% for the calculated results and of 23.6% for the experimental results. Figure 3 shows the correlation between experimental and calculated shifts for the liquids employed for the bulk sensing. The correlation value found for R-NPs (Figure 3a) is 0.92, while the value found for R-NPs/ITO (Figure 3b) is 0.89.
The difference found between experimental and simulated sensitivities after ITO deposition can be due to several reasons; for example, an imperfect nanostructured array due to fallen pillars or an inhomogeneous ITO covering along the nanopillars. However, such a difference does not compromise the sensing capability of R-NPs/ITO arrays and becomes largely compensated by the specific adsorption properties provided by the ITO film (see below). Moreover, the deposition of ITO layer marked a shift in the resonant dip position toward higher values of λ, a feature that could be useful for a fine adjustment of the resonance to specific wavelengths.

3.2. Electrochemical Response of R-NPs/ITO

To ensure a dual optical and electrochemical sensing capacity for R-NPs/ITO, it was vital to determine whether the ITO film incorporated onto the R-NPs arrays present electrochemical activity. Proving this capacity would be an indirect evidence that the ITO layer homogeneously covers the nanopillars, from bottom to top, as well as the substrate, forming an electrically continuous film.
Figure 4a shows a comparison of the cyclic voltammograms obtained using the ferri/ferrocyanide system as a redox probe, measured for TF/ITO samples, bare and decorated with Au-NPs (TF/ITO/Au), and equivalent R-NPs/ITO/Au samples, comparable to R-NPs/ITO arrays after biological recognition enhanced with Au-NPs (see below). A semi-quantitative estimation for the electrode efficiency can be carried out from the magnitude of the current density between the cathodic (at 0.1 V vs. Ag/AgCl) and anodic (at 0.35 V vs. Ag/AgCl electrode) peaks of the voltammograms. As shown in the figure, the TF/ITO and TF/ITO/Au electrochemical activities are moderate and quite similar, while that of R-NPs/ITO/Au is remarkably higher. This high electrochemical response clearly confirms the conformal character of the thin ITO layer onto the nanopillars and that it covers the hardly accessible R-NPs structure, conferring electrical continuity to the whole system. In addition, the reversible character of the Fe(CN)63-/Fe(CN)64- electrochemical reaction on the examined electrodes is demonstrated by the symmetrical shape of the voltammograms in Figure 4a. A direct and complementary analysis of the electrode activity can be done by means of ECSA methods based on the Randles Sevcik equation. This voltametric technique enables a direct estimation of the double layer capacitance by measuring the cathodic/anodic non-faradic current developed in a defined voltage range as a function of the scan rate. From the slopes of the fitting lines in Figure 4b, double layer capacitance values of 10.7 µF and 79.7 µF could be determined for samples TF/ITO/Au and R-NPs/ITO/Au, respectively. This analysis clearly demonstrates that the ITO film covers the whole nanopillar structure forming a continuous film, and that the available surface area exposed for the analysis is much larger in R-NPs/ITO/Au sample. We claim that two factors contribute to this enhancement in electrochemical activity: the increase in physical area due to the geometry of R-NPs and, as discussed in the previous paragraph, the fact that the ITO film on the lateral walls of the nanostructures probably grows in the form of nanostructured porous film due to the oblique angle impingement of deposited atoms [31] on the sides of the nanopillars.

3.3. Biological Detection Performed with R-NPs/ITO Arrays

Figure 5 schematically describes the actions fulfilled over ITO modified nanopillars for the biological detection with R-NPs/ITO arrays. As previously explained, the shift in resonant dip was monitored after each step to confirm the successive attachment of biomaterial to the surface. Moreover, it is fundamental to remark that the antibody recognition enhanced with Au-NPs (Figure 5c) can be linked to the R-NPs/ITO/Au electrochemical measurements shown in the previous paragraph. This paves the way for the future use of this type of systems for a dual optical and electrochemical sensing.
As it can be seen in Figure 6, all the steps performed after the immobilization of capture antibody brought to resonance shifts toward higher values of λ (or lower wavenumber values if expressed in cm−1), implying a correct bonding between antibodies and peptide. The resonance shift measured after the deposition of Aβ-40 onto the capture α-Aβ was of −36 cm−1, with an uncertainty of 1 cm−1. No shift of the resonant dip position was observed in the negative control, where buffer (instead of the peptide) was deposited over an array with capture antibodies.
The recognition step with Au-NPs functionalized with α-Aβ-1-40 brought to similar results, with a measured shift in the resonant dip of −37 cm−1 and an uncertainty of 1 cm−1. Again, the control resonance remained unmoved after Au-NPs incubation. Table 2 shows the mean value of the calculated shifts for the repeated experiment, both in λ and wavenumber.
The attachment of Au-NPs to the R-NPs/ITO (as opposed to their absence in the control array) was confirmed through scanning electron microscopy (FIB-SEM, Zeiss Cross Beam), as can be again seen in Figure 6. It is noteworthy that the limited quantity of Au-NPs attached to the nanostructured surface explains the relatively small shift observed in λ (or wavenumber).
Despite the positive results obtained in this experiment, the biofunctionalization step brought an unlikely reverse shift in the resonance dip, from a value in air of 510.05 nm before biofunctionalization to a value of 504.52 nm after capture antibody immobilization for the selected R-NPs array. Further studies need to be done in order to correctly assess this result.
In order to compare the biosensing response before and after the deposition of the ITO layer, we have theoretically calculated the resonance shift of the R-NPs and the R-NPs/ITO covered with a biofilm monolayer over the pillars and the substrate, considering a constant RI of 1.41, for increasing values of thickness of the layer, from 1 to 20 nm, with a resolution of 1 nm. These calculations also allow to indirectly obtain the thickness of the Aβ-40 layer covering the surface of the pillars after the biorecognition, by comparing experimental and theoretical resonance shifts. For doing this, we have used the non-uniform gridding feature from Rsoft, which allows defining high resolution in the interfaces between surfaces and thin layers, and a bulk resolution for the rest of the simulation volume.
Figure 7a shows the resonance shift as a function of the biofilm thickness, for the R-NPs/ITO array. Considering a biofilm of 20 nm, the total expected shift is of 14.8 nm, compared with an expected shift with the same thickness of 17.35 nm for the R-NPs without ITO (Figure 7b). These calculations show that biosensing capabilities are slightly reduced, in a similar way to bulk sensing sensitivity calculated before.
Experimental shift found with the Aβ-40 incubation is around 1 nm. This corresponds with an increase in the biofilm thickness between 1 and 1.5 nm after the incubation, due to the non-linearity of the resonance shift depending on the thickness of the biofilm, as can be seen in Figure 7a. Molecular weight of this peptide (4329.82 Da) suggests an experimental value of 1 nm or even lower for biofilm thickness, considering all the surface covered with the peptide, in a quite good correlation with the calculated thickness of the biofilm.

4. Conclusions

In this work, we demonstrated that the addition of an ITO thin film over a resonant nanostructured array does not alter its functioning capacity for label-free optical biosensing. It is found that the deposition of ITO by magnetron sputtering provides a good control of the deposition conditions and the possibility to finely adjust the film thickness. The ITO film confers a high electrochemical activity to the material without compromising its photonic behavior and optical detection capacity. This new composite transducer opens future paths for the implementation of dual optical and electrochemical measurements for a resonant biosensor with well-established capacity for optical biosensing, improving its functionality in unexplored ways. In this regard, we prove that the presence of ITO thin film does not inhibit the biosensing activity of the sensor, as demonstrated by the peptide-antibody detection performed. Moreover, this layer allows optimizing the biofunctionalization process on a single material (ITO) instead of on pillars or nanostructures of different types (both single material and multilayered). Furthermore, the deposition of a thin film on top of a R-NPs array allows a fine-tuning of the resonant mode at the desired λ, depending on porosity and thickness of the deposited ITO layer. This feature is fundamental when it comes to implementing the transducer in a point of care device for the performance of in-vitro bioassays [32,33,34], bringing the technology closer to a real-life application employing a laser source in the read-out optical system.

Supplementary Materials

The following supporting information can be downloaded at: https://www.mdpi.com/article/10.3390/chemosensors10100393/s1. Table S1: Complete data of bulk sensing experiment for R-NPs. Table S2: Complete data of bulk sensing experiment for R-NPs/ITO. Figure S1: Image of the transparent electrochemical cell utilized for the characterization of the electrochemical behavior of ITO-coated samples. Masked sample, counter and reference electrodes, and N2 bubbling system are indicated in the image. Figure S2: Voltagrams as a function of the scan rate recorded for sample R-NPs/ITO to estimate the ECSA. Similar voltagrams were also recorded for sample TF/ITO. Scan range was 0.05 to 0.25 V to avoid any Faradic contribution to the current signals and the medium was a phosphate solution, as indicated in the Materials and Methods Section of the paper. ECSA values could be estimated according to the expressions: Cdl = d(Δj)/2dVd and ECSA = Cdl/Cs. Figure S3: Optical measurement-picture of the experimental setup (left) and a schematic figure of the procedure (right, from [1]), including: (a) scheme of pillars immersed in water, (b) scheme of pillars in dry conditions, and (c) layout of the measurement system. Figure S4: Resonance shift as a function of the fluids RI, before and after ITO deposition: (a) experimental data, (b) calculated results. Figure S5: SEM imaging of R-NPs (A and B, before ITO deposition) and R-NPs/ITO (C and D, after ITO deposition). Both the increase in diameter and the change in shape directly suggest a correct deposition of ITO thin film on top of the nanostructures. Figure S6: SEM imaging of arrays of R-NPs/ITO after Au-NPs deposition (A,B) and negative control (C,D) of biological detection experiment.

Author Contributions

Conceptualization, M.H. and A.R.G.-E.; methodology, M.H., A.R.G.-E., M.-J.B., M.F.L., R.C. and R.H.-L.; software, R.C.; validation, L.T., J.G.-R., M.Á.G.-M., R.C., R.H.-L. and A.M.M.M.; formal analysis, R.C., L.T., J.G.-R. and A.M.M.M.; investigation, L.T., J.G.-R., M.Á.G.-M., R.C., R.H.-L. and A.M.M.M.; resources, M.H., A.R.G.-E., M.-J.B. and M.F.L.; data curation, R.C., L.T. and J.G.-R.; writing—original draft preparation, L.T., R.C., J.G.-R. and M.Á.G.-M.; writing—review and editing, A.M.M.M., R.H.-L., M.-J.B., A.R.G.-E. and M.H.; visualization, L.T., R.C. and J.G.-R.; supervision, M.H., A.R.G.-E. and R.C.; project administration, M.H. and A.R.G.-E.; funding acquisition, M.H. and A.R.G.-E. All authors have read and agreed to the published version of the manuscript.

Funding

This research was funded by the Spanish Ministry (Ministerio de Economía y Competitividad) under project HERON (Grant TEC2017-84846-R). Moreover, the work of L. Tramarin was supported by the predoctoral contract of the Universidad Politécnica de Madrid.

Institutional Review Board Statement

Not applicable.

Informed Consent Statement

Not applicable.

Data Availability Statement

The data presented in this study are available in the corresponding Supplementary Materials document. More data regarding the experiments and the study can be requested to the authors under specific circumstances.

Acknowledgments

L. Tramarin thanks A. Merchán-Pérez of the Laboratorio Cajal de Circuitos Corticales, CTB, UPM for the images taken using scanning electron microscopy (SEM) technique.

Conflicts of Interest

The authors declare no conflict of interest.

References

  1. Casquel, R.; Holgado, M.; Laguna, M.F.; Hernández, A.L.; Santamaría, B.; Lavín, Á.; Tramarin, L.; Herreros, P. Engineering Vertically Interrogated Interferometric Sensors for Optical Label-Free Biosensing. Anal. Bioanal. Chem. 2020, 412, 3285–3297. [Google Scholar] [CrossRef] [PubMed]
  2. Ferreira, M.F.S.; Castro-Camus, E.; Ottaway, D.J.; López-Higuera, J.M.; Feng, X.; Jin, W.; Jeong, Y.; Picqué, N.; Tong, L.; Reinhard, B.M.; et al. Roadmap on Optical Sensors. J. Opt. (UK) 2017, 19, 083001. [Google Scholar] [CrossRef]
  3. Peltomaa, R.; Glahn-Martínez, B.; Benito-Peña, E.; Moreno-Bondi, M.C. Optical Biosensors for Label-Free Detection of Small Molecules. Sensors (Basel) 2018, 18, 4126. [Google Scholar] [CrossRef] [PubMed]
  4. Qazi, H.H.; bin Mohammad, A.B.; Akram, M. Recent Progress in Optical Chemical Sensors. Sensors 2012, 12, 16522–16556. [Google Scholar] [CrossRef] [PubMed]
  5. Huang, X.; Qiu, C.; Ji, X.; Wang, S.; Shao, G. Plasmon Lattice Resonances Induced by an All-Dielectric Periodic Array of Si Nanopillars on SiO2nanopillars. Nanotechnology 2021, 32, 505206. [Google Scholar] [CrossRef]
  6. Bezares, F.J.; Long, J.P.; Glembocki, O.J.; Guo, J.; Rendell, R.W.; Kasica, R.; Shirey, L.; Owrutsky, J.C.; Caldwell, J.D. Mie Resonance-Enhanced Light Absorption in Periodic Silicon Nanopillar Arrays. Opt. Express 2013, 21, 27587. [Google Scholar] [CrossRef]
  7. Kugel, V.; Ji, H.F. Nanopillars for Sensing. J. Nanosci. Nanotechnol. 2014, 14, 6469–6477. [Google Scholar] [CrossRef]
  8. Hernández, A.L.; Casquel, R.; Holgado, M.; Cornago, I.; Sanza, F.J.; Santamaría, B.; Maigler, M.; Fernández, F.; Lavín, A.; Laguna, M.F. Arrays of Resonant Nanopillars for Biochemical Sensing. Opt. Lett. 2015, 40, 2370. [Google Scholar] [CrossRef]
  9. Quintero, S.; Casquel, R.; Laguna, M.F.; Holgado, M. Optical Vapor Sensors Based on Periodic Resonant Nanopillar Structures. ACS Omega 2020, 5, 25913–25918. [Google Scholar] [CrossRef]
  10. Szyszka, B.; Dewald, W.; Gurram, S.K.; Pflug, A.; Schulz, C.; Siemers, M.; Sittinger, V.; Ulrich, S. Recent Developments in the Field of Transparent Conductive Oxide Films for Spectral Selective Coatings, Electronics and Photovoltaics. Curr. Appl. Phys. 2012, 12, S2–S11. [Google Scholar] [CrossRef]
  11. Minami, T. Present Status of Transparent Conducting Oxide Thin-Film Development for Indium-Tin-Oxide (ITO) Substitutes. Thin Solid Film. 2008, 516, 5822–5828. [Google Scholar] [CrossRef]
  12. Lopez-Santos, C.; Puerto, D.; Siegel, J.; Macias-Montero, M.; Florian, C.; Gil-Rostra, J.; López-Flores, V.; Borras, A.; González-Elipe, A.R.; Solis, J. Anisotropic Resistivity Surfaces Produced in ITO Films by Laser-Induced Nanoscale Self-Organization. Adv. Opt. Mater. 2021, 9, 2001086. [Google Scholar] [CrossRef]
  13. Kim, H.; Horwitz, J.S.; Kushto, G.; Piqué, A.; Kafafi, Z.H.; Gilmore, C.M.; Chrisey, D.B. Effect of Film Thickness on the Properties of Indium Tin Oxide Thin Films. J. Appl. Phys. 2000, 88, 6021–6025. [Google Scholar] [CrossRef]
  14. Paine, D.C.; Whitson, T.; Janiac, D.; Beresford, R.; Yang, C.O.; Lewis, B. A Study of Low Temperature Crystallization of Amorphous Thin Film Indium-Tin-Oxide. J. Appl. Phys. 1999, 85, 8445–8450. [Google Scholar] [CrossRef]
  15. del Villar, I.; Zamarreño, C.R.; Hernaez, M.; Arregui, F.J.; Matias, I.R. Lossy Mode Resonance Generation with Indium-Tin-Oxide-Coated Optical Fibers for Sensing Applications. J. Lightwave Technol. 2010, 28, 111–117. [Google Scholar] [CrossRef]
  16. Zamarreño, C.R.; Hernaez, M.; del Villar, I.; Matias, I.R.; Arregui, F.J. Tunable Humidity Sensor Based on ITO-Coated Optical Fiber. Sens. Actuators B Chem. 2010, 146, 414–417. [Google Scholar] [CrossRef]
  17. Zamarreño, C.R.; Hernáez, M.; del Villar, I.; Matías, I.R.; Arregui, F.J. ITO Coated Optical Fiber Refractometers Based on Resonances in the Infrared Region. IEEE Sens. J. 2010, 10, 365–366. [Google Scholar] [CrossRef]
  18. Socorro, A.B.; Soltani, S.; del Villar, I.; Corres, J.M.; Armani, A.M. Temperature Sensor Based on a Hybrid ITO-Silica Resonant Cavity. Opt. Express 2015, 23, 1930. [Google Scholar] [CrossRef] [PubMed]
  19. Rhodes, C.; Cerruti, M.; Efremenko, A.; Losego, M.; Aspnes, D.E.; Maria, J.P.; Franzen, S. Dependence of Plasmon Polaritons on the Thickness of Indium Tin Oxide Thin Films. J. Appl. Phys. 2008, 103, 093108. [Google Scholar] [CrossRef]
  20. Mitsubayashi, K.; Wakabayashi, Y.; Tanimoto, S.; Murotomi, D.; Endo, T. Optical-Transparent and Flexible Glucose Sensor with ITO Electrode. Biosens. Bioelectron. 2003, 19, 67–71. [Google Scholar] [CrossRef]
  21. Ding, Y.; Deng, D.; Zhou, X.; Zhen, W.; Gao, M.; Zhang, Y. Barcode Encryption Based on Negative and Positive Goos-Hänchen Shifts in a Graphene-ITO/TiO2/ITO Sandwich Structure. Opt. Express 2021, 29, 41164. [Google Scholar] [CrossRef]
  22. Rooney, M.B.; Coomber, D.C.; Bond, A.M. Achievement of Near-Reversible Behavior for the [Fe(CN) 6 ]3−/4− Redox Couple Using Cyclic Voltammetry at Glassy Carbon, Gold, and Platinum Macrodisk Electrodes in the Absence of Added Supporting Electrolyte. Anal. Chem. 2000, 72, 3486–3491. [Google Scholar] [CrossRef] [PubMed]
  23. Agrisuelas, J.; Giménez-Romero, D.; García-Jareño, J.J.; Vicente, F. Vis/NIR Spectroelectrochemical Analysis of Poly-(Azure A) on ITO Electrode. Electrochem. Commun. 2006, 8, 549–553. [Google Scholar] [CrossRef]
  24. Śmietana, M.; Koba, M.; Sezemsky, P.; Szot-Karpińska, K.; Burnat, D.; Stranak, V.; Niedziółka-Jönsson, J.; Bogdanowicz, R. Simultaneous Optical and Electrochemical Label-Free Biosensing with ITO-Coated Lossy-Mode Resonance Sensor. Biosens. Bioelectron. 2020, 154, 112050. [Google Scholar] [CrossRef] [PubMed]
  25. Cornago, I.; Hernández, A.L.; Casquel, R.; Holgado, M.; Laguna, M.F.; Sanza, F.J.; Bravo, J. Bulk Sensing Performance Comparison between Silicon Dioxide and Resonant High Aspect Ratio Nanopillars Arrays Fabricated by Means of Interference Lithography. Opt. Mater. Express 2016, 6, 2264. [Google Scholar] [CrossRef]
  26. Available online: https://www.synopsys.com/photonic-solutions/rsoft-photonic-device-tools/rsoft-products.html (accessed on 25 September 2022).
  27. Tsai, M.C.; Chen, P.Y. Voltammetric Study and Electrochemical Detection of Hexavalent Chromium at Gold Nanoparticle-Electrodeposited Indium Tinoxide (ITO) Electrodes in Acidic Media. Talanta 2008, 76, 533–539. [Google Scholar] [CrossRef]
  28. JCGM. Evaluation of Measurement Data-Guide to the Expression of Uncertainty in Measurement; JCGM: Sèvres, France, 2008. [Google Scholar]
  29. Alonso, R.; Jiménez-Meneses, P.; García-Rupérez, J.; Bañuls, M.J.; Maquieira, Á. Thiol-Ene Click Chemistry towards Easy Microarraying of Half-Antibodies. Chem. Commun. 2018, 54, 6144–6147. [Google Scholar] [CrossRef]
  30. Parolo, C.; Sena-Torralba, A.; Bergua, J.F.; Calucho, E.; Fuentes-Chust, C.; Hu, L.; Rivas, L.; Álvarez-Diduk, R.; Nguyen, E.P.; Cinti, S.; et al. Tutorial: Design and Fabrication of Nanoparticle-Based Lateral-Flow Immunoassays. Nat. Protoc. 2020, 15, 3788–3816. [Google Scholar] [CrossRef]
  31. Barranco, A.; Borras, A.; Gonzalez-Elipe, A.R.; Palmero, A. Perspectives on Oblique Angle Deposition of Thin Films: From Fundamentals to Devices. Prog. Mater. Sci. 2016, 76, 59–153. [Google Scholar] [CrossRef]
  32. Spindel, S.; Sapsford, K.E. Evaluation of Optical Detection Platforms for Multiplexed Detection of Proteins and the Need for Point-of-Care Biosensors for Clinical Use. Sensors 2014, 14, 22313–22341. [Google Scholar] [CrossRef] [Green Version]
  33. Chen, Y.T.; Lee, Y.C.; Lai, Y.H.; Lim, J.C.; Huang, N.T.; Lin, C.T.; Huang, J.J. Review of Integrated Optical Biosensors for Point-Of-Care Applications. Biosensors 2020, 10, 209. [Google Scholar] [CrossRef] [PubMed]
  34. Tokel, O.; Inci, F.; Demirci, U. Advances in Plasmonic Technologies for Point of Care Applications. Chem. Rev. 2014, 114, 5728–5752. [Google Scholar] [CrossRef] [PubMed] [Green Version]
Figure 1. Reflectivity spectra comparison of (a) R-NPs and (b) R-NPs/ITO in deionized water (H2O) and cyclohexane.
Chemosensors 10 00393 g001
Figure 2. Comparison of SEM imaging of R-NPs and R-NPs/ITO.
Chemosensors 10 00393 g002
Figure 3. Bulk sensing correlation between experimental and calculated shift for (a) R-NPs and (b) R-NPs/ITO.
Chemosensors 10 00393 g003
Figure 4. Electrochemical characterization of ITO/Au thin films. (a) Cyclic voltammograms in a ferri/ferrocyanide electrolyte recorded at a scan rate of 50 mV s−1 for the indicated samples. (b) Plot of the density currents determined from ECSA cyclic voltammograms as a function of scan rate (data corresponding to a phosphate solution).
Chemosensors 10 00393 g004
Figure 5. Schematic representation of (a) α-Aβ-1-16 immobilization (capture antibody), (b) Aβ-40 binding with capture antibody and (c) α-Aβ-1-40 recognition (detection antibody) enhanced with Au-NPs.
Chemosensors 10 00393 g005
Figure 6. (left) Biological detection reflectivity spectra of R-NPs/ITO for capture antibody immobilization (black), peptide deposition (red) and antibody recognition enhanced with Au-NPs (blue). (right) SEM images of R-NPs/ITO after Au-NPs deposition, along with negative control (see Figure S6); Au-NPs are highlighted by red arrows in the expanded image on the right.
Chemosensors 10 00393 g006
Figure 7. Resonance shift as a function of biofilm thickness. (a) Resonance shift for pillars covered with a 25 nm of porous ITO layer, with a RI of 1.585, adding a biolayer with a constant index of 1.41. (b) Resonance shift of the pillars without considering the ITO layer.
Chemosensors 10 00393 g007
Table 1. Liquids used for the bulk sensing experiment and relative RIs at 20 °C. Data from [9].
LiquidRefractive Index [n]
Methanol1.328
Deionized water1.333
Ethanol1.361
Acetic acid1.372
2-propanol1.380
Cyclohexane1.426
Table 2. Mean values of resonance positions (nm and cm−1) and resonance shifts (∆nm and ∆cm−1) of R-NPs arrays considered in the experiment, for both biological detection and negative control tests.
Resonance Position Resonance Shift
α-Aβ-1-16Aβ-40Au-NPs with α-Aβ-1-40 PeptideIncubationRecognition with Au-NPs
Biological detection[nm]501.99503.04503.98∆nm1.050.94
[cm−1]19,90519,86319,829∆cm−1−42−34
Negative control[nm]501.15500.90501.16∆nm−0.250.26
[cm−1]19,94219,95319,942∆cm−111−11
Publisher’s Note: MDPI stays neutral with regard to jurisdictional claims in published maps and institutional affiliations.

