
Mercury Ion Chemosensor Derived from Barbiturate Acid with Aggregation-Induced Emission Effect
1
School of Chemistry and Chemical Engineering, Qilu University of Technology, Jinan 250353, China
2
College of Chemistry and Material Science, Shandong Agricultural University, Taian 271018, China
*
Author to whom correspondence should be addressed.
Chemosensors 2022, 10(10), 422; https://doi.org/10.3390/chemosensors10100422
Submission received: 4 September 2022
/
Revised: 2 October 2022
/
Accepted: 11 October 2022
/
Published: 14 October 2022
(This article belongs to the Special Issue Feature Papers on Luminescent Sensing)
Abstract
:The detection of toxic metals is indispensable for water safety. In this paper, a small molecule of aggregation-induced emission (AIE) with barbiturate group was synthesized. It combined with mercury ions to form a stable metal complex so as to enhance the color of the solution to achieve the visualization of ion detection. The fluorescent molecule showed good selectivity and anti-interference ability and had a low detection limit (DL = 22.27 nM) for mercury ion.
1. Introduction
Mercury ion, as one of the most toxic heavy metal ions in the environment, is harmful to the ecological environment and human health due to its bioamplification effect [1,2,3,4]. Since Hg2+ is difficult to remove from organisms, it can easily accumulate through the food chain [5,6]. When mercury enters the body, not only are the central nervous system and other systems in the body affected, but it can also lead to death due to high levels of Hg2+. In addition, mercury ions are easily converted to the more toxic methylmercury in the natural environment [7], where they are transported over long distances through the atmosphere and rivers, causing transboundary pollution. Therefore, the Environmental Protection Agency (EPA) had set the maximum permissible concentration of mercury ions in drinking water as low as 10.0 nM [8]. Water is indispensable for any life and activities. Therefore, a rapid detection method for mercury ions in water is very necessary.
In various methods, the fluorescence technology has the advantages [9] of high speed, convenience, high sensitivity, good repeatability and multiple physical parameters (such as excitation wavelength, emission wavelength, intensity of fluorescence, fluorescence lifetime, making it widely used in chemical sensing [10], photoelectrics [11], molecular detection [12] and biological in vivo imaging [13]. Therefore, fluorescence technology is an efficient method for mercury ion detection [14]. However, most of the traditional fluorescent probes have a large π-π conjugate rigid structure, which makes them prone to aggregation-caused quenching (ACQ). In 2001, Tang discovered aggregation-induced emission (AIE) in the process of studying Silole [15]. Organic luminescent materials exhibiting the AIE phenomenon hardly emit light in dilute solution but have strong fluorescence in aggregate state. This special luminescent material has great application prospects in ion detection.
Many such kinds of probes that are used to detect metal mercury ions have dithioacetal units. For example, the dithioacetal unit in the probe of TBTS was hydrolyzed to an aldehyde group with mercury ions [16]. Thus, the aggregation effect was achieved, and the solution luminescence was enhanced, so that the ions detection was visualized. In addition to this, another approach is to use mercury ions to react with probes to change their structure and luminescence [17,18,19]. Ma et al. [20] used this property to synthesize a two-channel probe AADT, which had the advantages of good selectivity and anti-interference ability. Other molecules relied on the active groups in the molecules to form hydrogen bonds with mercury ions, so that molecular aggregates were formed for visualization of ion detection [21,22]. Yuan et al. synthesized a hydrophilic probe [23]. It combined with mercury ions in aqueous solution, so the water solubility of the molecules decreased and resulted in molecular aggregation, thus showing an enhanced solution luminescence.
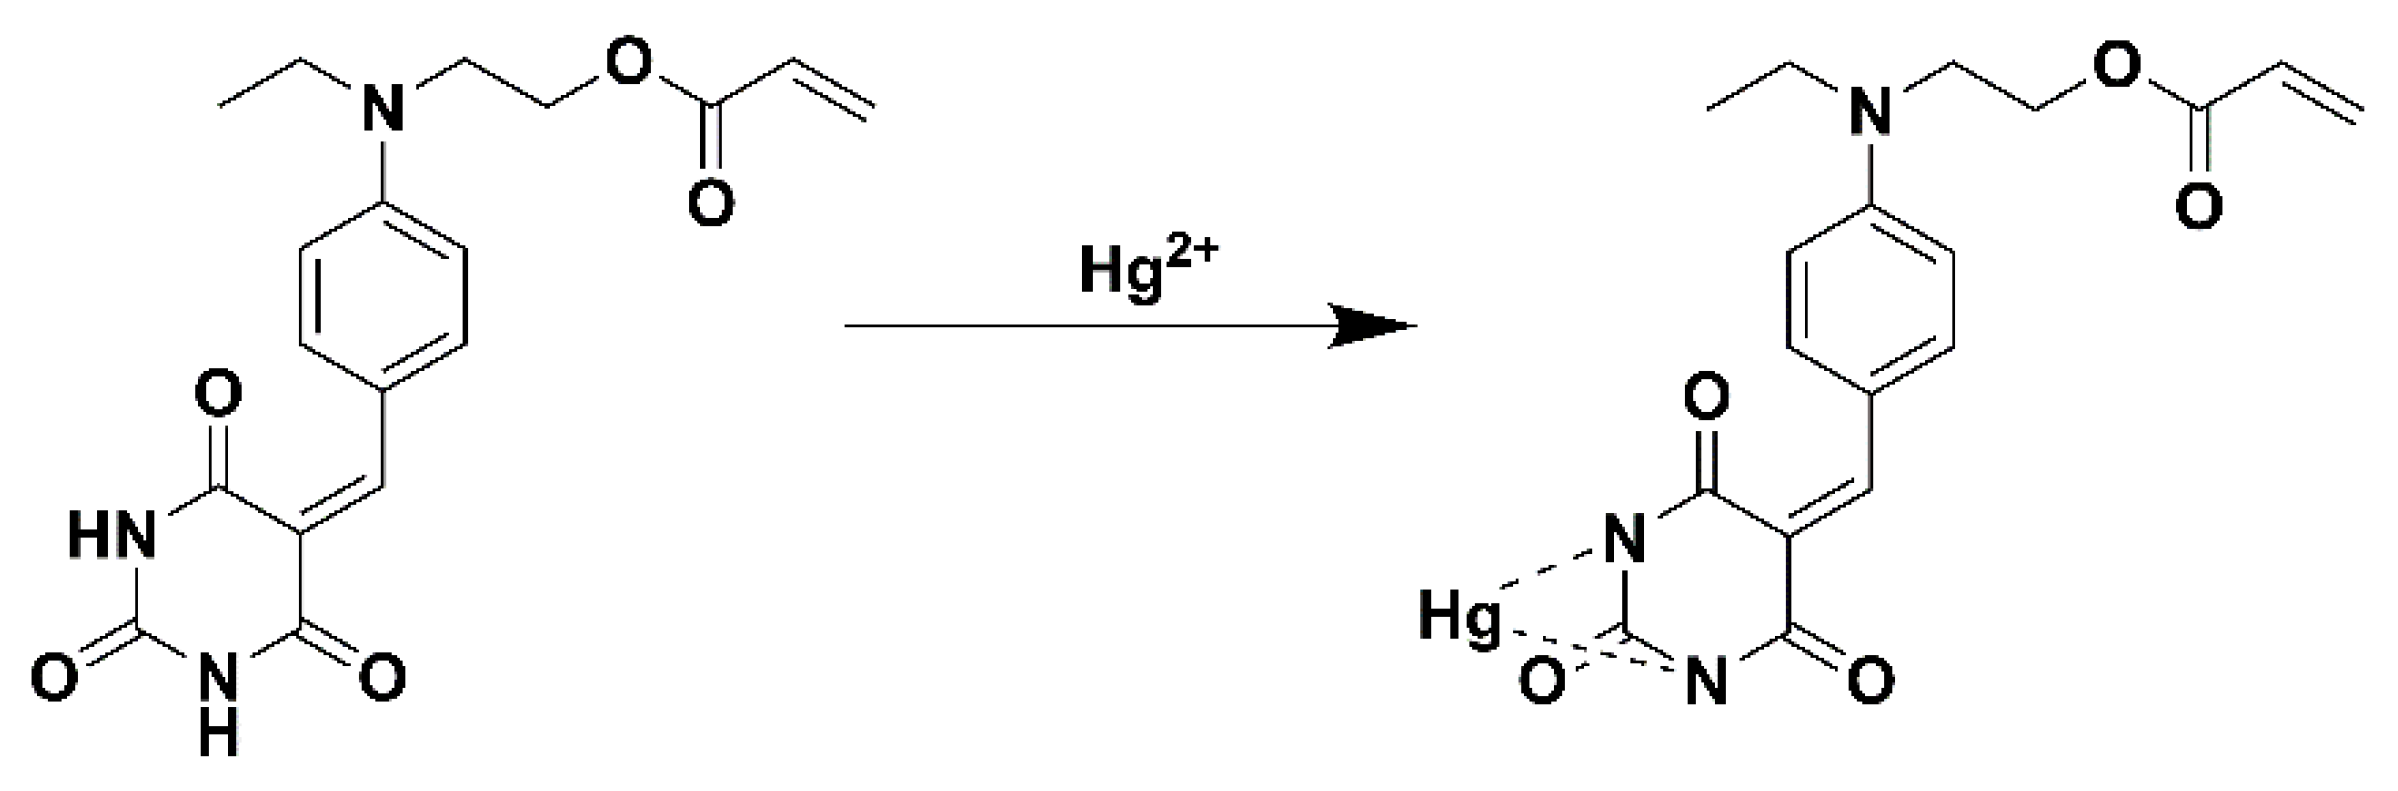
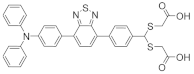
This work starts from another aspect, which is to prevent the probe from reacting with water by bonding to mercury ions. This method not only greatly improves the selectivity and anti-interference ability of the probe but also enables it to respond quickly in aqueous solution. We designed and synthesized an AIE fluorescence probe BNEA based on a barbiturate group. It reacts with water, which causes BNEA to lose its fluorescence in aqueous solution. At the same time, we found that this probe would combine with mercury ions in aqueous solution to enhance fluorescence (Scheme 1), so as to realize visual detection of mercury ions in aqueous solution. BNEA can be used as a new probe for mercury ion detection because of its good selectivity and anti-interference ability in aqueous solution.
2. Materials and Methods
2.1. Materials
All the materials used were commercially available and used without any further purification unless otherwise mentioned. These materials, including 2-(N-ethyl(phenyl)amino) ethanol (98%, Jiu Ding, Shanghai Xianding Biotechnology Co., Ltd., Shanghai, China), barbituric acid (99%), Pyridine (99%), acrylic acid (AA), phosphorus oxychloride (POCl3), acetic anhydride (98.5%), triethylamine, N,N-dimethylformamide (DMF) and methylene chloride, were dried according to the standard methods. The water used in the experimental processes was distilled water except for special needs.
2.2. Instrumentation
The 1H NMR spectra were measured on an AV ANCZ II 400 spectrometer (Bruker, Karlsruhe, Germany), and DMSO served as solvent. Chemical shifts were reported in part per million (ppm) and were referenced to the residual solvent peak (DMSO:1H = 2.5 ppm and H2O:1H = 3.4 ppm). UV-vis absorption spectra were measured on a TU-1810 UV-visible spectrophotometer (Puxi General Instrument Co., Ltd., Beijing, China). Photoluminescence emission spectra were measured in a HITACHI F-2710 fluorescence spectrometer (Hitachi High-tech Science, Tokyo, Japan). HRMS (ESI) spectra were measured on a Thermo Scientific Q Exactive modular quadrupole Orbitrap mass spectrometer (Bruker autoflex maX MALDI-TOF(TOF), Karlsruhe, Germany).
2.3. Synthesis and Characterization of Compounds [24,25]
A mixture of 2-(N-ethylanilino) ethanol (5 g), acetic anhydride (16 g) and pyridine (7 g) was stirred at 90 °C for 24 h. The resulting dark solution was cooled down to room temperature and then washed with H2O (20 mL). The mixture was extracted with ethyl acetate, and the organic phase was washed with water twice. The yellow solution was dried on anhydrous MgSO4 overnight, and then the solvent was removed. The crude product was collected as dark oil.
Then, 2-(Ethyl (phenyl) amino) ethyl acetate (5 g) was added into DMF (5 mL). POCl3 (4 g) was added dropwise into deep green oil under 0 °C with vigorous stirring; the resulted deep green oil continued to be stirred for another 40 min under 0 °C.
The temperature of the mixture was raised to indoor temperature slowly and kept for 20 min, then the mixture was stirred for 3 h under 90 °C to get a deep green solution. The mixture was placed in the air and cooled to 20 °C before ice water (20 mL) was added. The pH value was adjusted to 6~8 using a 30% Na2CO3 solution. The green precipitate was collected by removing solvent and drying in vacuum. 1H NMR (400 MHz, DMSO-d6) δ 9.65 (s, 1H), 7.67 (d, J = 8.6 Hz, 2H), 6.83 (d, J = 8.7 Hz, 2H), 4.18 (t, J = 5.9 Hz, 2H), 3.65 (t, J = 5.9 Hz, 2H), 3.48 (q, J = 7.0 Hz, 2H), 1.98 (s, 3H) and 1.11 (t, J = 7.0 Hz, 3H).
A green mixture of 2-(ethyl (4-formylphenyl) amino) ethyl acetate (2 g) in ethanol (20 mL) and NaOH (1.5 g) in water (10 mL) was stirred for 7 h at 25 °C, and then the pH was adjusted to 8–9 using a diluted HCl solution. Ethanol and water were removed, and the residue solid was dissolved in ethyl acetate (50 mL). The mixture was filtered and the solvent of the filtrate was evaporated. Yellow viscous solution could be obtained and collected by filtration and then dried in vacuum. 1H NMR (400 MHz, DMSO-d6) δ 9.63 (s, 1H), 7.65 (d, J = 8.5 Hz, 2H), 6.78 (d, J = 8.8 Hz, 2H), 4.83 (t, J = 5.4 Hz, 1H), 3.57 (q, J = 5.9 Hz, 2H), 3.49–3.46 (m, 2H), 3.46–3.43 (m, 2H) and 1.10 (t, J = 7.0 Hz, 3H).
In dry dichloromethane (1.0 mL), 4-(Ethyl (2-hydroxyethyl) amino) benzaldehyde (0.3 g) was dissolved. After addition of triethylamine (41.8 μL) to the solution, acryloyl chloride (16.2 mL) was added dropwise at 0 °C. Then, the mixture was stirred at room temperature for 3 h. The mixture was washed with water (20 mL) and extracted with ethyl acetate (50 mL). The organic phase solvent was evaporated, and the yellow viscous solution was purified on silica gel using column chromatography with a dichloromethane and hexane (1:2) mixture as the eluent, yielding the desired product, namely yellow viscous solution. 1H NMR (500 MHz, DMSO-d6) δ 9.66 (s, 1H), 7.70–7.65 (m, 2H), 6.90–6.84 (m, 2H), 6.31 (dd, J = 17.3, 1.5 Hz, 1H), 6.15 (dd, J = 17.3, 10.4 Hz, 1H), 5.95 (dd, J = 10.4, 1.5 Hz, 1H), 4.30 (t, J = 5.8 Hz, 2H), 3.72 (t, J = 5.8 Hz, 2H), 3.50 (q, J = 7.0 Hz, 2H) and 1.12 (t, J = 7.0 Hz, 3H).
In ethanol (20 mL), 2-(ethyl(4-formylphenyl)amino)ethyl acrylate (1 g) was added, and then, barbituric acid (1 g) was added in a 100 mL three-necked flask. The flask was stirred for 4 h at a constant temperature of 80 °C. After the end of the reaction, it was cooled for a while and filtered under reduced pressure to yield a pale yellow product. 1H NMR (500 MHz, DMSO-d6) δ 11.09 (d, J = 2.1 Hz, 1H), 10.96 (d, J = 2.0 Hz, 1H), 8.42 (d, J = 9.2 Hz, 2H), 8.15 (s, 1H), 6.87 (d, J = 9.0 Hz, 2H), 6.31 (dd, J = 17.3, 1.5 Hz, 1H), 6.15 (dd, J = 17.3, 10.4 Hz, 1H), 5.95 (dd, J = 10.4, 1.5 Hz, 1H), 4.33 (t, J = 5.7 Hz, 2H), 3.79 (d, J = 11.4 Hz, 2H), 3.56 (q, J = 7.0 Hz, 2H) and 1.15 (t, J = 7.0 Hz, 3H).
3. Results
3.1. Synthesis of Monomers
The synthesis route of BNEA is shown in Scheme 2. Firstly, the hydroxyl group on 2-(n-ethylanilino) ethanol was protected by acetic anhydride. Then, the intermediate M3 was obtained by Vilsmeier-Haack reaction and deprotecting reaction. Triethylamine was used as an acid-binding agent, M3 was reacted with allyl chloride in dry DMF, and the monomer M4 was synthesized. Finally, M4 and barbituric acid were condensed under alkaline conditions, and the solid luminescent monomer BNEA was obtained.
3.2. Aggregation-Induced Emission Phenomenon
We used UV-vis absorption spectrometer and fluorescence spectrometer to analyze the luminescence phenomenon of our fluorescent probe. Since it was almost insoluble in water, we determined whether it exhibits AIE phenomenon by changing the proportion of undesirable solvent in the mixed solution (THF-H2O). In Figure 1A, the absorption peak at 450 nm decreased with the increase in the proportion of water in the mixed solution, while an absorption peak at 350 nm began to appear and kept increasing. As shown in Figure 2A,B, it can be found that the fluorescence intensity of the solution increases first and then decreases with the increase in poor solvent, which is common in AIE molecules, because with the increase in the proportion of poor solvent, the molecules are prone to aggregation and precipitate out of the solution, leading to the decrease in luminescent molecules in the solution and the decrease in fluorescence [18]. However, through observation, we found that the solution color of BNEA in the mixed solution decreased continuously with time and finally disappeared. In this regard, we suggested that BNEA binding to water alters the molecular structure, which leads to the decrease in fluorescence in Figure 2B.
In this regard, we used methylene chloride as a good solvent and petroleum ether as a poor solvent to verify the AIE phenomenon of BNEA. It can be found that in Figure 2C,D, the fluorescence intensity of BNEA decreased sometimes, but its overall trend was to increase with the increase in the proportion of poor solvent, and there was no sharp decrease in fluorescence intensity, as shown in Figure 2B. In addition, in the UV-vis absorption spectrum shown in Figure 1B, no new absorption peak was found at 350 nm. This proved that BNEA molecules reacted irreversibly with water in good solvents. Therefore, on this basis, we studied the UV-vis spectrum of M4 in THF-H2O mixed solution. As shown in Figure 1C, the UV-vis absorption peak of the M4 was around 350 nm. This was consistent with the absorption peak that was found with the increase in water proportion in Figure 1A. Therefore, we could confirm water binding to the BNEA molecules occurred, the D-π-A structure of the molecule was destroyed, and the conjugate structure was reduced, which led to the blue shift of the absorption peak.
As shown in Figure 3, 1H NMR was used to further confirm that water reacted with BNEA. First, BNEA was dissolved into DMSO-d6 solvent to determine the 1H NMR spectrum (Figure 3A), and then D2O and BNEA were added to another DMSO-d6 solvent to determine the 1H NMR spectrum (Figure 3B). It could be found that the absorption peak representing N–H disappears with the addition of D2O, which proved that the decrease in fluorescence in Figure 2B was caused by the reaction between water and the active N–H. However, since the chemical shift of the hydrogen on the double bond did not change, we believe that D2O only destroyed the plane structure of the barbiturate but did not make the barbiturate group break away from the molecule.
For the binding of BNEA to water, we used HRMS spectra for further confirmation. Figure 4A shows the HRMS spectra of BNEA, and Figure 4B shows the HRMS spectra of BNEA binding to water, which could further determine the binding of BNEA to water. At the same time, the fluorescence stability of BNEA in two different solvents (water and methanol) was measured. It can be seen from Figure 4 that the fluorescence intensity of BNEA in aqueous solution was lower than that in methanol solution, and the fluorescence intensity of BNEA in aqueous solution decreased slowly with time. This indicates that it was not stable in aqueous solution, which might be due to the continuous reaction between water molecules and BNEA molecules, and the barbituric acid group structure was distorted, so that the fluorescence intensity decreased continuously at 450 nm.
3.3. Response of BNEA to pH
Since BNEA solution reacted with water to make its solution color and fluorescence disappear, we investigated its solution color and fluorescence change in 99% aqueous solution (VH2O:VDMSO = 99:1) with different pH. In Figure 5A,B, it could be found that the fluorescence intensity of 99% aqueous solution (VH2O:VDMSO = 99:1) under acid or base conditions was lower than that in a neutral environment (5 < pH < 8). It can also be found in Figure 6A that the absorption peak at 350 nm was higher in the acid or base environment. This indicates that a large number of protons in an acidic environment could promote the reaction between water and the N–H bond in BNEA. Meanwhile, we believed that under alkaline conditions, the amide bond in BNEA could be hydrolyzed, which led to the decrease in fluorescence and also led to a decrease in the conjugation of the molecule. Since BNEA was stable in 99% methanol solution (VMethanol:VDMSO = 99:1), methanol was used as the solvent, and 1% hydrochloric acid solution and NaOH solution were used to adjust the acid–base property of methanol solution [26]. Under acidic conditions, the fluorescence intensity of methanol solution did not change, but it decreased under alkaline conditions (Figure 5C,D). At the same time, there was no new absorption peak at 350 nm in the UV-vis absorption spectrum (Figure 6B). This indicates that BNEA in the good solvent was stable in the acidic environment, which further proves that BNEA molecules were reacted with water molecules in the acidic environment, and a large number of protons played a catalytic role in the reaction. Under alkaline conditions, the molecular structure could be damaged by strong alkali, resulting in the reduction in absorption and fluorescence intensity.
3.4. Effect of Hg2+ on BNEA Fluorescence in 99% Aqueous Solution (VH2O:VDMSO = 99:1)
Due to the special phenomenon of BNEA in water and its special luminescence mechanism, we carried out cationic detection experiments on BNEA and found that the probe had a specific response only to mercury ion among the 17 common cations. In Figure 7A, the solution with mercury ions retained its solution color in sunlight, while the solution with other ions became colorless. This allowed us to observe the results of ion detection with the naked eyes, which greatly improves its convenience. However, in Figure 7B, not only was the fluorescence intensity of the solution greater than the solution of other ions, but the position of the maximum fluorescence peak showed a large red shift. We believed that this was due to the hydrogen bond formed by the combination of the mercury ion with the N–H bond in the BNEA molecule (Hg2+:BNEA = 1:1), which expanded the conjugation degree of the molecule. This indicates that mercury ions in aqueous solution played a “protective” role for BNEA molecules in a certain sense. The reaction between water molecules and probe molecules were prevented, and therefore, the disappearance of solution fluorescence did not happen. This also allowed the color of the solution to be preserved so that the visual effect of mercury ion detection was achieved. This fluorescence intensity was compared (Figure 7C), and the fluorescence intensity of the solution with mercury ions increased by more than ten times compared with other solutions.
Above, we discussed the fluorescence of BNEA in mixed solutions in the presence of water affected by pH. The solution was subjected to fluorescence analysis in order to investigate whether the fluorescence of the solutions was affected by pH when mercury ions were added. As can be seen from Figure 8A,B, their fluorescence spectra were red-shifted at 6.0 < pH < 11.0, and their fluorescence intensities were enhanced. However, the enhanced basicity would make the fluorescence intensities of the solutions decrease or even disappear, because the amide bonds in BNEA molecules would be decomposed by strong bases, resulting in mercury ions no longer binding to the molecules. However, within this range, the tendency of BNEA molecules to combine with mercury ions was greater than that of water molecules. Under acidic conditions (2.0 < pH < 6.0), BNEA molecules reacted more easily with water molecules due to the large number of protons that the binding of BNEA and water molecules promoted. It could also be found from its UV spectrum (Figure 8C) that the UV absorption peaks became wider at 2.0 < pH < 6.0, which was also caused by the combination of BNEA and mercury ions. In general, under the condition of 6.0 < pH < 11.0, the acidity and alkalinity of the solution will not affect the selectivity and sensitivity of the probe too much.
3.5. Anti-Interference Ability of BNEA for Cations in Water
Since there are various cations in real water samples, in order to ensure that the detection of mercury ions would not be affected by other cations, we conducted an anti-interference experiment with cations on the probe. In Figure 9A, the probes were added to mercury ion solutions containing different metal cations that would make their fluorescence peaks redshift, and some cations increased the fluorescence intensity of the solutions. As can be seen from Figure 9B, common metal cations did not reduce the fluorescence intensity of the solutions, and the color of the liquid would not disappear with time like the blank solution. This shows that BNEA has a good anti-interference property against mercury ions in aqueous solution.
3.6. Complexation Mechanism of Hg2+ and BNEA
Figure 10A shows that with the increase in Hg2+ concentration, the fluorescence intensity of the solution also increased, and the fluorescence intensity of the solution reached the highest when [BNEA]:[Hg2+] = 1:1. Subsequently, the fluorescence intensity of the solution decreased with the increase in mercury ion concentration, and then the range of variation decreased. Therefore, mercury ions and BNEA might be 1:1 bound in the mixed solution. At the same time, we also obtained its detection limit as 22.27 nM according to Figure 10B. For further confirmation, we tested and obtained the Job’s plot of BNEA and Hg2+, which showed that the stoichiometric ratio of BNEA to Hg2+ was 1:1 (Figure 11A). At the same time, we tested the methanol solution containing BNEA and Hg2+ by HRMS spectra, and the results are shown in Figure 11B, which further confirm that the stoichiometric ratio of BNEA to Hg2+ is 1:1.
To confirm where the mercury ions bind to the BNEA molecule, we examined them by 1H NMR. Figure 12A shows the 1H NMR spectrum of BNEA in deuterated DMSO solution. Figure 12B shows the spectrum was measured after BNEA was dissolved in DMSO-d6 solvent and CD4O solution containing mercury ions was added and mixed evenly. It could be found that Figure 12B was similar to Figure 3B, in that two N–H peaks disappeared around 11.0 ppm, while the positions of other peaks remained basically unchanged. This was sufficient to indicate that water and mercury ions were at the same site of binding to BNEA. However, through the comparison of fluorescence patterns, the blue shift of fluorescence peaks was observed after adding water, while the red shift of fluorescence peaks was observed after added mercury ion, which was most likely caused by their different binding modes.
3.7. Detection of BNEA in Real Water Samples
In order to study the effect of probe BNEA in practical application, it was applied in real water samples. Figure 13A shows that there were no fluorescence peak at 620 nm in the four groups of water samples without mercury ions. Comparing the three real water samples with pure water in Figure 13B, the fluorescence intensities of this solution at 620 nm basically did not change. On the one hand, this indicates that the mercury ion concentration in the three real water samples did not reach the detection limit of the probe. On the other hand, it also shown that the ions in the three real water samples did not affect the luminescence of probe BNEA. At the same time, the same concentration of mercury ions (10 μM) was added to the four water samples, and the fluorescence detection was carried out under this condition with other conditions unchanged. From Figure 13A, we could find that the four solutions have significantly enhanced fluorescence intensity at 620 nm, and the comparison of fluorescence intensity could be observed in Figure 13B. This indicates that the detection results of probe BNEA for mercury ions were basically not affected by other ions in real water samples, which also indicates that probe BNEA had good selectivity for mercury ions in real water samples.
3.8. Comparison with other AIE Probes Targeting Metal Ions
In Table 1, we listed several recently reported AIE fluorescence sensors, all of which target metal cations. By comparison, our sensor has a low detection limit, high selectivity, high sensitivity, strong anti-interference ability, and good visualization ability, which can be used for real water samples detection. Therefore, as a fluorescence sensor for Hg2+ detection, BNEA has excellent detection performance and practicability and has great application potential.
4. Conclusions
A novel fluorescence sensor BNEA with AIE phenomenon was designed and developed. Through the study of its fluorescence phenomenon, it was found that it had good detection performance for mercury ion. The BNEA sensor had the advantages of fast response speed, high selectivity, strong anti-interference ability and low detection limit (22.27 nM) when detecting mercury ions in aqueous solution. The complex formed by the combination of mercury ions and BNEA increases the degree of molecular conjugation, which not only made the fluorescence peak red shift but also enhanced the fluorescence intensity, which could achieve the effect of mercury ion detection. The reaction mechanism was confirmed by absorption and emission spectrum analysis, 1H NMR and HRMS. In addition, through the detection of real water samples, the BNEA sensor could detect mercury ion in real water sensitively.
Author Contributions
Conceptualization, Y.C.; methodology, X.G.; validation, X.G.; formal analysis, X.G. and L.G.; investigation, X.G.; resources, Y.C.; writing—original draft preparation, X.G. and L.G.; writing—review and editing, Y.C. and S.W.; supervision, Y.C.; project administration, F.T.; funding acquisition, Y.C. All authors have read and agreed to the published version of the manuscript.
Funding
This work was financially supported by the Natural Science Foundation of Shandong province (ZR2018MB025), Key R&D Program Projects of Shandong province (2017GGX202001) and the Funds for Research Leader in Jinan (2018GXRC028).
Data Availability Statement
The data presented in this study are available on request from the first author.
Conflicts of Interest
The authors declare no conflict of interest.
References
- Wang, P.; Xue, S.; Chen, B.; Liao, F. A novel peptide-based fluorescent probe for highly selective detection of mercury (II) ions in real water samples and living cells based on aggregation-induced emission effect. Anal. Bioanal. Chem. 2022, 414, 4717–4726. [Google Scholar] [CrossRef] [PubMed]
- Du, J.; Jiang, L.; Shao, Q.; Liu, X.; Marks, R.S.; Ma, J.; Chen, X. Colorimetric detection of mercury ions based on plasmonic nanoparticles. Small 2013, 9, 1467–1481. [Google Scholar] [CrossRef]
- Zhang, L.; Chang, H.; Hirata, A.; Wu, H.; Xue, Q.-K.; Chen, M. Nanoporous gold based optical sensor for sub-ppt detection of mercury ions. ACS Nano 2013, 7, 4595–4600. [Google Scholar] [CrossRef]
- Su, Y.; Su, L.; Liu, B.; Lin, Y.; Tang, D. Self-Powered Photoelectrochemical Assay for Hg2+ Detection Based on g-C3N4-CdS-CuO Composites and Redox Cycle Signal Amplification Strategy. Chemosensors 2022, 10, 286. [Google Scholar] [CrossRef]
- Zhang, Y.; Liu, C.; Su, M.; Rong, X.; Wang, X.; Wang, K.; Li, X.; Zhu, H.; Yu, M.; Sheng, W.; et al. A highly selective barbiturate-based fluorescent probe for detecting Hg2+ in cells and zebrafish as well as in real water samples. J. Photochem. Photobiol. A Chem. 2022, 425, 113706. [Google Scholar] [CrossRef]
- Liu, J.; Tai, W.; Wang, D.; Su, J.; Yu, L. Cholesteric Liquid Crystal Photonic Hydrogel Films Immobilized with Urease Used for the Detection of Hg2+. Chemosensors 2022, 10, 140. [Google Scholar] [CrossRef]
- Lv, H.; Sun, H. A novel coumarin-benzopyrylium based near-infrared fluorescent probe for Hg(2+) and its practical applications. Spectrochim. Acta. A Mol. Biomol. Spectrosc. 2022, 267, 120527. [Google Scholar] [CrossRef] [PubMed]
- Kim, H.N.; Ren, W.X.; Kim, J.S.; Yoon, J. Fluorescent and colorimetric sensors for detection of lead, cadmium, and mercury ions. Chem. Soc. Rev. 2012, 41, 3210–3244. [Google Scholar] [CrossRef]
- Yang, T.; Qin, J.; Zhang, J.; Guo, L.; Yang, M.; Wu, X.; You, M.; Peng, H.J.C. Recent Progresses in NIR-II Luminescent Bio/Chemo Sensors Based on Lanthanide Nanocrystals. Chemosensors 2022, 10, 206. [Google Scholar] [CrossRef]
- Yue, Y.; Huo, F.; Yin, C.; Escobedo, J.O.; Strongin, R.M.J.A. Recent progress in chromogenic and fluorogenic chemosensors for hypochlorous acid. Analyst 2016, 141, 1859–1873. [Google Scholar] [CrossRef] [Green Version]
- Mei, J.; Hong, Y.; Lam, J.W.; Qin, A.; Tang, Y.; Tang, B.Z. Aggregation-induced emission: The whole is more brilliant than the parts. Adv. Mater. 2014, 26, 5429–5479. [Google Scholar] [CrossRef] [PubMed]
- Wang, X.; Hu, J.; Zhang, G.; Liu, S. Highly selective fluorogenic multianalyte biosensors constructed via enzyme-catalyzed coupling and aggregation-induced emission. J. Am. Chem. Soc. 2014, 136, 9890–9893. [Google Scholar] [CrossRef] [PubMed]
- Liang, G.; Lam, J.W.; Qin, W.; Li, J.; Xie, N.; Tang, B.Z. Molecular luminogens based on restriction of intramolecular motions through host-guest inclusion for cell imaging. Chem. Commun. 2014, 50, 1725–1727. [Google Scholar] [CrossRef]
- Zhang, K.-R.; Hu, M.; Luo, J.; Ye, F.; Zhou, T.-T.; Yuan, Y.-X.; Gao, M.-L.; Zheng, Y.-S. Pseudo-crown ether having AIE and PET effects from a TPE-CD conjugate for highly selective detection of mercury ions. Chin. Chem. Lett. 2022, 33, 1505–1510. [Google Scholar] [CrossRef]
- Luo, J.; Xie, Z.; Lam, J.W.; Cheng, L.; Chen, H.; Qiu, C.; Kwok, H.S.; Zhan, X.; Liu, Y.; Zhu, D.J.C.C. Aggregation-induced emission of 1-methyl-1, 2, 3, 4, 5-pentaphenylsilole. Chem. Commun. 2001, 18, 1740–1741. [Google Scholar] [CrossRef]
- Liu, B.; Liu, J.; He, J.; Zhang, J.; Zhou, H.; Gao, C. A novel red-emitting fluorescent probe for the highly selective detection of Hg2+ ion with AIE mechanism. Chem. Phys. 2020, 539, 110944. [Google Scholar] [CrossRef]
- Liu, L.; Ma, J.; Pan, J.; Li, D.; Wang, H.; Yang, H. The preparation of novel triphenylamine-based AIE-effect fluorescent probe for selectively detecting mercury(ii) ion in aqueous solution. New J. Chem. 2021, 45, 5049–5059. [Google Scholar] [CrossRef]
- Shan, Y.; Yao, W.; Liang, Z.; Zhu, L.; Yang, S.; Ruan, Z. Reaction-based AIEE-active conjugated polymer as fluorescent turn on probe for mercury ions with good sensing performance. Dye. Pigment. 2018, 156, 1–7. [Google Scholar] [CrossRef]
- Ma, J.; Xiao, Y.; Zhang, C.; Zhang, M.; Wang, Q.; Zheng, W.; Zhang, S. Preparation a novel pyrene-based AIE-active ratiometric turn-on fluorescent probe for highly selective and sensitive detection of Hg2+. Mater. Sci. Eng. B 2020, 259, 114582. [Google Scholar] [CrossRef]
- Ma, J.; Zhang, C.; Xiao, Y.; Zhang, M.; Wang, Q.; Zheng, W.; Zhang, S. Preparation 2-(anthracen-9-yl)-1,3-dithiolane as a novel dual-channel AIE-active fluorescent probe for mercury (II) ion with excellent performance. J. Photochem. Photobiol. A Chem. 2019, 378, 142–146. [Google Scholar] [CrossRef]
- Cheng, X.; Huang, S.; Lei, Q.; Chen, F.; Zheng, F.; Zhong, S.; Huang, X.; Feng, B.; Feng, X.; Zeng, W. The exquisite integration of ESIPT, PET and AIE for constructing fluorescent probe for Hg(II) detection and poisoning. Chin. Chem. Lett. 2022, 33, 1861–1864. [Google Scholar] [CrossRef]
- Pannipara, M.; Al-Sehemi, A.G.; Irfan, A.; Assiri, M.; Kalam, A.; Al-Ammari, Y.S. AIE active multianalyte fluorescent probe for the detection of Cu(2+), Ni(2+) and Hg(2+) ions. Spectrochim. Acta A Mol. Biomol. Spectrosc. 2018, 201, 54–60. [Google Scholar] [CrossRef] [PubMed]
- Yuan, Y.; Chen, X.; Chen, Q.; Jiang, G.; Wang, H.; Wang, J. New switch on fluorescent probe with AIE characteristics for selective and reversible detection of mercury ion in aqueous solution. Anal. Biochem. 2019, 585, 113403. [Google Scholar] [CrossRef]
- He, M.; Twieg, R.J.; Gubler, U.; Wright, D.; Moerner, W.J.C.O.M. Synthesis and photorefractive properties of multifunctional glasses. Chem. Mater. 2003, 15, 1156–1164. [Google Scholar] [CrossRef]
- Zhang, Y.; Zhang, Y.; Yue, Y.; Chao, J.; Huo, F.; Yin, C. Based on morpholine as luminescence mechanism regulation and organelle targeting dual function Cys NIR specific biological imaging probe. Sens. Actuators B Chem. 2020, 320, 128348. [Google Scholar] [CrossRef]
- Singh, R.B.; Mahanta, S.; Kar, S.; Guchhait, N. Spectroscopic and theoretical evidence for the photoinduced twisted intramolecular charge transfer state formation in N,N-dimethylaminonaphthyl-(acrylo)-nitrile. J. Lumin. 2008, 128, 1421–1430. [Google Scholar] [CrossRef]
- Yun, D.; Chae, J.B.; So, H.; Lee, H.; Kim, K.-T.; Kim, C. Sensing of zinc ions and sulfide using a highly practical and water-soluble fluorescent sensor: Applications in test kits and zebrafish. New J. Chem. 2020, 44, 442–449. [Google Scholar] [CrossRef]
- Li, R.-Y.; Wei, Z.-L.; Wang, L.; Zhang, Y.; Ru, J.-X. A new salamo-based fluorescence probe to visually detect aluminum(III) ion and bio-imaging in zebrafish. Microchem. J. 2021, 162, 105720. [Google Scholar] [CrossRef]
- Yin, Z.-Y.; Hu, J.-H.; Gui, K.; Fu, Q.-Q.; Yao, Y.; Zhou, F.-L.; Ma, L.-L.; Zhang, Z.-P. AIE based colorimetric and “turn-on” fluorescence Schiff base sensor for detecting Fe3+ in an aqueous media and its application. J. Photochem. Photobiol. A Chem. 2020, 396, 112542. [Google Scholar] [CrossRef]
- Zou, Q.; Du, J.; Gu, C.; Zhang, D.; Tao, F.; Cui, Y. A new dibenzothiophene-based dual-channel chemosensor for cyanide with aggregation induced emission. J. Photochem. Photobiol. A Chem. 2021, 405, 112993. [Google Scholar] [CrossRef]
Scheme 1.
Probe BNEA bonding to mercury ion in aqueous solution.
Scheme 2.
Synthetic procedures for BNEA.
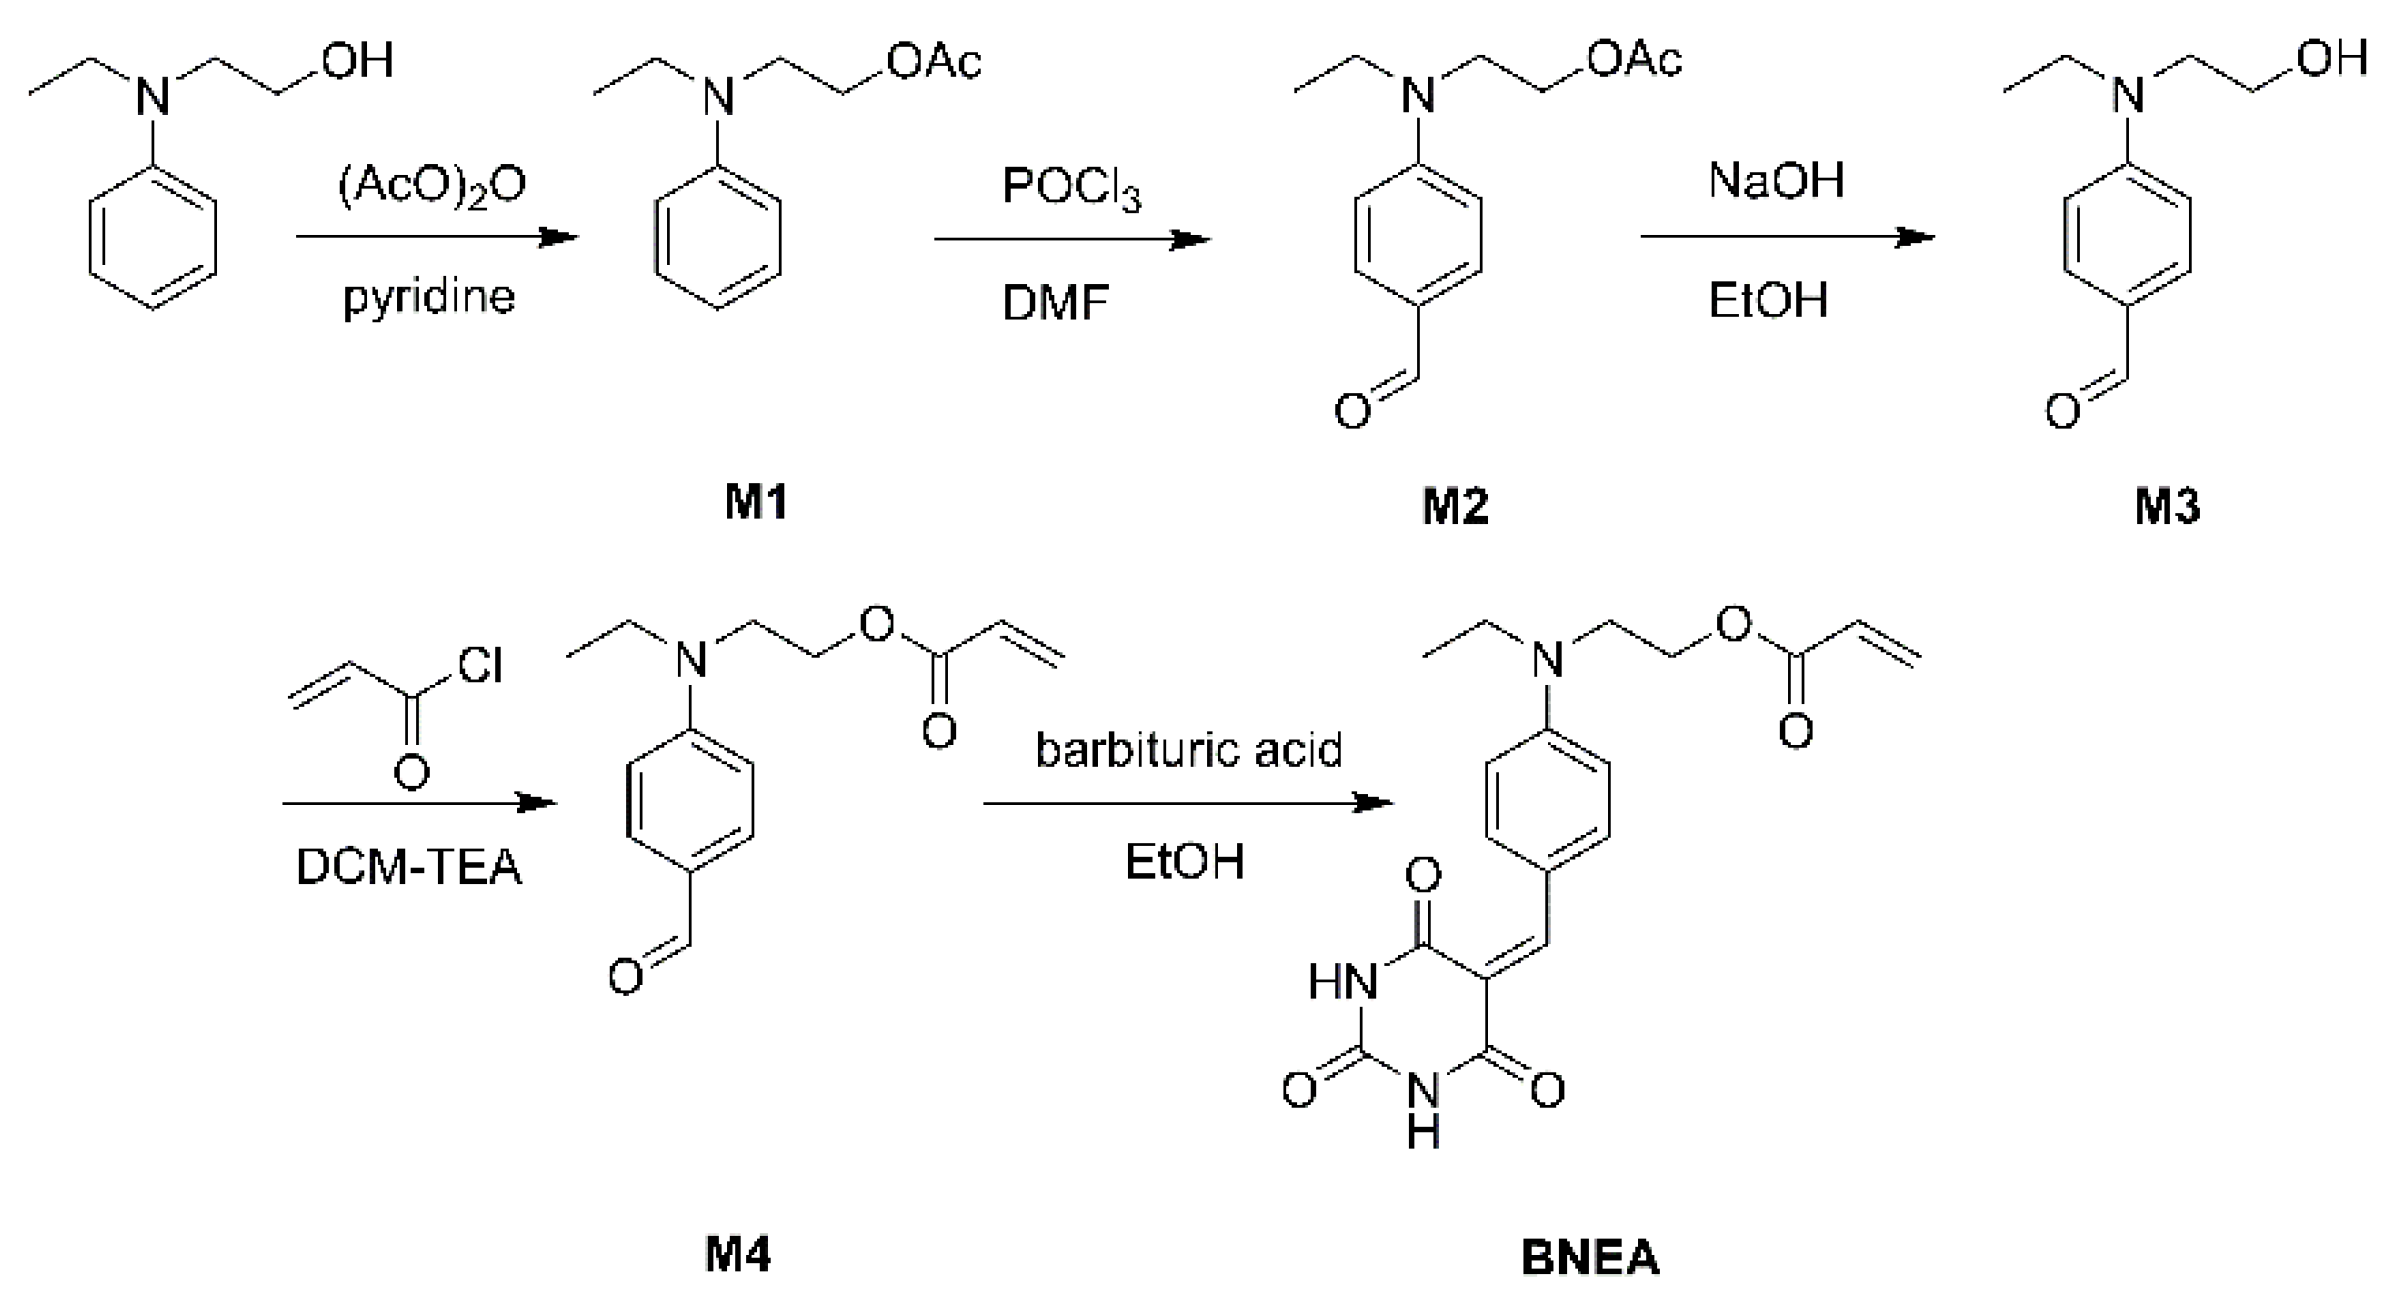
Figure 1.
UV-vis spectra of (A) BNEA in THF-H2O mixture solution, (B) BNEA in DCM-PE mixture solution ([BNEA] = 20 μM) and (C) M4 in THF-H2O mixture solution ([M4] = 20 μM).
Figure 1.
UV-vis spectra of (A) BNEA in THF-H2O mixture solution, (B) BNEA in DCM-PE mixture solution ([BNEA] = 20 μM) and (C) M4 in THF-H2O mixture solution ([M4] = 20 μM).
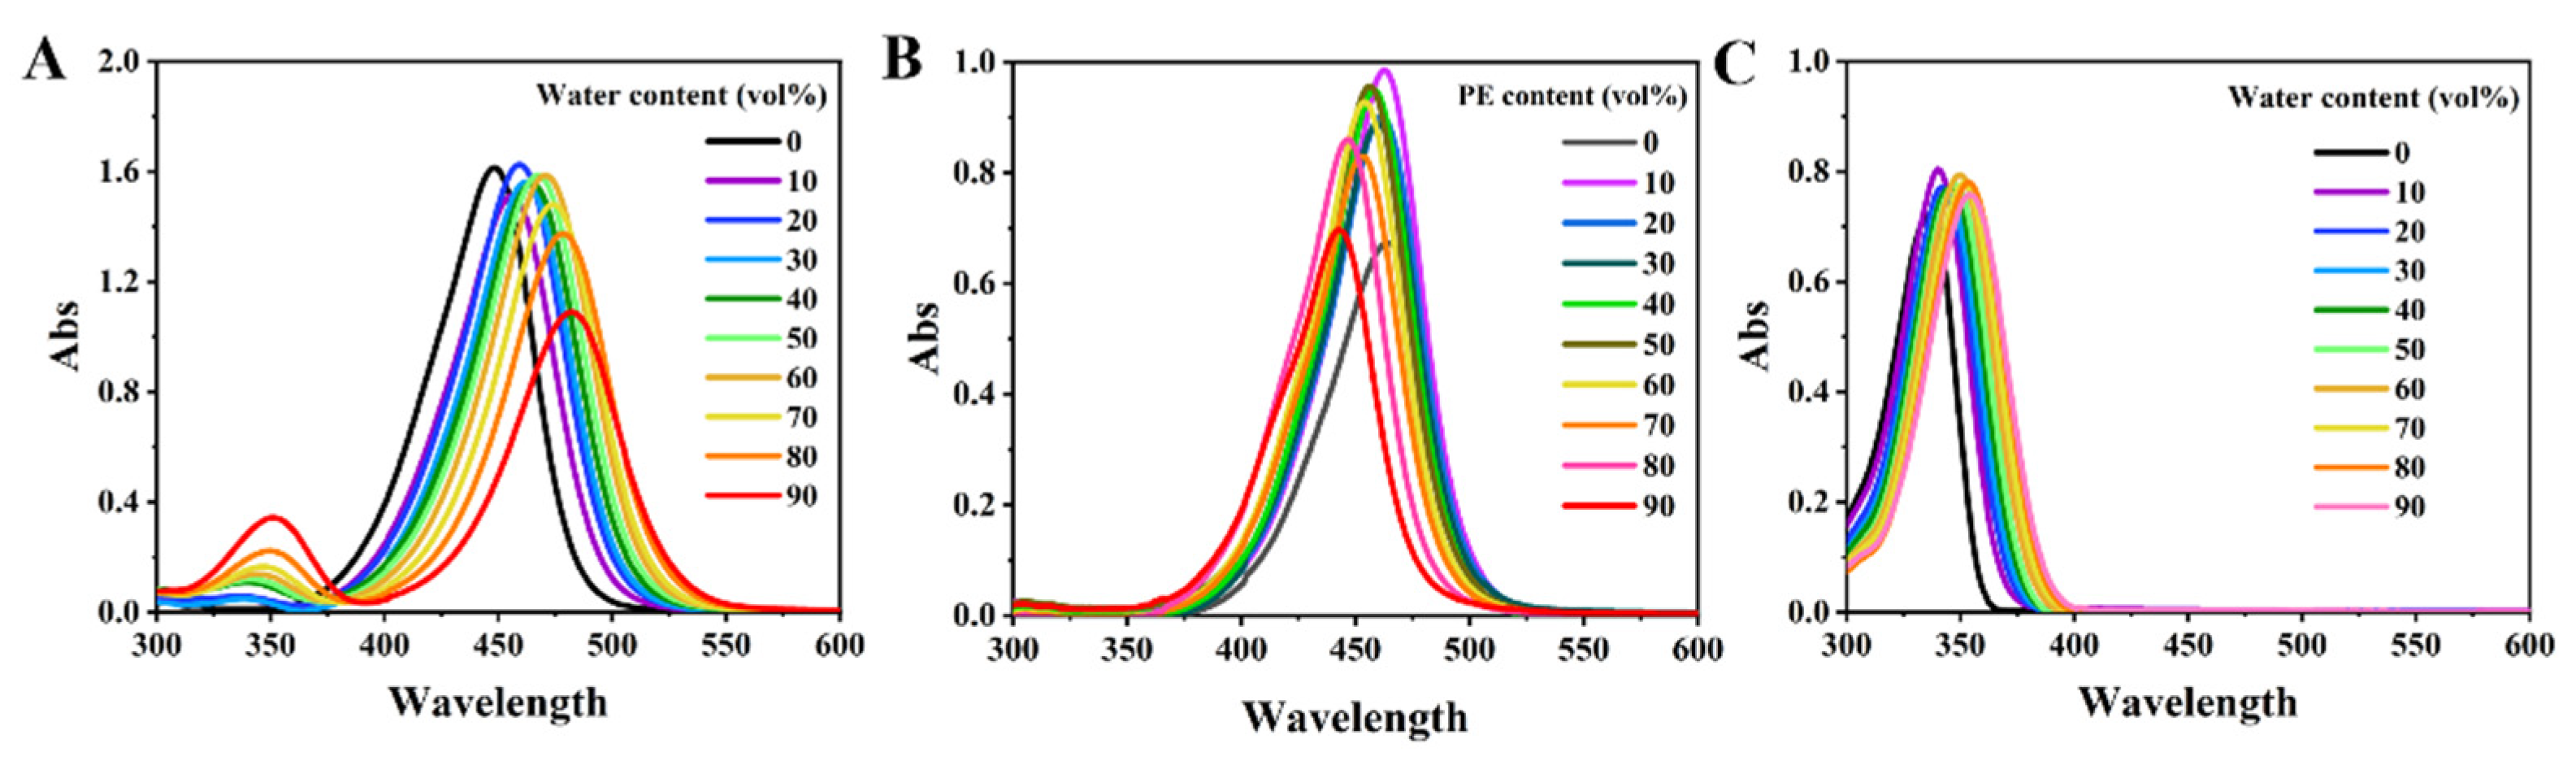
Figure 2.
(A) Fluorescence spectra and (B) change in fluorescence intensity of BNEA in THF-H2O mixture solution. (C) Fluorescence spectra and (D) change in fluorescence intensity of BNEA in DCM-PE mixture solution (λex = 430 nm, [BNEA] = 20 μM).
Figure 2.
(A) Fluorescence spectra and (B) change in fluorescence intensity of BNEA in THF-H2O mixture solution. (C) Fluorescence spectra and (D) change in fluorescence intensity of BNEA in DCM-PE mixture solution (λex = 430 nm, [BNEA] = 20 μM).
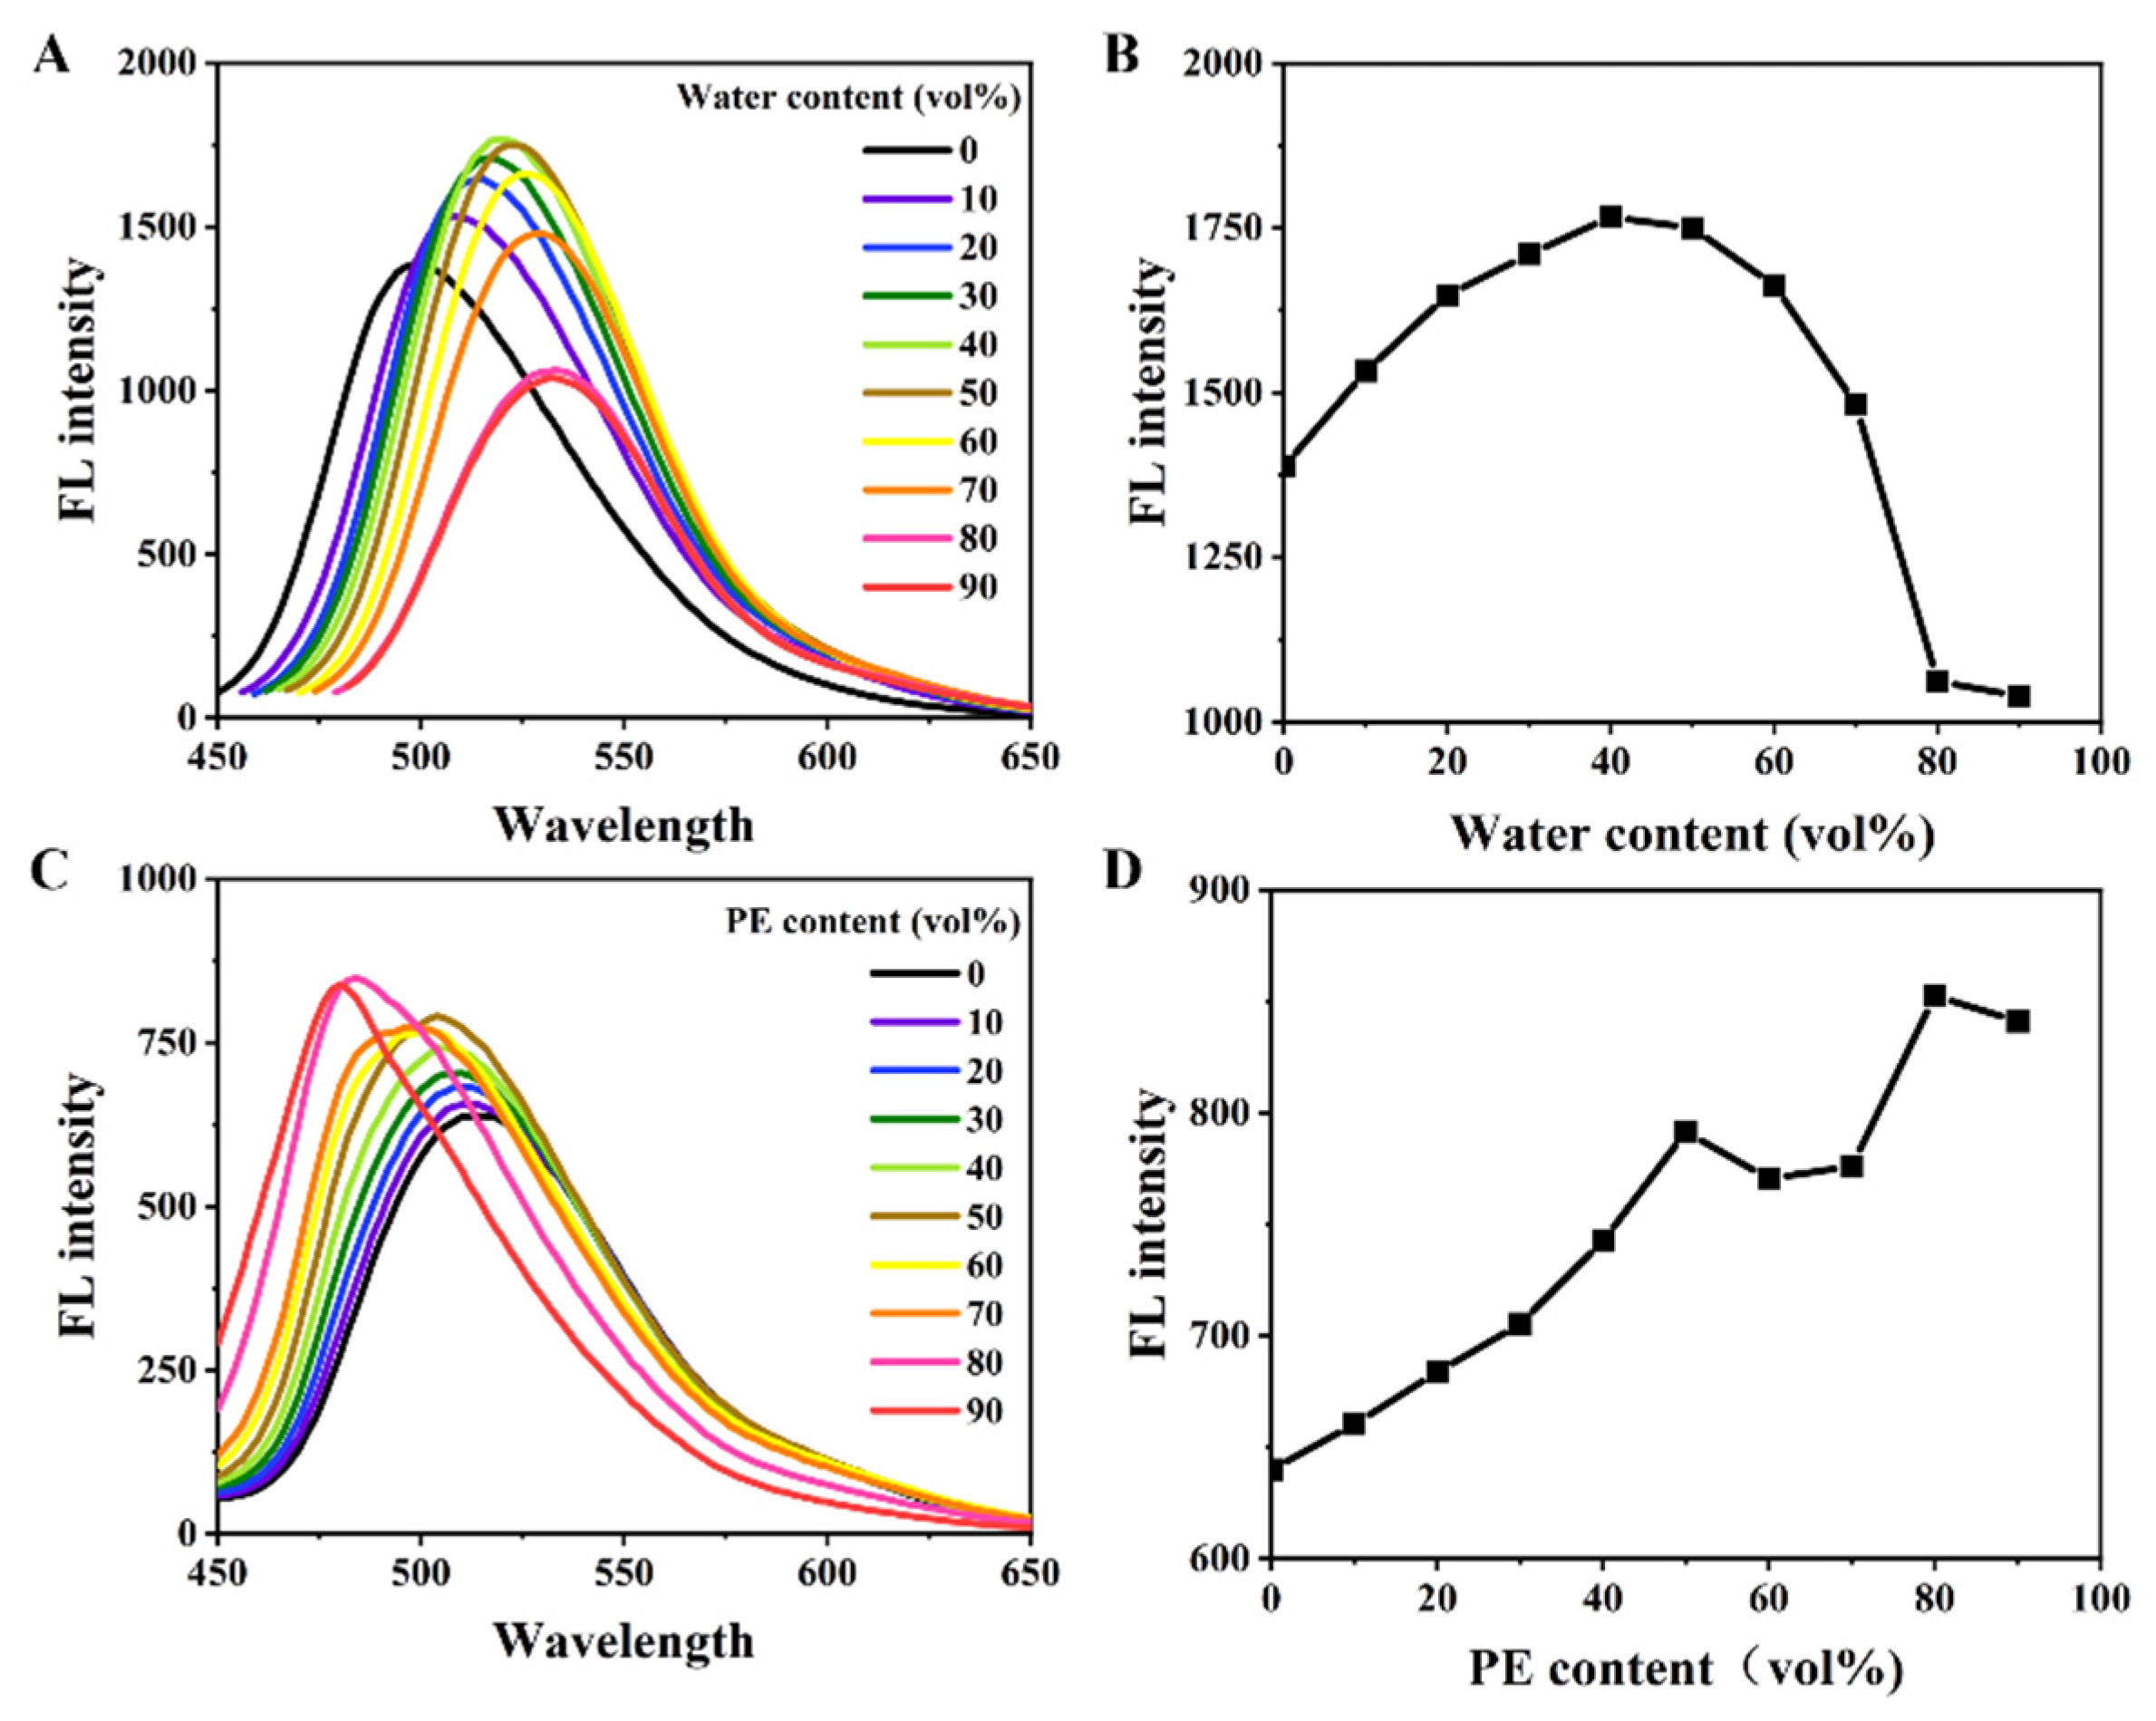
Figure 3.
1H NMR Spectra of BNEA was measured in (A) DMSO-d6 and (B) mixed solvent (VDMSO-d6:VD2O = 1:1).
Figure 3.
1H NMR Spectra of BNEA was measured in (A) DMSO-d6 and (B) mixed solvent (VDMSO-d6:VD2O = 1:1).

Figure 4.
HRMS (ESI) spectra of (A) BNEA and (B) BNEA with H2O in methanol solution and (C) Fluorescence stability of BNEA in 99% methanol solution (VMethanol:VDMSO = 99:1) and 99% aqueous solution (VH2O:VDMSO = 99:1) ([BNEA] = 10 μM).
Figure 4.
HRMS (ESI) spectra of (A) BNEA and (B) BNEA with H2O in methanol solution and (C) Fluorescence stability of BNEA in 99% methanol solution (VMethanol:VDMSO = 99:1) and 99% aqueous solution (VH2O:VDMSO = 99:1) ([BNEA] = 10 μM).
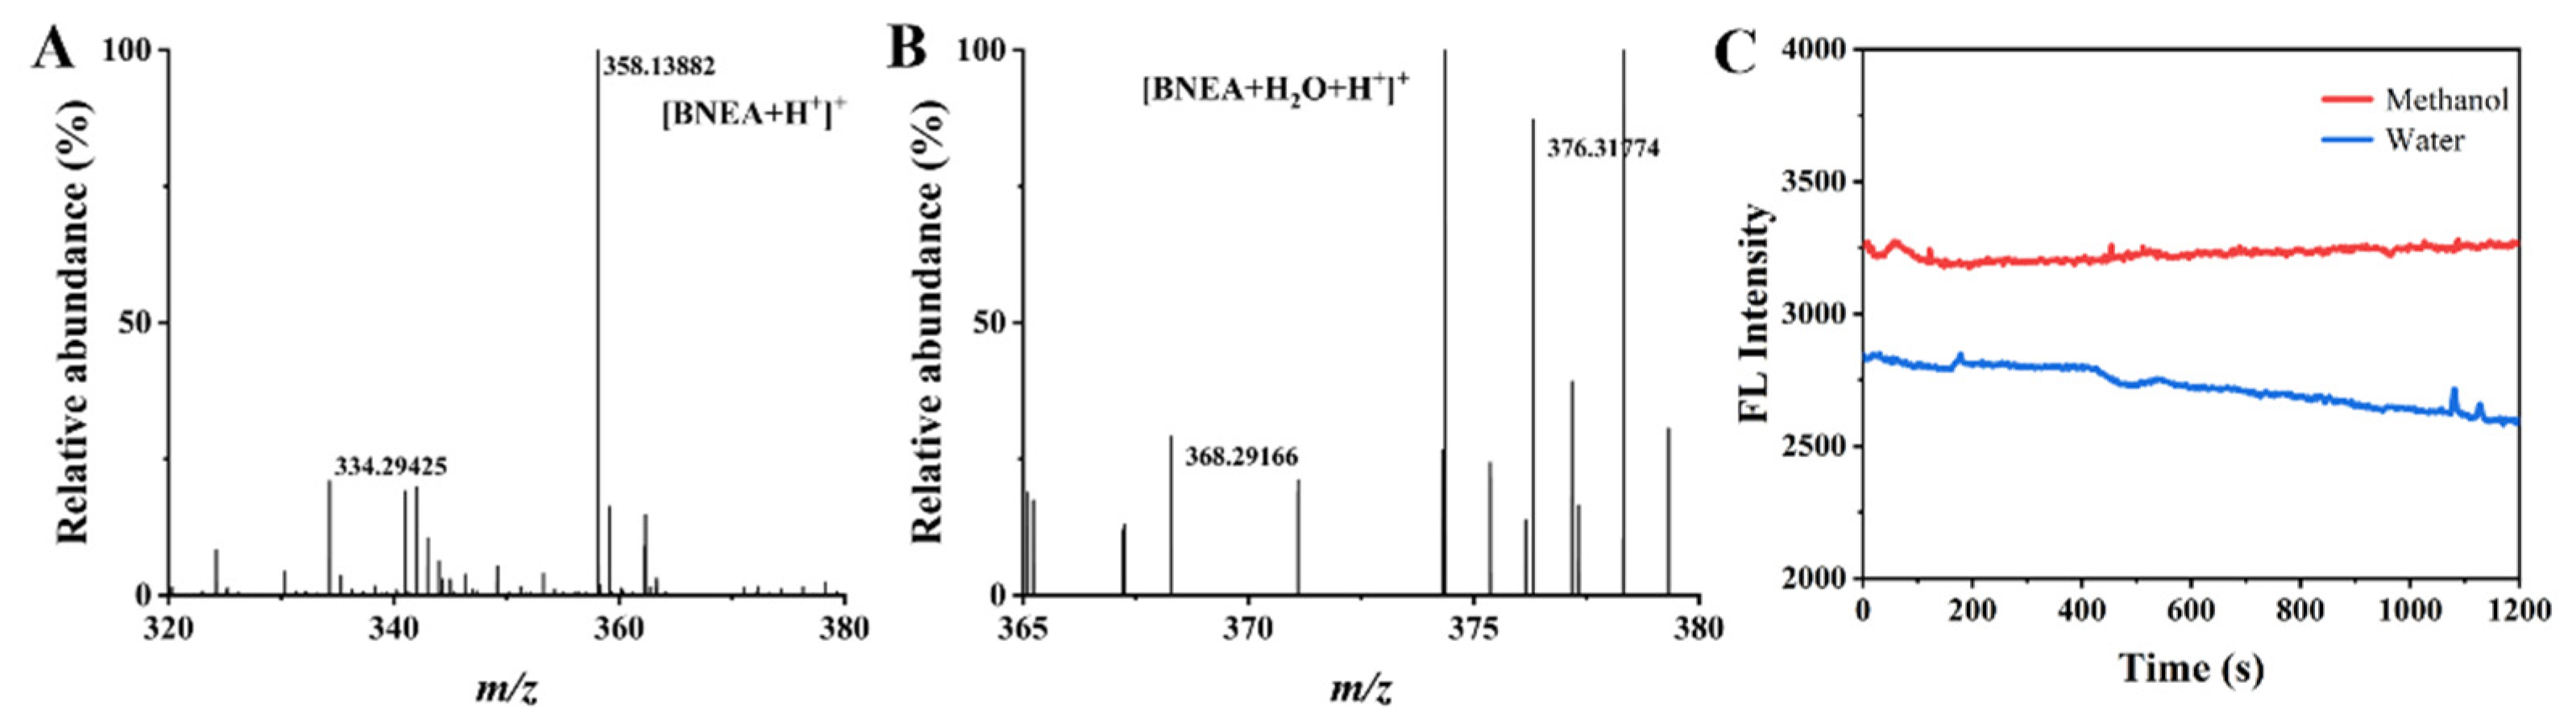
Figure 5.
(A) Fluorescence spectra and (B) change in fluorescence intensity of BNEA in 99% aqueous solution (VH2O:VDMSO = 99:1) at different pH. (C) Fluorescence spectra and (D) change in fluorescence intensity of BNEA in 99% methanol solution (VMethanol:VDMSO = 99:1) at different pH (λex = 450 nm, [BNEA] = 10 μM).

Figure 6.
(A) UV-vis spectra of BNEA in 99% aqueous solution (VH2O:VDMSO = 99:1) at different pH and (B) UV-vis spectra of BNEA in 99% methanol solution (VMethanol:VDMSO = 99:1) at different pH ([BNEA] = 10 μM).
Figure 6.
(A) UV-vis spectra of BNEA in 99% aqueous solution (VH2O:VDMSO = 99:1) at different pH and (B) UV-vis spectra of BNEA in 99% methanol solution (VMethanol:VDMSO = 99:1) at different pH ([BNEA] = 10 μM).

Figure 7.
(A) Color comparison of solutions under sunlight, (B) fluorescence spectra (λex = 450 nm) and (C) bar graphs of maximum fluorescence intensity (a = blank, b = K+, c = Ca2+, d = NH4+, e = Mn2+, f = Cr3+, g = Cu2+, h = Cu+, i = Pb2+, j = Hg2+, k = Fe2+, l = Ni2+, m = Cd2+, n = Co2+, o = Al3+, p = Ba2+, q = Na+, r = Ag+) in 99% aqueous solution (VH2O:VDMSO = 99:1) containing probe ([BNEA] = 10 μM) and different cations ([Ions] = 10 μM).

Figure 8.
(A) Fluorescence spectra (λex = 450 nm), (B) change in fluorescence intensity and (C) UV-vis spectra of BNEA in mixed solution containing mercury ions at different pH ([BNEA] = 10 μM).
Figure 8.
(A) Fluorescence spectra (λex = 450 nm), (B) change in fluorescence intensity and (C) UV-vis spectra of BNEA in mixed solution containing mercury ions at different pH ([BNEA] = 10 μM).
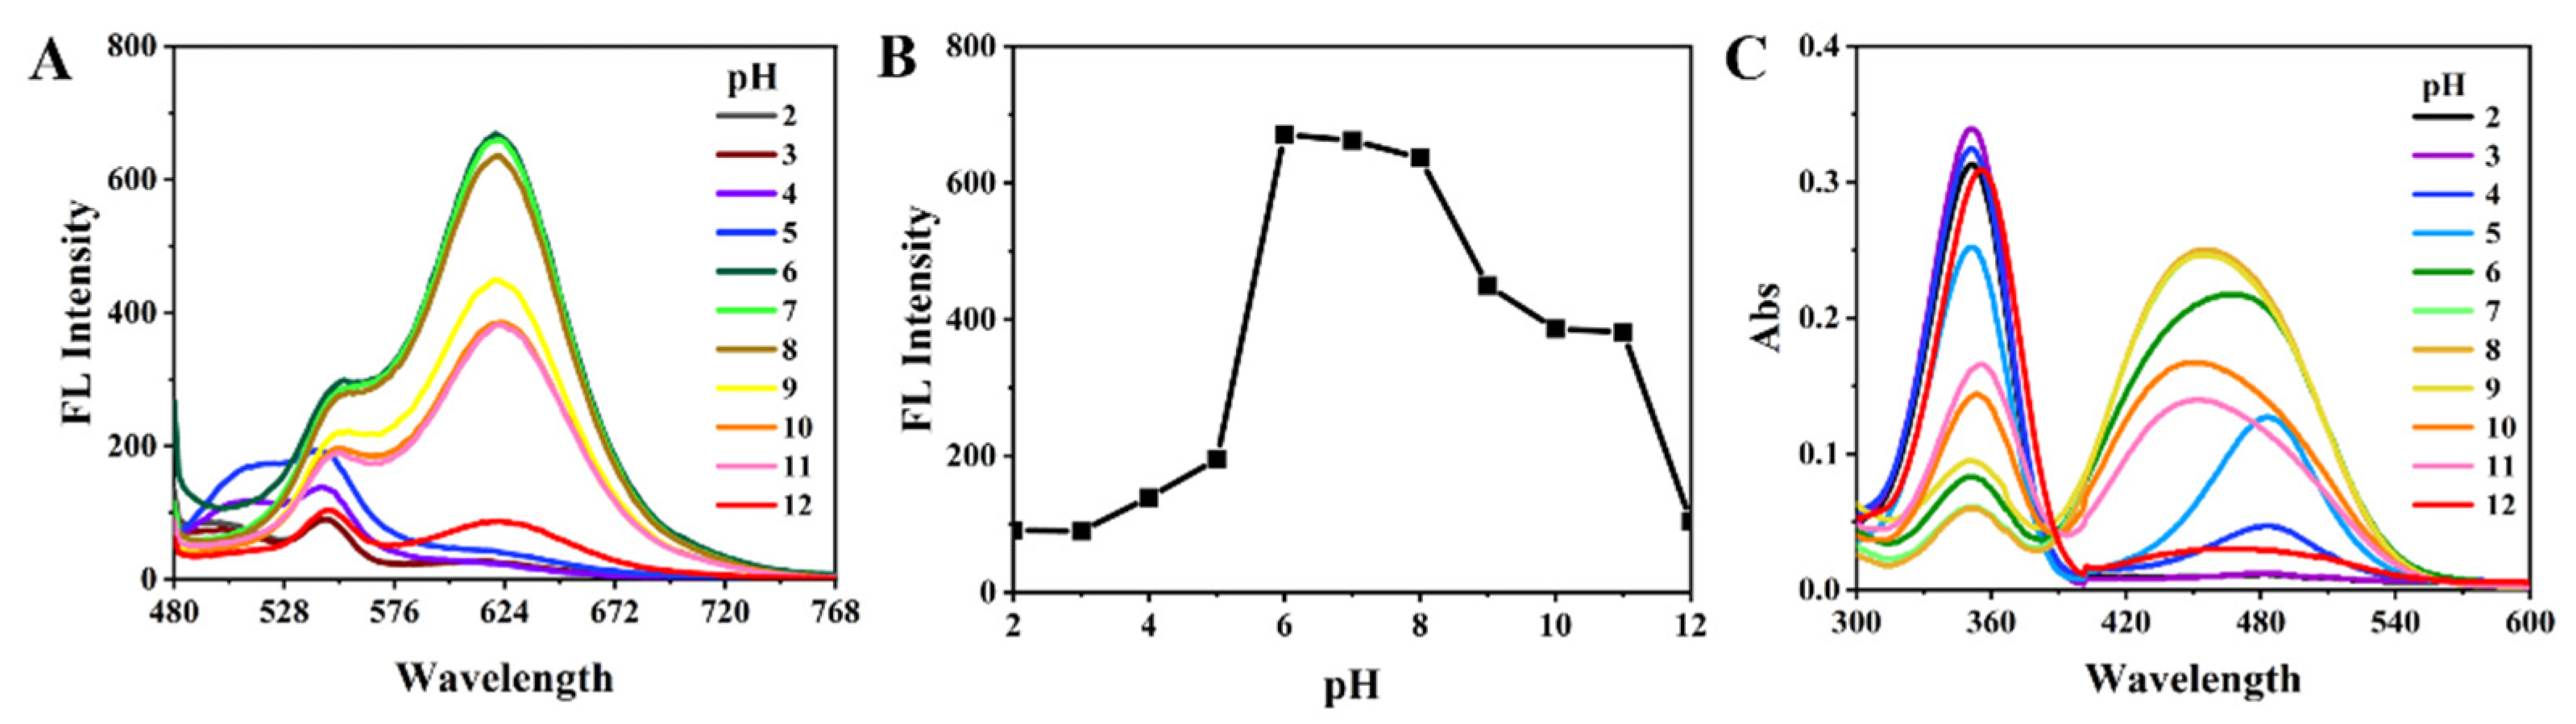
Figure 9.
(A) Fluorescence spectrum and (B) bar graphs of maximum fluorescence intensity (a = blank, b = K+, c = Ca2+, d = NH4+, e = Mn2+, f = Cr3+, g = Cu2+, h = Cu+, i = Pb2+, j = Fe2+, k = Ni2+, l = Cd2+, m = Co2+, n = Al3+, o = Ba2+, p = Na+, q = Ag+) of BNEA anti-interference experiment for mercury ions response performance (λex = 450 nm, [BNEA] = 10 μM).
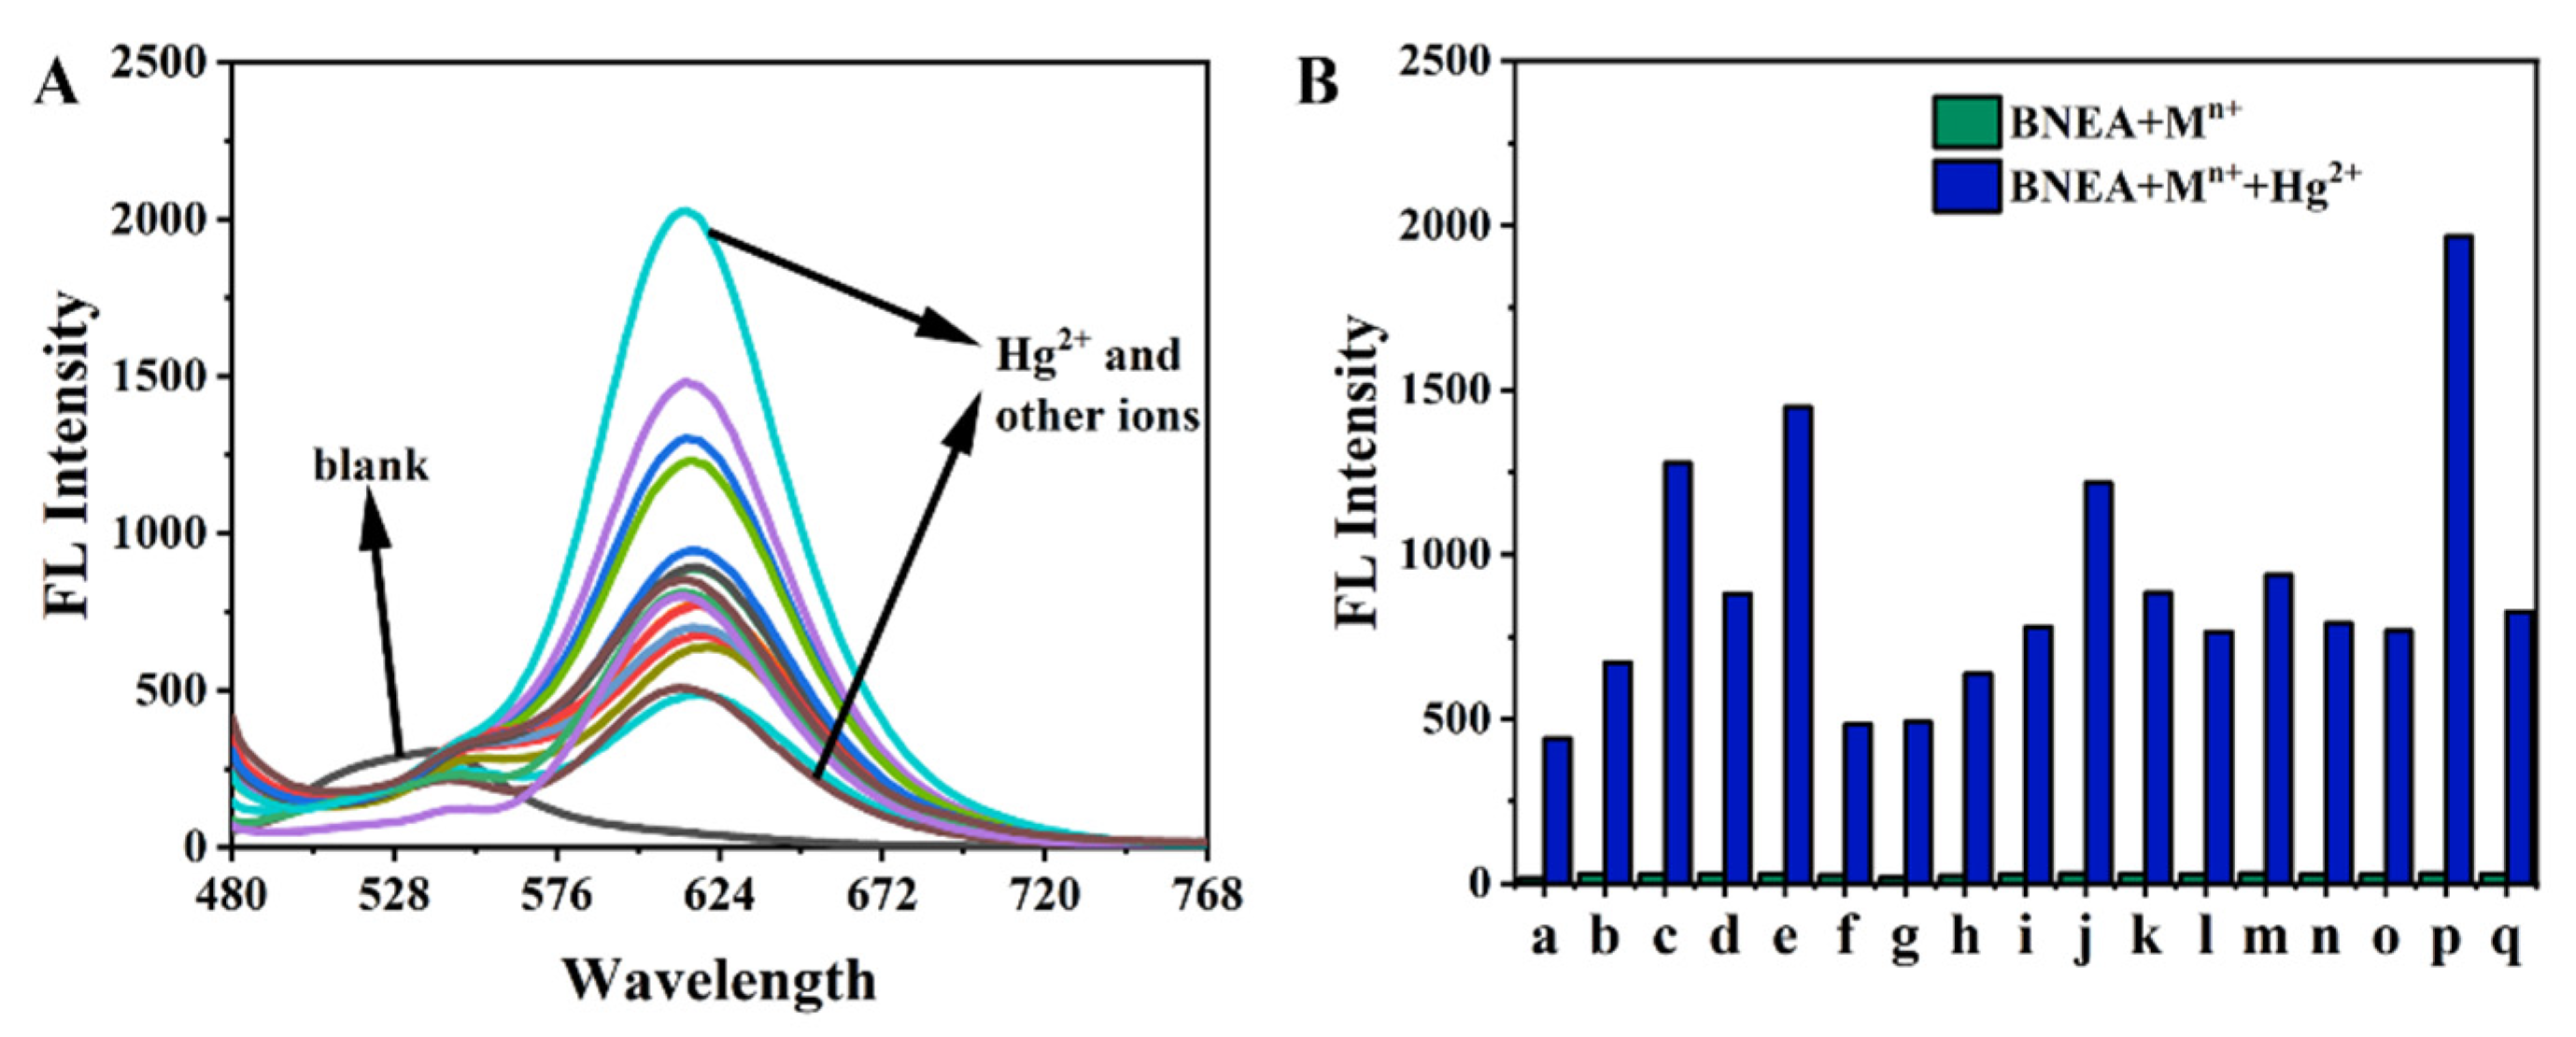
Figure 10.
(A) Fluorescence intensity variation of BNEA (10 μM) in 99% aqueous solution (VH2O:VDMSO = 99:1) with different mercury ion concentrations (0–2 equiv), (B) detection limit of BNEA for mercury ions.
Figure 10.
(A) Fluorescence intensity variation of BNEA (10 μM) in 99% aqueous solution (VH2O:VDMSO = 99:1) with different mercury ion concentrations (0–2 equiv), (B) detection limit of BNEA for mercury ions.
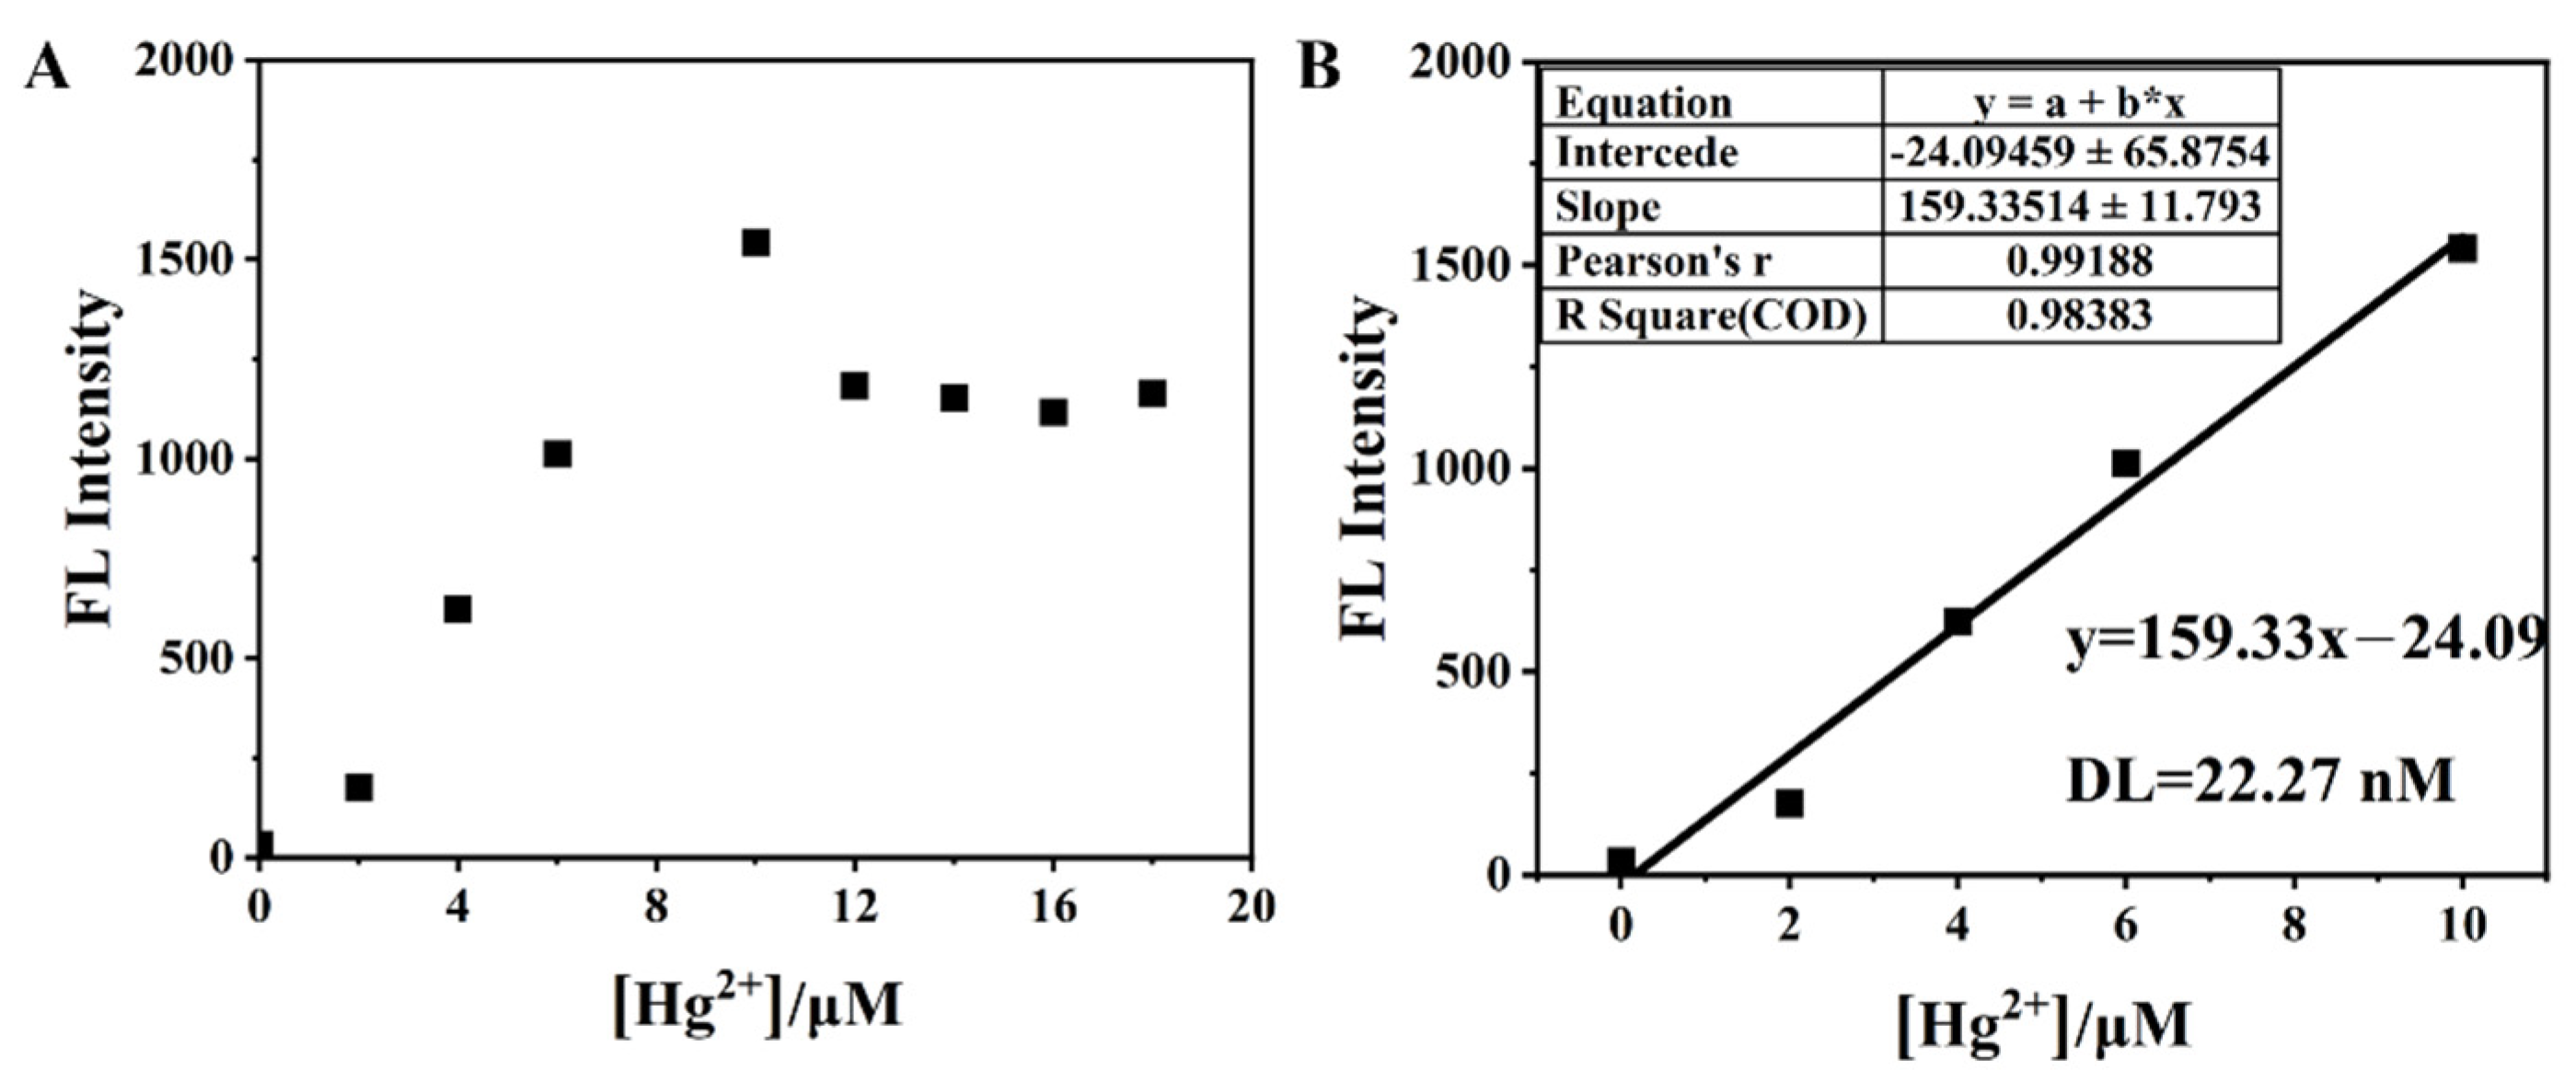
Figure 11.
(A) The Job’s plot for BNEA (10 μM) towards Hg2+ in 99% aqueous solution (VH2O:VDMSO = 99:1), (B) HRMS (ESI) spectra of BNEA with Hg2+ in methanol solution.
Figure 11.
(A) The Job’s plot for BNEA (10 μM) towards Hg2+ in 99% aqueous solution (VH2O:VDMSO = 99:1), (B) HRMS (ESI) spectra of BNEA with Hg2+ in methanol solution.

Figure 12.
(A) 1H NMR Spectrum of BNEA was measured in DMSO-d6, (B) 1H NMR Spectrum of BNAE and Hg2+ were measured in a mixed solvent (VDMSO-d6:VCD4O = 1:1).
Figure 12.
(A) 1H NMR Spectrum of BNEA was measured in DMSO-d6, (B) 1H NMR Spectrum of BNAE and Hg2+ were measured in a mixed solvent (VDMSO-d6:VCD4O = 1:1).
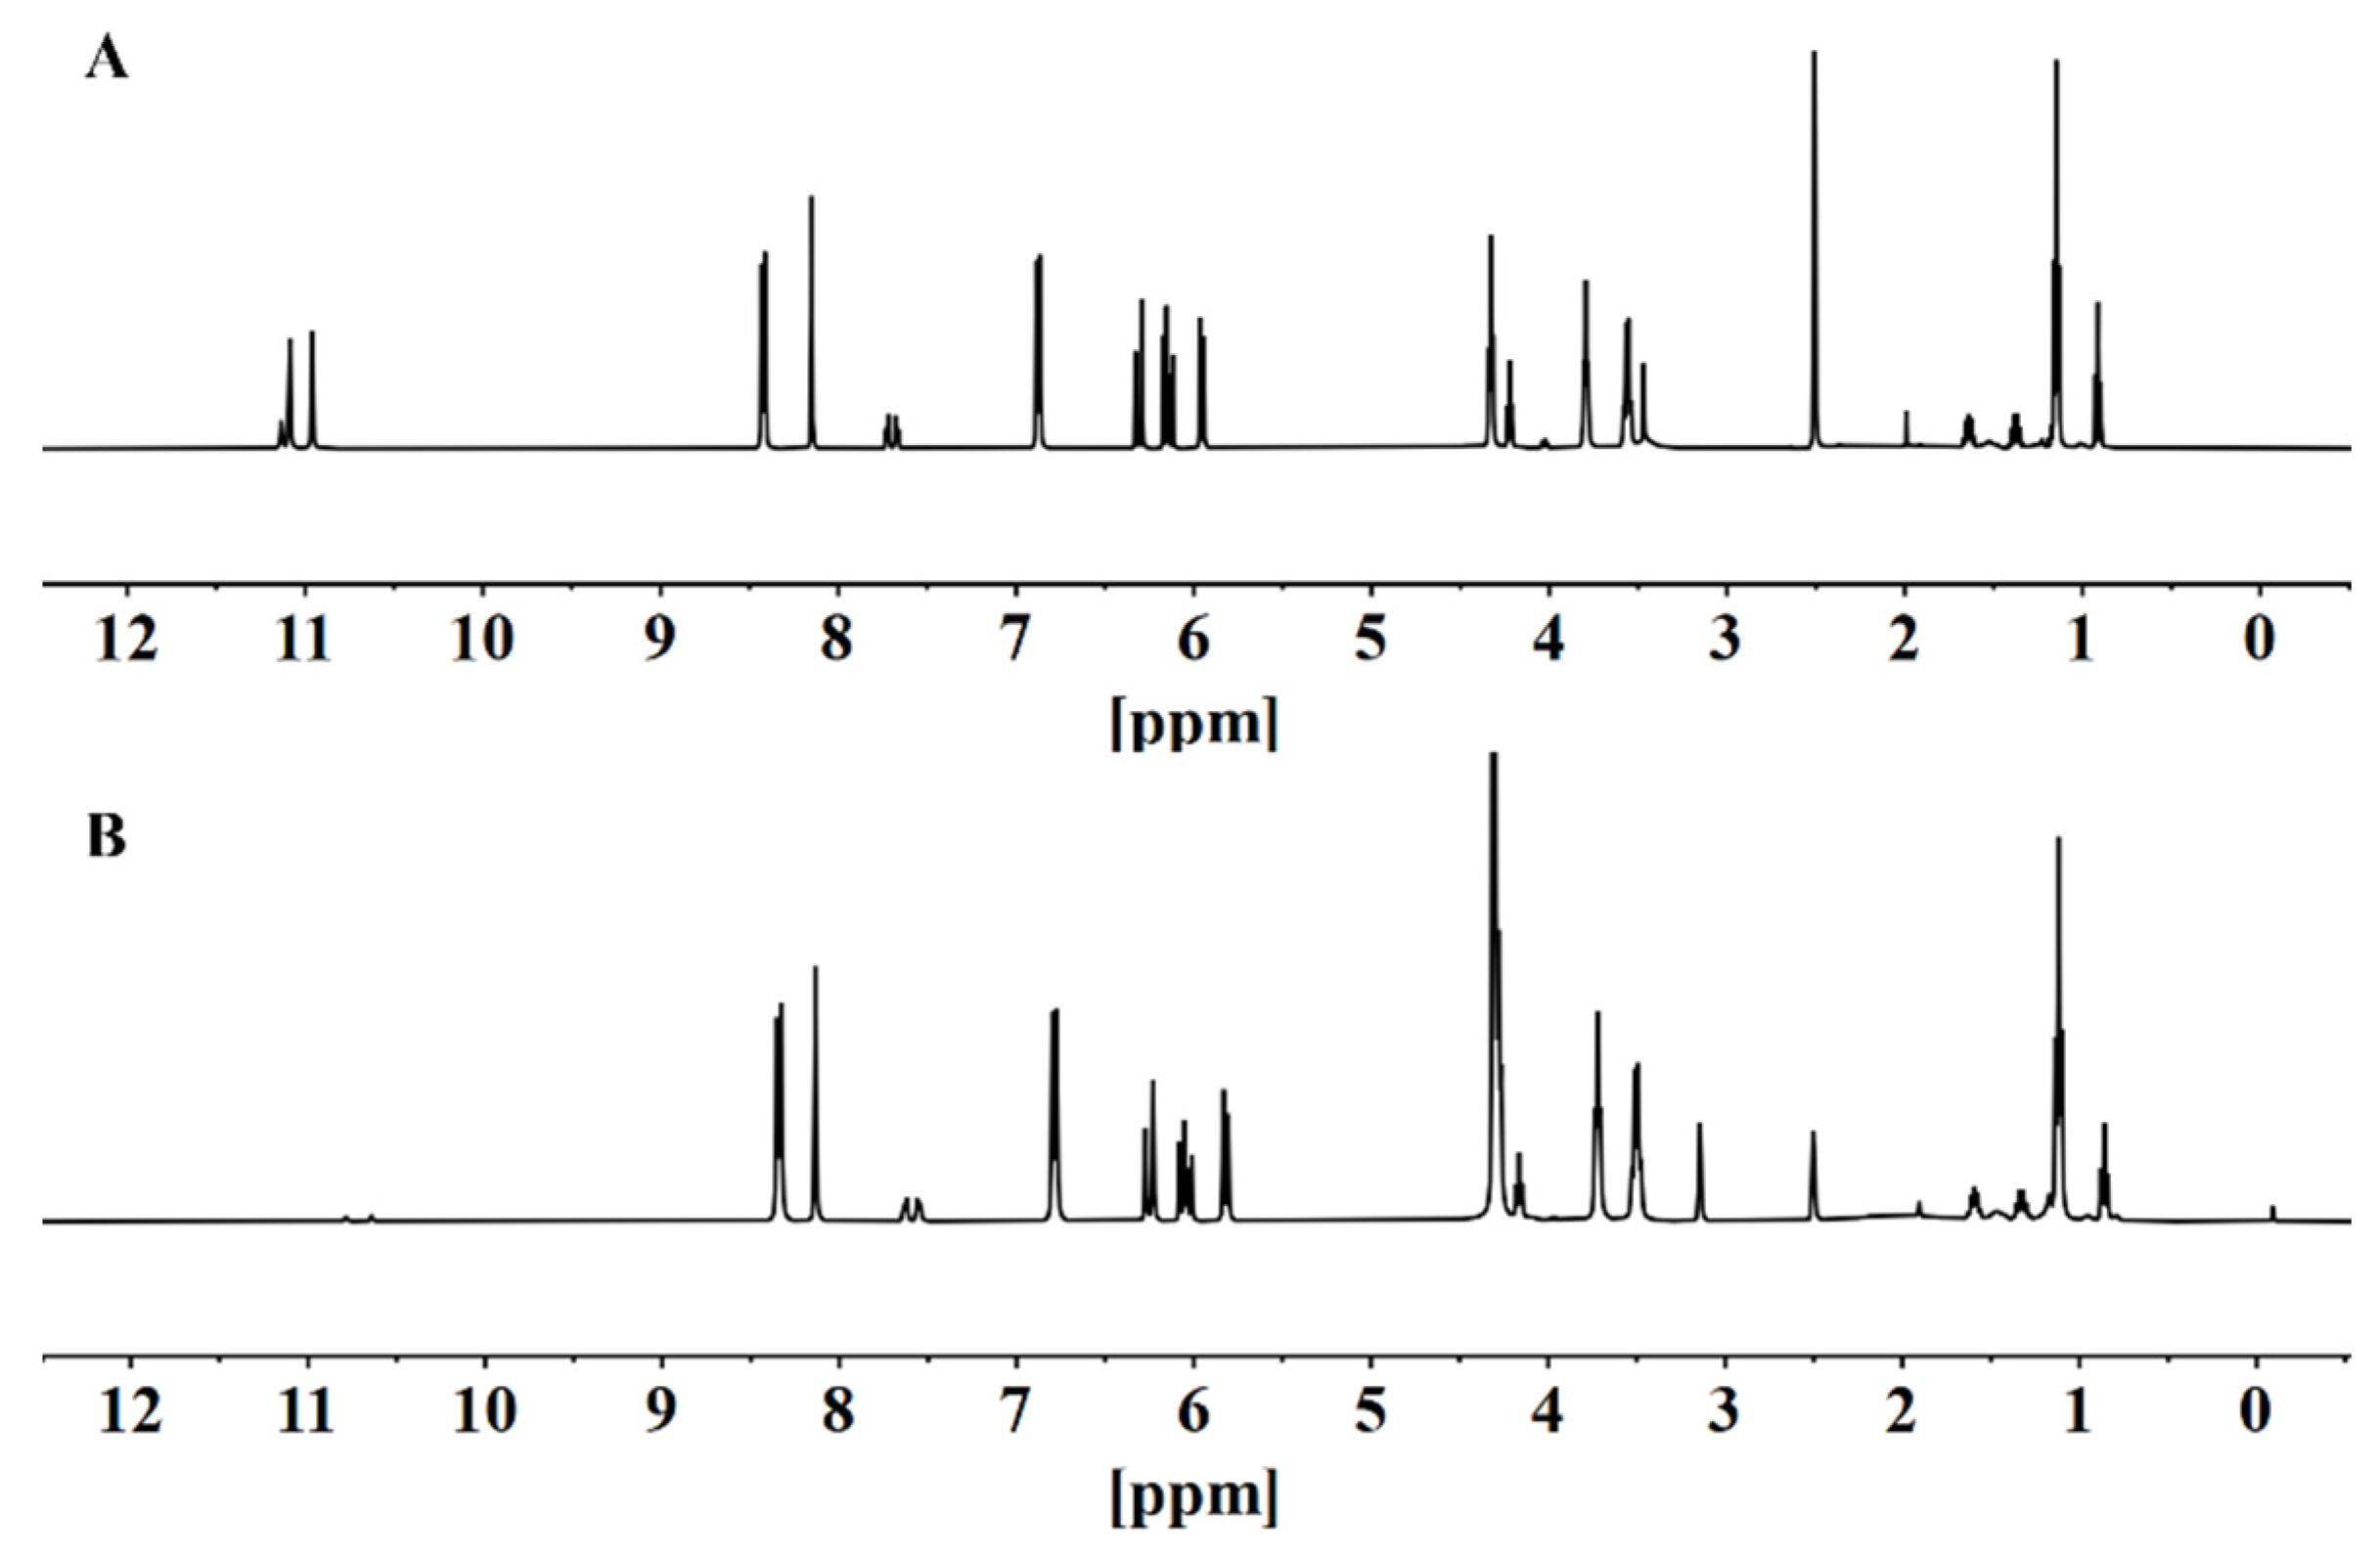
Figure 13.
(A) Fluorescence pattern and (B) bar graph of mercury ion ([Hg2+] = 10 μM) detection in different types of water (λex = 450 nm, [BNEA] = 10 μM).
Figure 13.
(A) Fluorescence pattern and (B) bar graph of mercury ion ([Hg2+] = 10 μM) detection in different types of water (λex = 450 nm, [BNEA] = 10 μM).


Publisher’s Note: MDPI stays neutral with regard to jurisdictional claims in published maps and institutional affiliations. |
© 2022 by the authors. Licensee MDPI, Basel, Switzerland. This article is an open access article distributed under the terms and conditions of the Creative Commons Attribution (CC BY) license (https://creativecommons.org/licenses/by/4.0/).
Share and Cite
MDPI and ACS Style
Guo, X.; Gao, L.; Tao, F.; Wu, S.; Cui, Y. Mercury Ion Chemosensor Derived from Barbiturate Acid with Aggregation-Induced Emission Effect. Chemosensors 2022, 10, 422. https://doi.org/10.3390/chemosensors10100422
AMA Style
Guo X, Gao L, Tao F, Wu S, Cui Y. Mercury Ion Chemosensor Derived from Barbiturate Acid with Aggregation-Induced Emission Effect. Chemosensors. 2022; 10(10):422. https://doi.org/10.3390/chemosensors10100422
Chicago/Turabian StyleGuo, Xuezu, Lanlan Gao, Furong Tao, Shining Wu, and Yuezhi Cui. 2022. "Mercury Ion Chemosensor Derived from Barbiturate Acid with Aggregation-Induced Emission Effect" Chemosensors 10, no. 10: 422. https://doi.org/10.3390/chemosensors10100422
Note that from the first issue of 2016, this journal uses article numbers instead of page numbers. See further details here.