
Red-Emitting Polymerizable Guanidinium Dyes as Fluorescent Probes in Molecularly Imprinted Polymers for Glyphosate Detection


Abstract
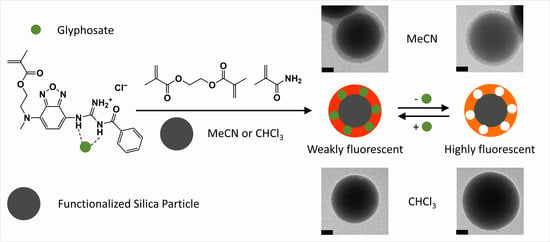
:
1. Introduction
2. Materials and Methods
2.1. Materials
2.2. Synthesis of Benzamido((7((2(methacrycrykoyloxy)ethyl)amino)benzo[c][1,2,5]-oxadiazol-4-yl)amino)methaniminium chloride (I)
2.3. Template Preparation with TBA-OH
2.4. MIP Synthesis in CHCl3 and MeCN
2.5. Instrumentation
2.6. Particle Characterization
3. Results
3.1. Interaction of I with GPS-TBA in CHCl3 and MeCN
3.2. Synthesis and Characterization of Molecularly Imprinted Polymer Particles
3.3. Comparison of Fluorescence Sensing Performance of MIP Particles in CHCl3 and MeCN
4. Discussion
5. Conclusions
6. Patents
Supplementary Materials
Author Contributions
Funding
Institutional Review Board Statement
Informed Consent Statement
Data Availability Statement
Acknowledgments
Conflicts of Interest
References
- Duke, S.O.; Powles, S.B. Glyphosate: A once-in-a-century herbicide. Pest Manag. Sci. 2008, 64, 319–325. [Google Scholar] [CrossRef] [PubMed]
- Hébert, M.-P.; Fugère, V.; Gonzalez, A. The overlooked impact of rising glyphosate use on phosphorus loading in agricultural watersheds. Front. Ecol. Environ. 2019, 17, 48–56. [Google Scholar] [CrossRef] [Green Version]
- Benbrook, C.M. Trends in glyphosate herbicide use in the United States and globally. Environ. Sci. Eur. 2016, 28, 3. [Google Scholar] [CrossRef] [PubMed] [Green Version]
- Tarazona, J.V.; Court-Marques, D.; Tiramani, M.; Reich, H.; Pfeil, R.; Istace, F.; Crivellente, F. Glyphosate toxicity and carcinogenicity: A review of the scientific basis of the European Union assessment and its differences with IARC. Arch. Toxicol. 2017, 91, 2723–2743. [Google Scholar] [CrossRef] [PubMed] [Green Version]
- Motta, E.V.S.; Raymann, K.; Moran, N.A. Glyphosate perturbs the gut microbiota of honey bees. Proc. Natl. Acad. Sci. USA 2018, 115, 10305–10310. [Google Scholar] [CrossRef] [Green Version]
- Iori, S.; Rovere, G.D.; Ezzat, L.; Smits, M.; Ferraresso, S.S.; Babbucci, M.; Marin, M.G.; Masiero, L.; Fabrello, J.; Garro, E.; et al. The effects of glyphosate and AMPA on the mediterranean mussel Mytilus galloprovincialis and its microbiota. Environ. Res. 2020, 182, 108984. [Google Scholar] [CrossRef]
- Aris, A.; Leblanc, S. Maternal and fetal exposure to pesticides associated to genetically modified foods in Eastern Townships of Quebec, Canada. Reprod. Toxicol. 2011, 31, 528–533. [Google Scholar] [CrossRef]
- Rahman, M.M.; Lee, D.J.; Jo, A.; Yun, S.H.; Eun, J.B.; Im, M.H.; Shim, J.H.; Abd El-Aty, A.M. Onsite/on-field analysis of pesticide and veterinary drug residues by a state-of-art technology: A review. J. Sep. Sci. 2021, 44, 2310–2327. [Google Scholar] [CrossRef] [PubMed]
- Liu, B.; Dong, L.; Yu, Q.; Li, X.; Wu, F.; Tan, Z.; Luo, S. Thermodynamic Study on the Protonation Reactions of Glyphosate in Aqueous Solution: Potentiometry, Calorimetry and NMR spectroscopy. J. Phys. Chem. B 2016, 120, 2132–2137. [Google Scholar] [CrossRef]
- Huhn, C. More and enhanced glyphosate analysis is needed. Anal. Bioanal. Chem. 2018, 410, 3041–3045. [Google Scholar] [CrossRef] [PubMed]
- Okada, E.; Coggan, T.; Anumol, T.; Clarke, B.; Allinson, G. A simple and rapid direct injection method for the determination of glyphosate and AMPA in environmental water samples. Anal. Bioanal. Chem. 2019, 411, 715–724. [Google Scholar] [CrossRef]
- Pinto, E.; Soares, A.G.; Ferreira, I.M.P.L.V.O. Quantitative analysis of glyphosate, glufosinate and AMPA in irrigation water by in situ derivatization–dispersive liquid–liquid microextraction combined with UPLC-MS/MS. Anal. Methods 2018, 10, 554–561. [Google Scholar] [CrossRef]
- Prasad, B.B.; Jauhari, D.; Tiwari, M.P. Doubly imprinted polymer nanofilm-modified electrochemical sensor for ultra-trace simultaneous analysis of glyphosate and glufosinate. Biosens. Bioelectron. 2014, 59, 81–88. [Google Scholar] [CrossRef] [PubMed]
- Minami, T.; Liu, Y.; Akdeniz, A.; Koutnik, P.; Esipenko, N.A.; Nishiyabu, R.; Kubo, Y.; Anzenbacher, P. Intramolecular Indicator Displacement Assay for Anions: Supramolecular Sensor for Glyphosate. J. Am. Chem. Soc. 2014, 136, 11396–11401. [Google Scholar] [CrossRef] [PubMed]
- Bera, M.K.; Mohapatra, S. Ultrasensitive detection of glyphosate through effective photoelectron transfer between CdTe and chitosan derived carbon dot. Colloids Surf. A 2020, 596, 124710. [Google Scholar] [CrossRef]
- Wang, L.; Bi, Y.; Gao, J.; Li, Y.; Ding, H.; Ding, L. Carbon dots based turn-on fluorescent probes for the sensitive determination of glyphosate in environmental water samples. RSC Adv. 2016, 6, 85820–85828. [Google Scholar] [CrossRef]
- Wang, D.; Lin, B.; Cao, Y.; Guo, M.; Yu, Y. A Highly Selective and Sensitive Fluorescence Detection Method of Glyphosate Based on an Immune Reaction Strategy of Carbon Dot Labeled Antibody and Antigen Magnetic Beads. J. Agric. Food Chem. 2016, 64, 6042–6050. [Google Scholar] [CrossRef] [PubMed]
- Wang, L.; Bi, Y.; Hou, J.; Li, H.; Xu, Y.; Wang, B.; Ding, H.; Ding, L. Facile, green and clean one-step synthesis of carbon dots from wool: Application as a sensor for glyphosate detection based on the inner filter effect. Talanta 2016, 160, 268–275. [Google Scholar] [CrossRef] [PubMed]
- Wang, X.; Yang, Y.; Huo, D.; Ji, Z.; Ma, Y.; Yang, M.; Luo, H.; Luo, X.; Hou, C.; Lv, J. A turn-on fluorescent nanoprobe based on N-doped silicon quantum dots for rapid determination of glyphosate. Microchim. Acta 2020, 187, 341. [Google Scholar] [CrossRef] [PubMed]
- Sawetwong, P.; Chairam, S.; Jarujamrus, P.; Amatatongchai, M. Enhanced selectivity and sensitivity for colorimetric determination of glyphosate using Mn–ZnS quantum dot embedded molecularly imprinted polymers combined with a 3D-microfluidic paper-based analytical device. Talanta 2021, 225, 122077. [Google Scholar] [CrossRef] [PubMed]
- Dasary, S.S.R.; Rai, U.S.; Yu, H.; Anjaneyulu, Y.; Dubey, M.; Ray, P.C. Gold nanoparticle based surface enhanced fluorescence for detection of organophosphorus agents. Chem. Phys. Lett. 2008, 460, 187–190. [Google Scholar] [CrossRef] [Green Version]
- Lee, H.U.; Shin, H.Y.; Lee, J.Y.; Song, Y.S.; Park, C.; Kim, S.W. Quantitative Detection of Glyphosate by Simultaneous Analysis of UV Spectroscopy and Fluorescence Using DNA-Labeled Gold Nanoparticles. J. Agric. Food Chem. 2010, 58, 12096–12100. [Google Scholar] [CrossRef] [PubMed]
- Li, H.; Chen, H.; Li, M.; Lu, Q.; Zhang, Y.; Yao, S. Template protection of gold nanoclusters for the detection of organophosphorus pesticides. New J. Chem. 2019, 43, 5423–5428. [Google Scholar] [CrossRef]
- Cai, Y.; Zhu, H.; Zhou, W.; Qiu, Z.; Chen, C.; Qileng, A.; Li, K.; Liu, Y. Capsulation of AuNCs with AIE Effect into Metal–Organic Framework for the Marriage of a Fluorescence and Colorimetric Biosensor to Detect Organophosphorus Pesticides. Anal. Chem. 2021, 93, 7275–7282. [Google Scholar] [CrossRef]
- Lee, H.U.; Jung, D.U.; Lee, J.H.; Song, Y.S.; Park, C.; Kim, S.W. Detection of glyphosate by quantitative analysis of fluorescence and single DNA using DNA-labeled fluorescent magnetic core–shell nanoparticles. Sens. Actuators, B 2013, 177, 879–886. [Google Scholar] [CrossRef]
- Wang, M.; Ye, H.; You, L.; Chen, X. A Supramolecular Sensor Array Using Lanthanide-Doped Nanoparticles for Sensitive Detection of Glyphosate and Proteins. ACS Appl. Mater. Interfaces 2016, 8, 574–581. [Google Scholar] [CrossRef] [PubMed]
- Rawat, K.A.; Majithiya, R.P.; Rohit, J.V.; Basu, H.; Singhal, R.K.; Kailasa, S.K. Mg2+ ion as a tuner for colorimetric sensing of glyphosate with improved sensitivity via the aggregation of 2-mercapto-5-nitrobenzimidazole capped silver nanoparticles. RSC Adv. 2016, 6, 47741–47752. [Google Scholar] [CrossRef]
- Wu, D.; Sedgwick, A.C.; Gunnlaugsson, T.; Akkaya, E.U.; Yoon, J.; James, T.D. Fluorescent chemosensors: The past, present and future. Chem. Soc. Rev. 2017, 46, 7105–7123. [Google Scholar] [CrossRef] [PubMed] [Green Version]
- Fu, Y.; Finney, N.S. Small-molecule fluorescent probes and their design. RSC Adv. 2018, 8, 29051–29061. [Google Scholar] [CrossRef] [Green Version]
- Pouessel, J.; Abada, S.; Le Bris, N.; Elhabiri, M.; Charbonnière, L.J.; Tripier, R. A new bis-tetraamine ligand with a chromophoric 4-(9-anthracenyl)-2,6-dimethylpyridinyl linker for glyphosate and ATP sensing. Dalton Trans. 2013, 42, 4859–4872. [Google Scholar] [CrossRef]
- Jenkins, A.L.; Yin, R.; Jensen, J.L. Molecularly imprinted polymer sensors for pesticide and insecticide detection in water. Analyst 2001, 126, 798–802. [Google Scholar] [CrossRef] [PubMed]
- Guan, J.; Yang, J.; Zhang, Y.; Zhang, X.; Deng, H.; Xu, J.; Wang, J.; Yuan, M.-S. Employing a fluorescent and colorimetric picolyl-functionalized rhodamine for the detection of glyphosate pesticide. Talanta 2021, 224, 121834. [Google Scholar] [CrossRef] [PubMed]
- Spangler, C.; Schaeferling, M.; Wolfbeis, O.S. Fluorescent probes for microdetermination of inorganic phosphates and biophosphates. Microchim. Acta 2008, 161, 1–39. [Google Scholar] [CrossRef]
- McNaughton, D.A.; Fares, M.; Picci, G.; Gale, P.A.; Caltagirone, C. Advances in fluorescent and colorimetric sensors for anionic species. Coord. Chem. Rev. 2021, 427. [Google Scholar] [CrossRef]
- Kubik, S. Anion recognition in water. Chem. Soc. Rev. 2010, 39, 3648–3663. [Google Scholar] [CrossRef] [PubMed]
- Fitzmaurice, R.J.; Gaggini, F.; Srinivasan, N.; Kilburn, J.D. Carboxylate binding in polar solvents using pyridylguanidinium salts. Org. Biomol. Chem. 2007, 5, 1706–1714. [Google Scholar] [CrossRef] [PubMed]
- Schmuck, C. Carboxylate Binding by 2-(Guanidiniocarbonyl)pyrrole Receptors in Aqueous Solvents: Improving the Binding Properties of Guanidinium Cations through Additional Hydrogen Bonds. Chem. Eur. J. 2000, 6, 709–718. [Google Scholar] [CrossRef]
- Jiménez Blanco, J.L.; Bootello, P.; Benito, J.M.; Ortiz Mellet, C.; García Fernández, J.M. Urea-, Thiourea-, and Guanidine-Linked Glycooligomers as Phosphate Binders in Water. J. Org. Chem. 2006, 71, 5136–5143. [Google Scholar] [CrossRef] [PubMed]
- Wan, W.; Wagner, S.; Rurack, K. Fluorescent monomers: “bricks” that make a molecularly imprinted polymer “bright”. Anal. Bioanal. Chem. 2016, 408, 1753–1771. [Google Scholar] [CrossRef] [PubMed]
- Gawlitza, K.; Wan, W.; Wagner, S.; Rurack, K. Fluorescent Molecularly Imprinted Polymers. In Advanced Molecularly Imprinting Materials; Tiwari, A., Uzun, L., Eds.; Wiley-Scrivener: Beverly, MA, USA, 2017; pp. 89–128. [Google Scholar] [CrossRef]
- Puzio, K.; Claude, B.; Amalric, L.; Berho, C.; Grellet, E.; Bayoudh, S.; Nehmé, R.; Morin, P. Molecularly imprinted polymer dedicated to the extraction of glyphosate in natural waters. J. Chromatogr. A 2014, 1361, 1–8. [Google Scholar] [CrossRef] [PubMed]
- Berho, C.; Claude, B.; Coisy, E.; Togola, A.; Bayoudh, S.; Morin, P.; Amalric, L. Laboratory calibration of a POCIS-like sampler based on molecularly imprinted polymers for glyphosate and AMPA sampling in water. Anal. Bioanal. Chem. 2017, 409, 2029–2035. [Google Scholar] [CrossRef] [PubMed]
- Zhang, C.; She, Y.; Li, T.; Zhao, F.; Jin, M.; Guo, Y.; Zheng, L.; Wang, S.; Jin, F.; Shao, H.; et al. A highly selective electrochemical sensor based on molecularly imprinted polypyrrole-modified gold electrode for the determination of glyphosate in cucumber and tap water. Anal. Bioanal. Chem. 2017, 409, 7133–7144. [Google Scholar] [CrossRef] [PubMed]
- Zouaoui, F.; Bourouina-Bacha, S.; Bourouina, M.; Abroa-Nemeir, I.; Ben Halima, H.; Gallardo-Gonzalez, J.; El Alami El Hassani, N.; Alcacer, A.; Bausells, J.; Jaffrezic-Renault, N.; et al. Electrochemical impedance spectroscopy determination of glyphosate using a molecularly imprinted chitosan. Sens. Actuators, B 2020, 309, 127753. [Google Scholar] [CrossRef]
- Valderrey, V.; Gawlitza, K.; Rurack, K. Thiourea- and Amino-substituted Benzoxadiazole Dyes with Large Stokes Shifts as Red-emitting Probe Monomers for Imprinted Polymer Layers Targeting Carboxylate-containing Antibiotics. Chem. Eur. J. 2022, 28. [Google Scholar] [CrossRef] [PubMed]
- Wan, W.; Descalzo, A.B.; Shinde, S.; Weißhoff, H.; Orellana, G.; Sellergren, B.; Rurack, K. Ratiometric Fluorescence Detection of Phosphorylated Amino Acids Through Excited-State Proton Transfer by Using Molecularly Imprinted Polymer (MIP) Recognition Nanolayers. Chem. Eur. J. 2017, 23, 15974–15983. [Google Scholar] [CrossRef] [PubMed]
- Schneider, C.A.; Rasband, W.S.; Eliceiri, K.W. NIH Image to ImageJ: 25 years of image analysis. Nat. Methods 2012, 9, 671–675. [Google Scholar] [CrossRef] [PubMed]
- Wan, W.; Biyikal, M.; Wagner, R.; Sellergren, B.; Rurack, K. Fluorescent Sensory Microparticles that “Light-up” Consisting of a Silica Core and a Molecularly Imprinted Polymer (MIP) Shell. Angew. Chem. Int. Ed. 2013, 52, 7023–7027. [Google Scholar] [CrossRef]
- Horváth, P.; Šebej, P.; Šolomek, T.; Klán, P. Small-Molecule Fluorophores with Large Stokes Shifts: 9-Iminopyronin Analogues as Clickable Tags. J. Org. Chem. 2015, 80, 1299–1311. [Google Scholar] [CrossRef]
- Lakowicz, J.R. Conversion Between Wavelength and Wavenumber. In Principles of Fluorescence Spectroscopy, 3rd ed.; Springer: Singapore, 2006; Chapter 2.9.4; pp. 53–54. [Google Scholar]
- Blondeau, P.; Segura, M.; Pérez-Fernández, R.; de Mendoza, J. Molecular recognition of oxoanions based on guanidinium receptors. Chem. Soc. Rev. 2007, 36, 198–210. [Google Scholar] [CrossRef] [PubMed]
- Dietrich, B.; Fyles, T.M.; Lehn, J.-M.; Pease, L.G.; Fyles, D.L. Anion receptor molecules. Synthesis and some anion binding properties of macrocyclic guanidinium salts. J. Chem. Soc. Chem. Commun. 1978, 934–936. [Google Scholar] [CrossRef]
- Houk, R.J.T.; Tobey, S.L.; Anslyn, E.V. Abiotic Guanidinium Receptors for Anion Molecular Recognition and Sensing. In Anion Sensing; Stibor, I., Ed.; Springer: Berlin/Heidelberg, Germany, 2005; pp. 199–229. [Google Scholar] [CrossRef]
- Tobey, S.L.; Anslyn, E.V. Energetics of Phosphate Binding to Ammonium and Guanidinium Containing Metallo-Receptors in Water. J. Am. Chem. Soc. 2003, 125, 14807–14815. [Google Scholar] [CrossRef] [PubMed]
- Peixoto, M.M.; Bauerfeldt, G.F.; Herbst, M.H.; Pereira, M.S.; da Silva, C.O. Study of the Stepwise Deprotonation Reactions of Glyphosate and the Corresponding pKa Values in Aqueous Solution. J. Phys. Chem. A 2015, 119, 5241–5249. [Google Scholar] [CrossRef] [PubMed]
- Brynn Hibbert, D.; Thordarson, P. The death of the Job plot, transparency, open science and online tools, uncertainty estimation methods and other developments in supramolecular chemistry data analysis. Chem. Commun. 2016, 52, 12792–12805. [Google Scholar] [CrossRef] [Green Version]
- Rurack, K.; Radeglia, R. Transition Metal Ion Complexes of 2,2′-Bipyridyl-3,3′-diol and 2,2′-Bipyridyl-3-ol: Spectroscopic Properties and Solvent-Dependent Binding Modes. Eur. J. Inorg. Chem. 2000, 2000, 2271–2282. [Google Scholar] [CrossRef]
- Thordarson, P. Determining association constants from titration experiments in supramolecular chemistry. Chem. Soc. Rev. 2011, 40, 1305–1323. [Google Scholar] [CrossRef] [PubMed]
- Wulff, G.; Knorr, K. Stoichiometric noncovalent interaction in molecular imprinting. Bioseparation 2001, 10, 257–276. [Google Scholar] [CrossRef] [PubMed]
- Wagner, S.; Bell, J.; Biyikal, M.; Gawlitza, K.; Rurack, K. Integrating fluorescent molecularly imprinted polymer (MIP) sensor particles with a modular microfluidic platform for nanomolar small-molecule detection directly in aqueous samples. Biosens. Bioelectron. 2018, 99, 244–250. [Google Scholar] [CrossRef] [PubMed]
- Kimani, M.; Beyer, S.; El-Schich, Z.; Gawlitza, K.; Gjörloff-Wingren, A.; Rurack, K. Imprinted Particles for Direct Fluorescence Detection of Sialic Acid in Polar Media and on Cancer Cells with Enhanced Control of Nonspecific Binding. ACS Appl. Polym. Mater. 2021, 3, 2363–2373. [Google Scholar] [CrossRef]
- Chadha, R.N.; Shukla, J.S.; Misra, G.S. Studies in chain-transfer. Part 2.—Catalyzed polymerization of methyl methacrylate. Trans. Faraday Soc. 1957, 53, 240–246. [Google Scholar] [CrossRef]
- Tsujii, Y.; Ejaz, M.; Sato, K.; Goto, A.; Fukuda, T. Mechanism and Kinetics of RAFT-Mediated Graft Polymerization of Styrene on a Solid Surface. 1. Experimental Evidence of Surface Radical Migration. Macromolecules 2001, 34, 8872–8878. [Google Scholar] [CrossRef]
- di Nunzio, M.R.; Perenlei, G.; Douhal, A. Confinement Effect of Micro- and Mesoporous Materials on the Spectroscopy and Dynamics of a Stilbene Derivative Dye. Int. J. Mol. Sci. 2019, 20, 1316. [Google Scholar] [CrossRef] [PubMed] [Green Version]
- Armbruster, D.A.; Pry, T. Limit of blank, limit of detection and limit of quantitation. Clin. Biochem. Rev. 2008, 29 (Suppl. 1), S49–S52. [Google Scholar]
- Evaluation of Measurement Data—Guide to the Expression of Uncertainty in Measurement. JCGM 100:2008. Joint Committee for Guides in Metrology (JCGM), 2008; p. 134. Available online: https://www.bipm.org/documents/20126/2071204/JCGM_100_2008_E.pdf/cb0ef43f-baa5-11cf-3f85-4dcd86f77bd6 (accessed on 25 October 2021).
- Rurack, K.; Spieles, M. Fluorescence Quantum Yields of a Series of Red and Near-Infrared Dyes Emitting at 600−1000 nm. Anal. Chem. 2011, 83, 1232–1242. [Google Scholar] [CrossRef] [PubMed]
- Glyphosate and AMPA in Drinking Water. World Health Organization, 2005. Available online: https://www.who.int/water_sanitation_health/dwq/chemicals/glyphosateampa290605.pdf (accessed on 25 October 2021).


| Sample | ||
|---|---|---|
| MIPa@SiO2 | 5.0 | 3.5 |
| dNIPa@SiO2 | 5.0 | 3.5 |
| MIPb@SiO2 | 3.0 | 2.0 |
| dNIPb@SiO2 | 3.5 | 2.5 |
| Sample | Polymer Shell Thickness (nm) | Incorporated Dye (µmol g−1 of Particles) |
|---|---|---|
| MIPa@SiO2 | 2.7 ± 1.3 | 1.16 ± 0.03 |
| dNIPa@SiO2 | 2.3 ± 0.9 | 1.17 ± 0.03 |
| MIPb@SiO2 | 36.6 ± 10.3 | 6.33 ± 0.04 |
| dNIPb@SiO2 | 38.1 ± 17.4 | 6.14 ± 0.30 |
Publisher’s Note: MDPI stays neutral with regard to jurisdictional claims in published maps and institutional affiliations. |
© 2022 by the authors. Licensee MDPI, Basel, Switzerland. This article is an open access article distributed under the terms and conditions of the Creative Commons Attribution (CC BY) license (https://creativecommons.org/licenses/by/4.0/).
Share and Cite
Kimani, M.; Pérez-Padilla, V.; Valderrey, V.; Gawlitza, K.; Rurack, K. Red-Emitting Polymerizable Guanidinium Dyes as Fluorescent Probes in Molecularly Imprinted Polymers for Glyphosate Detection. Chemosensors 2022, 10, 99. https://doi.org/10.3390/chemosensors10030099
Kimani M, Pérez-Padilla V, Valderrey V, Gawlitza K, Rurack K. Red-Emitting Polymerizable Guanidinium Dyes as Fluorescent Probes in Molecularly Imprinted Polymers for Glyphosate Detection. Chemosensors. 2022; 10(3):99. https://doi.org/10.3390/chemosensors10030099
Chicago/Turabian StyleKimani, Martha, Víctor Pérez-Padilla, Virginia Valderrey, Kornelia Gawlitza, and Knut Rurack. 2022. "Red-Emitting Polymerizable Guanidinium Dyes as Fluorescent Probes in Molecularly Imprinted Polymers for Glyphosate Detection" Chemosensors 10, no. 3: 99. https://doi.org/10.3390/chemosensors10030099