Article

Design and Evaluation of Low-Power Co3O4 Gas Sensing Element as a Part of Cyber Physical Systems

by
Marilena Moschogiannaki
1,2,†,
George Vardakis
3,4,†,
Emmanouil Gagaoudakis
2,
Stefanos Papadakis
4 and
Vassilios Binas
2,5,*
1
Department of Materials Science and Technology, University of Crete, 71100 Herakleion, Greece
2
Institute of Electronic Structure and Laser, Foundation for Research and Technology-Hellas (FORTH-IESL), 71100 Heraklion, Greece
3
Computer Science Department, University of Crete, 71100 Herakleion, Greece
4
Institute of Computer Science, Foundation for Research and Technology Hellas, 71100 Heraklion, Greece
5
Department of Physics, University of Crete, 71100 Herakleion, Greece
*
Author to whom correspondence should be addressed.
These authors contributed equally to this work.
Chemosensors 2022, 10(7), 266; https://doi.org/10.3390/chemosensors10070266
Submission received: 4 May 2022 / Revised: 26 June 2022 / Accepted: 4 July 2022 / Published: 8 July 2022
(This article belongs to the Special Issue Nanomaterials Based on Bio/Chemical Sensors)

Abstract

:
Physical processes working in parallel with digital ones have transformed the way we view systems and have led to the creation of applications that boost the quality of people’s lives, increase security as well as decrease production costs of goods. Critical to this evolution is the cost decrease in the components of such systems, among which are gas sensors. In this work, a custom-made Co3O4 gas sensing element is presented, which can potentially be used as part of a cyber-physical system (CPS) for O3 monitoring. To investigate its performance, a CPS is developed using low-cost, low-power micro-controller units (MCUs) and comparisons both with the laboratory equipment and commercial off-the-shelf (COTS) ozone sensors are provided. The experiments show that the Co3O4 sensor works at room temperature with low input voltage and low power consumption when used with the proposed MCUs. Moreover, an enhanced gas sensing performance against ozone is observed under low-pressure conditions due to the detection of low ozone concentrations (85.90 ppb) and good sensor response (113.1%) towards 1100 ppb O3. However, the drawbacks that need improvement relate to the kinetics of the charge carriers, which affect the response time and recovery behavior. The effect of humidity needs to be clarified in further works.

1. Introduction

Cyber-physical systems (CPS) is the term used to describe a wide range of systems that seamlessly combine physical processes with computational resources such as embedded systems and networks [1]. They are a key component of the well-established Internet of Things (IoT) as well as of the next industrial revolution, also known as Industry 4.0. In this new paradigm, intelligent inter-connected machines and equipment contribute to unprecedented levels of productivity, security and ultimately lower costs [2].
The realization of such systems largely owes to the proliferation of sensors of all types, which also made them affordable for large scale deployments. One such family of sensors are gas sensors. Previously, only bulky industrial grade gas sensors could be found on the market, however, nowadays, advances in gas sensing technology and materials have sparked the creation of low-cost, low-power, small form factor sensors. Use cases include systems applied in smart cities for the purpose of gas pollution monitoring for health reasons, or in factories for gas-leak detection for safety reasons [3].
These sensors in tandem with low-power microcontroller units and communication modules make for a fully autonomous, affordable and highly durable CPS for massive use in IoT and Industry 4.0 deployments. T. Jarvinen et al. design, develop and test a CPS capable of versatile gas sensor measurement, utilizing an Arduino board and a Raspberry Pi single board computer. The sensor consisted of tungsten oxide as a gas sensing element and the tested gas was a mixture of air and hydrogen [4]. Moreover, there are various projects based on commercial Winsen gas sensors, namely the MQ-2, MQ-4, MQ-6 and MQ-8—with tin oxide as their sensing material—combined with the Arduino UNO board, which monitors gases such as smoke [5], carbon monoxide [6], LPG gas [7,8] and methane used as cooking gas [9]. To the best of our knowledge, this is the first study focused on the extensive evaluation and validation of different CPS for gas sensing applications based on an in-house-made metal oxide gas sensor, and the very first study that utilizes a STM32 Nucleo development board, which offers increased resolution characteristics compared to the Arduino UNO board.
It is well known that ozone (O3) is an important air pollutant, most commonly found in photochemical smog, and is highly toxic when its concentration in the air exceeds 1 ppm. Ozone at concentrations higher than 50 ppm presents risks to life, and when higher than 1000 ppm, it causes death in a short time. In addition, ozone is a strong oxidizing gas finding applications in a variety of fields from water purification and food processing to pharmaceutical processes and technology [10,11]. However, the level of its concentration should not exceed a threshold limit value since it plays a vital role in human health. Thus, ozone sensors are crucial for our well-being in modern life, providing us with information for health protection in future smart cities.
The use of metal oxide semiconductors as sensing elements for monitoring air quality has emerged as a low-cost alternative due to fast response/recovery rates and low detection limits. In particular, Co3O4 is a well-known p-type metal oxide semiconductor, with a spinel crystal structure (AB2O4) where Co2+ are in tetrahedral sites and Co3+ in octahedral sites. This variety of valence states and active sites leads to a high sensor response or even selective properties [12]. Its sensing properties— with a combination of other MOS materials—have been investigated towards reducing gases such as ethanol, acetone and hydrogen [13,14,15,16,17], as well as towards oxidizing gases such as nitrogen oxide and ozone [18,19,20,21]. Specifically, L. Liu et al. prepared mesoporous Co3O4 nanobricks by a hydrothermal corrosion method and reported its highest response to be 100 ppm ozone at 85 °C [18]. Meanwhile, T. Li et al. synthesized Co3O4 nanobricks by the same method, which exhibited 125 towards 100 ppm ozone at 85 °C [21].
In this work, the design as well as the evaluation of a low-cost gas sensing CPS for ozone monitoring, integrating an in-house-made Co3O4 sensing element and two widely used single-board Microcontroller Units (MCU), are presented. For validation purposes, experiments were also conducted using the laboratory equipment. Both board setups are low power, while the MCUs show reliable characteristics such as low ozone detection, low ozone resolution and good sensitivity. Their performance is also compared against commercial off-the-shelf (COTS) sensors. The conducted experiments indicate competitive and sometimes even better performance than that of the COTS sensors.

2. Design and Evaluation of CPS

2.1. Preparation of Co3O4 Powder and Sensing Film

All the chemicals used in this work were of analytical grade and were used without further purification. A thermal treatment was followed and 4 g Cobalt (II) acetate tetrahydrate (Sigma-Aldrich, St. Louis, MO, USA, 99.995% trace metals basis) was calcined at 600 °C for 2 h in air (heat rate 5 °C/min) to obtain ~2 g spherical Co3O4 nanoparticles. The color of the final Co3O4 powder was black.
The Co3O4 nanoparticles (40 mg) were mixed into an organic paste consisting of ethyl cellulose (Adrich, Pittsburgh, PA, USA, 7–15 mPa·s, 6% in toluene/ethanol 80:20, 48.0–49.5% (w/w) ethoxyl basis) and a-terpineol (Aldrich, 90%) as binder and solvent, respectively. They were ground in a mortar for 30 min to form a homogeneous paste for spin coating. The paste was spin-coated at 700 rpm for 10 s and at 3000 rpm for 30 s to form a sensing film on commercial glass substrate (22.8 × 7.6 × 0.4 mm3) equipped with interdigitated Pt electrodes. The substrate was purchased and pre-patterned from Metrohm DropSens and was composed of two platinum interdigitated electrodes with two connection tracks, on a glass substrate. The space between the interdigitated electrodes was 5 μm. Finally, the film was annealed in an oven at 450 °C for 2 h with a heating rate of 2 °C/min for the binder to be removed. The sensor was fabricated using the Co3O4 powder.

2.2. Characterization of Materials

The X-ray diffraction patterns of both the powder and film were obtained by a Bruker AXS D8 Advance copper anode diffractometer (CuKα radiation) equipped with a Nickel foil monochromator operated at 40 kV and 40 mA, over the 2θ collection range from 10° to 70°. The scan rate was 0.05° s−1. The morphological and elementary analyses were performed using scanning electron microscopy (SEM) with energy dispersive X-ray spectroscopy, which is an X-ray technique used to identify the elemental composition of materials, using a JEOL JSM-7000F scanning electron microscope.

2.3. Gas Sensing Measurements

The experimental setup consisted of two parts as shown in Figure 1. The first part is the gas sensing section, which includes a synthetic air bottle (99.999% O2 + Ν2), an O3 analyzer (Model 49i by Thermo Electron Corporation, Waltham, MA, USA), two mass flow controllers (MFC, Mykrolis Tylan 2900 series), a custom-made sealed stainless-steel gas test chamber, a mechanical pump and a personal computer equipped with LabVIEW software. The second part is the measurement section, which includes the setup for monitoring the variations of electrical current caused by the interaction between the ozone gas and the Co3O4 sensing element. The gas sensing section remained the same throughout all measurement campaigns, while in the measurement section, the following three different set-ups were used: the first is the laboratory measurement setup consisting of a Keithley 6517A electrometer/high resistance meter, while the other two employed off-the-shelf single-board MCUs, as will be described below. The physical quantity that is monitored in all setups is the electrical current.
The gas sensing properties of the Co3O4 were investigated using a gas test chamber with an active volume of about 0.65 L, under dark conditions. A mechanical pump initially evacuated the chamber to a pressure of 10−2 mbar. The O3 analyzer was used to produce ozone gas of the desired concentration. All measurements were performed at room temperature (25 °C) and under ambient humidity of about 50% RH. The effect of humidity on gas sensor performance was not a parameter under examination in the present work, while it is well known that atmospheres with high concentrations of wet air negatively affect the response and response time of metal oxide ozone gas sensors [22,23].
The Co3O4 sensor was exposed to ozone gas of specific concentrations for 15 min at a constant flow of 500 sccm (standard cubic centimeters per minute), which was regulated by the mass flow controllers, while the pressure in the chamber was kept constant at 600 mbar, leading to an increase in electrical current. The recovery took place using synthetic air flux for 20 min at the same constant flow, leading to a decrease in electrical current. Current values are used as the signal output of the sensing measurements due to ease of comparison with other circuit values. The same Co3O4 sensor was used for all measurements, which were performed by the following three different experiment setups: (a) Laboratory, (b) Arduino UNO and (c) STM32 development board. The sensing measurements were conducted on 3 consecutive days initially and the same measurements were repeated after 3 months, in the same setup order, while the Co3O4 sensor was stored under ambient conditions (in air) during this period. The ozone concentrations that the sensor was exposed to were 2600, 1700, 1100, 250 and 120 ppb. The sensor response (SR) is defined as
SR =   I gas I air I air × 100 % ,
where Iair is the electrical current value after saturation in dry air and Igas is the electrical current value after saturation in the presence of the oxidizing gas [24]. The response time (tres) is defined as the time required until 90% of the maximum response signal is reached, while the recovery time (trec) denotes the time needed until 90% of the original baseline signal is recovered.

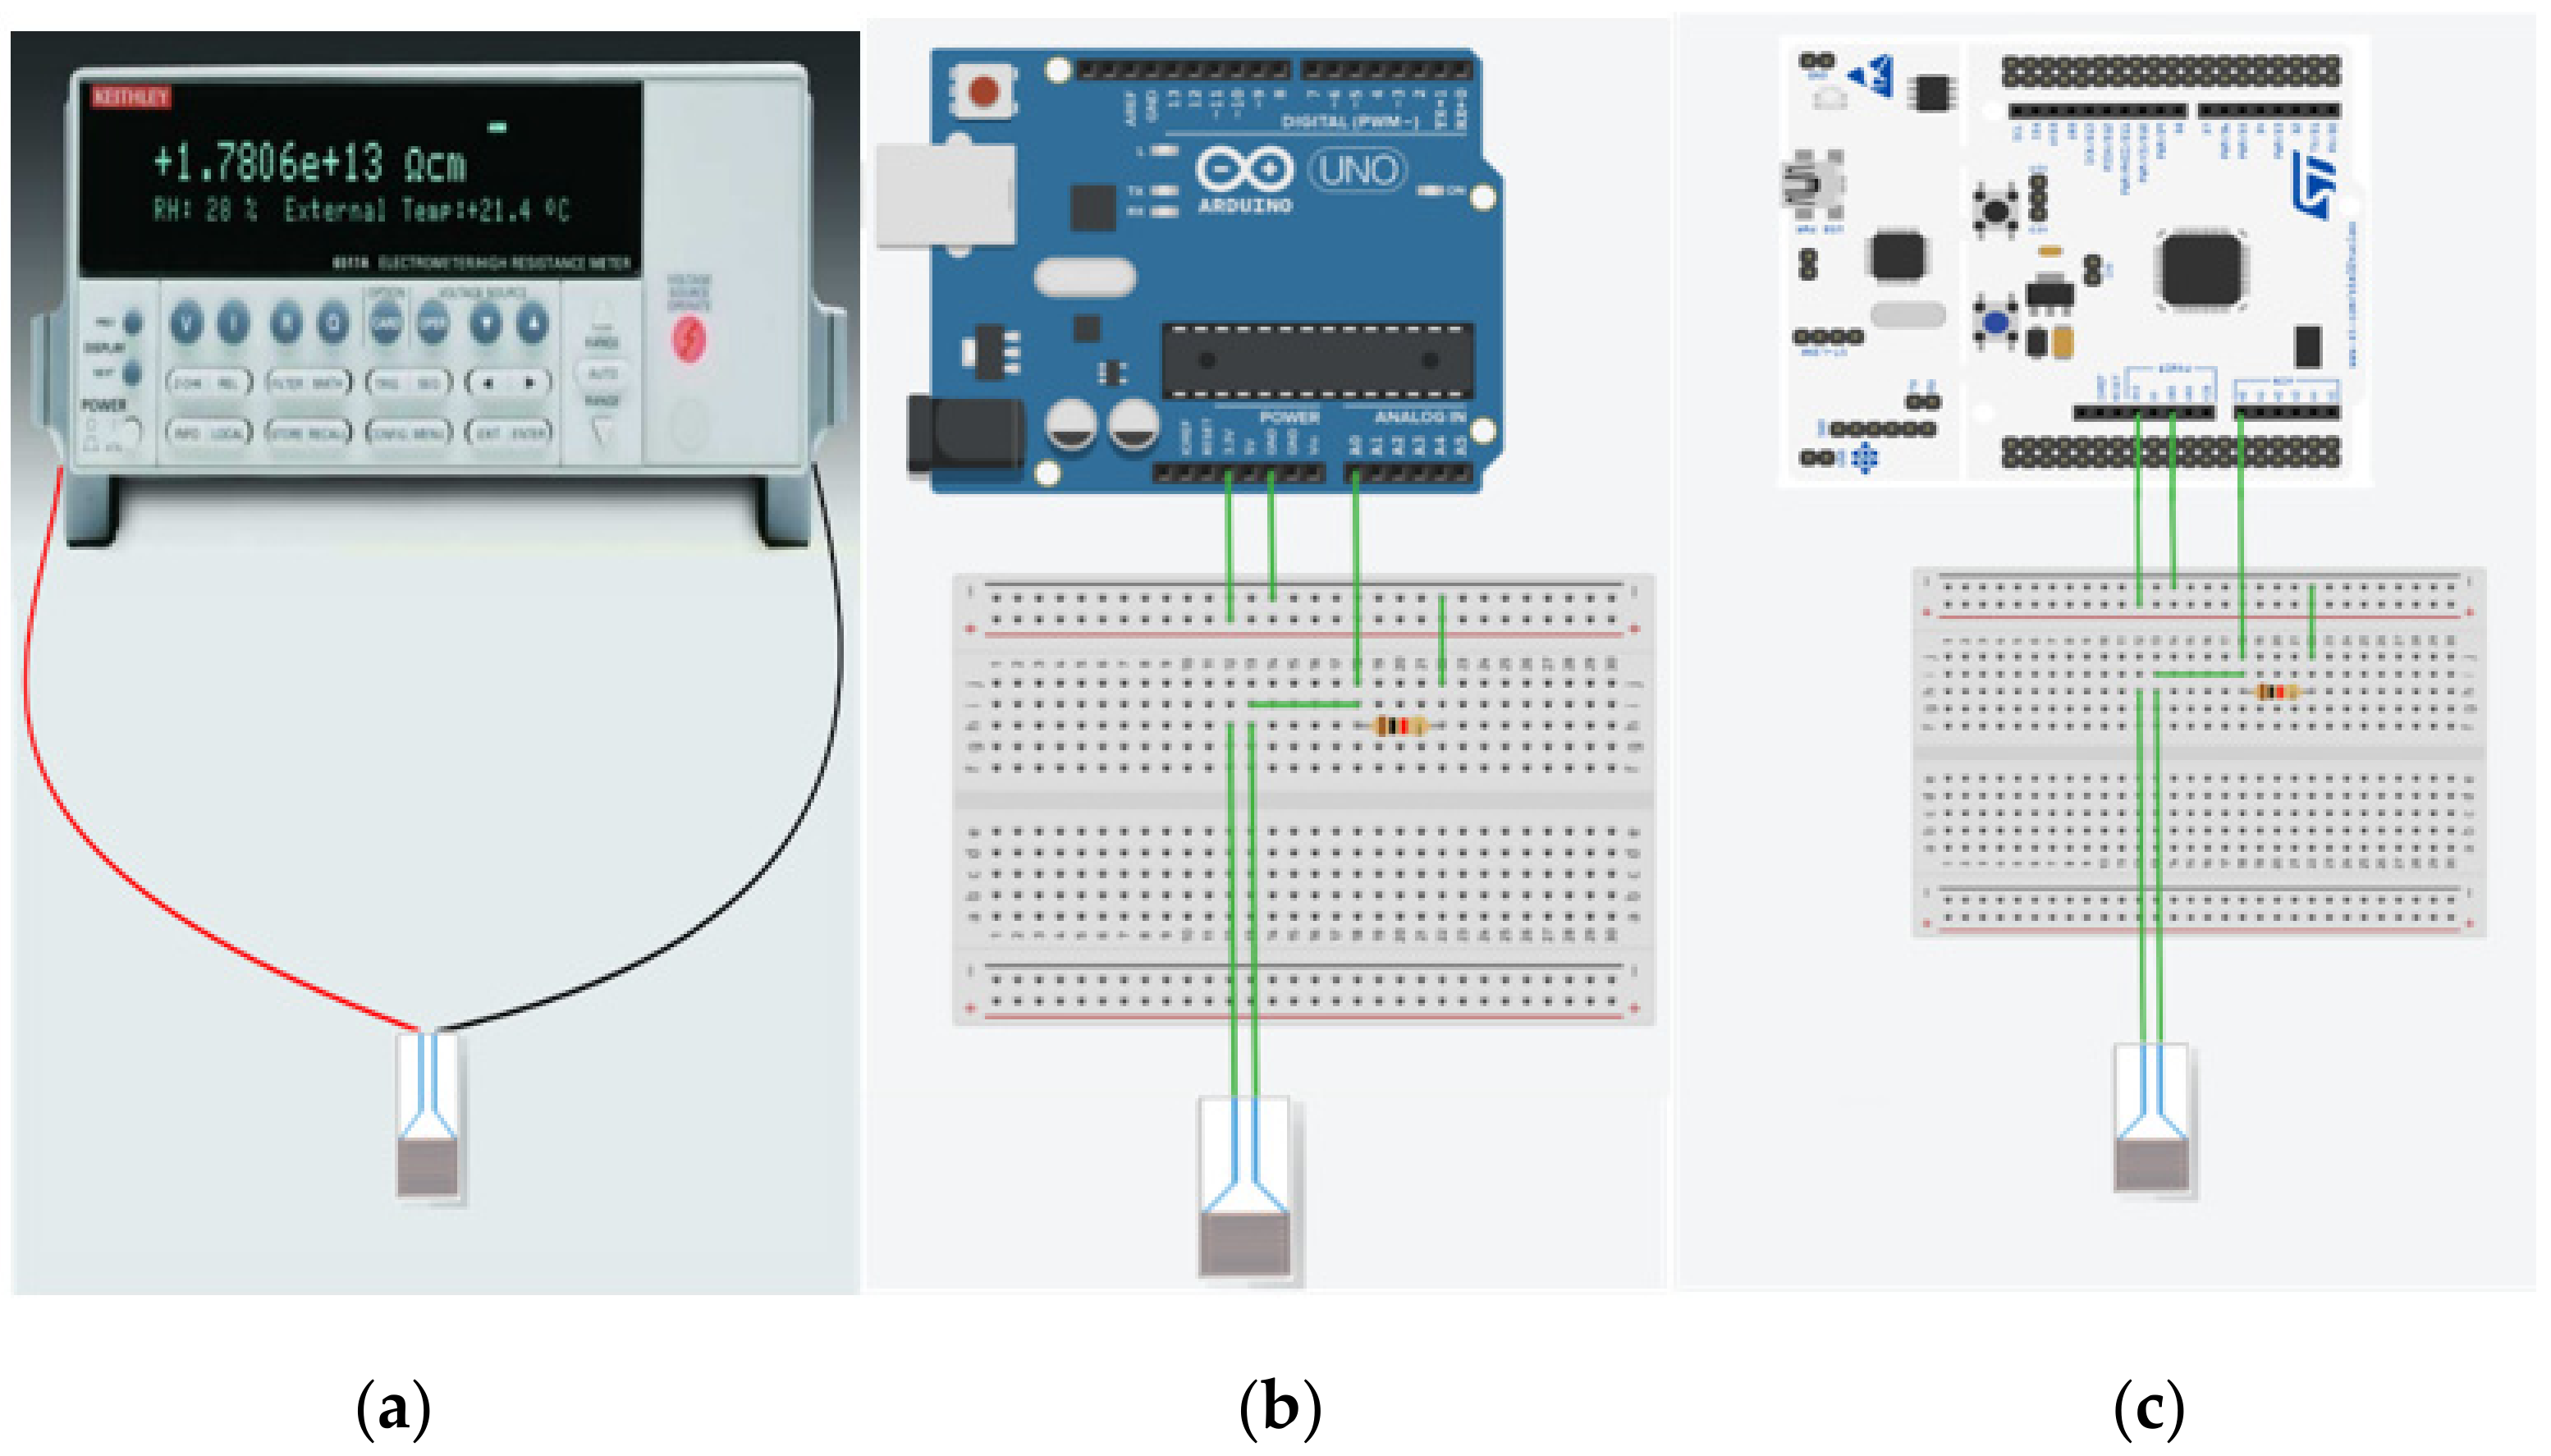
2.4. Measurement Section

Two types of single-board microcontrollers were evaluated: an Arduino UNO, which is based on the Microchip ATMega328P MCU, and a STM32 Nucleo development board based on the STM32F429ZI MCU. Arduino is a widely used board with extensive documentation and a variety of compatible components in the market, making it an attractive choice for testing and building up systems. The STM32 family of MCUs, based on the Arm Cortex processor, provide a multitude of choices based on the user’s needs, from ultra-low power to high performance MCUs.
In Figure 2a–c, the different setups for measuring the electrical current variations are presented. In Figure 2a, the Laboratory setup is shown. The sensor’s electrodes are directly connected to the probes of the Keithley electrometer, which concurrently applies a 3.3 V constant potential difference to the sensor and measures the amperage.
Figure 2b,c present the two single-board MCU setups, the Arduino and the STM32, respectively. Depicted here are the three basic components of the circuits, namely the single-board MCU, the sensor and a reference resistance of 1 kΩ in series. The components are inter-connected using a breadboard. The boards 3.3 V output is connected to the positive electrode of the sensor. The negative electrode of the sensor is connected through the reference resistance to the ground of the board. The measurement is taken through the board’s Analog-to-Digital Converter (ADC) as a quantized value of a voltage range based on a reference voltage.
For the rest of this work, the naming conventions for the three experiment setups are “Lab setup” referring to the Keithley setup, “Arduino setup” to the Arduino UNO board setup and “STM32 setup” to the STM32 board setup.

2.5. MCU Performance

Although the performance capabilities of the selected STM32F MCU are superior to those of the Arduino MCU, the present experiments were focused on the measuring capabilities of the ADC peripherals of the two boards. Most of the STM32 MCUs—as well as the selected one—incorporate an ADC with 12 bits of resolution, while the Arduino’s ADC has 10 bits of resolution.
The two boards also differ in the maximum voltage readings their ADCs can achieve. The Arduino ADC range is 0–5 V while the STM32 ADC is 0–3.3 V. Practically, although the STM32 has a limited voltage range measurement capability, it can have a significantly greater voltage resolution, thanks to its higher-resolution ADC. For the Arduino, a 10-bit ADC means a total of 1024 (210) values in the range 0–5 V, which results in readings in steps of 0.0048 V (5/1024). Accordingly, for the STM32 the measurement quantum is 0.0008 V (3.3/(212)), which is six times higher resolution. Using the above resolution calculations and the Ohm’s Law equation:
V = I × R,
the Arduino board can reach a current resolution of 4.8 μA, while for the STM32 board the current resolution is 0.8 μA.

2.6. Data Post-Processing and Noise Mitigation

The Lab setup provides two current measurements per second. The two single-board setups acquired ten measurements per second. In order to mitigate noise on the measurements, the data were post-processed by low pass filtering through moving average to reduce noise and decimation by five to have the same number of measurements as those of Keithley’s.
The most prominent sources of noise to the measurements are the electronics of the boards, such as voltage regulators or AC-to-DC converters and the high reference resistance of 1 kΩ. To resolve the former problem, a battery instead of the USB connection of the boards could be used to power them, since it is a much more stable voltage source and it could reduce the part of the noise related to the power supply. For the latter problem related to the resistance, one could use a lower resistance to reduce possible noise originating from it. The issue with using a lower resistance is that due to the current measured at the circuit being very low, in the order of microamperes, the resolution of the measurements is reduced drastically. This has the effect that their dynamic range is smaller and variations in the amperage are even harder to detect. One solution would be to add a voltage amplifier to the circuit to increase the detected voltage, or even use a higher voltage, e.g., 5 V, to power the circuit.

3. Results and Discussion

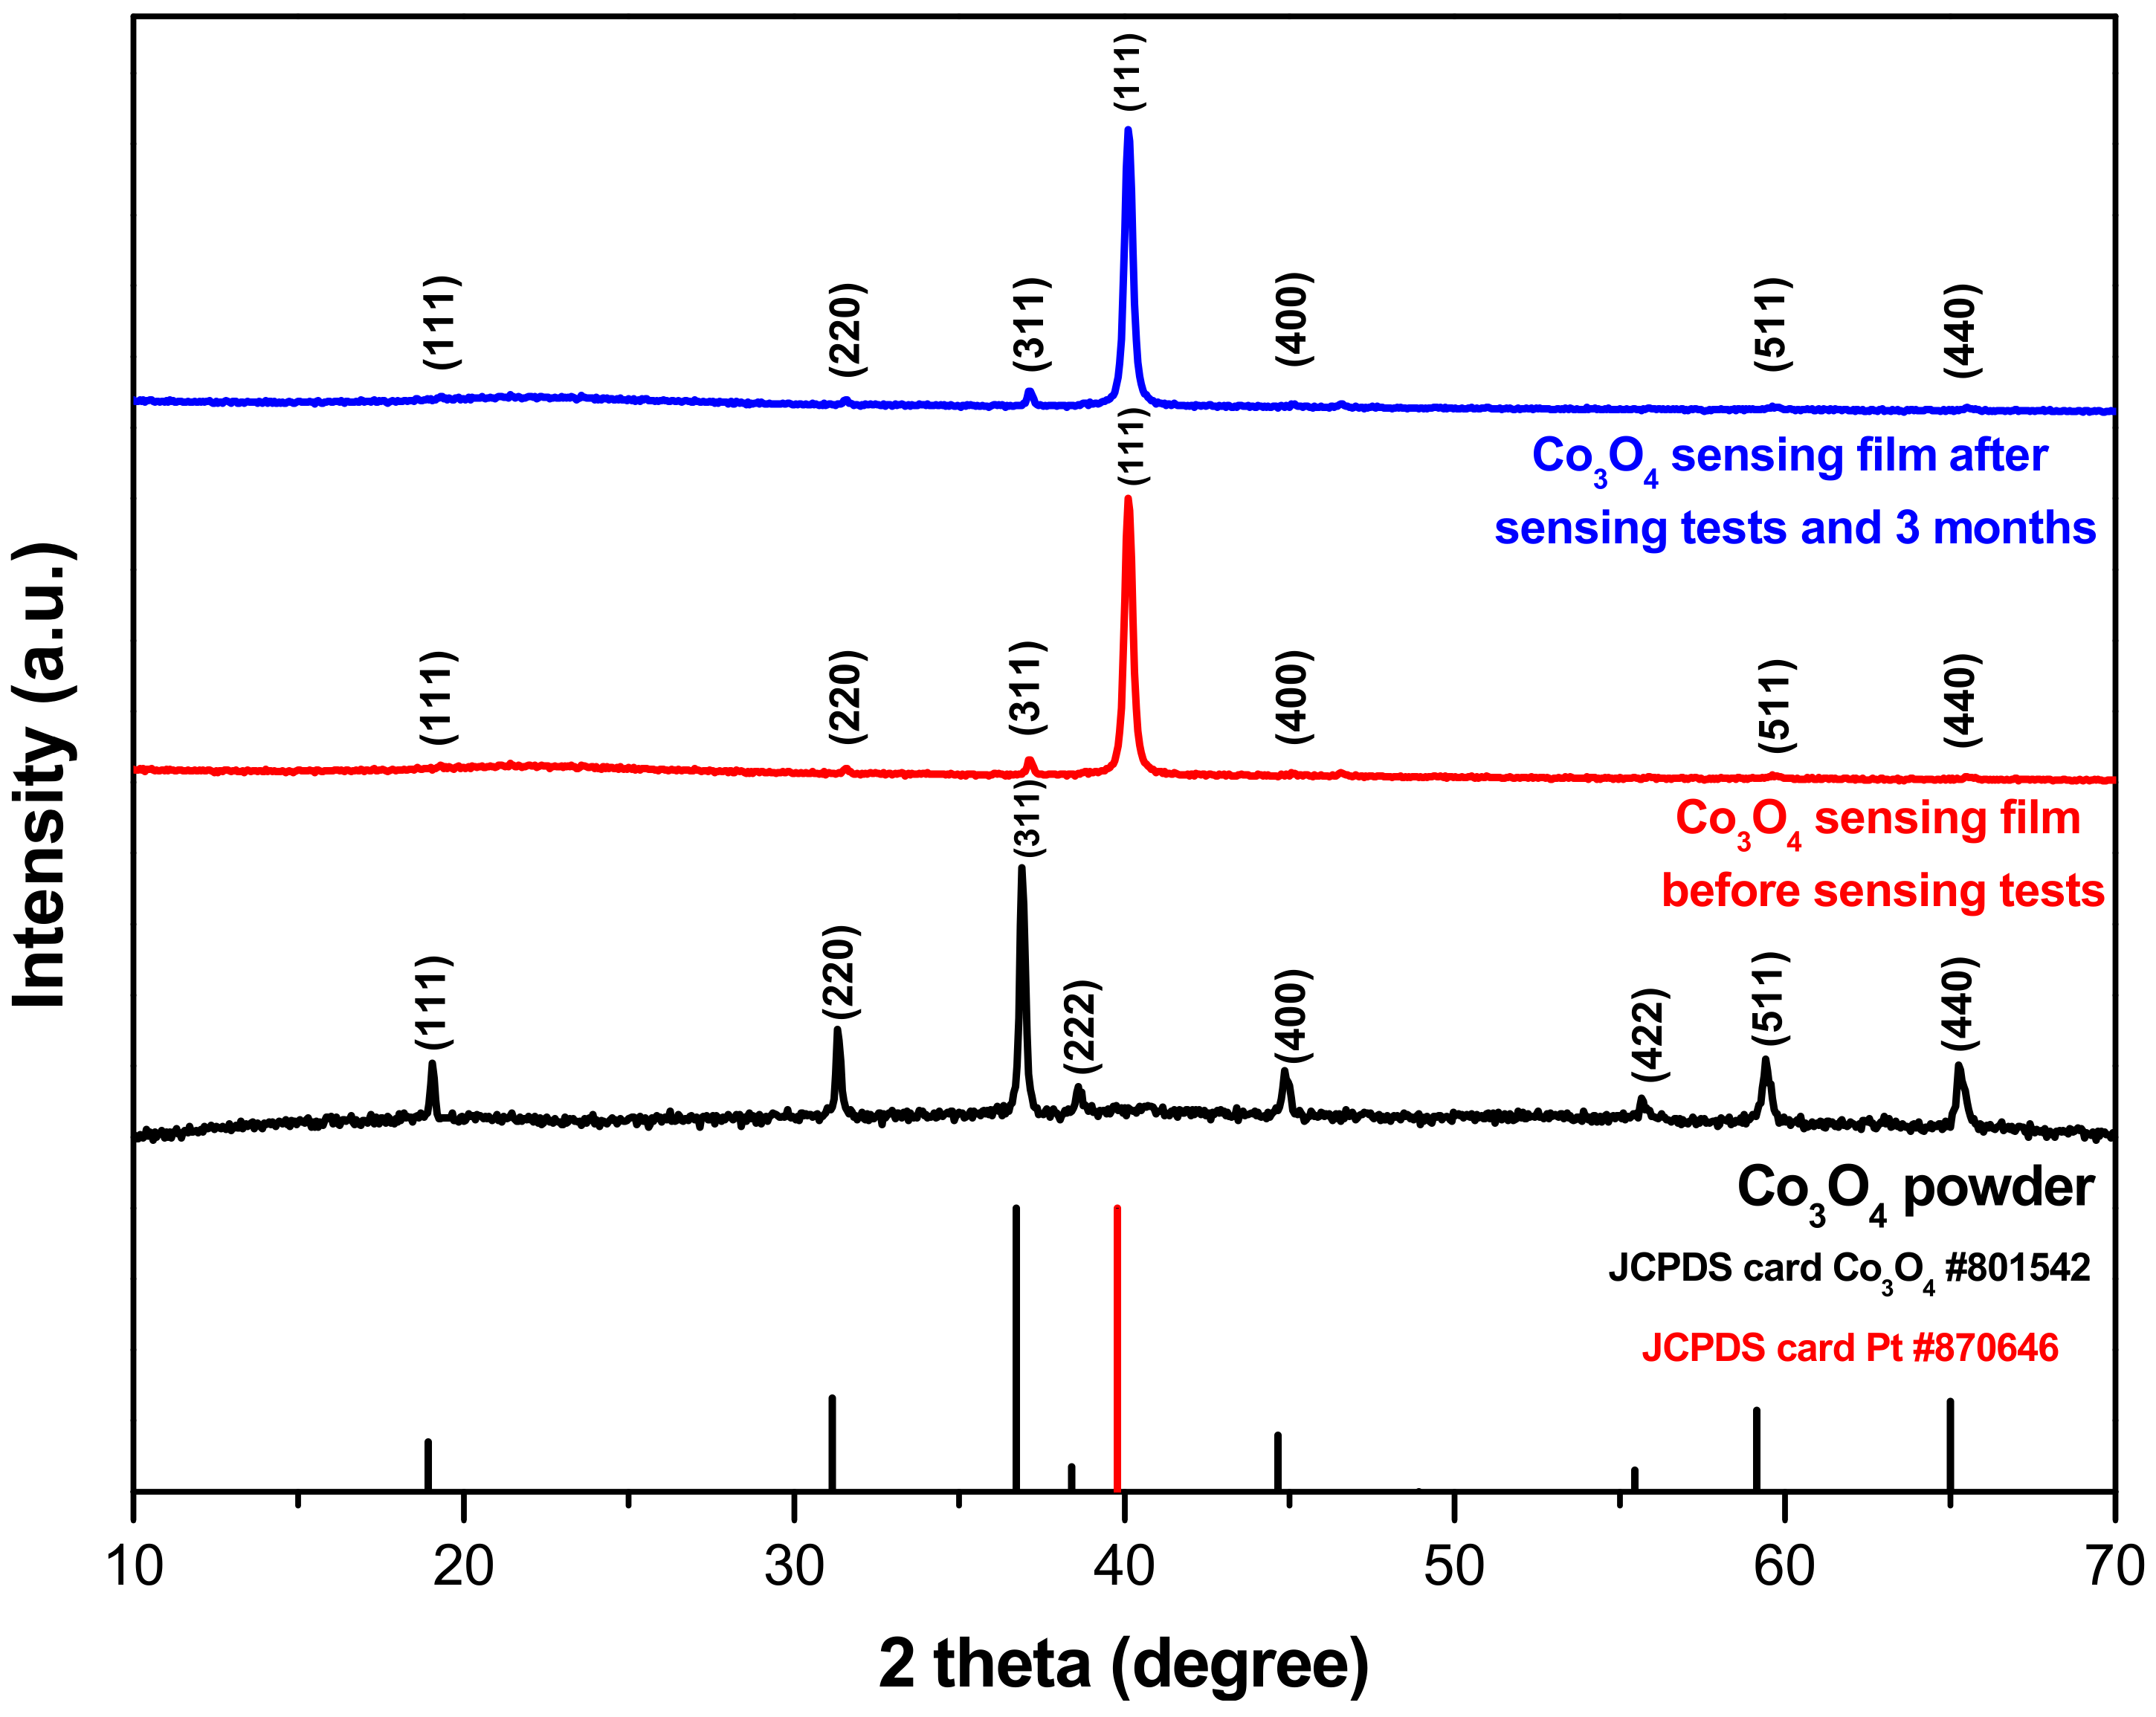
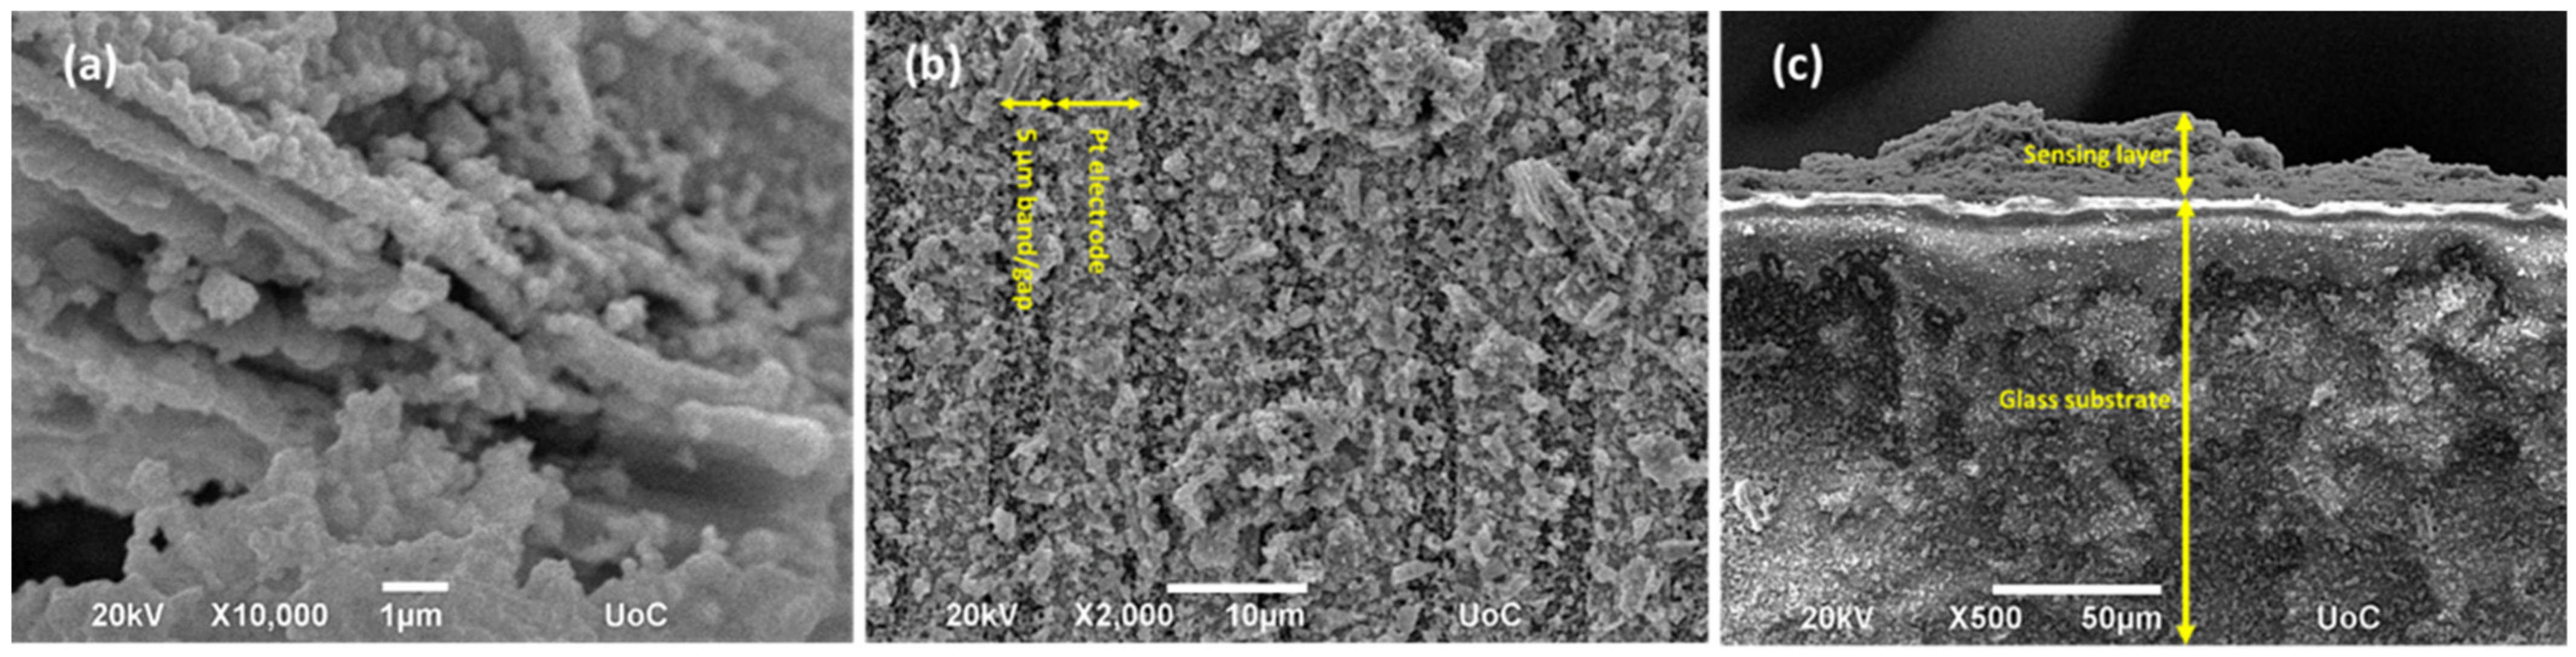
3.1. Structural and Morphological Properties of Powder and Sensing Elements of Co3O4

The X-ray diffraction technique was employed to investigate the phase composition and crystallinity of the Co3O4 nanoparticles. In Figure 3, the XRD pattern of Co3O4 in the powder form is presented, together with that of the sensing element after thermal calcination and before the sensing tests. It can be observed that in both patterns the material is well crystallized since all the diffraction peaks are sharp with high intensity. The pattern of the powder indicates pure Co3O4 with a cubic crystal phase, which belongs to space group Fd-3m (JCPDS file No. 80-1542) with the main diffraction peaks at 31.17°, 36.72°, 44.66°, 59.15° and 65.00° corresponding to (220), (311), (400), (511) and (440) planes, respectively [25,26]. The lattice parameters of the Co3O4 nanoparticles were a = b = c = 0.81099 nm, while the cell volume was 0.53339 nm3. Regarding Scherrer’s formula applied in the main peak (311), the crystallite size of the Co3O4 nanoparticle was found to be 43.7 nm. In the XRD pattern of the Co3O4 sensing element, the main peak of platinum (JCPDS file No. 87-0646) can be observed. This has to do with the fact that the Co3O4 powder was deposited onto a glass substrate with platinum electrodes. Although the intensity of the peaks of the Co3O4 powder is relatively low compared to the platinum peak, they can still be observed in the pattern, albeit scaled down, confirming the presence of the material and its cubic structure.
In Figure 4a, the SEM image of Co3O4 nanoparticles is presented. It is clear that the powder consists of almost homogenous, spherical-like particles with a porous morphology. The latter accommodates a large surface-to-volume ratio that can strongly promote gas diffusion and mass transport, thus increasing the sensor’s response in the presence of gas. The mean particle size ranges between 300–900 nm. The elementary analysis of the Co3O4 nanoparticles shows the detected elements on the surface of the sample. Peaks of Co and O atoms are observed with atomic percent of 21.02% and 37.94%, respectively, confirming the non-stoichiometry of the sensing element leading to an enhancement of sensing properties due to oxygen deficiency. Figure 4b shows the SEM image of the top view of the Co3O4 sensor. Both the platinum electrodes and the gaps between them can be observed and the latter, being measured at 5 μm, confirms the product specifications. Moreover, in Figure 4c the cross-section SEM image of the Co3O4 film after calcination and before the sensing tests is presented, from which the film thickness and surface morphology can be determined. It is observed that the sensing film is composed of fine agglomerated nanoparticles, which form a dense and porous layer onto the Pt electrodes of the glass substrate. The sensing films are almost uniform with thickness lying in the range of 10–25 μm.

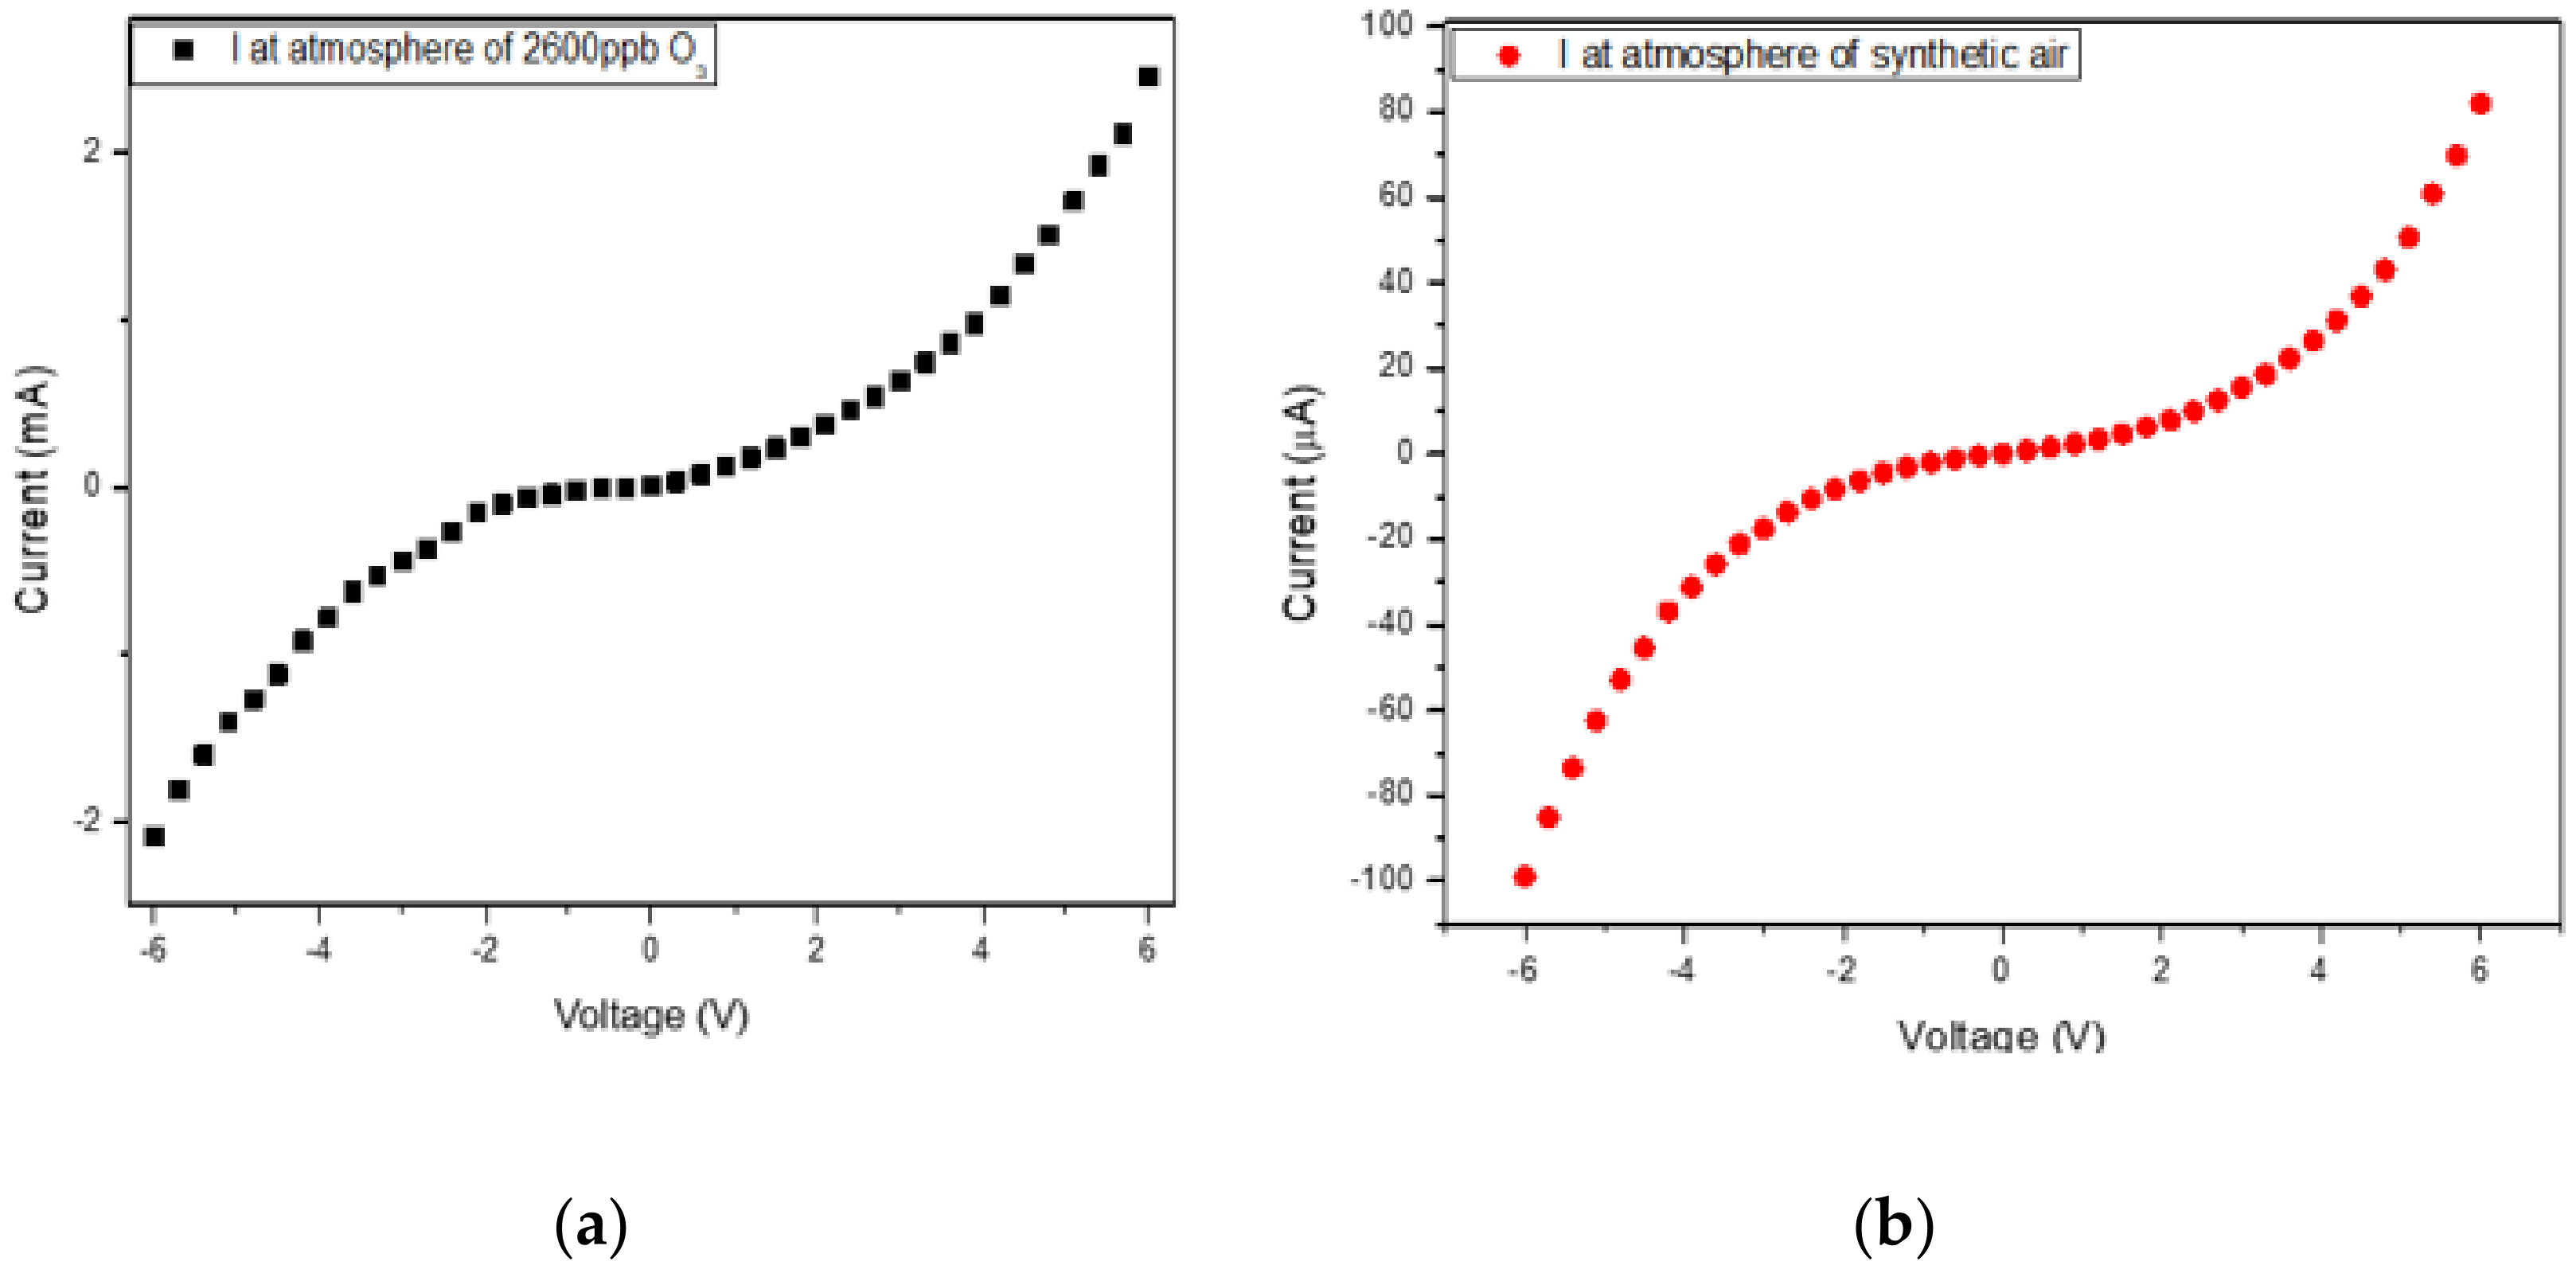
3.2. System Evaluation with Sensing Element of Co3O4 Nanoparticles

In this work, a Co3O4 sensor working at room temperature which exhibits good response even at low ozone concentrations is presented. Figure 5a shows the electrical current variations of the Co3O4 sensor under exposure to 120–2600 ppb O3 at room temperature, measured by the three different setups described above, in the following order: Lab, Arduino and STM32. The Co3O4 sensor exhibits the same p-type electrical behavior against an oxidizing gas, without being affected by the type of setup itself, as depicted in the graphs in Figure 5a. Furthermore, it can be observed that the variation in current—as well the baseline current—increases with the increased O3 concentration from 120 ppb to 2600 ppb. This can be attributed to the fact that the Co3O4 film does not have the ability to fully recover to its initial current value, meaning that the next circle of O3 air begins from a higher value of current. This stress and poor recovery behavior on the same Co3O4 sensor led to fatigue due to the fact that the Co3O4 sensor was tested on three consecutive days, while overnight it was stored under ambient conditions (in air). In addition, the maximum current after exposure in a specific O3 concentration varies between the setups. Particularly, out of the maximum current values observed at each setup, the Lab setup had the highest and the STM32 setup the lowest value.
Figure 5b represents the electrical current variation of the Co3O4 film measured by the Lab setup, under exposure to 2600 ppb O3 at room temperature. It can be observed that the response and recovery period of the Co3O4 film are much longer than those in Figure 5a. The electrical current in Co3O4 film reaches a steady state of 225 μA after exposure to O3 for almost 30 min, while the 60 min towards synthetic air (absence of O3) flux was not enough to fully recover and reach its initial steady state (before the insertion of O3).
Figure 6 represents the I-V curves of the Co3O4 sensor measured under 2600 ppb ozone and synthetic air atmosphere at room temperature. The selected area of voltage is −6 to 6 V due to the fact that 3.3 V is included. The increase of voltage has as a result the exponential increase of current. The same behavior is exhibited under synthetic air, while the value of current was 2–3 orders of magnitude lower than the ones under the highest concentration of ozone. This is due to the fact that the interaction between a p-type semiconducting material and an oxidizing gas such as ozone results in the increase in current due to the increase in the hole-accumulation layer. However, apart from the simultaneous increase in current by the increase in voltage, the response of the sensor increases too. This shows that the sensing performance changes when the bias condition is changed. I-V curves demonstrate a formation of Schottky barrier, which could be owed to the contacts between the sensing layer and the Pt electrodes. However, the effect of the contacts is not dominant and does not change the conduction mechanism [27].
Figure 7 shows the response of the Co3O4 sensor as this is calculated with Equation (1) for the three different setups (Lab-Arduino-STM32), for each O3 concentration, at room temperature. It can be clearly observed that all sensors exhibit an increase in response with increasing O3 concentration up to 1100 ppb, while after this concentration the response slightly decreases. Moreover, the response at 1100 ppb was one order of magnitude greater than the one at 120 ppb, independent of the type of the setups. Specifically, at the lowest O3 concentrations (120 and 250 ppb), the response is less than 46%, while at the highest O3 concentrations (2600 ppb), it increases up to the values of 82%, 98% and 65%, respectively.
In order to determine the detection limit of each measurement setup, the values of response were fitted by using the power equations [28,29], which are listed below:
Lab setup: y = 111.478 − 1860.172 × x−0.6036
Arduino setup: y = 126.343 − 2120.102 × x−0.6003
STM32 setup: y = 80.635 − 13,550.523 × x−1.1504
By combining the fitting equations with the current resolution of each setup (Table 1), it can be safely assumed that the low detection limit of Co3O4 sensors measured by the Lab, Arduino and STM32 setups is 80.50, 109.73 and 85.90 ppb, respectively. The low detection limit of the Co3O4 sensor measured with the Lab and STM32 setups was found to be close and below 100 ppb. On the other hand, the high current resolution of the Arduino setup (4.8 μA) plays a vital role on the low ozone concentration that the sensor can detect. Moreover, the O3 resolution and sensitivity as calculated from the current resolution of the Lab, Arduino and STM32 setups are found to be 0.0101, 8.1258, 0.7628 ppb and 102.72, 92.81, 75.84 μA/ppm, respectively. It is observed that the Arduino setup has a high current resolution, which leads to a high O3 resolution as well, since the values of current in between could not be monitored. However, the Co3O4 sensor exhibits better sensitivity when it is tested with the Arduino and Lab setups compared to the STM32 one. This can be attributed to the fact that the values of current of the Co3O4 sensor with the first two setups (Lab and Arduino) were higher than those of the third (STM32) and it is irrelevant to the setups’ current resolution.
Another important sensing parameter of these setups is the response time of the sensor. At the time that the Co3O4 sensing layer is exposed to ozone, the electrical current is increased, reaching 90% of the maximum response signal after 10–12 min for all ozone concentrations. A plausible cause of this behavior is that the sensor has come to a saturation state, thus gas molecules are competing, taking more time to fill the few remaining absorption sites on the surface, at high gas concentrations. Another issue that should be noted is the fact that the full steady state of Co3O4 sensors could not be achieved within the standard gas exposure time of 20 min, and as a result recovery time cannot be determined. Thus, the Co3O4 film initially exhibits a fast kinetic response with almost instantaneous reaction, leading to current variation towards exposure to the target gas molecules.

3.3. Stability of Co3O4 Sensing Element on Different Setups

The stability of the same Co3O4 sensing element, which was stored under ambient conditions (in air) for 3 months, was also investigated. Figure 8 demonstrates the electrical current variation of Co3O4 film measured by the three different setups (Lab-Arduino-STM32) towards 120–2600 ppb O3, at room temperature, after 3 months. It can be observed that the Co3O4 sensing element exhibits almost the same behavior, independent of the type of setup. More specifically, the current variation, as well as the baseline current, are increased by increasing the O3 concentration from 120 ppb to 2600 ppb. In addition, it can be observed that the current values measured by all setups are two to three times higher than the previous measurements, which are shown in Figure 5a. The Co3O4 sensing element was initially tested on the Lab setup showing three times higher current than its previous measurement by the same setup. However, when it was tested by the Arduino and STM32 setups over the next days, the current was two times higher than its previous tests by the same setups. The same phenomenon of upwards drifting has been investigated in the literature and solved by the addition of nickel oxide as stabilizer [30]. It is believed that this is the result of the combination of partial oxidation of the Co3O4 surface from the oxidizing ozone gas together with the poor recovery behavior during the whole measurement period. Ozone is a strong oxidizing gas even at low concentrations, while Co3O4 has various valence numbers due to the fact that it forms a spinel lattice, in which Co has divalent and trivalent states leading to poor stability. On the other hand, this poor stability is referring only to the surface of the sensing film, as it is observed in Figure 3, in which the X-ray diffraction pattern of the Co3O4 sensing element before and after three months is presented. It is obvious that both patterns have the same high and sharp peaks indicating that the Co3O4 sensing element retains its lattice and crystal phase. The higher intensity of the peaks appearing in the pattern measured after three months reveals the high crystallinity of the Co3O4 sensing element even after such a period.

3.4. Power Consumption and Quantitative Analysis

Table 2 presents the specifications of a number of COTS ozone sensors as well as those of the Co3O4 sensor with the Keithley setup. The COTS sensors mentioned in this table are analog since the gas concentration is inferred from a voltage measurement at the output pins of the sensors. These are compared against the results acquired for the Co3O4 sensor on the Keithley setup. Table 3 presents the same specifications for the Co3O4 sensor with the two microcontroller setups and one digital COTS sensor. This sensor has integrated a microcontroller unit, giving it the ability to output the gas measurements as binary information using the Universal Asynchronous Receiver/Transmitter (UART) protocol. This separation was performed in order to compare the same type of systems against each other. These data shown here are drawn from the datasheets of the corresponding sensors and the dashes in some of the cells indicate the absence of that information from the datasheet.
An important aspect of a sensor is its power consumption. Typically, the following two values are cited for each sensor: a minimum and a maximum consumption. It is worth mentioning that these values depend greatly on the circuit on which the sensor is integrated, as well as on the instrument that is used for the measurements. This is also included in some of the datasheets.
The well-known formula of power (P)
P = V × I,
where V is applied voltage and I is the electrical current, was used to calculate the power consumption. The minimum consumption corresponds to the minimum electrical current that can be measured, while the maximum consumption is for the maximum electrical current that is monitored during the measurement. Both minimum and maximum power consumption values are in the order of microWatts, and on Table 3 it is shown that the STM32 setup has the lowest consumption of the three MCU setups. On Table 2, it is evident that the sensor has a great advantage over the widely used MQ131 sensor as far as power consumption is concerned, since the latter needs pre-heating, a condition which is not a requisite for the Co3O4 sensor. Furthermore, the corresponding energy consumption for the Arduino and STM32 setups was calculated by integrating the voltage and electrical current values over the time period of the experiment and found to be 0.1121 Wh and 0.0524 Wh, respectively.
A low detection limit indicates the lower concentration that can be detected by the gas sensor. It can be observed in Table 2 that the low detection limit of the Co3O4 sensor is comparable with those of the commercial sensors. The resolution corresponds to the quantization step of the measurements. The Co3O4 sensor on the STM32 setup has the best quantization step of all MCU setups, as can be observed in Table 3. As was the case for the power consumption, the resolution and the lower detection limit are also dependent on the measurement equipment and not on the sensor, since the output of the sensor is analog. Finally, the sensitivity indicates the electrical current passing through the sensor when it is exposed in 1ppm ozone. From Table 2, it is clear that the sensitivity of the Co3O4 sensor is significantly higher than that of most commercial sensors.
Finally, Table 4 demonstrates a summary of MOS ozone sensors. It is observed that the present work exhibits good sensing characteristics, e.g., a low detection limit in real life conditions, low energy consumption due to the low voltage supply and low operating temperature compared to other cited works.

4. Sensing Mechanism

The proposed gas sensing mechanism is independent of the measurement setup (Lab-Arduino-STM32), having a strong relation as a metal oxide system with surface phenomena [36], which consist of an adsorption-oxidation-desorption process. Furthermore, it should be noted that Co3O4 is a p-type oxide semiconductor of transition metal, thus it exhibits various oxidation states because of the electrons in the d-shell of the metal atom. As a result, it shows an affinity with oxygen and multivalent characteristics [37].
In particular, the oxygen molecules from air are adsorbed on the surface of Co3O4 and obtain electrons from its conduction band to form O2 at room temperature and in general, at temperatures below 100 °C [38]. As a result, a hole-accumulation layer is formed on the surface of the Co3O4, while on the center of the particle there is an insulating core, as observed in Figure 9. The main charge carrier of p-type Co3O4 is hole, thus the electrical current of the sensor under air is low (Equations (7) and (8)).
O2 (gas) ↔ O2 (ads)
O2 (ads) ↔ O2 + h+ (T < 100 °C)
When the Co3O4 sensor is exposed to ozone, the reaction between O3 molecules and the oxygen species on the surface of the material causes more electrons to be captured from the conduction band, and O2 and O are formed at low temperatures (Equations (9) and (10)). As a result, the electrical current of the sensor is increased.
O3 (gas) ↔ O3 (ads)
O3 (ads) ↔ O2 + O + 2h+ (T < 90 °C)
However, after the first circle of O3 air and mainly after the first recovery period, ozone molecules have not been fully removed at room temperature, being attached on the surface of the sensing film, leading to a partial separation between electrons and holes resulting in a continuous increase in the sensor’s electrical current. A possible way to overcome this disadvantage is to increase the operating temperature of the sensor.

5. Conclusions

A Co3O4 ozone gas sensor integrated on a CPS and evaluated with two different MCU setups was presented in this work. Cross validation with the laboratory setup showed that the results of the two board setups, especially the STM32 Nucleo board, are extremely close to the laboratory setup measurements, rendering them suitable for low-cost ozone monitoring applications. Moreover, a comparison between the Co3O4 sensor on the two board setups with commercial ozone sensors was also conducted. Specifically, the power consumption is close to or better than that of the commercially available sensors, and the lower detection limit as well as the resolution are similar to the reported values of the commercial sensors, with the measurement equipment playing the main role in the determination of these metrics. In addition, the sensitivity was found to be better than those of the commercial ones. Finally, a number of problems identified through the experiments were reported, such as the poor recovery behavior and memory effects of the Co3O4 sensor and the noise mitigation of the high reference resistance, and possible solutions were proposed in order to be applied on the CPS to improve future performance.

Author Contributions

Conceptualization, M.M. and G.V.; methodology, M.M.; software, G.V.; writing—original draft preparation, M.M. and G.V.; writing—review and editing, E.G., S.P. and V.B.; supervision, V.B. All authors have read and agreed to the published version of the manuscript.

Funding

This research received no external funding.

Institutional Review Board Statement

Not applicable.

Informed Consent Statement

Not applicable.

Data Availability Statement

Not applicable.

Acknowledgments

The research work was supported by the Hellenic Foundation for Research and Innovation (HFRI) under the HFRI PhD Fellowship grant (Fellowship Number: 1477). Part of this work was financially supported by the Stavros Niarchos Foundation within the framework of the project ARCHERS (“Advancing Young Researchers’ Human Capital in Cutting Edge Technologies in the Preservation of Cultural Heritage and the Tackling of Societal Challenges”). Part of this work was supported by the project “Quality of Life” (MIS 5002464), which is implemented under the “Action for the Strategic Development on the Research and Technological Sector”, funded by the Operational Programme “Competitiveness, Entrepreneurship and Innovation” (NSRF 2014-2020) and co-financed by Greece and the European Union (European Regional Development Fund). Authors would like to acknowledge Emmanouil Surligas for his contribution in noise mitigation analysis.

Conflicts of Interest

The authors declare no conflict of interest.

References

  1. Lee, E.A. Cyber Physical Systems: Design Challenges. In Proceedings of the 2008 11th IEEE International Symposium on Object and Component-Oriented Real-Time Distributed Computing (ISORC), Orlando, FL, USA, 5–7 May 2008; pp. 363–369. [Google Scholar] [CrossRef] [Green Version]
  2. Bagula, A.; Ajayi, O.; Maluleke, H. Cyber Physical Systems Dependability Using CPS-IOT Monitoring. Sensors 2021, 21, 2761. [Google Scholar] [CrossRef] [PubMed]
  3. Ionascu, M.; Castell, N.; Boncalo, O.; Schneider, P.; Darie, M.; Marcu, M. Calibration of CO, NO2, and O3 Using Airify: A Low-Cost Sensor Cluster for Air Quality Monitoring. Sensors 2021, 21, 7977. [Google Scholar] [CrossRef] [PubMed]
  4. Järvinen, T.; Lorite, G.S.; Rautio, A.R.; Juhász, K.L.; Kukovecz, Á.; Kónya, Z.; Kordas, K.; Toth, G. Portable Cyber-Physical System for Indoor and Outdoor Gas Sensing. Sens. Actuators B Chem. 2017, 252, 983–990. [Google Scholar] [CrossRef] [Green Version]
  5. Sinha, N.; Pujitha, K.E.; Alex, J.S.R. Xively Based Sensing and Monitoring System for IoT. In Proceedings of the 2015 International Conference on Computer Communication and Informatics (ICCCI), Coimbatore, India, 8–10 January 2015; pp. 8–13. [Google Scholar] [CrossRef]
  6. Heyasa, B.B.L.; Galarpe, V.R.K.R. Preliminary Development and Testing of Microcontroller-MQ2 Gas Sensorfor University Air Quality Monitoring. IOSR J. Electr. Electron. Eng. 2017, 12, 47–53. [Google Scholar] [CrossRef]
  7. Mujawar, T.H.; Bachuwar, V.D.; Kasbe, M.S.; Shaligram, A.D.; Deshmukh, L.P. Development of Wireless Sensor Network System for LPG Gas Leakage Detection System. Int. J. Sci. Eng. Res. 2015, 6, 558–563. [Google Scholar] [CrossRef]
  8. Dewi, L.; Somantri, Y. Wireless Sensor Network on LPG Gas Leak Detection and Automatic Gas Regulator System Using Arduino. IOP Conf. Ser. Mater. Sci. Eng. 2018, 384, 12064. [Google Scholar] [CrossRef]
  9. Sakayo, N.M.; Mutuku, J.N.; Ngaruiya, J.M. Design and Calibration of a Microcontroller Based MQ-4 Gas Sensor for Domestic Cooking Gas System. Int. J. Appl. Phys. 2019, 6, 31–40. [Google Scholar] [CrossRef]
  10. Wu, J.; Gao, H.; Yao, S.; Chen, L.; Gao, Y.; Zhang, H. Degradation of Crystal Violet by Catalytic Ozonation Using Fe/Activated Carbon Catalyst. Sep. Purif. Technol. 2015, 147, 179–185. [Google Scholar] [CrossRef]
  11. Magara, Y.; Itoh, M.; Morioka, T. Application of Ozone to Water Treatment and Power Consumption of Ozone Generating Systems. Prog. Nucl. Energy 1995, 29, 175–182. [Google Scholar] [CrossRef]
  12. Kumarage, G.W.C.; Comini, E. Low-Dimensional Nanostructures Based on Cobalt Oxide (Co3O4) in Chemical-Gas Sensing. Chemosensors 2021, 9, 197. [Google Scholar] [CrossRef]
  13. Lee, J.H.; Kim, J.Y.; Kim, J.H.; Mirzaei, A.; Kim, H.W.; Kim, S.S. Co3O4-Loaded ZnO Nanofibers for Excellent Hydrogen Sensing. Int. J. Hydrog. Energy 2019, 44, 27499–27510. [Google Scholar] [CrossRef]
  14. Yoon, J.W.; Choi, J.K.; Lee, J.H. Design of a Highly Sensitive and Selective C2H5OH Sensor Using P-Type Co3O4 Nanofibers. Sens. Actuators B Chem. 2012, 161, 570–577. [Google Scholar] [CrossRef]
  15. Zhang, Z.; Wen, Z.; Ye, Z.; Zhu, L. Gas Sensors Based on Ultrathin Porous Co3O4 Nanosheets to Detect Acetone at Low Temperature. RSC Adv. 2015, 5, 59976–59982. [Google Scholar] [CrossRef]
  16. Akamatsu, T.; Itoh, T.; Masuda, Y.; Shin, W.; Matsubara, I.; Kida, M. Gas Sensor Properties of Nanopore-Bearing Co3O4 Particles Containing Pt or Pd Particles. J. Asian Ceram. Soc. 2020, 8, 138–148. [Google Scholar] [CrossRef] [Green Version]
  17. Nguyen, H.; El-Safty, S.A. Meso- and Macroporous Co3O4 Nanorods for Effective VOC Gas Sensors. J. Phys. Chem. C 2011, 115, 8466–8474. [Google Scholar] [CrossRef]
  18. Liu, L.; Li, T.; Yi, Z.; Chi, F.; Lin, Z.; Zhang, X.; Xu, K. Conductometric Ozone Sensor Based on Mesoporous Ultrafine Co3O4 Nanobricks. Sens. Actuators B Chem. 2019, 297, 126815. [Google Scholar] [CrossRef]
  19. Park, S.; Kim, S.; Kheel, H.; Lee, C. Oxidizing Gas Sensing Properties of the N-ZnO/p-Co3O4 Composite Nanoparticle Network Sensor. Sens. Actuators B Chem. 2016, 222, 1193–1200. [Google Scholar] [CrossRef]
  20. Akamatsu, T.; Itoh, T.; Izu, N.; Shin, W.; Sato, K. Sensing Properties of Pd-Loaded Co3O4 Film for a Ppb-Level NO Gas Sensor. Sensors 2015, 15, 8109–8120. [Google Scholar] [CrossRef] [PubMed]
  21. Li, T.; Gao, J.; Fu, P.; Zhe, C.; Wang, S.; Lin, Z. The Preparation and Ozone-Sensing Performance of Co3O4 Nanobricks. J. Mater. Sci. Mater. Electron. 2019, 30, 9678–9682. [Google Scholar] [CrossRef]
  22. Korotcenkov, G.; Blinov, I.; Brinzari, V.; Stetter, J.R. Effect of Air Humidity on Gas Response of SnO2 Thin Film Ozone Sensors. Sens. Actuators B Chem. 2007, 122, 519–526. [Google Scholar] [CrossRef]
  23. Mills, S.; Lee, B.; Misra, V. Room Temperature Ozone and Humidity Response Evolution of Atomic Layer Deposited SnO2 Sensors. In Proceedings of the IEEE Sensors, Glasgow, UK, 1–3 December 2017. [Google Scholar] [CrossRef]
  24. Bârsan, N.; Stetter, J.R.; Findlay, M.; Göpel, W. High-Performance Gas Sensing of CO: Comparative Tests Semiconducting (SnO2-Based) and for Amperometric Gas Sensors. Anal. Chem. 1999, 71, 2512–2517. [Google Scholar] [CrossRef] [PubMed]
  25. Prabaharan, D.D.M.; Sadaiyandi, K.; Mahendran, M.; Sagadevan, S. Precipitation Method and Characterization of Cobalt Oxide Nanoparticles. Appl. Phys. A Mater. Sci. Process. 2017, 123, 1–6. [Google Scholar] [CrossRef]
  26. Mayedwa, N.; Mongwaketsi, N.; Khamlich, S.; Kaviyarasu, K.; Matinise, N.; Maaza, M. Green Synthesis of Nickel Oxide, Palladium and Palladium Oxide Synthesized via Aspalathus Linearis Natural Extracts: Physical Properties & Mechanism of Formation. Appl. Surf. Sci. 2018, 446, 266–272. [Google Scholar] [CrossRef]
  27. Barsan, N.; Weimar, U. Conduction Model of Metal Oxide Gas Sensors. J. Electroceramics 2001, 7, 143–167. [Google Scholar] [CrossRef]
  28. Yamazoe, N.; Shimanoe, K. Theory of Power Laws for Semiconductor Gas Sensors. Sens. Actuators B Chem. 2008, 128, 566–573. [Google Scholar] [CrossRef]
  29. Hua, Z.; Qiu, Z.; Li, Y.; Zeng, Y.; Wu, Y.; Tian, X.; Wang, M.; Li, E. A Theoretical Investigation of the Power-Law Response of Metal Oxide Semiconductor Gas Sensors ΙI: Size and Shape Effects. Sens. Actuators B Chem. 2018, 255, 3541–3549. [Google Scholar] [CrossRef]
  30. Choi, S.D.; Min, B.K. Co3O4-Based Isobutane Sensor Operating at Low Temperatures. Sens. Actuators B Chem. 2001, 77, 330–334. [Google Scholar] [CrossRef]
  31. Joshi, N.; Da Silva, L.F.; Jadhav, H.; M’Peko, J.C.; Millan Torres, B.B.; Aguir, K.; Mastelaro, V.R.; Oliveira, O.N. One-Step Approach for Preparing Ozone Gas Sensors Based on Hierarchical NiCo2O4 Structures. RSC Adv. 2016, 6, 92655–92662. [Google Scholar] [CrossRef] [Green Version]
  32. Onofre, Y.J.; Catto, A.C.; Bernardini, S.; Fiorido, T.; Aguir, K.; Longo, E.; Mastelaro, V.R.; da Silva, L.F.; de Godoy, M.P.F. Highly Selective Ozone Gas Sensor Based on Nanocrystalline Zn0.95Co0.05O Thin Film Obtained via Spray Pyrolysis Technique. Appl. Surf. Sci. 2019, 478, 347–354. [Google Scholar] [CrossRef]
  33. Thirumalairajan, S.; Mastelaro, V.R.; Escanhoela, C.A. In-Depth Understanding of the Relation between CuAlO2 Particle Size and Morphology for Ozone Gas Sensor Detection at a Nanoscale Level. ACS Appl. Mater. Interfaces 2014, 6, 21739–21749. [Google Scholar] [CrossRef]
  34. Petromichelaki, E.; Gagaoudakis, E.; Moschovis, K.; Tsetseris, L.; Anthopoulos, T.D.; Kiriakidis, G.; Binas, V. Highly Sensitive and Room Temperature Detection of Ultra-Low Concentrations of O3 Using Self-Powered Sensing Elements of Cu2O Nanocubes. Nanoscale Adv. 2019, 1, 2009–2017. [Google Scholar] [CrossRef] [Green Version]
  35. Paralikis, A.; Gagaoudakis, E.; Kampitakis, V.; Aperathitis, E.; Kiriakidis, G.; Binas, V. Study on the Ozone Gas Sensing Properties of Rf-Sputtered Al-Doped Nio Films. Appl. Sci. 2021, 11, 3104. [Google Scholar] [CrossRef]
  36. Zhang, X.; Wang, J.; Xuan, L.; Zhu, Z.; Pan, Q.; Shi, K.; Zhang, G. Novel Co3O4 Nanocrystalline Chain Material as a High Performance Gas Sensor at Room Temperature. J. Alloys Compd. 2018, 768, 190–197. [Google Scholar] [CrossRef]
  37. Ji, H.; Zeng, W.; Li, Y. Gas Sensing Mechanisms of Metal Oxide Semiconductors: A Focus Review. Nanoscale 2019, 11, 22664–22684. [Google Scholar] [CrossRef] [PubMed]
  38. Kim, H.J.; Lee, J.H. Highly Sensitive and Selective Gas Sensors Using P-Type Oxide Semiconductors: Overview. Sens. Actuators B Chem. 2014, 192, 607–627. [Google Scholar] [CrossRef]
Figure 1. Experimental setup for gas sensing measurements.
Chemosensors 10 00266 g001
Figure 2. Schematic representation of the (a) Lab setup; (b) Arduino setup; (c) STM32 setup.
Chemosensors 10 00266 g002
Figure 3. X-ray diffraction pattern of Co3O4 nanoparticles and sensing element after thermal annealing, before and after sensing tests and 3-month storage.
Chemosensors 10 00266 g003
Figure 4. (a) SEM images of Co3O4 nanoparticles; (b,c) micrographs of Co3O4 sensing elements, after thermal annealing and before sensing tests.
Chemosensors 10 00266 g004
Figure 5. Variation in the electrical current of Co3O4 film measured (a) by 3 different setups under exposure to 120–2600 ppb O3, and (b) Lab setup under long exposure to 2600 ppb O3 at room temperature.
Chemosensors 10 00266 g005
Figure 6. I-V curves of Co3O4 film measured by the Lab setup under exposure to (a) 2600 ppb O3 and (b) synthetic air atmosphere at room temperature.
Chemosensors 10 00266 g006
Figure 7. Sensor Response (%) of Co3O4 film measured by 3 different setups under exposure to 120–2600 ppb O3, at room temperature.
Chemosensors 10 00266 g007
Figure 8. Electrical current variation of Co3O4 sensor measured by three different setups towards 120–2600 ppb O3, at room temperature, after three months from its initial measurements.
Chemosensors 10 00266 g008
Figure 9. Representative model for O3 gas sensing mechanism of Co3O4 film, at room temperature.
Chemosensors 10 00266 g009
Table 1. Current resolution, low detection limits, O3 resolution and sensitivity of Co3O4 sensor setups.
SetupCurrent Resolution (μA)Low Detection Limit (ppb) O3 Resolution (ppb)Sensitivity (μA/ppm)
Lab0.00180.500.0101102.72
Arduino4.8109.738.125892.81
STM320.885.900.762875.84
Table 2. Specifications of Co3O4 and COTS ozone sensors.
SensorVoltage Supply (V)Min Consumption (μW)Μax Consumption (μW)Pre-Heat NeededLower Detection Limit (ppb)Sensitivity (μA/ppm)O3 Resolution (ppb)
Co3O4 Keithley Setup3.3127.71744.81No80.50102.720.0101
Winsen MQ1315900,000-Yes10--
Spec 3SP_O3_20-1050No<200.06 ± 0.1<20
Spec ULPSM-O3 968-0463.31545No100-<100
Winsen ME3-O3---No2000.60 ± 0.15200
Winsen ME2-O3---No<20 ppb≥0.030<020
Table 3. Specifications of MCU-based sensors.
SensorVoltage Supply (V)Min Consumption (μW)Μax Consumption (μW)Pre-Heat NeededLower Detection Limit (ppb)Sensitivity (μA/ppm)O3 Resolution (ppb)
Co3O4 Arduino Uno Setup3.315637No109.7392.818.1258
Co3O4 STM32 Setup3.32.6390No85.9075.840.7628
Spec DGS-O3 968-0423.310014,000No20-20
Table 4. Summary of MOS ozone sensors.
Sensing MaterialVoltage Supply (V)Operating Temperature (°C)O3 Detection Limit (ppb)O3 ResponseResponse, Recovery TimeRef.
Co3O4 Keithley Setup3.32512013% a10 minPresent work
Co3O4 -8510003.13 b15 s, -[18]
Co3O4 -852000-25 s, 45 s[21]
NiCo2O4120028~0.3% c32 s, 60 s[31]
Zn0.95Co0.05O1250200.4 b46 s, 62 s[32]
CuAlO212502001.4 b25 s, 39 s[33]
Cu2O10251028% a30 s, 24 s[34]
NiO:Al1080102.55 c189.6 s, 243.6 s[35]
a [(Igas − Iair)/Iair] × 100%. b Rair/Rgas or Rgas/Rair. c [(Rair − Rgas)/Rair] × 100%.
Publisher’s Note: MDPI stays neutral with regard to jurisdictional claims in published maps and institutional affiliations.

