
Development and Optimization of Electrochemical Method for Determination of Vitamin C
by
 , ,
, ,
Ivana Škugor Rončević
1 ,
,
Danijela Skroza
2,
Ivana Vrca
2 ,
,
Ana Marija Kondža
3 and
Nives Vladislavić
1,* 1
Department of General and Inorganic Chemistry, Faculty of Chemistry and Technology, University of Split, Ruđera Boškovića 35, 21000 Split, Croatia
2
Department of Food Technology and Biotechnology, Faculty of Chemistry and Technology, Ruđera Boškovića 35, 21000 Split, Croatia
3
Faculty of Chemistry and Technology, University of Split, Ruđera Boškovića 35, 21000 Split, Croatia
*
Author to whom correspondence should be addressed.
Chemosensors 2022, 10(7), 283; https://doi.org/10.3390/chemosensors10070283
Submission received: 15 May 2022
/
Revised: 7 July 2022
/
Accepted: 13 July 2022
/
Published: 15 July 2022
(This article belongs to the Special Issue Chemosensors and Biosensors for Food Quality and Safety)
Abstract
:The focus of this work was to develop a simple electrochemical method for the determination of vitamin C (VitC) by using a specially constructed microelectrode made from pyrolytic graphite sheet (PGS). A procedure for quantifying VitC in a real sample was established. VitC shows a single quasi-reversible reaction. The method was optimized, and analytical determination was performed by using cyclic voltammetry and square wave voltammetry for electroanalytical purposes. The obtained results show a linear response of the PGS electrode in a wide concentrations range. For the lower concentration range, 0.18–7.04 µg L−1, the sensitivity is 11.7 µAcm−2/mgL−1, while for the higher concentration range, 10.6–70.4 µg L−1, the sensitivity is 134 µAcm−2/mgL−1, preserving the linearity of 0.998 and 0.999. The second objective was to determine the effect of the addition of five different types of “green” biowaste on plant growth, VitC content, and antioxidant activity in arugula (Eruca sativa L.) using the developed method. After three weeks of cultivation, small differences in growth and large differences in certain nutritional characteristics were observed. The addition of black coffee makes the soil slightly alkaline and causes a significant increase in VitC content and antioxidant activity.
1. Introduction
Free radicals, oxidants, oxidative stress, and antioxidants are concepts we have often encountered in the last twenty years. Oxidants and free radicals can play a dual role, being both beneficial and toxic compounds. Oxidative stress is caused by their excessive accumulation, which the body cannot remove, and can lead to the development of degenerative and chronic diseases, such as cancer, neurodegenerative and cardiovascular diseases, aging, autoimmune disorder, and rheumatoid arthritis [1]. Free radicals are short-lived molecules with an unpaired electron and, therefore, very reactive and unstable. The term free radicals most often refers to RNS-reactive nitrogen compounds and ROS-reactive oxygen species [2]. These are contained in environmental pollutants, such as cigarette smoke and car exhaust; they also occur in the body after exposure to infections, harmful chemicals, radiation, and consumption of various drugs; they also occur via nutrition. Otherwise, the amount of free radical formation is negligible.
Antioxidants play an important role in the body, being produced in normal physiological processes (during aerobic cellular respiration), and their production and intake must be balanced during exercise or disease when the free radical production is increased. When the antioxidant is present in the cell in the appropriate amount, it reacts with free radicals and is responsible for cell regeneration. VitC, also known as ascorbic acid, belongs to the class of organic compounds called butenolides. It has all the properties of a perfect antioxidant, protecting the cells of most aerobic organisms from the damage caused by the reactive molecules, cellular metabolism, and exposure to pollutants and toxins. VitC also prevents the oxidation of other molecules by donating electrons to free radicals and needing an electron to form a stable radical, thus reducing their reactivity. The ascorbic acid protects biomolecules (proteins, carbohydrates, lipids, and nucleic acids) from the damage caused by oxidants. It also reduces tocopheroxyl radicals and is effective in the regeneration of vitamin E [3,4,5]. In the presence of ions, such as copper and iron, it plays the role of a prooxidant, creating hydroxyl radicals that lead to the oxidation of DNA, lipids, or proteins [1]. For example, Fe3+ is reduced to Fe2+ by ascorbate, which can be re-oxidized to produce H2O2, superoxide, and hydroxyl radicals. In general, VitC will have a prooxidative effect at low concentrations and antioxidant effect at high concentrations [6,7].
A large number of methods for the determination of VitC and antioxidant capacity was described in the literature (fluorimetric titrimetric, chromatographic, and spectrophotometric methods) [8,9,10,11]. The electrochemical/voltammetric method can be used for the same purpose [12,13,14,15,16,17,18,19,20,21], even in complex matrices [22,23,24,25,26,27]. Consequently, the comparative studies have also been reported [28,29,30,31,32,33]. All methods have one premise in common: the direct or indirect determination via redox reaction, i.e., reactions for evaluation of VitC content or antioxidant activity are based on a redox reaction of antioxidants (or reducing agents) and free radicals, such as OH•, RO•, and ROO•. Classical analytical methods suffer from some disadvantages that make them unsuitable for routine analysis.
The optimization of the electrochemical methods and development of sensors for the rapid and accurate evaluation of antioxidant activity, total phenol evaluation, and VitC content in samples (VitC can be electrochemically oxidized) have become more frequent in the literature in the last decade. Addditionally, voltammetric methods can provide important information to elucidate the oxidation mechanism of biomolecules. Different modified electrodes have been fabricated based on carbon materials, metals, metal oxides, polymers, and DNAs, etc. (Table 1). The electrodes made of carbon materials can significantly improve the electroanalytical properties of sensitive layers essential for electroanalytical application, due to their low ohmic resistance. Graphite, glassy carbon, carbon paste, graphene, or carbon nanotubes also provide a variety of modification options that are often used to develop highly sensitive sensors for the study of electrochemical properties and give opportunity for detection of organic and inorganic compounds. [18,34,35].
The electrochemical methods for the determination of VitC are summarized in Table 1. The design and modification of carbon materials for the preparation of electrochemical sensors significantly affects the catalytic activity of the electron transfer. The lower detection limit, higher sensitivity, and wider linear range may be obtained at the pyrolytic graphite sheet (PGS) electrode without modification, which significantly shortens the duration of the analysis and costs, making the method environmentally friendly, when compared to others.
However, to the best of our knowledge, there is no report on a PGS usage in a direct determination of VitC. Hence, in this paper, we described the development of an analytical method for the determination of VitC by square wave voltammetry (SWV) using unmodified PGE. Pyrolytic graphite has attracted much attention for application in scientific disciplines, especially in the fabrication of biosensors, nanoelectronics, and photodetectors, as well as in the industry of batteries, due to its excellent characteristics [36]. In sensors, it acts as a sensory layer, providing excellent thermal and electrical conductivity, compactness, mechanical strength, and potentially low cost. It makes this material a perspective carbon material for application in the electrochemical detection of molecules [37].
The first objective of this paper was to optimize the parameters of the electrochemical method for the determination of VitC with a specially constructed microelectrode made from the PGS. Cyclic voltammetry (CV) was used to characterize the microelectrode and study the mechanism of VitC oxidation on the PGS electrode, while square wave voltammetry (SWV) was used for electroanalytical purposes. The procedure has been applied satisfactorily for the determination of VitC in six prepared biological samples. The biological samples were prepared from raw arugula (Eruca sativa L.) cultivated in soil with different types of “green” biowaste. The specific objective of this work was to determine the effect of the addition of different types of “green” biowaste [38] on the growth, VitC content, and antioxidant activity by using the established procedure with a PGS electrode. The method is simple, rapid, and sensitive, and no pre-separation procedures were required for the analysis of VitC.
2. Materials and Methods
2.1. Reagents and Solutions
All solutions were prepared from analytical grade chemicals by dissolving the appropriate mass of the pure substance in distilled or ultrapure water. The VitC solutions were freshly prepared before measurement (1.0 mg/mL or 5.7 mM), due to their instability.
2.2. Preparation of Working Electrode—Microelectrode from Pyrolytic Graphite Sheet
The PGS used to make electrode (PGS-Panasonic EYGS121803 Thermal Interface Products), purchased from Panasonic, is synthetically made from a highly oriented graphite polymer film, which is very thin, light, has excellent thermal conductivity, electrical conductivity, and heat resistance (up to 400 °C); this makes it an excellent material for the production of electronic assemblies, as well as sensor development. The material is extremely flexible and can be easily cut into customizable shapes [50]. In a cross-section of sheet there are approximately 75,000 graphite surfaces. The cut sheet, with a dimension 40 × 3 mm and 25 µm thick, was poured into an epoxy resin body and air-dried for 24 h. The cross-section of the PGS electrode, thus, gave a microelectrode with a sensitive surface area 7.4 × 10⁻⁴ cm2 (Scheme 1). Before the measurement, mechanical treatment of the electrode surface was performed (fine sandpaper and polishing with alumina powder down to 0.05 μm) to achieve a uniform surface, rinsed with distilled water, cleaned in an ultrasonic bath, and dried on air. Considering the above mentioned, we propose the pyrolytic graphite sheet (PGS) as a suitable graphite substrate for electroanalytical purposes.
2.3. Scanning Electron Microscopy end Energy Dispersive Spectroscopy Analysis of PGS Electrode
PGS electrode were visually characterized by high-definition scanning electron microscopy (SEM) with energy-dispersive spectroscopy (EDS) analysis. Observation and imaging were performed using a scanning electron microscope (JEOL JSM-7610F Plus) at 0.5 kV SEI (Figure 1). Figure 1a shows the lamination of corrugated layers much less than 1 μm thick. The PGS surface was evaluated with ImageJ software. A cross-sectional view is generated from the SEM image and presented as the ZY or ZX planes. The images show smooth and uniform surface with visible layers of graphite, which significantly increases the active surface of the material. The energy-dispersive spectroscopy (EDS) analysis (Figure 1c) showed pure carbon material with no impurities or oxides in the matrix. PGS is a very thin graphite sheet that is 25 μm in thickness with a highly-oriented single-crystal-like structure made from stacked thin polymer films.
2.4. Preparation of Real Sample
For research purposes, the arugula seeds were purchased in local store.
The arugula seeds were sown in biodegradable cardboard containers in 6 different substrates, where 1/2 of the soil was replaced with a mixture of a certain biotope and soil in a ratio of 1:1. The selected biowaste is: peanut shell, banana and kiwi peel, chopped paper towels, crushed eggshells, and coffee grounds; the sixth substrate was the reference in the soil without additives, i.e., control sample. Germination of arugula was carried out indoors with a constant temperature, while growth was carried out outdoors for three weeks. After this period, the plants were cut to ground level, and on the same day they were determined the content of Vitamin C, total phenols, and antioxidant activity.
Real samples were prepared by extracting 2 g of plant material in 20 mL of redistilled water or 10 g of plant material in 100 mL of redistilled water or a ratio of 1:10.
2.5. Real Samples Measurements
Voltammetric determination of VitC. In order to evaluate the analytical applicability of the proposed method, established procedure was applied for the detection of VitC in real samples. Electrochemical measurements were carried out via potentiostat (Autolab PGSTAT 302N), connected to PC, and driven by GPES 4.9 software (Eco Chemie, Utrecht, The Netherlands). An electrochemical cell with three electrodes was used with Ag/AgCl/3M KCl as reference; Pt wire as auxiliary and PGS as working electrodes were used. All experiments were carried out at 25 °C.
Determination of VitC using redox titration. This method determines the vitamin C concentration in a solution by a redox titration using iodine. As the iodine is added during the titration, the ascorbic acid is oxidized to dehydroascorbic acid, while the iodine is reduced to iodide ions, according to Equation (1) [51]:
C6H8O6 + I3− ↔ C6H6O6 + 3I− + 2H+
In presence of starch as indicator, when all ascorbic acid has been oxidized, the excess iodine is free to react with the starch indicator, thus forming the blue-black starch-iodine complex. Due to the sluggishness of the eye and colored specimens, it is sometimes difficult to notice the end point of the titration.
Antioxidant activity and total phenol content were evaluated with an Agilent Cary 5000 UV–VIS spectrophotometer, with the power of a deuterium light source and quartz cuvette 1 cm (10 mm optical path length, 2.8 mL) was used for all experiments.
Determination of total phenols. Total phenols are determined by the Folin–Ciocalte method. The method is spectrophotometric and is based on the oxidation of phenolic groups via the addition of Folin–Ciocalteu reagent and formation of a colored product. Staining intensity is measured by determining the absorbance at 765 nm, relative to the blank [52].
Determination of antioxidant activity by FRAP method. FRAP (ferric reducing/antioxidant power) is a simple, one of the most widely used methods to measure the antioxidant activity (reducing power) of the samples, based on the ability of the sample to reduce Fe3+ to Fe2+ ions. At low pH, in the presence of TPTZ (ferric-tripyridyltriazine, Fe3+-TPTZ), complex is reduced to the ferrous (Fe2+-TPTZ) form, with the formation of an intense blue color. The results of reducing activity of the samples were monitored at 592 nm at different time intervals (4 and 10 min) and expressed in µM of Trolox equivalents (µM TE/g of sample.) [53,54,55]. Increased absorbance of the reaction mixture indicates an increase of reduction capability. The samples were measured in triplicate.
3. Results
3.1. Electrochemical Behavior of PGS Electrode
The electrolyte imparts a significant influence on the kinetics and thermodynamics of electron transfer. The processes of carbonaceous electrodes are complex, and it is crucial to choose an appropriate electrolyte that does not affect the electrode material. Irreversibility or partial reversibility in electrochemistry is significantly more prevalent than reversibility, especially for potentially reactive media and bioorganic redox couples. Oxidative or reductive degradation and reactions with the solvent, depleting the electrochemically produced species at the surface of the working electrode, strongly affect the recorded cyclic voltammograms, making them “asymmetric” and suggesting incomplete or multiple reactions.
In order to characterize the electrode material and investigate the reduction and oxidation processes, cyclic voltammograms of PGS electrode in different electrolyte were recorded, and the results are presented in Figure 2. All electrolytes were bulk concentrations (0.1 M), and the selected electrolytes are phosphate buffer solutions (pH 2) and acetate buffer solutions (pH 4.5) in pure solutions of KNO3 (pH 7) and phosphate buffer solutions (pH 9.6); a potential scan rate of 25 mVs−1 was applied.
The recorded cyclic voltammograms start from zero potential in the cathodic direction (in the range between hydrogen evolution reaction, HER, and oxygen evolution reaction, OER), thus showing an increase in the cathodic and anodic current at potentials lower than −0.2 V and higher than 0.6 for all selected electrolytes under given conditions. The kinetics of the cathodic HER is controlled by electrolyte composition and kinetic parameters and depends on the diffusion of species to the electrode. The reduction of the electrode material at the potential of approximately −0.5 V is typical for all observed electrolytes and not dependent on the pH value. Cathodic reactions can be attributed to the simultaneous HER and/or the reduction of the oxidized species, sequentially after an anodic cycle. In the phosphate buffer solution, at pH 2, the highest background currents recorded on the PGS electrode were observed. From the voltammograms, it can be concluded that the reactions of the electrode material are incomplete at pH 2. The anodic branch indicates the oxidation of PGS, which results in the formation of groups with oxygen atoms—hydroxo, carboxy, or keto groups. In the acetate buffer solution, at pH 4.5, the high background currents and redox reaction of electrode are noticed. In phosphate buffer solutions (pH 9.6), the anodic and cathodic reactions of the electrode material are catalyzed and completed. Therefore, the presence of background redox processes may also affect the response, which is not preferable in the electroanalysis. This result shows that KNO3 is a suitable electrolyte for electrochemical application, due to its low background current.
3.2. The Redox-Reaction of VitC at PGS Electrode
VitC is oxidized to dehydroascorbic acid by releasing two electrons and two protons [1,56], but the mechanism of oxidation of ascorbic acid to dehydroascorbic acid, as well as the influence of the media on the reversibility of this reaction [57,58], can be deciphered by electrochemical studies.
The hydroxyl groups of VitC are sensitive to oxidation, forming a keto-derivative. The overall reaction of ascorbic acid oxidation (Figure 3) can be expressed by the following two-electron reaction [59]:
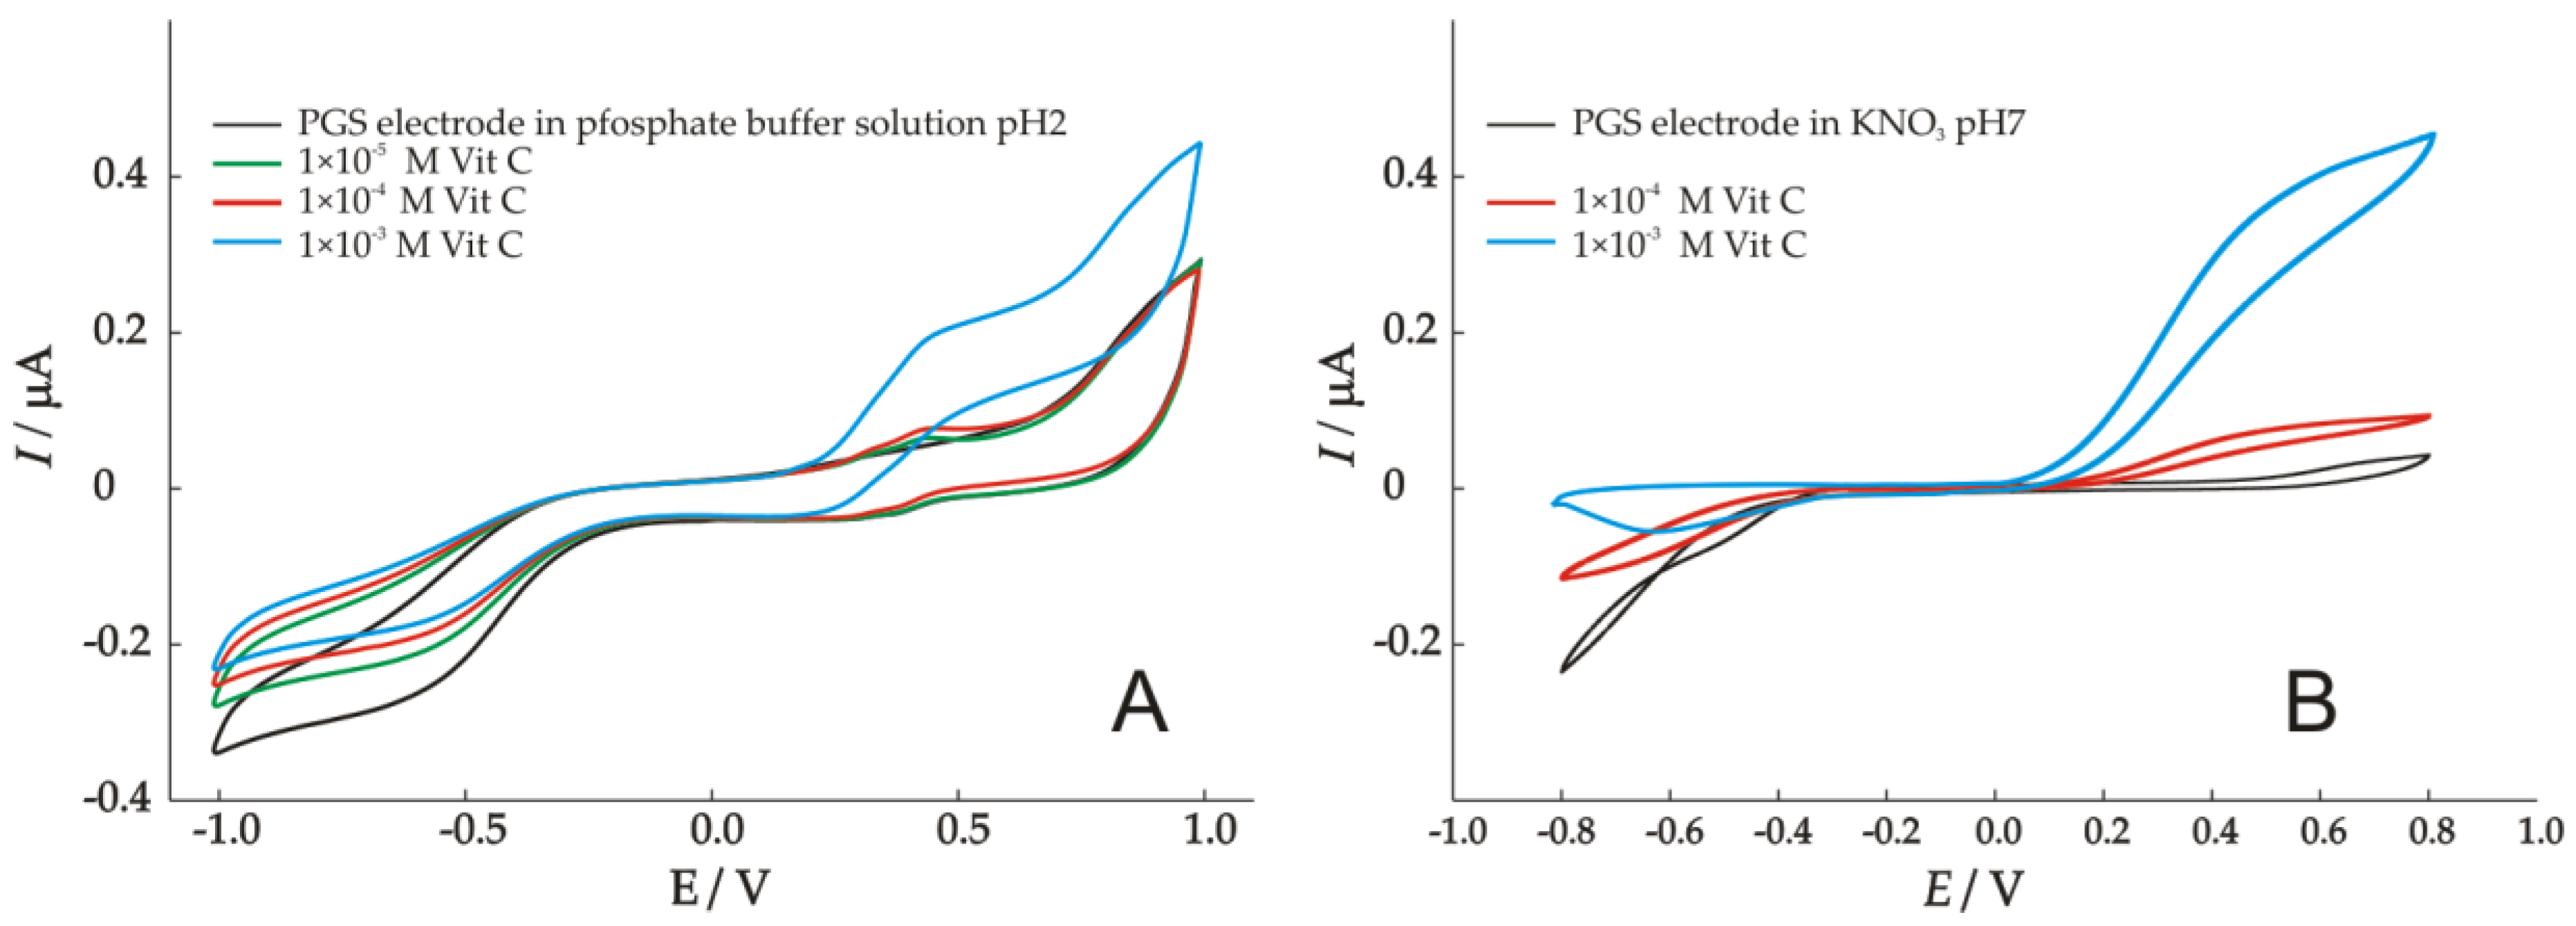
The electrochemical properties of VitC were studied in the beginning by cyclic voltammetry in the potential range from −1.0 to 1.0 V or from −0.8 to 0.8 V, depending on the electrolyte. Figure 4 shows a cyclic voltamogram of VitC, recorded with a potential change of 25 mV s−1, in a solution of phosphate buffer at pH 2 and KNO3 at pH 7. According to our previous work [60], some phenolic compounds present in biological samples can strongly interfere with electrochemical oxidation at almost the same potential as VitC in an acidic medium, due to ionization of the species at low pH value. The instability of VitC in alkaline solution and catalytic current decrease over time at higher pH cause the reproducibility of electroanalytical measurements to be poor. Therefore, the alkaline medium is excluded from the study.
Cyclic voltammograms obtained at the PGS electrode in all solutions, in the absence and presence of different VitC concentrations, show that the successive addition of analyte increases the anodic current, according to the presented reaction (Figure 3).
In phosphate buffer solution at pH2, the cyclic voltammograms show one redox current pair at potential Ea = 0.44 V. By scanning in a negative direction (after oxidation of VitC), a broad cathodic peak, Ec, appeared at around 0.35 V, corresponding to a reversible redox reaction of ascorbic/dehydroascorbic acids. As can be observed at higher concentrations of VitC at the selected scan rate, the oxidation reaction is completed, taking place simultaneously with the oxidation of the electrode material. The oxidation potential depends on the analyte concentration, which is clearly manifested in the potential at which the anode current starts to increase.
In KNO3 solution, a cyclic voltammogram shows one anodic current peak at potential Ea = 0.46 V, corresponding to the oxidation of ascorbic acid to dehydroascorbic acid. At higher concentrations of VitC at the selected scan rate, the oxidation reaction is incomplete and takes place together with the oxidation of the electrode material. The high concentration of VitC may cause the oxidation of the electrode material, and this influence will be investigated in further studies. The enzymatic oxidation of ascorbic acid by ascorbate oxidase in principle is a reversible reaction [1,3,4,6]. At the same time, the irreversible mechanism has been observed in the literature for electrochemical studies, and an overview is given in Table 1 (ascorbic acid at pH 6–7). The cathodic peak (Figure 4B), under the given conditions, was not observed, even at the highest concentration of VitC, which suggests an irreversible reaction, in accordance with the literature data for the redox reaction of ascorbic/dehydroascorbic acids [13,14].
In order to elucidate the mechanism of VitC oxidation, cyclic voltammograms were recorded in phosphate buffer solution at pH 2 and KNO3 at pH 7, with different potential scan rates in the presence of VitC (Figure 5).
The cyclic voltammograms show one anodic precursor, which is slightly observed only at a higher scan rate at pH 2 and manifested in the asymmetric shape of the anodic current wave at pH 7. These observations suggest possible adsorption of VitC to the PGS electrode surface. An increase of potential scan rate at all pH values induced a corresponding increase in peak current and resulted in a shift of oxidation potential to more positive values.
In phosphate buffer solution, at the reverse part of cycle, the cathodic peak potentials shifted towards positive values with increases in the scan rate, which corresponds to the reduction of dehydroascorbic acid to ascorbic acid. The obtained results demonstrate a single quasi-reversible reaction involving the transfer of two electrons, according to reaction given in Figure 2 [59]. The enhanced anodic and cathodic peak currents and smaller peak-to-peak separation, with increases in the scan rate, indicated good catalysis ability of PGS and faster electron transfer of VitC. Additionally, recorded voltammograms in phosphate buffer after 20 cycles (not shown) show a decrease in the anode peak current by more than 20%, which indicates and confirms the unfavorable effect of acidic medium on VitC oxidation.
In KNO3 solution at pH 7, only a slight change in the CV response in the return region of the anodic branch was observed around 0.1 V, with no current peak, suggesting an irreversible electrochemical reaction and kinetic limitation of the reaction.
The effect of the scan rate on the electrochemical oxidation of VitC is presented as an insert in Figure 5B and calculated for 500 µM concentrations of VitC in KNO3 solution at pH 7. Linear dependence Ia − ν1/2 is typical for a diffusion-controlled process. The mathematical expression that describes the dependence, shown in detail in Figure 5B/left, is as follows: Ia = 13.1 ν1/2. A high slope value suggests that an electron transfer may occur not only through a free diffusion, but also through a surface-absorbed species. Additional support for the preceding statement arises from the logarithm of a current peak vs. logarithm of scan rate plots. The slope of logarithmic dependence may be from 0.5 to 1.0:0.5 for pure diffusion, 1.0 for pure adsorption, and between 0.5 and 1.0 suggests that the process is simultaneously controlled by the diffusion and adsorption [60,61,62,63]. As shown, in Figure 5B/right, dependence on the anodic process was found to be linear, with a slope of 0.496. The mathematical expression that describes the dependence, shown in detail, is as follows: −log(Ia/mA) = 0.496(−logν/Vs−1) + 1.88 for a process under pure diffusion control [63].
Although the literature data showed the most commonly used electrolyte to be a phosphate buffer, the obtained results in our work prevent its analytical usage.
3.3. Electroanalytical Determination of Vit C by SWV
SWV measurements for the determination of VitC were also performed in all selected electrolytes (phosphate buffer solution (0.1 M, pH 2); acetate buffer solution (0.1 M, pH 4.5); KNO3 (0.1 M, pH 7); phosphate buffer solution (0.1 M, pH 9.6)). The results show, again, that KNO3 was a suitable electrolyte for electrochemical application. The electrolyte is selected to enable the study of the desired reaction on the electrode, originating from the selected analyte, without the influence of side effects, i.e., the simultaneous reaction of the electrode material (Figure 2). Other electrolytes show a negative influence on the electrode material.
The experimental conditions for measurements, with respect to the potential and time of accumulation and parameters for SWV, were optimized. To establish measurement procedures, an appropriate amount of VitC (solution containing 10.6 mg/L (0.1 mM)) was added to the selected electrolyte, 0.1 M KNO3 solution, and the effect of the initial potential (starting from 0 V) was performed in the stirred solution for 60 s, as well as 60 s in quiescence electrolyte. The peak signal increases with a decrease of potential, down to Eacc = −0.300 V, while the lower potential shows higher, but broader, peak signals. The time of accumulation for this concentration did not significantly affect the signal peaks. So, the chosen accumulation time is tacc = 120 s, with 60 s with electrolyte stirring and 60 s in the quiescence electrolyte. The recording range was −0.30–0.80 V, with a potential scan frequency (f) of 8 Hz, pulse height (ΔEp) of 200 mV, and potential increase (ΔEs) of 5 mV. Under these conditions, we ensured a good electrode response and high sensitivity and reproducibility of the measurements.
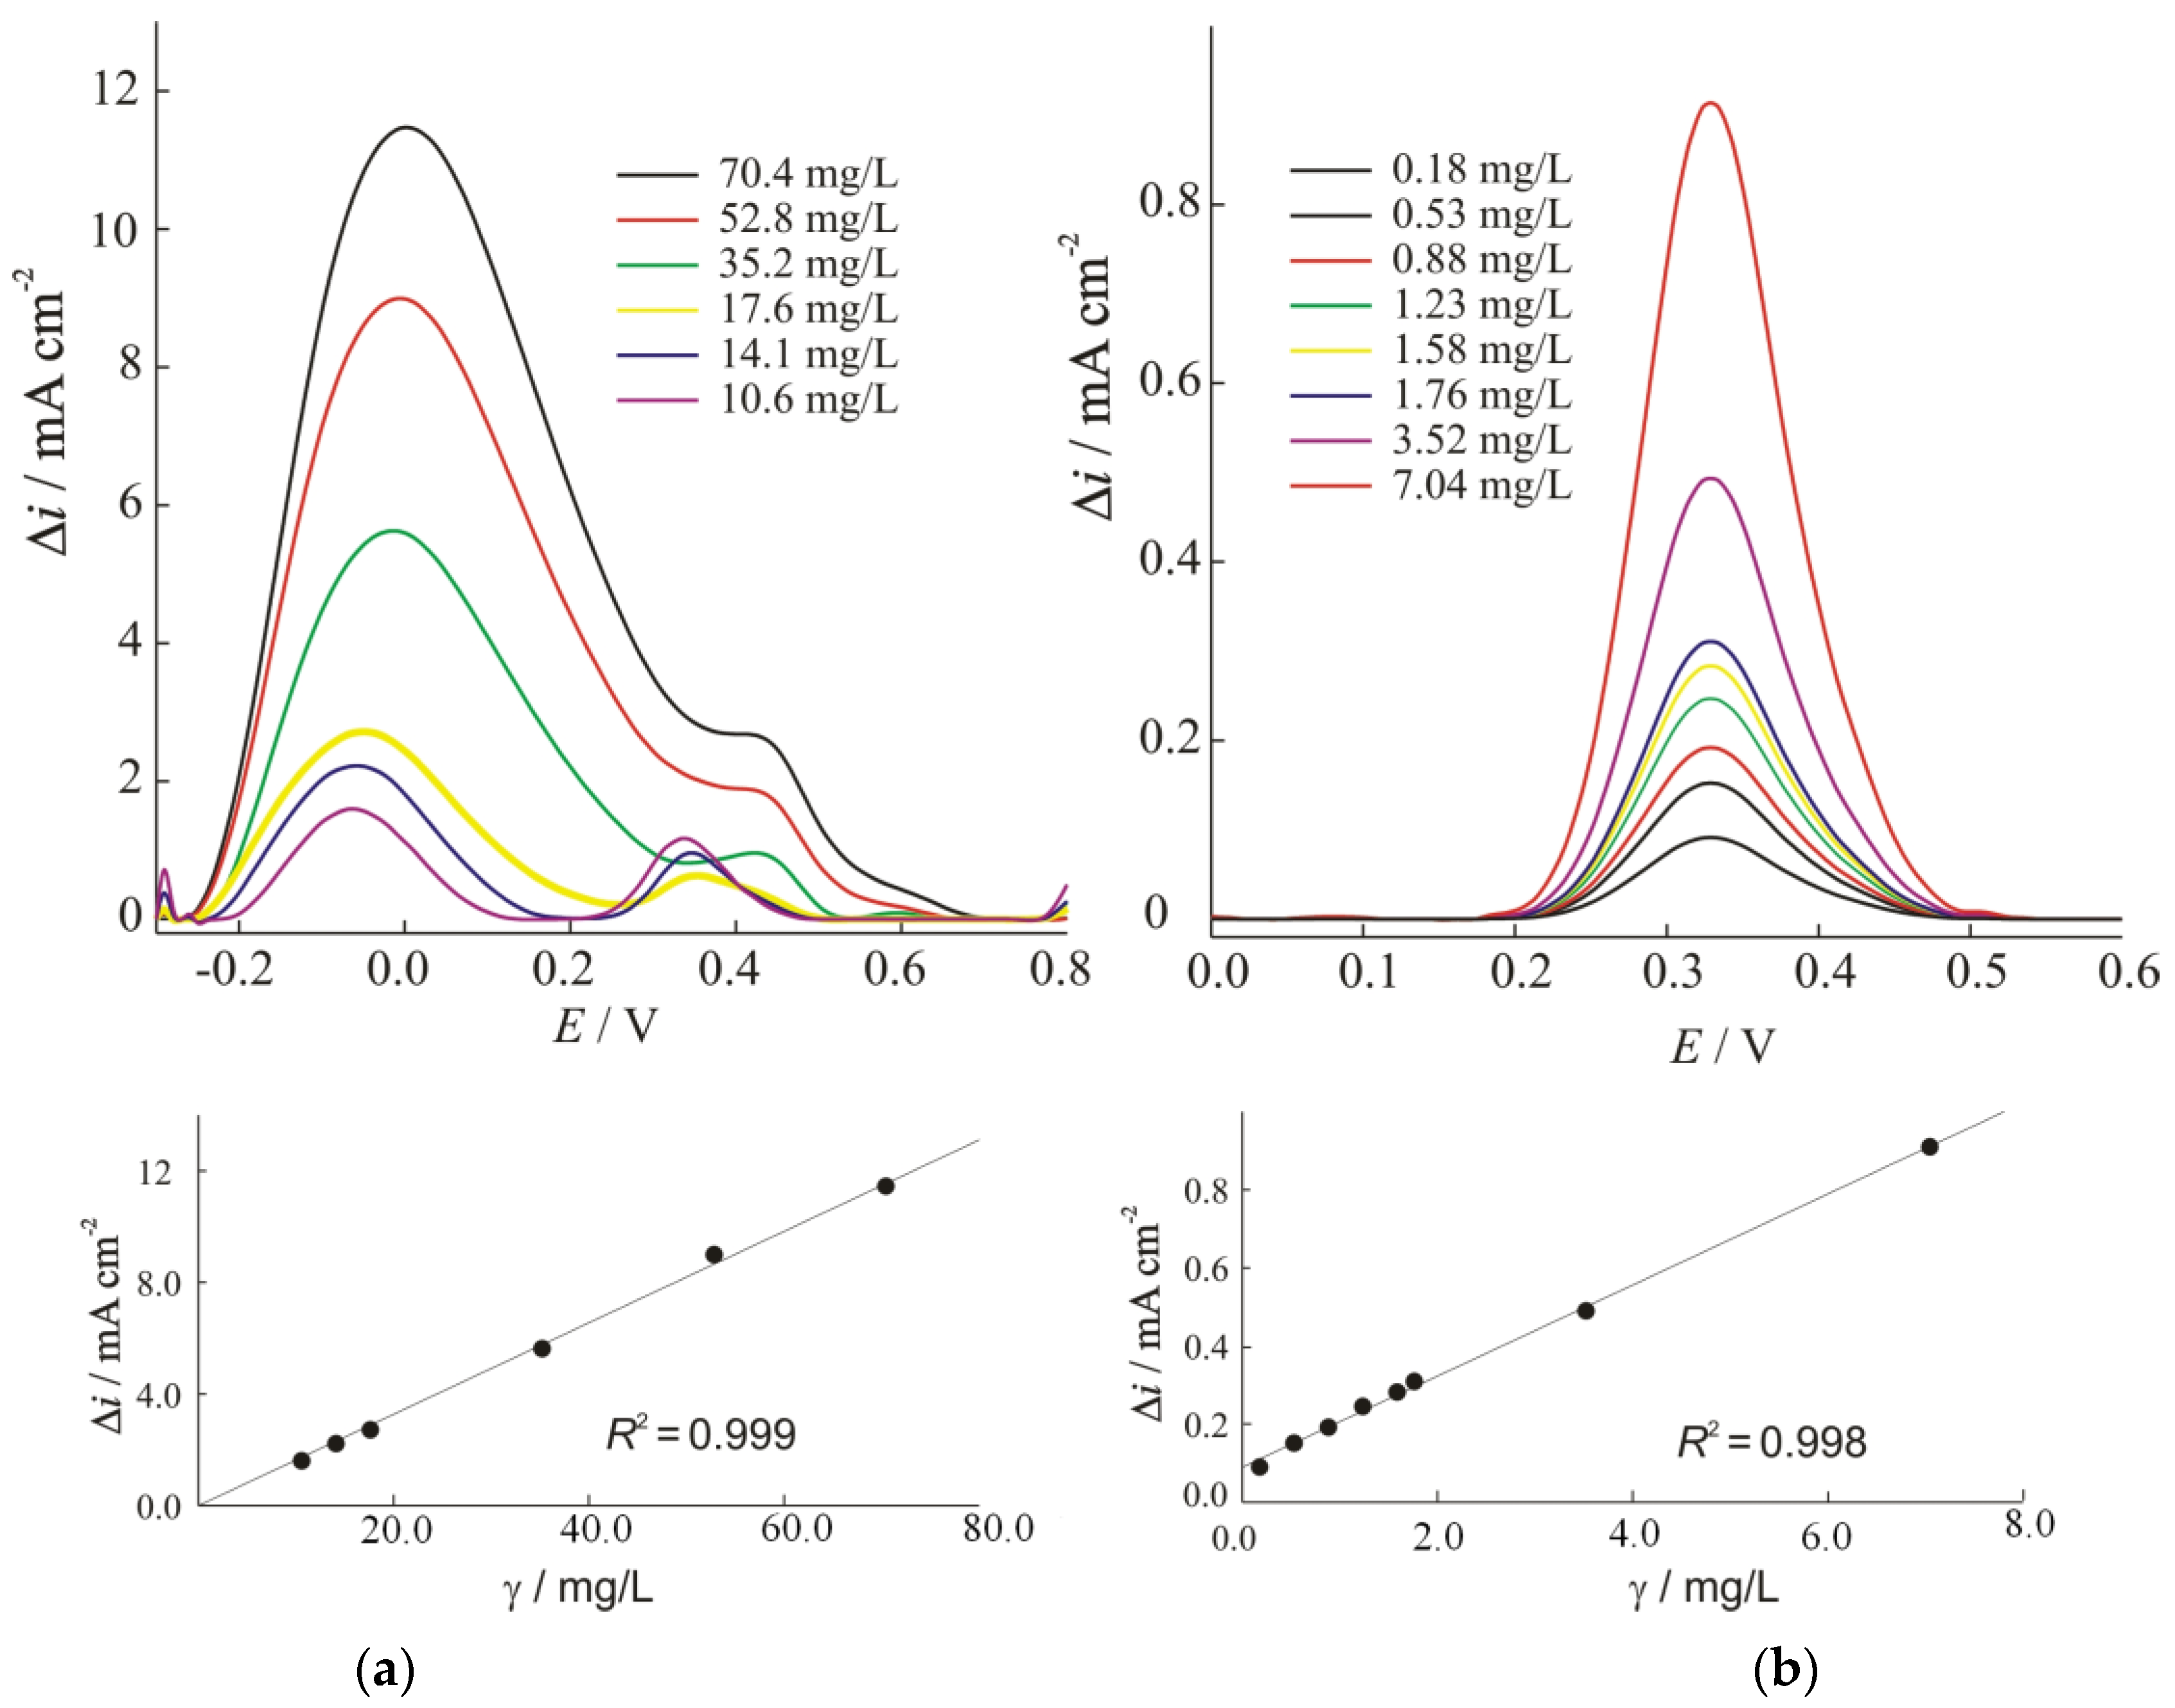
The results of SWV in the presence of different concentrations of VitC standard solution are shown in Figure 6, with the corresponding calibration graphs as inset. Voltammograms were obtained by the standard addition method. The calibration graphs were obtained by subtracting the background current from the corresponding voltammograms. As can be seen from the presented results, two different linear regions were obtained, relevant to the concentration of analyte. For the lower concentration range (Figure 6b), 0.18–7.04 mg/L, the sensitivity was 11.7 µAcm−2 per unit of mass concentration (mg/L), while, for the higher concentration range (Figure 6a), 10.6–70.4 mg/L, the sensitivity was 134 µA cm−2 per unit of mass concentration (mg/L). The linearity of both concentration ranges were excellent (R2 = 0.998 and 0.999). Even with the fact that high background current can cause the oxidation of electrode material, a linearity for higher concentration range was preserved.
Other observations are related to the existence of two peaks. For a higher concentration range (Figure 6a), the peak corresponding to VitC oxidation appears at 0.0 V, suggesting a facilitated oxidation process, without the need for preconcentration, and high catalytic electrode performance. When the concentration range is lower (Figure 6b), it shows a significant shift in the oxidation peak at 0.3 V and suggests a change in the oxidation mechanism with decreasing concentration. The same observation was verified by the ten times lower sensitivity for the same electrode with the same optimized parameters and can be attributed to the kinetic limitation of the processes at the electrode, related to the concentration of the species in the solution, since a pH value of the analytical solution is slightly lower in the presence of higher VitC concentration, and the protons are involved in the electrode reactions.
A limit of detection (LD) of 0.070 mg/L and limit of quantification (LOQ) of 0.130 mg/L were calculated according to the 3 × sb/m and 10 × sb/m criterion (sb is the standard deviation of intercept and m is the sensitivity), respectively. Significantly lower sensitivity for the lower concentration range was observed and can be a consequence of a slow and insufficient adsorption, due to the shorter accumulation time. Sensitivity can be increased by prolonging the accumulation time for low-concentration samples; however, in this case, there is also the possibility of an increase in other potential interferences. The short accumulation time favors the selectivity of the electrode towards VitC. The intraday reproducibility, measured as the percentage of relative standard deviation, was found to be 5% after 17 consecutive measurements of solution containing 10.6 mg/L (0.1 mM). The reproducibility of this electrode is excellent, as it does not require any pre-treatment or modification.
3.4. Analysis of Real Samples
After the optimisation of the methodology, all real samples were characterized, with regard to VitC content by SWV (Figure S1 in Supplementary Materials) and iodometric titration, as well as spectrophotometric measurements for the determination of total phenols and antioxidant activity after 4 min (fast antioxidants) and 10 min. The plant material, arugula (Eruca sativa L.), was cut to ground level after three weeks of outdoor cultivation (May 2021), and its visual characteristics were first assessed together with the monitored arugula growth, pH of the soil, and ambient temperature (Figure A1).
All results for the real samples are given in Table 2.
The VitC content, evaluated with two different methods, showed quite similar results; however, the VitC content determined with PGS electrode was higher for some samples. On the other hand, the starch is far from an ideal indicator for iodine, and the “shift” of the endpoint of equivalence is particularly pronounced, in case the analyte solutions used are colored or diluted. In our case, the deviation of the results is a consequence of slightly colored sample (green to slightly purple or brown), which can lead to an error in observing the equivalence point. The deviation is more pronounced at higher concentrations of VitC.
The extract of arugula cultivated on soil with the addition of peel of banana and kiwi, coffee ground, and control sample, with a higher content of VitC, showed a lower content of total phenols. These are unexpected and suggest the possible inability of the conventional FC assay to determine ascorbic acid selectively; additionally, the presence of a high concentration of ascorbic acid can cause interference in the determination of phenolic compounds, or the signal can be hampered [64,65]. Another possible reason is a reduction of some phenolic compounds with an antioxidant activity; the results for these samples are in line with the trend of an increase of total antioxidant activity. These observations indicate that the method is limited to samples with a lower VitC concentration or by the need to dilute the sample, in the case of a high concentration.
From the spectrophotometric measurements, we can see that the highest concentration of total phenols and antioxidant activity after 4 min (fast antioxidants) was present in Sample 4 in arugula cultivated with the addition of coffee grounds, while the lowest concentration was found in arugula cultivated with added eggshells. After 10 min, the antioxidant activity of almost all plant species followed the same trend. With the addition of peanut shell, which contributes to soil aeration, the fastest development of healthy and green Eruca sativa L. was observed. A graphic presentation of arugula characteristics after three weeks of outdoor cultivation is also presented in Appendix A as Figure A2.
4. Conclusions
As an electron donor, ascorbic acid is one of the most important low molecular weight antioxidants contributing to the total antioxidant capacity. The PGS electrode is a good material for electrochemical applications. In this paper, a preliminary study of the importance of PGS electrode for the determination of VitC is presented.
A simple and rapid electrochemical method for the qualitative and quantitative analysis of VitC was investigated. The results show that using PGS as electrode material without any modification can significantly reduce the analysis time. Square wave voltammetry (SWV), as a voltammetric method, offers the advantage of high sensitivity and absence of background signals. Optimized SWV is used in the electroanalytical determination, and the results for the obtained arugula samples planted on different substrates agree well with the classical determination methods at lower VitC concentrations in the sample. At higher VitC content in the sample, the results were slightly higher, compared to the standard method, thus indicating a possible reduction of some phenolic compounds with antioxidant activity. The results for these samples are consistent with the trend of an increase in overall antioxidant activity. Thus, the change in the oxidation mechanism was observed at a higher VitC concentration, in relation to the higher antioxidant activity. The PGS electrode used for the determination of real samples shows that the addition of black coffee grounds makes the soil slightly alkaline, which leads to a significant increase in VitC content, total phenols, and antioxidant activity and has a positive effect on the growth of arugula. The addition of eggshells to the substrate did not positively affect the growth or the content of VitC, total phenols, and antioxidant activity after a period of three weeks.
The proposed electrode and application of voltammetric methods require further intensive studies on the application and detection of antioxidants. Future challenges for the determination of VitC in food should focus on specificity, sensitivity, and reproducibility/repeatability.
Supplementary Materials
The following supporting information can be downloaded at: https://www.mdpi.com/article/10.3390/chemosensors10070283/s1, Figure S1: The non-subtracted voltammograms for the six examined real samples, from aqueous extracts of arugula.
Author Contributions
Conceptualization, N.V.; methodology, all authors; validation, all authors; formal analysis, N.V. and A.M.K.; investigation, all authors; resources, data curation N.V., I.Š.R., D.S. and A.M.K.; writing—original draft preparation, N.V.; writing—review and editing, all authors; visualization, N.V. and A.M.K.; project administration, N.V.; funding acquisition, I.Š.R. and N.V. All authors have read and agreed to the published version of the manuscript.
Funding
The results in this paper are funded by institution funds at Faculty of Chemistry and Technology, University of Split, Croatia.
Institutional Review Board Statement
Not applicable.
Informed Consent Statement
Not applicable.
Data Availability Statement
The data presented in this study will be available on request from the corresponding author.
Acknowledgments
The authors gratefully acknowledge contribution Ante Bilušić and Josipa Šćurla, from for the Department of Physics, Faculty of Science and Mathematics University of Split, Croatia, for their contribution in obtaining SEM–EDS images.
Conflicts of Interest
The authors declare no conflict of interest.
Appendix A
Selected green biowaste additives:
- Peanut shells contribute to soil aeration and water retention.
- Paper towels—help to aerate the soil and improve the ability to maintain plant life.
- Banana and kiwi peel—the biggest source of potassium in the diet of not only humans, but also plants, is banana peel. Potassium in the plant plays a significant role in enzyme activation and the regulation of cell membrane permeability. Plants well-supplied with potassium are resistant to the effects of drought and disease. Kiwi as one of the citruses that provides the plant with natural protection from pests.
- Coffee grounds promote soil fertility and improve the overall health of the plant, thanks to the nitrogen content.
- Eggshells decompose quickly; as they are rich in calcium and minerals, they will help microorganisms to better process biowaste and enrich the soil with calcium.
The plants grown on substrates with the addition of peal of bananas and kiwis and eggshells grew to almost the same height as without the additives. Plants grown on substrates with the addition of peanut shells, coffee grounds, and eggshells were healthier looking, compared to arugula grown on substrates with the addition of kitchen towels. The reason is most likely the addition of bleach used in the paper industry. The plant grown on the substrate with the addition of coffee grounds showed a slightly higher pH (addition of black coffee to grounds makes the soil slightly alkaline). Furthermore, the color of the plant was dark green, with an admixture of purple, and it is possible to conclude that the coffee grounds contribute to the growth of the content of the anthocyanin pigment purple, which changes color depending on pH.
Figure A1.
Graphic presentation of arugula characteristics and growing conditions after three weeks of outdoor cultivation.
Figure A1.
Graphic presentation of arugula characteristics and growing conditions after three weeks of outdoor cultivation.

Figure A2.
Graphic presentation of arugula characteristics after three weeks of outdoor cultivation. Mean value of (a) VitC determination by iodine titration. (b) Total phenolic compounds Folin–Ciocalteu reagents. (c) Antioxidant activity after 4 min FRAP method. (d) Antioxidant activity after 10 min FRAP method.

References
- Pehlivan, F.E. Vitamin C: An Antioxidant Agent; Hamza, A.H., Ed.; IntechOpen: London, UK, 2017. [Google Scholar]
- Moldogazieva, N.T.; Mokhosoev, I.M.; Feldman, N.B.; Lutsenko, S.V. ROS and RNS signalling: Adaptive redox switches through oxidative/nitrosative protein modifications. Free Radic. Res. 2018, 52, 507–543. [Google Scholar] [CrossRef] [PubMed]
- Bendich, A.; Machlin, L.J.; Scandurra, O.; Burton, G.W.; Wayner, D.D.M. The antioxidant role of vitamin C. Adv. Free Radic. Biol. Med. 1986, 2, 419–444. [Google Scholar] [CrossRef]
- Arrigoni, O.; De Tullio, M.C. Ascorbic acid: Much more than just an antioxidant. Biochim. Biophys. Acta Gen. Sub. 2002, 1569, 1–9. [Google Scholar] [CrossRef]
- Carr, A.C.; Maggini, S. Vitamin C and Immune Function. Nutrients 2017, 9, 1211. [Google Scholar] [CrossRef] [Green Version]
- Njus, D.; Kelley, P.M.; Tu, Y.-J.; Schlegel, H.B. Ascorbic acid: The chemistry underlying its antioxidant properties. Free Radical. Biol. Med. 2020, 159, 37–43. [Google Scholar] [CrossRef]
- Mandl, J.; Szarka, A.; Bánhegyi, G. Vitamin C: Update on physiology and pharmacology. Br. J. Pharmacol. 2009, 157, 1097–1110. [Google Scholar] [CrossRef] [Green Version]
- Tarrago-Trani, M.T.; Phillips, K.M.; Cotty, M. Matrix-specific method validation for quantitative analysis of vitamin C in diverse foods. J. Sci. Food Agric. 2012, 26, 12–25. [Google Scholar] [CrossRef]
- Contreras-Calderón, J.; Calderón-Jaimes, L.; Guerra-Hernández, E.; García-Villanova, B. Antioxidant capacity, phenolic content and vitamin C in pulp, peel and seed from 24 exotic fruits from Colombia. Food Res. Int. 2011, 44, 2047–2053. [Google Scholar] [CrossRef]
- Ahmed, S.; Rattanpal, H.S.; Gul, K.; Dar, R.A.; Sharma, A. Chemical composition, antioxidant activity and GC-MS analysis of juice and peel oil of grapefruit varieties cultivated in India. J. Integr. Agric. 2019, 18, 1634–1642. [Google Scholar] [CrossRef]
- Pisoschi, A.M.; Cimpeanu, C.; Predoi, G. Electrochemical Methods for Total Antioxidant Capacity and its Main Contributors Determination: A review. Open Chem. 2015, 13, 824–856. [Google Scholar] [CrossRef] [Green Version]
- Dong, Y.P.; Huang, L.; Zhang, J.; Chu, X.F.; Zhang, Q.F. Electro-oxidation of ascorbic acid at bismuth sulfide nanorod modified glassy carbon electrode. Electrochim. Acta 2012, 74, 189–193. [Google Scholar] [CrossRef]
- Pisoschi, A.M.; Pop, A.; Serban, A.I.; Fafaneata, C. Electrochemical methods for ascorbic acid determination. Electrochim. Acta 2014, 121, 443–460. [Google Scholar] [CrossRef]
- Pisoschi, A.M.; Pop, A.; Negulescu, G.P.; Pisoschi, A. Determination of Ascorbic Acid Content of Some Fruit Juices and Wine by Voltammetry Performed at Pt and Carbon Paste Electrodes. Molecules 2011, 16, 1349–1365. [Google Scholar] [CrossRef] [PubMed]
- Arabali, V.; Ebrahimi, M.; Abbasghorbani, M.; Gupta, V.K.; Farsi, M.; Ganjali, M.R.; Karimi, F. Electrochemical determination of vitamin C in the presence of NADH using a CdO nanoparticle/ionic liquid modified carbon paste electrode as a sensor. J. Mol. Liq. 2016, 213, 312–316. [Google Scholar] [CrossRef]
- Ly, S.Y.; Chae, J.I.; Jung, Y.S.; Jung, W.W.; Lee, H.J.; Lee, S.H. Electrochemical detection of ascorbic acid (vitamin C) using a glassy carbon electrode. Nahrun 2004, 48, 201–204. [Google Scholar] [CrossRef]
- Qian, L.; Gao, Q.; Song, Y.; Li, Z.; Yang, X. Layer-by-layer assembled multilayer films of redox polymers for electrocatalytic oxidation of ascorbic acid. Sens. Actuators B 2005, 107, 303–310. [Google Scholar] [CrossRef]
- Ngai, K.S.; Tan, W.T.; Zainal, Z.; Zawawi, R.M.; Zidan, M. Voltammetry Detection of Ascorbic Acid at Glassy Carbon Electrode Modified by Single-Walled Carbon Nanotube/Zinc Oxide. Int. J. Electrochem. Sci. 2013, 8, 10557–10567. [Google Scholar]
- Antolović, M.; Prenzler, P.D.; Patsalides, E.; McDonald, S.; Robards, K. Methods for testing antioxidant activity. Analyst 2002, 127, 183–198. [Google Scholar] [CrossRef]
- Pekec, B.; Feketeföldi, B.; Ribitsch, V.; Ortner, A.; Kalcher, K. Development of an electrochemical sensor for the determination of the total antioxidant capacity in berries based on boron doped diamond. J. Electrochem. Sci. Eng. 2013, 3, 1–9. [Google Scholar] [CrossRef]
- Rodríguez-Sevilla, E.; Ramírez-Silva, M.-T.; Romero-Romo, M.; Ibarra-Escutia, P.; Palomar-Pardavé, M. Electrochemical Quantification of the Antioxidant Capacity of Medicinal Plants Using Biosensors. Sensors 2014, 14, 14423–14439. [Google Scholar] [CrossRef]
- Yang, S.; Qu, L.L.G.; Yang, R.; Liu, C. Gold nanoparticles/ethylenediamine/carbon nanotube modified glassy carbon electrode as the voltammetric sensor for selective determination of rutin in the presence of ascorbic acid. J. Electroanal. Chem. 2010, 645, 115–122. [Google Scholar] [CrossRef]
- Jia, Z.; Liu, J.; Shen, Y. Fabrication of a template-synthesized gold nanorod-modified electrode for the detection of dopamine in the presence of ascorbic acid. Electrochem. Commun. 2007, 9, 2739–2743. [Google Scholar] [CrossRef]
- Zhu, S.; Li, H.; Niu, W.; Xu, G. Simultaneous electrochemical determination of uric acid, dopamine, and ascorbic acid at single-walled carbon nanohorn modified glassy carbon electrode. Biosens. Bioelectron. 2009, 25, 940–943. [Google Scholar] [CrossRef]
- Shakkthivel, P.; Chen, S.M. Simultaneous determination of ascorbic acid and dopamine in the presence of uric acid on ruthenium oxide modified electrode. Biosens. Bioelectron. 2007, 22, 1680–1687. [Google Scholar] [CrossRef]
- Li, Y.; Lin, X. Simultaneous electroanalysis of dopamine, ascorbic acid and uric acid by poly (vinyl alcohol) covalently modified glassy carbon electrode. Sens. Actuators B 2006, 115, 134–139. [Google Scholar] [CrossRef]
- Liu, A.L.; Zhang, S.B.; Chen, W.; Lin, X.H.; Xia, X.H. Simultaneous voltammetric determination of norepinephrine, ascorbic acid and uric acid on polycalconcarboxylic acid modified glassy carbon electrode. Biosens. Bioelectron. 2008, 23, 1488–1495. [Google Scholar] [CrossRef]
- Tortolini, C.; Tasca, F.; Venneri, M.A.; Marchese, C.; Antiochia, R. Gold Nanoparticles/Carbon Nanotubes and Gold Nanoporous as Novel Electrochemical Platforms for L-Ascorbic Acid Detection: Comparative Performance and Application. Chemosensors 2021, 9, 229. [Google Scholar] [CrossRef]
- Haque, M.A.; Morozova, K.; Ferrentino, G.; Scampicchio, M. Electrochemical Methods to Evaluate the Antioxidant Activity and Capacity of Foods: A Review. Electroanalysis 2021, 33, 1419–1435. [Google Scholar] [CrossRef]
- Chevion, S.; Roberts, M.A.; Chevion, M. The use of cyclic voltammetry for the evaluation of antioxidant capacity. Free Radical. Biol. Med. 2000, 28, 860–870. [Google Scholar] [CrossRef]
- Lino, F.M.A.; De Sá, L.Z.; Torres, I.M.S.; Rocha, M.L.; Dinis, T.C.P.; Ghedini, P.C.; Somerset, V.S.; Gil, E.S. Voltammetric and spectrometric determination of antioxidant capacity of selected wines. Electrochim. Acta 2014, 128, 25–31. [Google Scholar] [CrossRef]
- Blažević, J.; Stanković, A.; Šafranko, S.; Jokić, S.; Velić, D.; Medvidović-Kosanović, M. Electrochemical detection of vitamin C in real samples. Food Health Dis. 2020, 9, 1–8. [Google Scholar]
- Artega, J.F.; Ruiz-Montoya, M.; Palma, A.; Alonso-Garrido, G.; Pintado, S.; Rodríguez-Mellado, J.M. Comparison of the simple cyclic voltammetry (CV) and DPPH assays for the determination of antioxidant capacity of active principles. Molecules 2012, 17, 5126–5138. [Google Scholar] [CrossRef] [PubMed]
- Radhi, M.M.; Tan, W.T.; Rahman, M.Z.B.A.; Kassim, A.B. Voltammetric detection of Hg (II) at C60, activated carbon and MWCNT modified glassy carbon electrode. Res. J. Appl. Sci. 2010, 5, 59–64. [Google Scholar] [CrossRef] [Green Version]
- Brownson, D.A.C.; Foster, C.W.; Banks, C.E. The electrochemical performance of graphene modified electrodes: An analytical perspective. Analyst 2012, 137, 1815–1823. [Google Scholar] [CrossRef] [PubMed]
- Panasonic Industry. Available online: https://industrial.panasonic.com/ww/products/pt/pgs (accessed on 11 May 2022).
- Goyal, R.N.; Gupta, V.K.; Chatterjee, S. Voltammetric biosensors for the determination of paracetamol at carbon nanotube modified pyrolytic graphite electrode. Sens. Actua. B 2010, 149, 252–258. [Google Scholar] [CrossRef]
- Arya, S.S.; Venkatram, R.; More, P.R.; Vijayan, P. The wastes of coffee bean processing for utilization in food: A review. J. Food Sci. Technol. 2022, 59, 429–444. [Google Scholar] [CrossRef] [PubMed]
- Erdurak-Kiliç, C.S.; Uslu, B.; Dogan, B.; Ozgen, U.; Ozkan, S.A.; Coskun, M. Anodic voltammetric behavior of ascorbic acid and its selective determination in pharmaceutical dosage forms and some Rosa species of Turkey. J. Anal. Chem. 2006, 61, 1113–1120. [Google Scholar] [CrossRef]
- Greenway, G.M.; Ongomo, P. Determination of L-ascorbic acid in fruit and vegetable juices by flow injection with immobilised ascorbate oxidase. Analyst 1990, 115, 1297–1306. [Google Scholar] [CrossRef] [PubMed]
- Stergiou, D.V.; Diamanti, E.K.; Gournis, D.; Prodromidis, M.I. Comparative study of different types of graphenes as electrocatalysts for ascorbic acid. Electrochem. Commun. 2010, 12, 1307–1309. [Google Scholar] [CrossRef]
- Li, F.; Li, J.; Feng, Y.; Yang, L.; Du, Z. Electrochemical behavior of graphene doped carbon paste electrode and its application for sensitive determination of ascorbic acid. Sens. Act. B Chem. 2011, 157, 110–114. [Google Scholar] [CrossRef]
- De Faria, L.V.; Lisboa, T.P.; de Farias, D.M.; Araujo, F.M.; Machado, M.M.; de Sousa, R.A.; Costa Matos, M.A.; Abarza Muñoz, R.A.; Matos, R.C. Direct analysis of ascorbic acid in food beverage samples by flow injection analysis using reduced graphene oxide sensor. Food Chem. 2020, 319, 126509. [Google Scholar] [CrossRef] [PubMed]
- Habibi, B.; Jahanbakhshi, M.; Pournaghi-Azar, M.H. Differential pulse voltammetric simultaneous determination of acetaminophen and ascorbic acid using single-walled carbon nanotube-modified carbon–ceramic electrode. Anal. Biochem. 2011, 411, 167–175. [Google Scholar] [CrossRef] [PubMed]
- Zidan, M.; Tan, W.T.; Zainal, Z.; Abdullah, A.H.; Goh, J.K. Electrocatalytic Oxidation of Ascorbic Acid Mediated by Lithium doped Microparticles Bi2O3/MWCNT Modified Glassy Carbon Electrode. Int. J. Electrochem. Sci. 2010, 5, 501–508. [Google Scholar]
- Karimi-Maleh, H.; Arotiba, O.A. Simultaneous determination of cholesterol, ascorbic acid and uric acid as three essential biological compounds at a carbon paste electrode modified with copper oxide decorated reduced graphene oxide nanocomposite and ionic liquid. J. Colloid Interface Sci. 2020, 560, 208–212. [Google Scholar] [CrossRef]
- Wu, Y.; Deng, P.; Tian, Y.; Feng, J.; Xiao, J.; Li, J.; Liu, J.; Li, G.; He, Q. Simultaneous and sensitive determination of ascorbic acid, dopamine and uric acid via an electrochemical sensor based on PVP-graphene composite. J. Nanobiotechnol. 2020, 18, 112. [Google Scholar] [CrossRef]
- Kachoosangi, R.T.; Compton, R.G. A simple electroanalytical methodology for the simultaneous determination of dopamine, serotonin and ascorbic acid using an unmodified edge plane pyrolytic graphite electrode. Anal. Bioanal. Chem. 2007, 387, 2793–2800. [Google Scholar] [CrossRef]
- Wantz, F.; Banks, C.E.; Compton, R.G. Direct Oxidation of Ascorbic Acid at an Edge Plane Pyrolytic Graphite Electrode: A Comparison of the Electroanalytical Response with Other Carbon Electrodes. Electroanalysis 2005, 17, 1529–1533. [Google Scholar] [CrossRef]
- Graphene—What Is It? Available online: https://industrial.panasonic.com/ww/products/pt/pgs/documents (accessed on 11 May 2022).
- Satpathy, L.; Pradhan, N.; Dash, D.; Priyadarshini Baral, P.; Prasad Parida, S. Quantitative Determination of Vitamin C Concentration of Common Edible Food Sources by Redox Titration Using Iodine Solution. Lett. Appl. 2021, 10, 2361–2369. [Google Scholar] [CrossRef]
- Singleton, V.L.; Rossi, J. Colorimetry of total phenolics with phospho-molybdic-phosphotungstic acid reagents. Am. J. Enol. Viticul. 1965, 16, 144–158. [Google Scholar]
- Benzie, I.F.F.; Strain, J.J. The ferric reducing ability of plasma (FRAP) as measurement of “antioxidant power”: The FRAP assay. Anal. Biochem. 1996, 239, 70–76. [Google Scholar] [CrossRef] [Green Version]
- Skroza, D.; Generalić Mekinić, I.; Svilović, S.; Šimat, V.; Katalinić, V. Investigation of the potential synergistic effect of resveratrol with other phenolic compounds: A case of binary phenolic mixtures. J. Food Comp. Anal. 2015, 38, 13–18. [Google Scholar] [CrossRef]
- Brcanović, J.M.; Pavlović, A.N.; Mitić, S.S.; Stojanović, G.S.; Manojlović, D.D.; Kaličanin, B.M.; Veljković, J.N. Cyclic Voltammetric Determination of Antioxidant Capacity of Cocoa Powder, Dark Chocolate and Milk Chocolate Samples: Correlation with Spectrophotometric Assays and Individual Phenolic Compounds. Food Technol. Biotechnol. 2013, 51, 460–470. [Google Scholar]
- Englard, S.; Seifter, S. The biochemical functions of ascorbic acid. Ann. Rev. Nutr. 1986, 6, 365–406. [Google Scholar] [CrossRef] [PubMed]
- He, B.; Zhang, J. Electrochemical Determination of Vitamin C on Glassy Carbon Electrode Modified by Carboxyl Multi-walled Carbon Nanotubes. Int. J. Electrochem. Sci. 2015, 10, 9621–9631. [Google Scholar]
- Kumar, S.; Vicente-Beckett, V. Glassy carbon electrodes modified with multiwalled carbon nanotubes for the determination of ascorbic acid by square-wave voltammetry. Beilstein J. Nanotechnol. 2012, 3, 388–396. [Google Scholar] [CrossRef] [PubMed]
- Chairam, S.; Sriraksa, W.; Amatatongchai, M.; Somsook, E. Electrocatalytic Oxidation of Ascorbic Acid Using a Poly(aniline-co-m-ferrocenylaniline) Modified Glassy Carbon Electrode. Sensors 2011, 11, 10166–10179. [Google Scholar] [CrossRef] [Green Version]
- Krivić, D.; Vladislavić, N.; Buljac, M.; Rončević, I.Š.; Buzuk, M. An insight into the thin-layer diffusion phenomena within a porous electrode: Gallic acid at a single-walled carbon nanotubes-modified electrode. J. Electroanal. Chem. 2022, 907, 116008. [Google Scholar] [CrossRef]
- Zhou, Y.; Tang, W.; Wang, J.; Zhang, G.; Chai, S.; Zhanga, L.; Liua, T. Selective determination of dopamine and uric acid using electrochemical sensor based on poly(alizarin yellow R) film-modified electrode. Anal. Methods 2014, 6, 3474–3481. [Google Scholar] [CrossRef]
- Buljac, M.; Krivić, D.; Rončević, I.Š.; Vladislavić, N.; Vukadin, J.; Buzuk, M. Voltammetric behaviour and amperometric sensing of hydrogen peroxide on a carbon paste electrode modified with ternary silver-copper sulfides containing intrinsic silver. Monatsh. Chem. 2020, 151, 511–524. [Google Scholar] [CrossRef]
- Gosser, D.K. Cyclic Voltammetry: Simulation and Analysis of Reaction Mechanisms; VCH: New York, NY, USA, 1993. [Google Scholar]
- Prasad Bastola, K.; Nath Guragain, Y.; Bhadriraju, V.; Venkata Vadlani, P. Evaluation of Standards and Interfering Compounds in the Determination of Phenolics by Folin-Ciocalteu Assay Method for Effective Bioprocessing of Biomass. Am. J. Anal. Chem. 2017, 8, 416–431. Available online: http://www.scirp.org/journal/ajac (accessed on 1 July 2022). [CrossRef] [Green Version]
- Rekha, C.; Poornima, G.; Manasa, M.; Abhipsa, V.; Pavithra Devi, J.; Vijay Kumar, H.T.; Prashith Kekuda, T.R. Ascorbic Acid, Total Phenol Content and Antioxidant Activity of Fresh Juices of Four Ripe and Unripe Citrus Fruits. Chem. Sci. Trans. 2012, 1, 303–310. [Google Scholar] [CrossRef]
Scheme 1.
The preparation of working electrode together with SEM images of electrode surface with 900× magnification.
Scheme 1.
The preparation of working electrode together with SEM images of electrode surface with 900× magnification.

Figure 1.
SEM images of electrode surface with (a) 4000× and (b) 22,000× magnification, together with (a–c). The energy-dispersive spectroscopy (EDS) analysis.
Figure 1.
SEM images of electrode surface with (a) 4000× and (b) 22,000× magnification, together with (a–c). The energy-dispersive spectroscopy (EDS) analysis.

Figure 2.
Cyclic voltammograms recorded with a PGS electrode in different electrolytes; scan rate 25 mV s−1, second cycles.
Figure 2.
Cyclic voltammograms recorded with a PGS electrode in different electrolytes; scan rate 25 mV s−1, second cycles.

Figure 3.
The redox reaction of VitC—molecular forms in equilibrium (ascorbic and dihydroascorbic acids).
Figure 3.
The redox reaction of VitC—molecular forms in equilibrium (ascorbic and dihydroascorbic acids).

Figure 4.
Cyclic voltammograms at PGS electrode with different concentrations of VitC in (A) phosphate buffer solution (0.1 M, pH 2); (B) KNO3 (0.1 M, pH 7); scan rate 25 mV s−1.
Figure 4.
Cyclic voltammograms at PGS electrode with different concentrations of VitC in (A) phosphate buffer solution (0.1 M, pH 2); (B) KNO3 (0.1 M, pH 7); scan rate 25 mV s−1.

Figure 5.
Cyclic voltammograms of PGS electrode in electrolyte with analyte: 5 × 10⁻⁴ M concentrations of VitC in (A) phosphate buffer solution (0.1 M, pH 2); (B) KNO3 (0.1 M, pH 7); at different potential scan rates.
Figure 5.
Cyclic voltammograms of PGS electrode in electrolyte with analyte: 5 × 10⁻⁴ M concentrations of VitC in (A) phosphate buffer solution (0.1 M, pH 2); (B) KNO3 (0.1 M, pH 7); at different potential scan rates.

Figure 6.
SWSV curves of PGS electrode with different concentrations of VitC. (a) Higher concentration range; (b) lower concentration range.
Figure 6.
SWSV curves of PGS electrode with different concentrations of VitC. (a) Higher concentration range; (b) lower concentration range.


Table 1.
A short review of the literature—comparison of analytical performance of PGS electrode with other carbon-based and modified electrodes in the literature.
Table 1.
A short review of the literature—comparison of analytical performance of PGS electrode with other carbon-based and modified electrodes in the literature.
| Electrode/Modification | Electroanalytical Methods | Solution | Potential of Oxidation | Linear Range μM | LOD μM | Analyzed Samples |
|---|---|---|---|---|---|---|
| Glassy carbon [39] | SWV, DPV | acetate buffer pH 3.50 | irreversibly 0.350 V | 20–1000 | 2.95 | pharmaceutical and Rosa species |
| Glassy carbon [40] | AMP | PB pH 5.0 | 0.600 V | 0–2.27 | 0.028 | fruit and vegetable juice. |
| Glassy carbon/graphene [41] | CV, EIS | PB pH 7.0 | irreversibly 0.350 V | 100–10000 | NA | NA |
| Graphene/carbon paste [42] | CV, AMP | PB pH 7.0 | irreversibly 0.350 V | 0.1–106 | 0.07 | artificial sample |
| Reduced graphene oxide [43] | CV, FIA with AMP | BR buffer pH 7.0 | irreversibly 0.650 V | NA | 4.7 | food beverage samples |
| Carbon paste [14] | CV, DPV | 0.10 M KCl | irreversibly 0.530 V | 70–20,000 | 62 | fruit juice and wine |
| SWCNT/carbon–ceramic [44] | CV, DPV | PB pH 7.0 | irreversibly 0.620 V | 5.0–700.0 | 3.0 | pharmaceutical and biological samples |
| Carbon nanotubes/gold nanoparticles [28] | CV | PB pH 7.4 | irreversibly 0.263 V | 5–400 | 1.8 | human urine |
| Bi2O3/glassy carbon [45] | CV | KH2PO4 pH 6.0 | irreversibly 0.280 V | 0–5000 | NA | vitamin C tablet |
| Grafen/CPE/CuO [46] | CV, SWV | biological pH 7.4) | irreversibly 0.250 V | 0.04–240.0 | 0.009 | artificial sample |
| Polyvinylpyrrolidone Grafite/glassy carbon [47] | SDLSV | PB pH 6.0 | irreversibly 0.034 V | 4–1000 | 0.8 | human urine |
| Unmodified edge plane pyrolytic Graphite [48] | CV, DPV | BR buffer pH 7.0 | irreversibly 0.050 V | 0.2–25 | NA | laked horse blood |
| edge plane pyrolytic graphite [49] | CV | PB pH 7.0 | irreversibly 0.080 V | 200–2200 | 71 | commercial drink Ribena |
| Pyrolytic graphite sheet (this work) | CV, SWV | KNO3 pH 7.0 | irreversibly 0.050 V | 1.0–400 | 0.4 | extract of cultivated aragula |
SWV—square wave voltammetry; DPV—differential pulse voltammetry; CV—cyclic voltammetry; EIS—electrochemical impedance spectroscopy; SDLSV—second-order derivative linear sweep voltammetry; FIA—flow injection analysis; AMP—amperometric detection; PB—phosphate buffer; BR—Britton–Robinson buffer.
Table 2.
Content of VitC, total phenols, and antioxidant activity of arugula—after three-week period of outdoor cultivation (mean value—standard deviation of first three consecutive measurements).
Table 2.
Content of VitC, total phenols, and antioxidant activity of arugula—after three-week period of outdoor cultivation (mean value—standard deviation of first three consecutive measurements).
| Sample—Arugula Substrate | Vitamin C SWV Results mg/L Sample | Vitamin C Determination by Iodine Titration mg/L Sample | Total Phenolic Compounds Folin–Ciocalteu Reagents mg GAE/L | Antioxidant Activity after 4 Min FRAP Method μM TE | Antioxidant Activity after 10 Min FRAP Method μM TE |
|---|---|---|---|---|---|
| Soil with addition of: | |||||
| Peanut shells | 128 ± 4.7 | 115.3 ± 4.7 | 218 ± 2 | 278 ± 22 | 591 ± 17 |
| Paper towels | 155 ± 4.7 | 149.0 ± 3.1 | 227 ± 7 | 223 ± 23 | 602 ± 6 |
| Peel of banana and kiwi | 421 ± 4.7 | 300.3 ± 1.0 | 190 ± 4 | 192 ± 18 | 463 ± 26 |
| Coffee ground | 504 ± 4.7 | 399.7 ± 14.5 | 315 ± 18 | 343 ± 19 | 611 ± 2 |
| Eggshells | 136 ± 4.7 | 126.7 ± 6.7 | 156 ± 4 | 186 ± 23 | 397 ± 4 |
| Control sample | 399 ± 4.7 | 276.7 ± 3.3 | 218 ± 7 | 231 ± 11 | 596 ± 7 |
A volume of 1 L corresponds to 100 g of raw material!
Publisher’s Note: MDPI stays neutral with regard to jurisdictional claims in published maps and institutional affiliations. |
© 2022 by the authors. Licensee MDPI, Basel, Switzerland. This article is an open access article distributed under the terms and conditions of the Creative Commons Attribution (CC BY) license (https://creativecommons.org/licenses/by/4.0/).
Share and Cite
MDPI and ACS Style
Škugor Rončević, I.; Skroza, D.; Vrca, I.; Kondža, A.M.; Vladislavić, N. Development and Optimization of Electrochemical Method for Determination of Vitamin C. Chemosensors 2022, 10, 283. https://doi.org/10.3390/chemosensors10070283
AMA Style
Škugor Rončević I, Skroza D, Vrca I, Kondža AM, Vladislavić N. Development and Optimization of Electrochemical Method for Determination of Vitamin C. Chemosensors. 2022; 10(7):283. https://doi.org/10.3390/chemosensors10070283
Chicago/Turabian StyleŠkugor Rončević, Ivana, Danijela Skroza, Ivana Vrca, Ana Marija Kondža, and Nives Vladislavić. 2022. "Development and Optimization of Electrochemical Method for Determination of Vitamin C" Chemosensors 10, no. 7: 283. https://doi.org/10.3390/chemosensors10070283
Note that from the first issue of 2016, this journal uses article numbers instead of page numbers. See further details here.