Article

Signal Amplification for Detection of Nilutamide in Three-Dimensional Electrochemical Sensor Using Copper Metal–Organic Framework Decorated Carbon Nanofibers

by
Elaiyappillai Elanthamilan
and
Sea-Fue Wang
*
Department of Materials and Mineral Resources Engineering, National Taipei University of Technology, No. 1, Sec. 3, Chung-Hsiao East Road, Taipei 10608, Taiwan
*
Author to whom correspondence should be addressed.
Chemosensors 2023, 11(10), 544; https://doi.org/10.3390/chemosensors11100544
Submission received: 14 September 2023 / Revised: 1 October 2023 / Accepted: 19 October 2023 / Published: 20 October 2023

Abstract

:
The extensive use of antibiotics has rapidly spread antibiotic resistance, which poses significant health risks to humans. Unfortunately, despite this pressing issue, there is still a lack of a reliable on-site detection method for the residues of antibiotics, such as nilutamide (Nlu). Consequently, there is an urgent need to develop and perfect such a detection method to effectively monitor and control antibiotic residues. In this study, the hydrothermal development of copper-metal-organic framework (Cu-MOF) polyhedrons on the functionalized carbon nanofiber (f-CNF) matrix allowed for the detection of Nlu in biological liquids via a sensitive amperometry technique. Further electrochemical detection of Nlu took place with the cyclic voltammetry (CV) technique Cu-MOF/f-CNF. Analytical and spectroscopic approaches were used to confirm the successful synthesis of Cu-MOF/f-CNF. The prepared material was decorated on the surface of GCE and performed as an electrochemical Nlu sensor, with a broad linear range of 0.01 to 141.4 μM and 2 nM as a lower limit of detection. In addition, the composites had a large surface area and many dedicated sites, which improved electrocatalysis. In practical applications, Cu-MOF/f-CNF/GCE provides a novel strategy for improving electrochemical activity by measuring Nlu concentrations in biological samples.

1. Introduction

Ever since the discovery of antibiotics, the health sector has undergone a significant revolution [1,2]. Around the world, most unregulated antibiotics were used in pharmaceuticals, which are harmful to both human health and the environment [3,4]. Nilutamide (Nlu: 5,5-dimethyl-3-(4-nitro-3-(trifluoromethyl) phenyl) imidazolidine-2,4-dione) has received widespread recognition as an effective anti-androgen, synthetic, and non-steroidal medication. It was used to treat cancer like prostate cancer in the D2 stage [5,6,7]. An anti-androgen antagonizes the transcription of the target gene by interacting with androgen receptors. It is hoped that the combination of Nlu and LHRH (luteinizing hormone-releasing hormone) analogs will result in a complete androgen blockade through a reduction in androgen levels and the neutralization of the tendency to produce androstenedione and dehydroepiandrosterone as adrenal androgen precursors [8,9]. Last, a non-steroidal agent orally binds with the androgen receptor, leading to the inhibition process. This absorption finalizes the plasma concentration, which is metabolized in the liver and excreted in urine [10]. The eradication half-life (t1/2, Elim) of Nlu in humans is approximately 48–56 h [11,12]. During medication, one of the most important factors is the dosage level. A higher dosage of Nlu in the human body leads to different kinds of side effects, such as eye problems, nausea, viral fever, hemeralopia, reproductive problems, dark (bloody) urine, and hypersensitivity to alcohol (malaise, discomfort in the chest, flushing, restlessness, and difficulties with sleeping). All of these side effects of Nlu overdosage need to be governed in the field of pharmacy [13,14]. As a result, such lethal pharmaceuticals must be monitored quantitatively and certified [15]. Hence, it is very important to determine Nlu levels in biological fluids. A wide range of analytical techniques has been used to determine Nlu, such as spectrophotometry [16] and micellar electro-kinetic chromatography [6], and, in electrochemistry, square wave adsorptive stripping voltammetry [14] and differential pulse voltammetry [15,17,18]. Electrochemical techniques can be highly sensitive, fast, inexpensive, easy to handle, and selective for the detection of analytes, even at very low concentrations [19]. The efficiency of an electrode is also determined by the choice of electrode material. The use of nanomaterials in developing sensors that meet specific requirements has been successful. Specifically, MOFs (metal–organic frameworks) and carbonaceous materials have been lauded for their high surface area and limited ion transport pathways [20]. There are several factors that restrict the commercial potential of the existing sensing systems, such as high energy inputs, low stability, and cumbersome manufacturing. As a result of limited flexibility and operating circumstances, they tend to be constrained in their ability to redefine sensor architectures. Hence, it is crucial to develop novel nanostructured materials that have excellent activity using a hydrothermal approach to detect Nlu.
The structural and morphological features of MOFs have attracted researchers to use them in electrochemical sensors because of their structural composition. In MOFs, metal ions and clusters are mixed with organic bridging linkers to form a hybrid functional material. For industrial and environmental analyses, MOF-based sensors play an important role in establishing robust analytical methods for detecting phenolic compounds. An MOF acts primarily as an insulator. Efficacious transduction of electrochemical signals is the primary goal of MOF sensing research. There is no other way to achieve this than through MOF preparation strategies, as well as by retaining the distinctive porous structure and preserving the electrical conductivity of the MOF [21]. By using other functional materials with good electrical conductivity, it is possible to overcome the poor conductivity of these MOFs. MOFs are more stable when they are produced in this dynamic way. Since Cu-based MOFs are commercially available, Cu-based MOFs have gained particular attention because they are easy to synthesize. Additionally, their surface area is precise, their volume is high, their structure is tunable, and they are very chemically stable [22]. In recent years, composites of MOFs and carbon-based materials (including graphene, activated carbon, and carbon nanotubes) have gained popularity due to their enhanced catalytic performance, fast electron transfer, and mechanical, electronic, thermal, and optical properties [23,24,25]. In addition, the carbon nanofiber (CNF) possesses a cylindrical structure with many defects along its edge planes, which facilitates electron transport in electroactive molecules. Even so, unmodified CNF is insoluble in water, which is a considerable challenge for electrode fabrication. Increasing its soluble properties and eliminating the catalytic contaminants is one of the benefits of functionalizing CNF in recent years, improving its electrochemical performance [26]. Based on previous reports, CNF has a high surface area and improved water solubility and electrical conductivity due to the presence of more reactive oxygen functional groups, resulting in good electron transfer and improved physicochemical characteristics compared to unmodified CNF [27,28,29,30]. Furthermore, in the field of sensor technology, functionalized carbon nanofiber (f-CNF) nanostructures demonstrate high electrocatalytic activity and superior electrochemical efficiency in the detection of emerging pollutants.
Our study utilized hydrothermal synthesis to prepare Cu-MOF and acid treatment to synthesize f-CNF as the carbon source for binding the Cu-MOF on the surface of GCE. Ultrasonication was used to bind the Cu-MOF with strong encapsulation onto f-CNF for the Cu-MOF/f-CNF composite. Recently, there has been a number of studies that have introduced Cu-MOF with f-CNF as an excellent sensing material. For example, Dey et al. developed a cobalt and a copper MOF with CNF as a sensor for histamine and 4-nitropenol [20,24]. Ahmad et al. introduced a copper–cobalt MOF with CNF to detect dopamine and tyramine simultaneously [31]. Nlu is one of the most harmful pollutants and needs to be detected selectively. Cu-MOF with CNF shows promise for selectively sensing Nlu material in the detection process. Cu-MOF/f-CNF’s conductivity and electrocatalytic characteristics were investigated with EIS and CV techniques. Moreover, experimental parameters for Nlu detection were optimized using CV technology. To monitor Nlu levels, human urine, and water samples with optimal parameters, the amperometry i-t approach was also utilized to obtain the low detection limit for Nlu. Figure 1 shows the schematic representation of the synthesis of the Cu-MOF/f-CNF composite for the determination of Nlu.

2. Experimental Part

2.1. Chemicals and Reagents

Complete details of the materials used and instrumentation details of the characterization analysis and real sample preparation are provided in the supporting information.

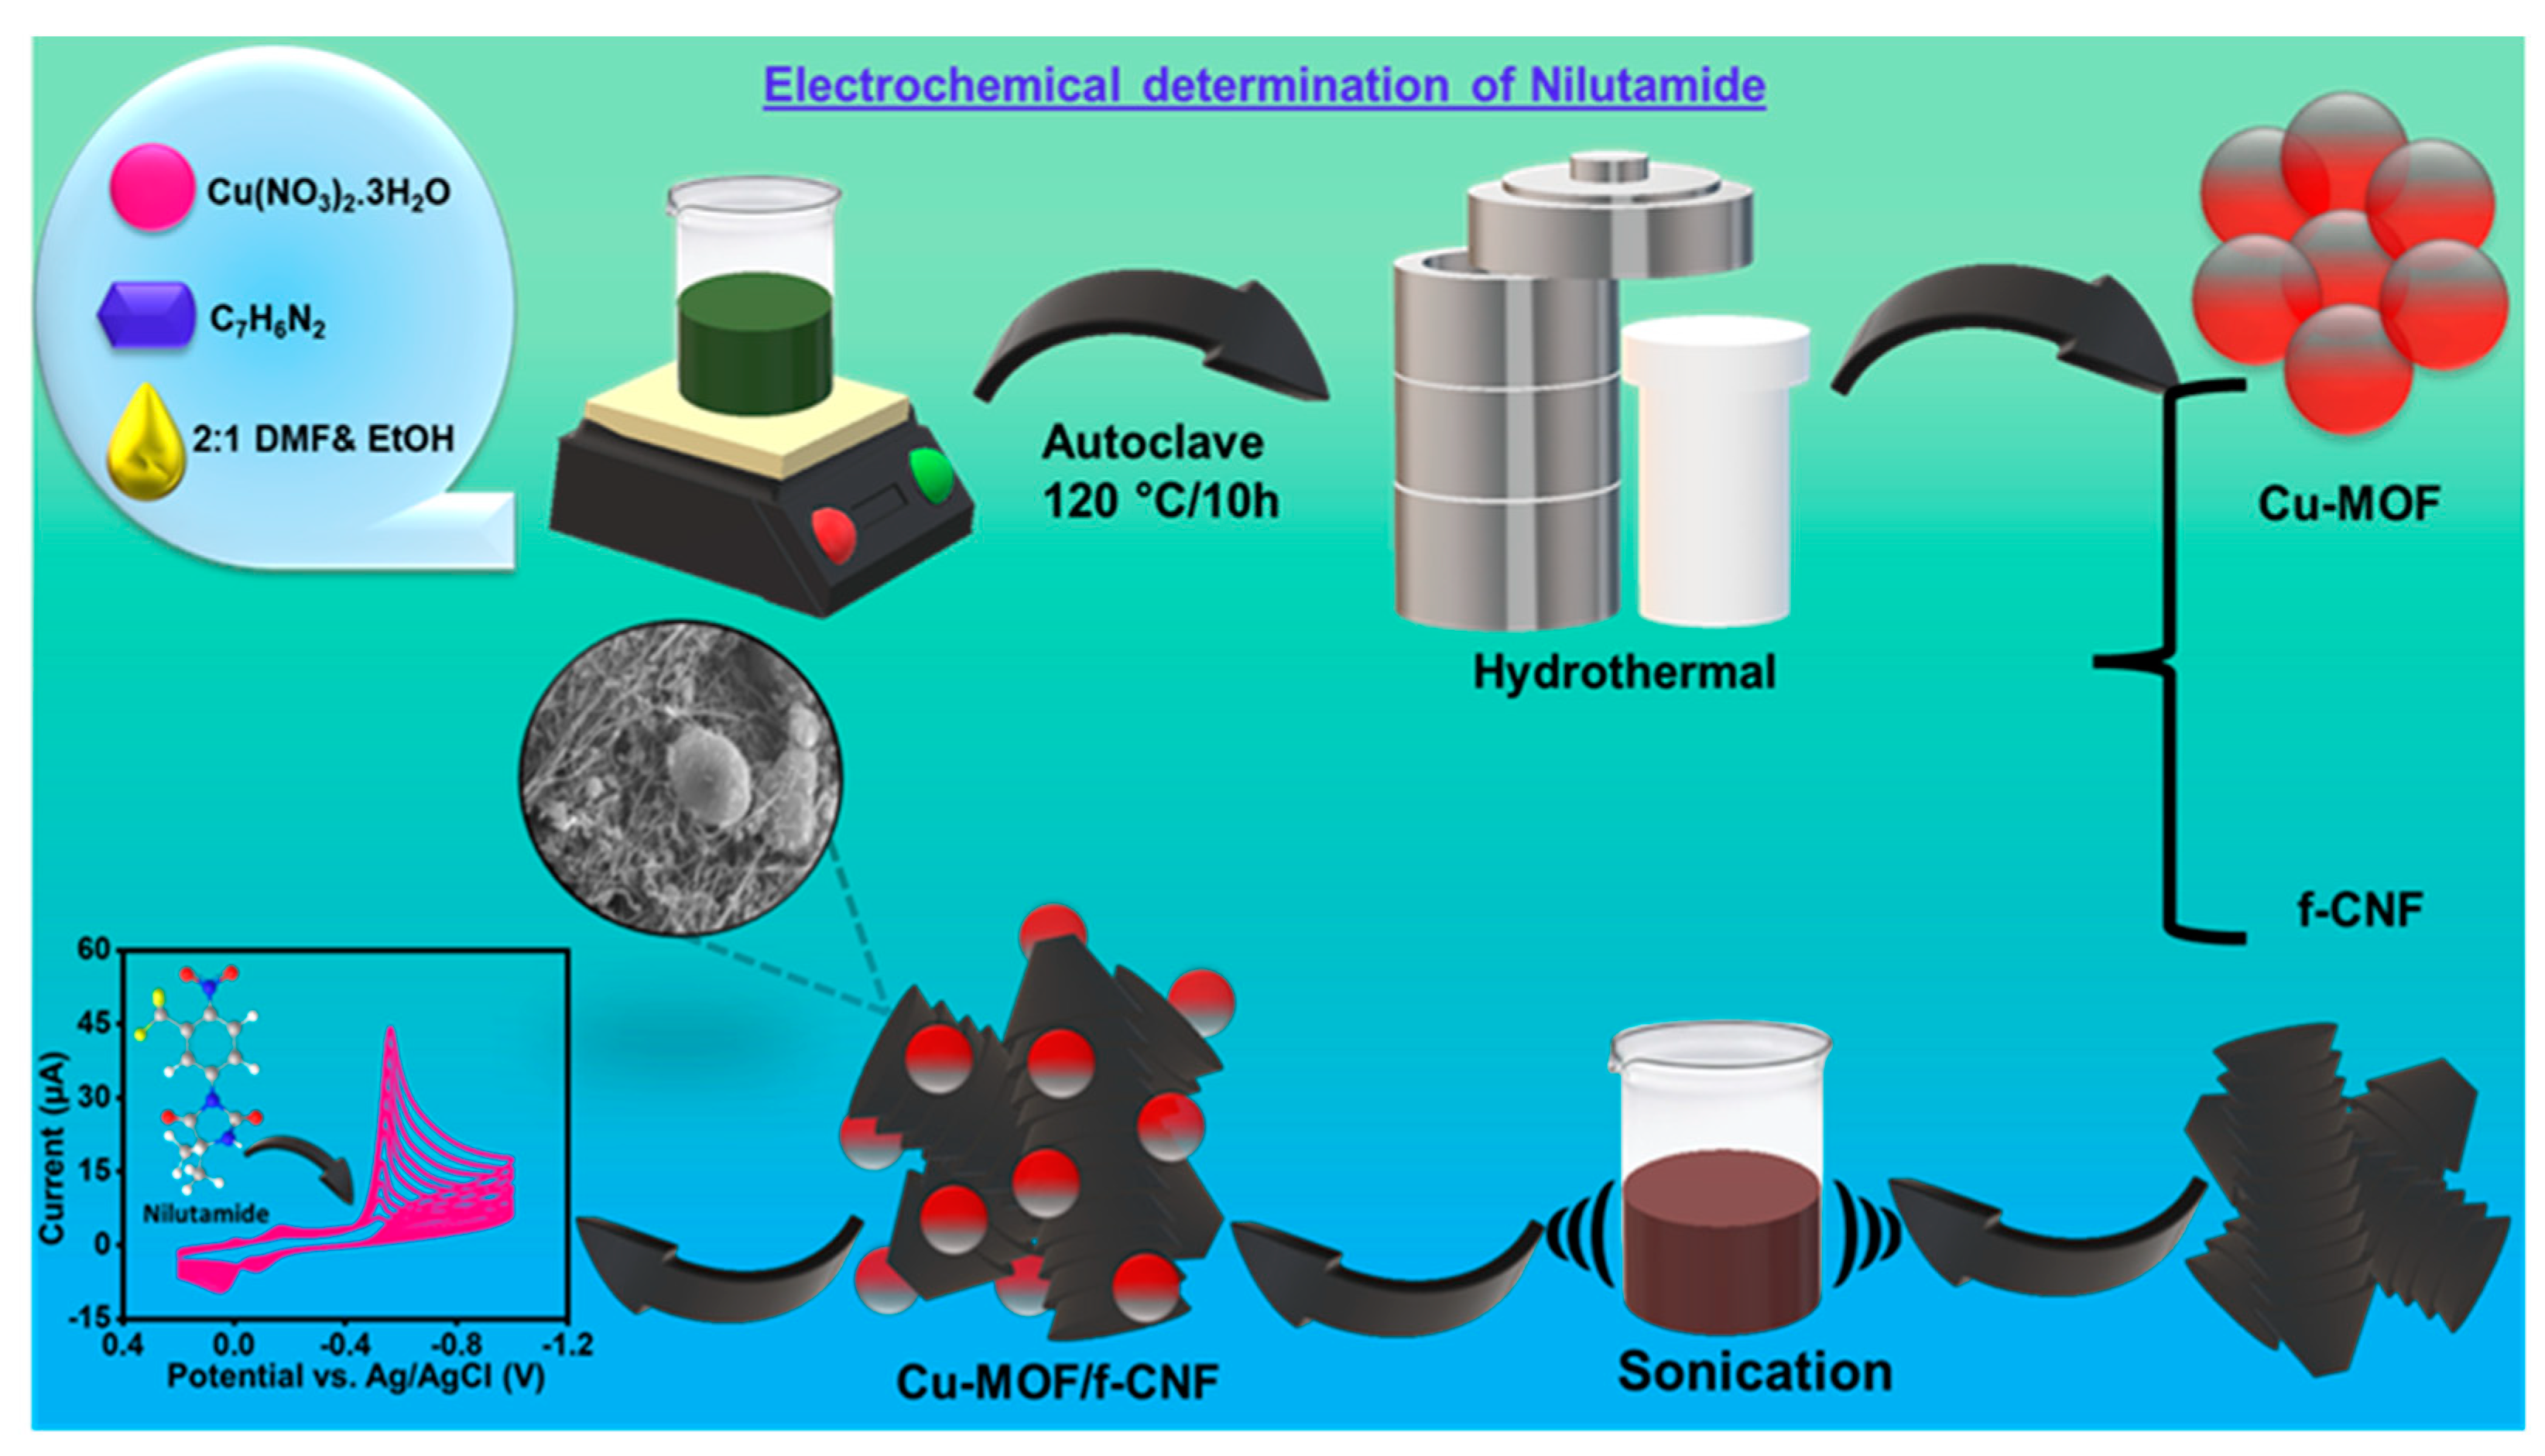
2.2. Synthesis Procedure

2.2.1. Synthesis of Cu-MOF

A sustainable method was used to prepare the Cu-MOF material. Initially, 1 M of Cu(NO3)2·3H2O and 0.5 M of benzimidazole were dissolved in 100 mL of solution, which contained a 2:1 ratio (DMF: ethanol) of the mixture and underwent a stirring process at room temperature. After that, the homogeneous mixture was transferred into an autoclave and was sealed and allowed to react at 120 °C/10 h. Following that, the reactant solution was taken out when cooled and was washed with ethanol and DI water by centrifugation. Finally, the blue-color residue was dried at 60 °C overnight. The resultant powder, which is called Cu-MOF material, was used to further analysis.

2.2.2. Acid Treatment of Carbon Nanofiber (CNF)

The edges of the pristine CNF were activated using an acid functionalization route. The mixture of con. HNO3 and con. H2SO4 (1:3 vol) was used for the acid treatment. The pristine CNF was dispersed in the acid mixture to obtain a dense suspension, which was agitated for an hour at 60 °C using a magnetic stirrer. After evaporation of the acidic contents, the slurry was mixed in DI water and was centrifuged. The residue was repeatedly washed with ethanol until a neutral pH was attained and was dried for 24 h. Finally, functionalized CNF was obtained.

2.2.3. Preparation of Cu-MOF/f-CNF Composite

The as-prepared Cu-MOF was blended with functionalized CNF through the sonochemical-assisted method to save the structural and morphological integrity of the compounds. The Cu-MOF and f-CNF (2:1 weight ratio) were sonicated in DI water to obtain a colloidal solution. Then, the dispersion was centrifuged. The resultant Cu-MOF/f-CNF residue was dried and used for further analysis.

2.3. Electrode Fabrication

After the synthesis procedure, the Cu-MOF/f-CNF (3 mg) was dispersed in 1 mL of DI H2O and then sonicated for 10 min and used for further fabrication of electrodes. To obtain a well-cleaned GCE, alumina slurry and water were used to clean it and ethanol was used to wash it. Electrochemical experiments were performed using the GCE created with dispersed catalysts. As calculated with Equation (1) below, the average loading amount of Cu-MOF/f-CNF on GCE was ~0.2 mg cm−2.
Loading amount = (3 mg/1000 μL)/6 μL

3. Results and Discussion

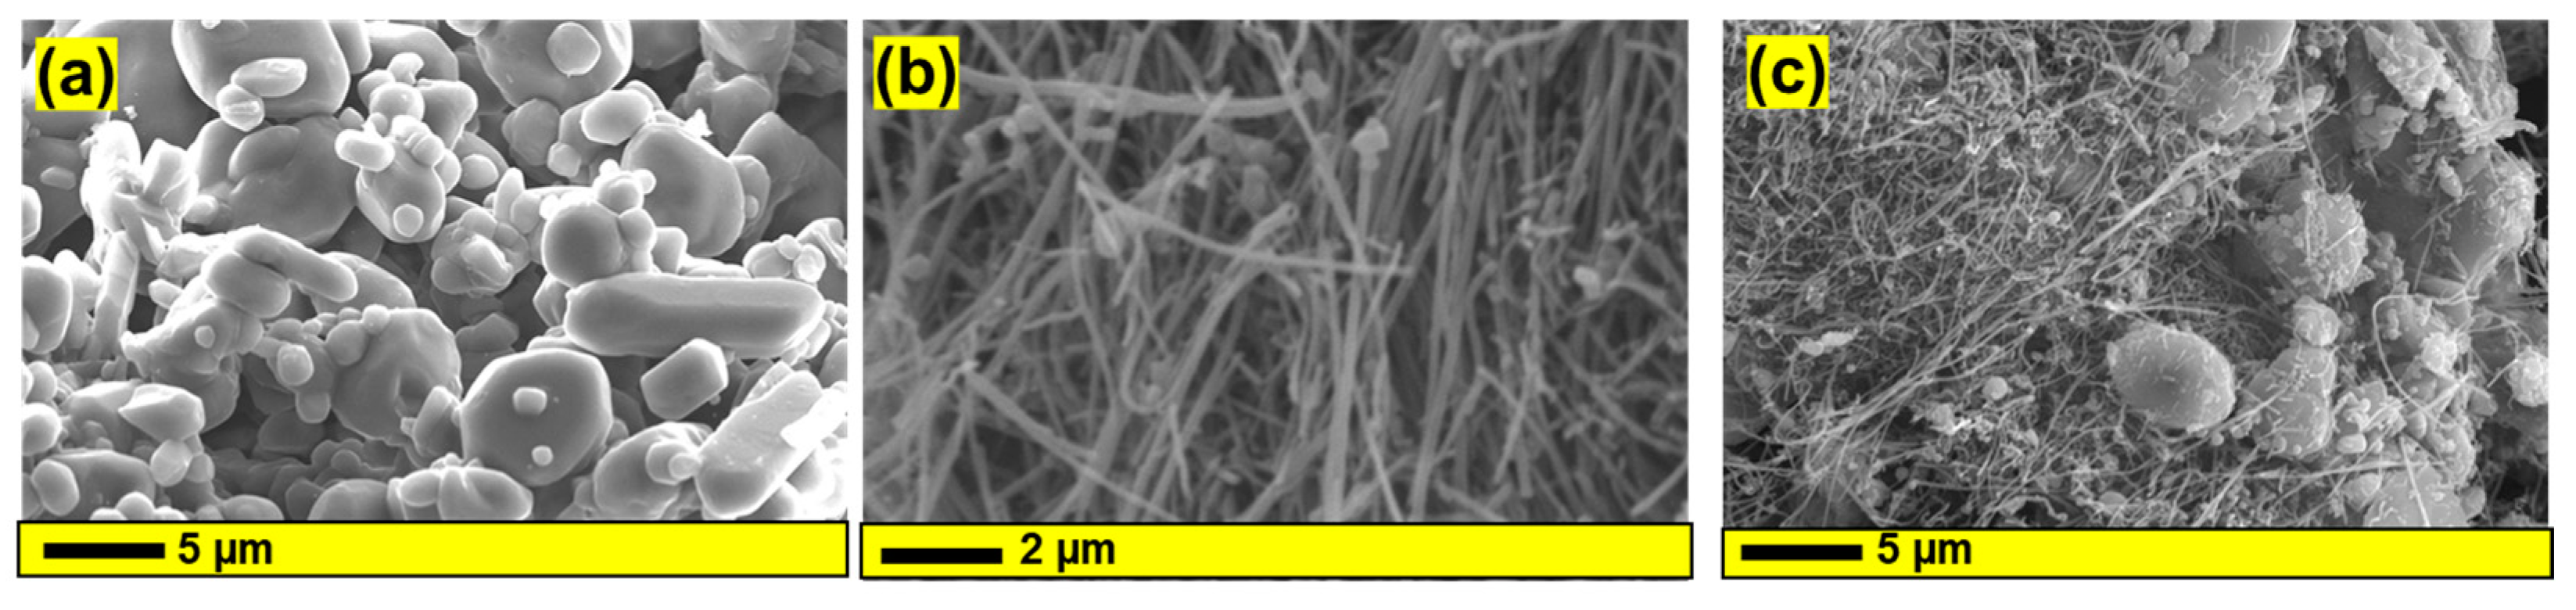
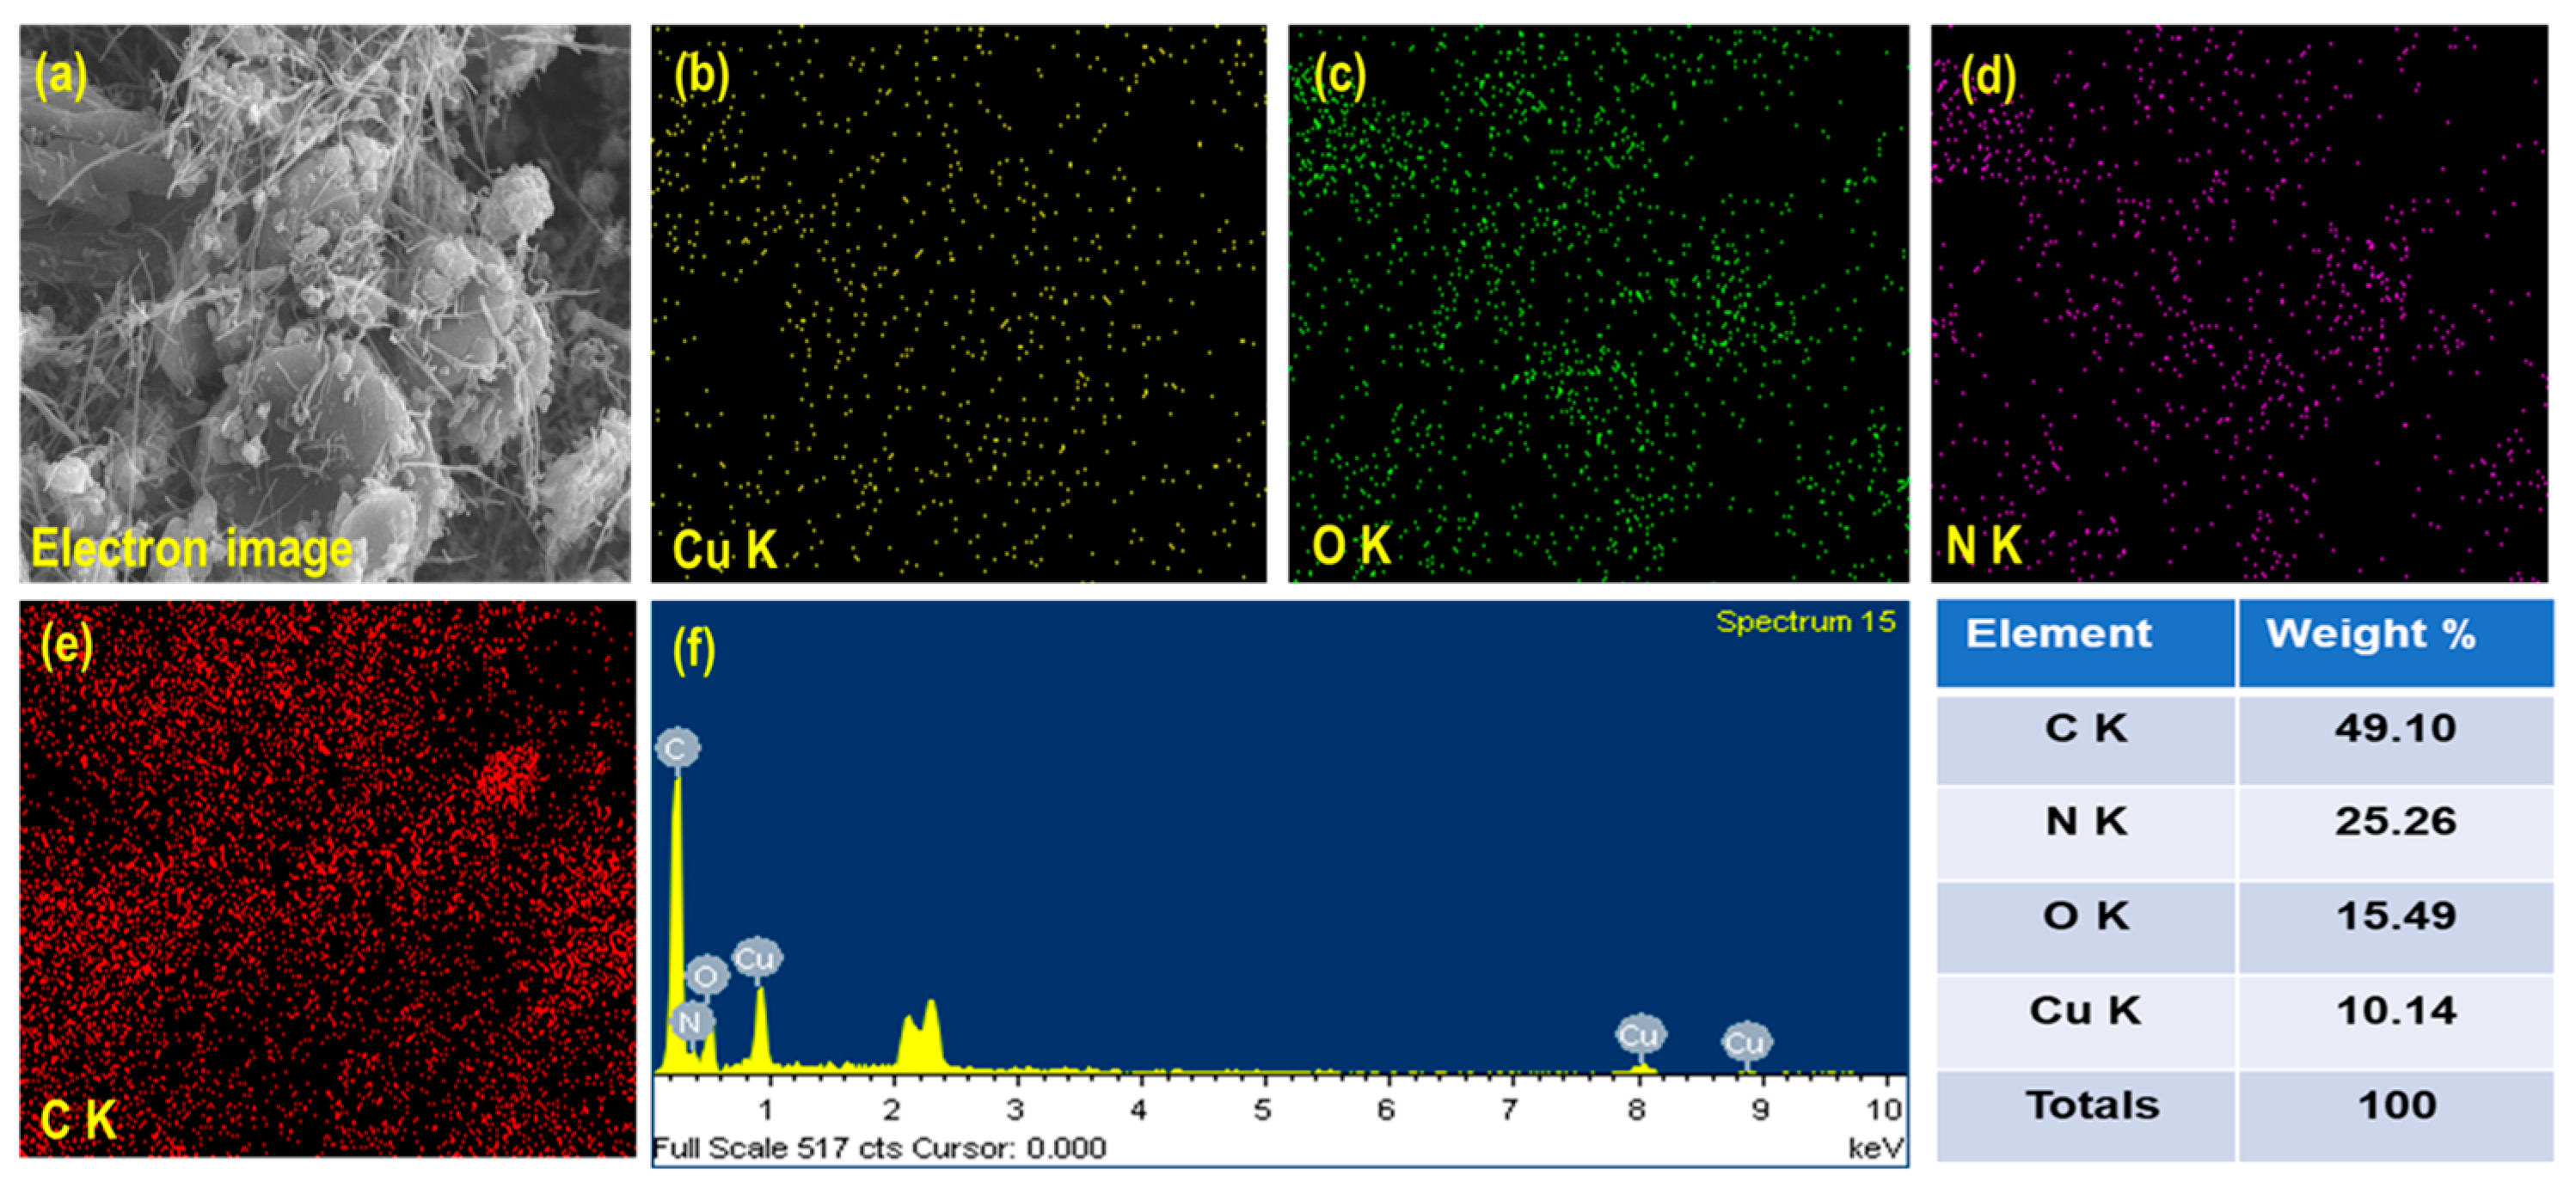
3.1. Structural and Morphological Investigation

The crystallographic investigation of Cu-MOF, f-CNF, and the Cu-MOF/f-CNF composite is provided in Figure 2a. The patterns of Cu-MOF and Cu-MOF/f-CNF showed similar characteristic peaks and matched well with previous reports (CCDC No. 602543) [32,33]. The distinctive peaks of the Cu-MOF were at 10.8° (0 2 1), 11.02° (0 1 2), 12.9° (2 1 1), 16.9° (1 2 2), 17.6° (1 3 1), 21.0° (0 3 3), 26.2° (4 2 2), and 29.0° (3 4 2). To confirm, no other impurities were noticed in the XRD pattern of Cu-MOF. Moreover, the integration of f-CNF was demonstrated, with a characteristic peak of 2θ = 26.1° and a corresponding (0 0 2) plane of the graphitic layer [34,35]. The XRD pattern of Cu-MOF/f-CNF included all the characteristic peaks of Cu-MOF and f-CNF, which suggests the successful formation of the composite.
The FTIR spectroscopy supports the evolution of the molecular absorption and transmission spectra observed in the region between 4000 and 400 cm−1, which is shown in Figure 2b. The spectrum of Cu-MOF showed a sequence of bands from 400 to 4000 cm−1. The stretching frequency at 1765 cm−1 was described as the aromatic C=C bending vibrations of benzimidazole structures [32]. Further, the stretching mode of C=N of the benzimidazole moiety appeared at 1613 cm−1, whereas for C-N stretching, a sharp peak was noted at 1248 cm−1. The stretching vibrations of the Cu-N bond of the Cu-MOF were noted at 421 and 460 cm−1. The broad band noted at around 3128 cm−1 in each spectrum was due to adsorbed water molecules in the sample. The FT-IR spectrum of f-CNF showed characteristic peaks at around 1632 and 1392 cm−1 and were ascribed to the C=O stretching of carboxyl functionalities included in the edges of the graphitic structure of f-CNF [34,35]. Further, the FTIR spectrum of the Cu-MOF/f-CNF composite consisted of all of the characteristic stretching frequencies of Cu-MOF and f-CNF, which further supports the conclusion that the composite was formed.
Morphological analysis of Cu-MOF, f-CNF, and the Cu-MOF/f-CNF composite were investigated by SEM and the results are shown in Figure 3 and Figure S1. Briefly, Cu-MOF, showing three-dimensional (3D) polyhedron-like morphology, was obtained through the hydrothermal method, as shown in Figure 3a and Figure S1a,b. Cu-MOF particles seemed to be connected to each other. The SEM images of f-CNF (Figure 3b and Figure S1c,d) demonstrate that it comprised fibrous structures with a high degree of entanglement. The fibers effectively yielded more platform to the carbonaceous structure and thereby increased the electrolyte ion mobility and active penetration of the electrolytes. Further, the Cu-MOF/f-CNF composite (Figure 3c and Figure S1e,f) comprised a 3D polyhedron of Cu-MOF interlinked via f-carbon nanofibers. The inter-connection between Cu-MOF and f-CNF increased the electrocatalytic activity and conductivity during the sensing process [34,35]. Further, the elemental color-mapping analysis (Figure 4a–e) and EDAX analysis (Figure 4f) proved the occurrence of Cu, O, C, and N in the composite without any impurities.
The overall XPS survey spectrum proved the occurrence of Cu, C, O, and N in the Cu-MOF/f-CNF composite (Figure 5a). The high-resolution spectrum of Cu 2p (Figure 5b) displayed two peaks at the binding energies of 936.1 eV and 955.9 eV, which correspond to Cu 2p3/2 and Cu 2p1/2, respectively. Further, the two satellite peaks of Cu 2p were noted at 944.7 eV and 964.4 eV [36]. The C 1s spectrum (Figure 5c) was fitted into three peaks at the binding energies of 285.0 eV, 285.9 eV, and 287.2 eV, corresponding to C-C, C-O/C-N, and C=O/C=N bonds, respectively [32]. The N 1 s spectrum (Figure 5d) showed three peaks at the binding energies of 397.6 eV, 400.2 eV, and 401.2 eV, corresponding to =N-C, C-N-C, and C-NH-C bonds, respectively [32]. Further, the O 1s spectrum (Figure 5e) showed three peaks at 530.4 eV, 531.9 eV, and 533.4 eV, corresponding to C-O-C/C-OH, C=O, and C-O bonds, respectively [37]. These results prove the successful formation of the Cu-MOF/f-CNF composite.

3.2. Impedance Spectroscopy

An investigation of electrochemical impedance spectroscopy (EIS) was used to calculate the electrode’s electrical conductivity, and we investigated the interfacial charge transfer resistance of the MOF/carbon-based sensor. Based on Nyquist plots, the diameter of the semi-circular region in the electrode/electrolyte interface was used to calculate the charge transfer resistance (Rct). As shown in Figure 6a, Nyquist plots of the bare/GCE, Cu-MOF/GCE, f-CNF/GCE, and Cu-MOF/f-CNF/GCE were obtained in 0.1 M KCl aqueous solution containing 5 mM [Fe(CN)6]3−/4−. According to the result, the Rct values for the bare/GCE, Cu-MOF/GCE, f-CNF/GCE, and Cu-MOF/f-CNF/GCE were 283.14 Ω, 172.29 Ω, 63.71 Ω, and 22.3 Ω, respectively. When comparing the other modified electrodes, the Cu-MOF/f-CNF/GCE composite had a low Rct value, which indicates that there was a synergistic catalytic effect with the carbon material that increased the interfacial electron transfer rates. By using Rct values, it is possible to calculate the charge transfer rate (Kapp).
Kapp = RT/AF2RctC
where A and C refer to the surface area of the electrode and the concentration of the solution, respectively; R refers to the universal gas constant; T refers to the temperature; and F refers to the Faraday constant. According to Equation (2), the Ks values for Cu-MOF/GCE, f-CNF/GCE, and Cu-MOF/f-CNF/GCE were 2.59 × 10⁻⁸ cm s−1, 7.01 × 10⁻⁸ cm s−1, and 2.0 × 10⁻⁷ cm s−1, respectively [38]. In comparison, Cu-MOF/f-CNF/GCE had the highest Kapp value, which indicates the fast transport of electrons.

3.3. Electrochemical Surface Area Analysis

Figure 6b shows the results of the CV curves of bare GCE, Cu-MOF/GCE, f-CNF/GCE, and Cu-MOF/f-CNF/GCE in a standard probe of 5 mM [Fe(CN)6]3−/4− in the presence of 0.1 M aqueous KCl solution at 50 mV s−1, which provided a good peak-to-peak separation (potential difference ~∆EP) in the form of a redox response, and the values were 15.4, 10.5, 11.8, and 10 mV, respectively. The results also confirm that the Cu-MOF/f-CNF/GCE showed a higher redox current response compared to the other electrodes. Furthermore, the Randles–Sevcik equation helped to measure the electrochemical active surface area (ECSA) [39].
Ip = (2.69 × 10⁵) n3/2D1/2 ν1/2AC
Here, Ip, D, n, ν, A, and C refer to the redox current, diffusion coefficient, transfer of electrons (n = 1), scan rate, active surface area, and concentration of the solution, respectively. In a surface area calculation, investigation of additional different scan rates took place on the surface of Cu-MOF/f-CNF/GCE in a standard probe (5 mM of [Fe(CN)6]3−/4− in 0.1 M KCl) solution, which is shown in Figure 6c. While increasing the scan rate from 20 to 300 mV s−1 the redox current response was also increased. With the obtained data, a linear calibration plot was carried out based on the square root of the scan rate vs. the redox peak current, as shown in Figure 6d, and the plot shows the system in a diffusion-controlled process. The slope value was obtained above the linear plot used in Equation (3), and the measured ECSA for Cu-MOF/f-CNF/GCE was 0.12 cm2. The obtained ECSA value of the composite material was 1.7 times higher than for bare GCE (ECSA ~0.071 cm2). Based on the properties obtained above (quick charge transfer ability, lower resistance, and higher surface area), we can confirm that the Cu-MOF/f-CNF showed a prominent electrode modifier towards Nlu sensors.

3.4. Electrochemical Detection of Nlu

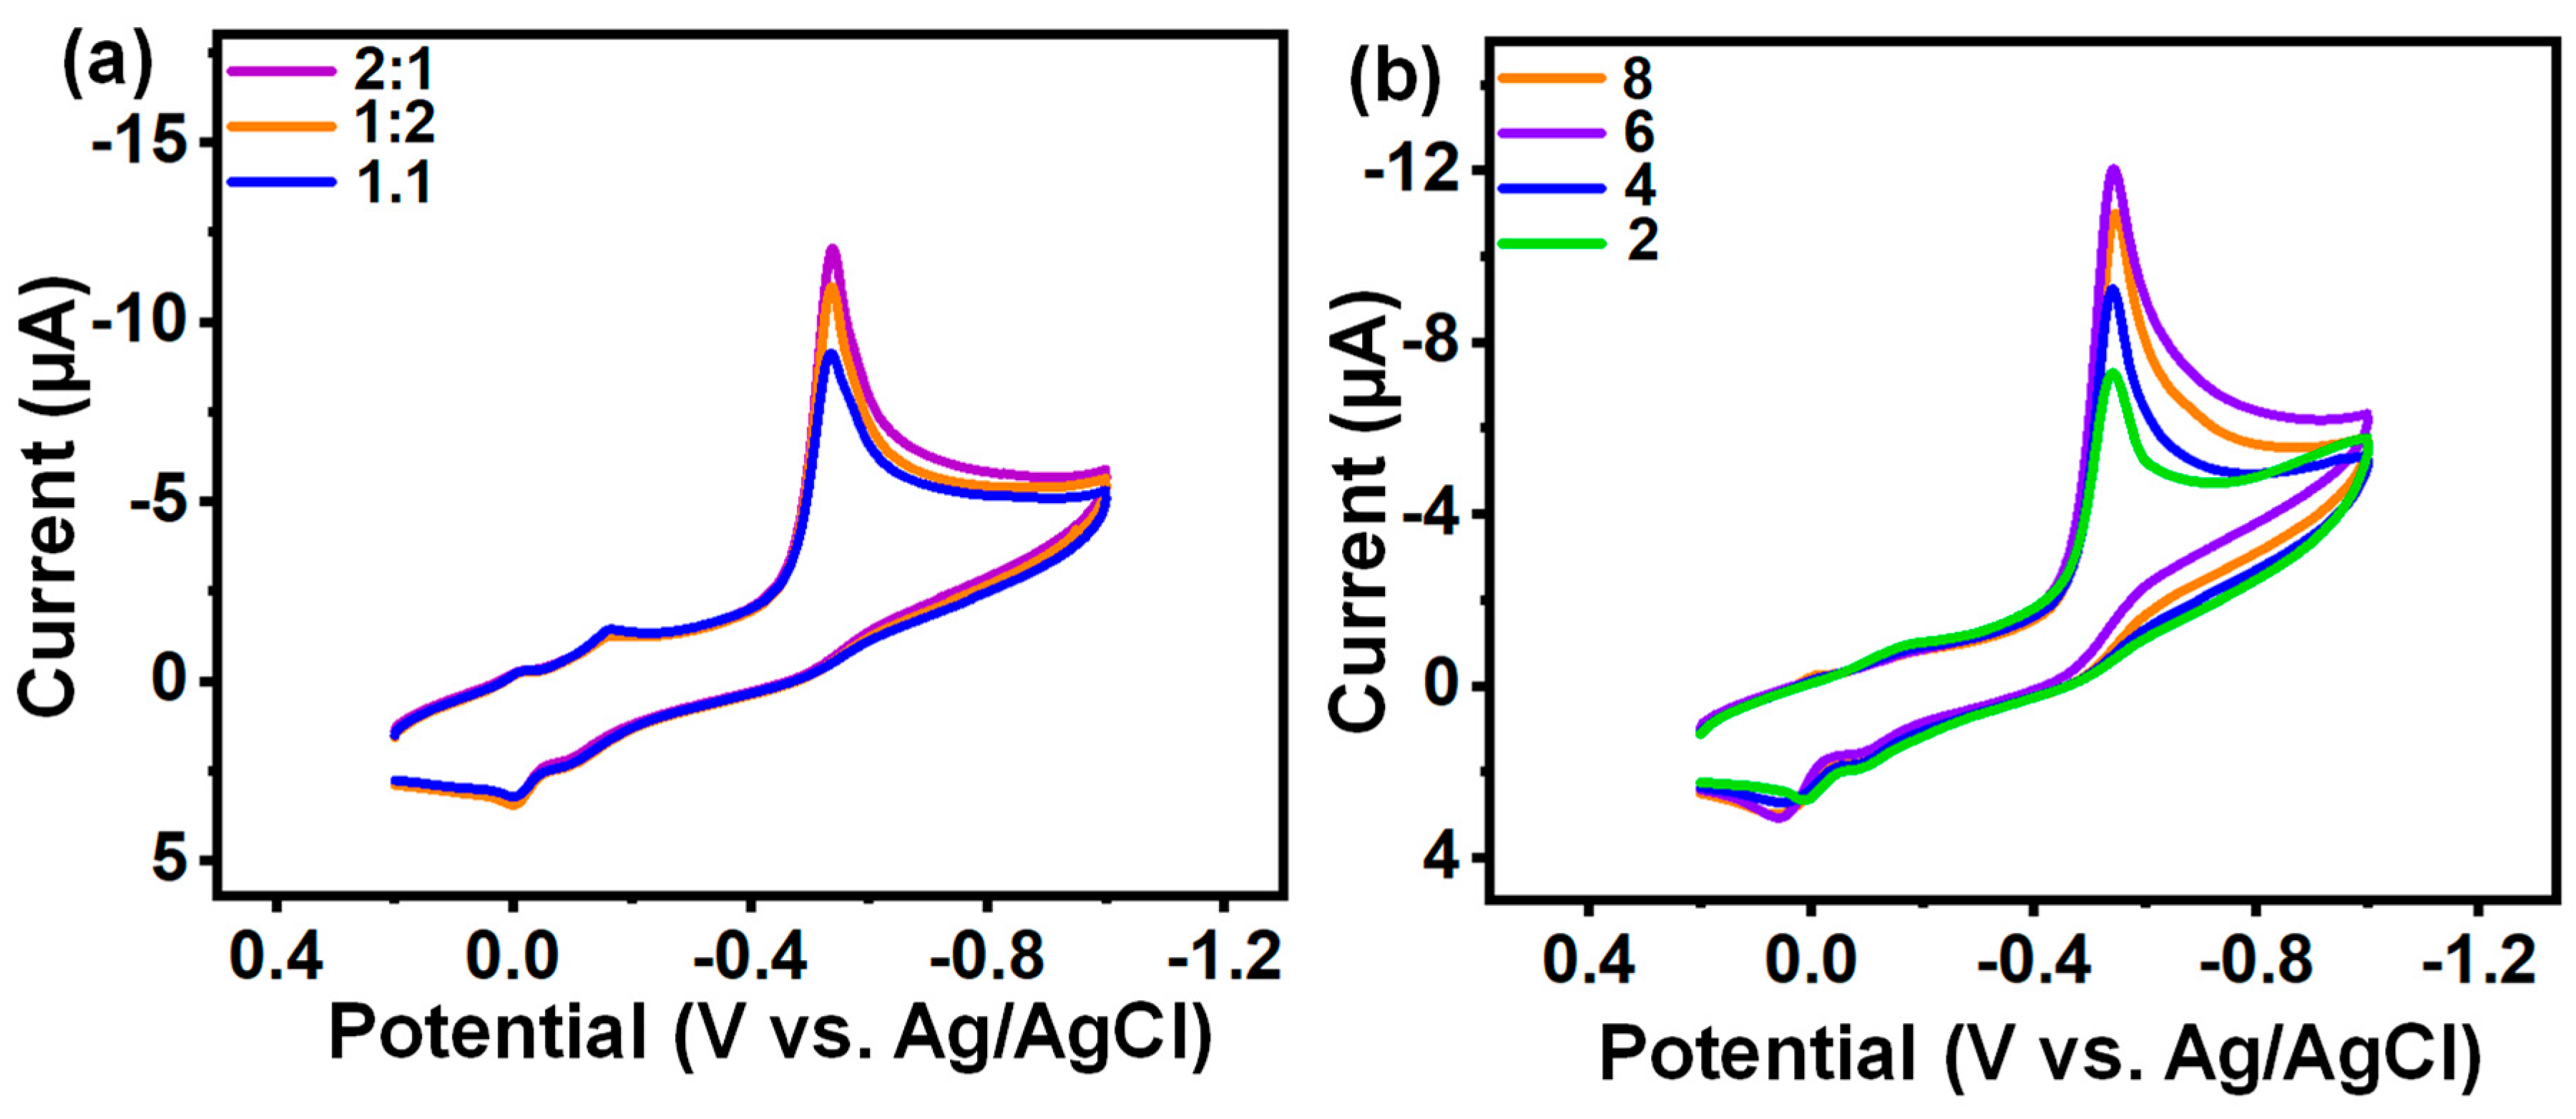
3.4.1. Optimization Analysis

To investigate the electrochemical analysis of Nlu, CV was used. In the beginning, we modified GCE’s surface in different ratios with the composite that we prepared. Figure 7a shows the CV current response for various Cu-MOF/f-CNF ratios (1:1, 1:2, and 2:1) in the presence of 50 µM Nlu (N2 saturated) and 0.1 M PB (pH = 7.0) solution at 50 mV s−1. The obtained 2:1 ratio of Cu-MOF/f-CNF revealed a higher current responsiveness on Nlu.

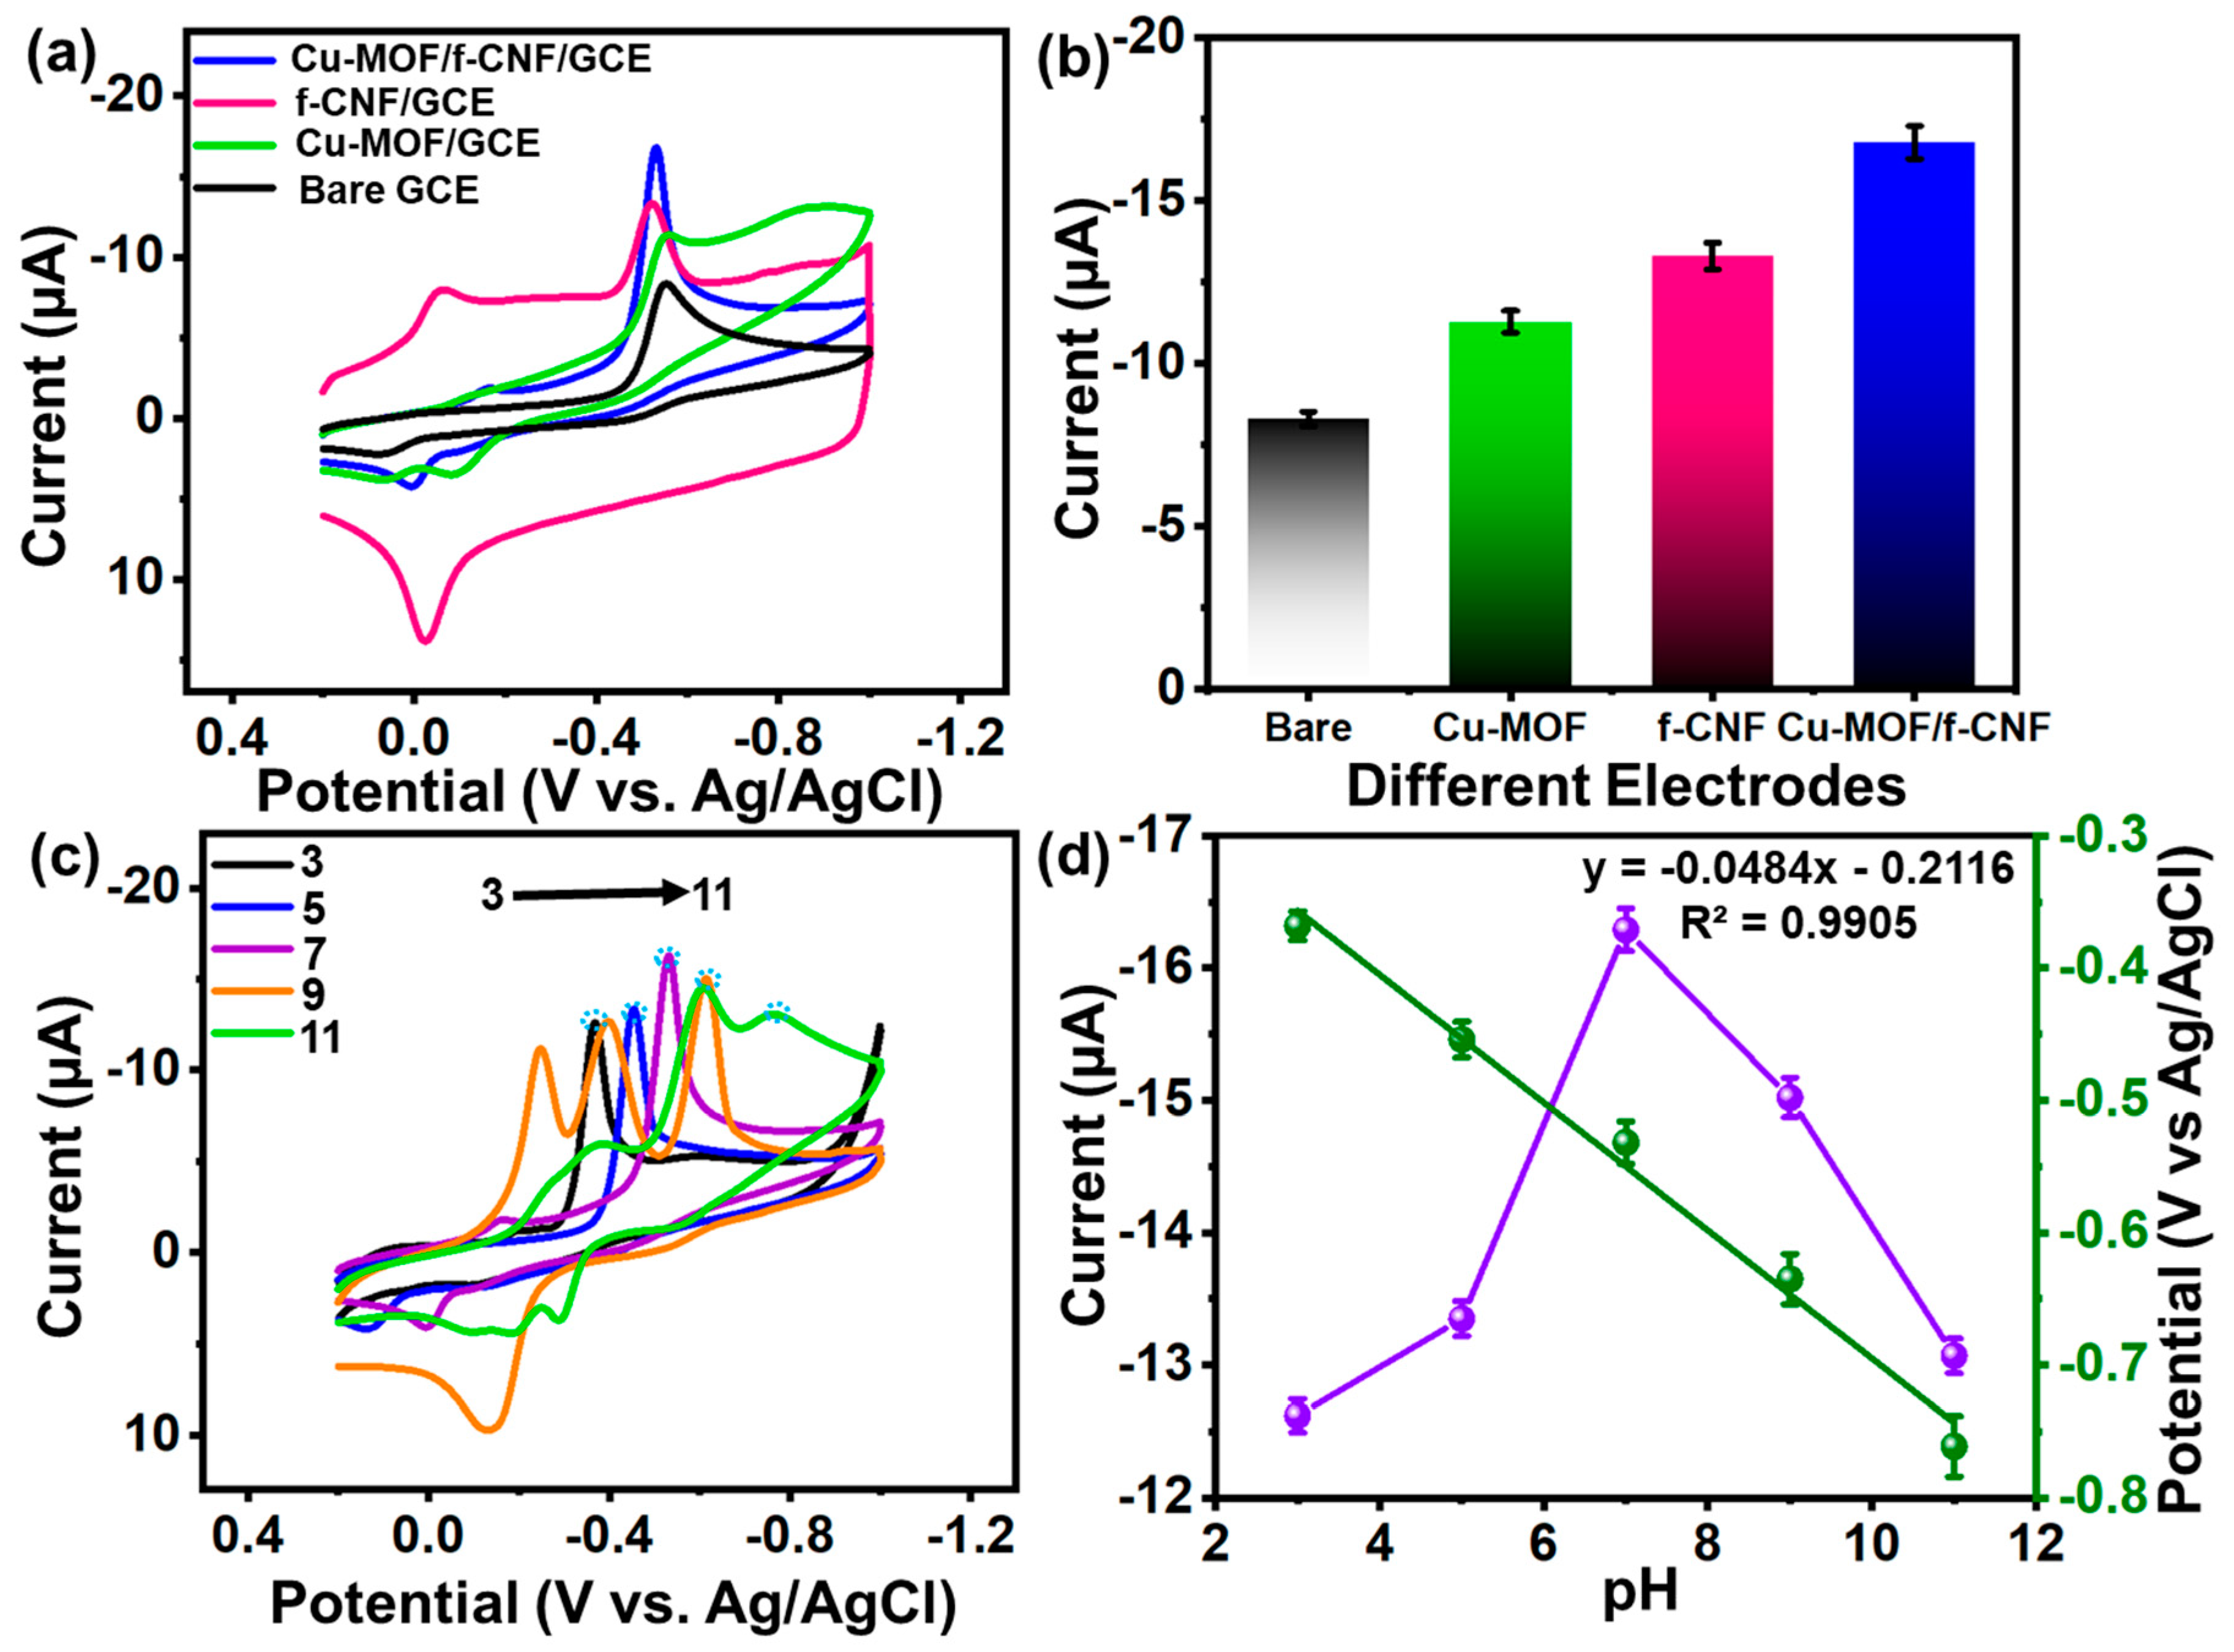
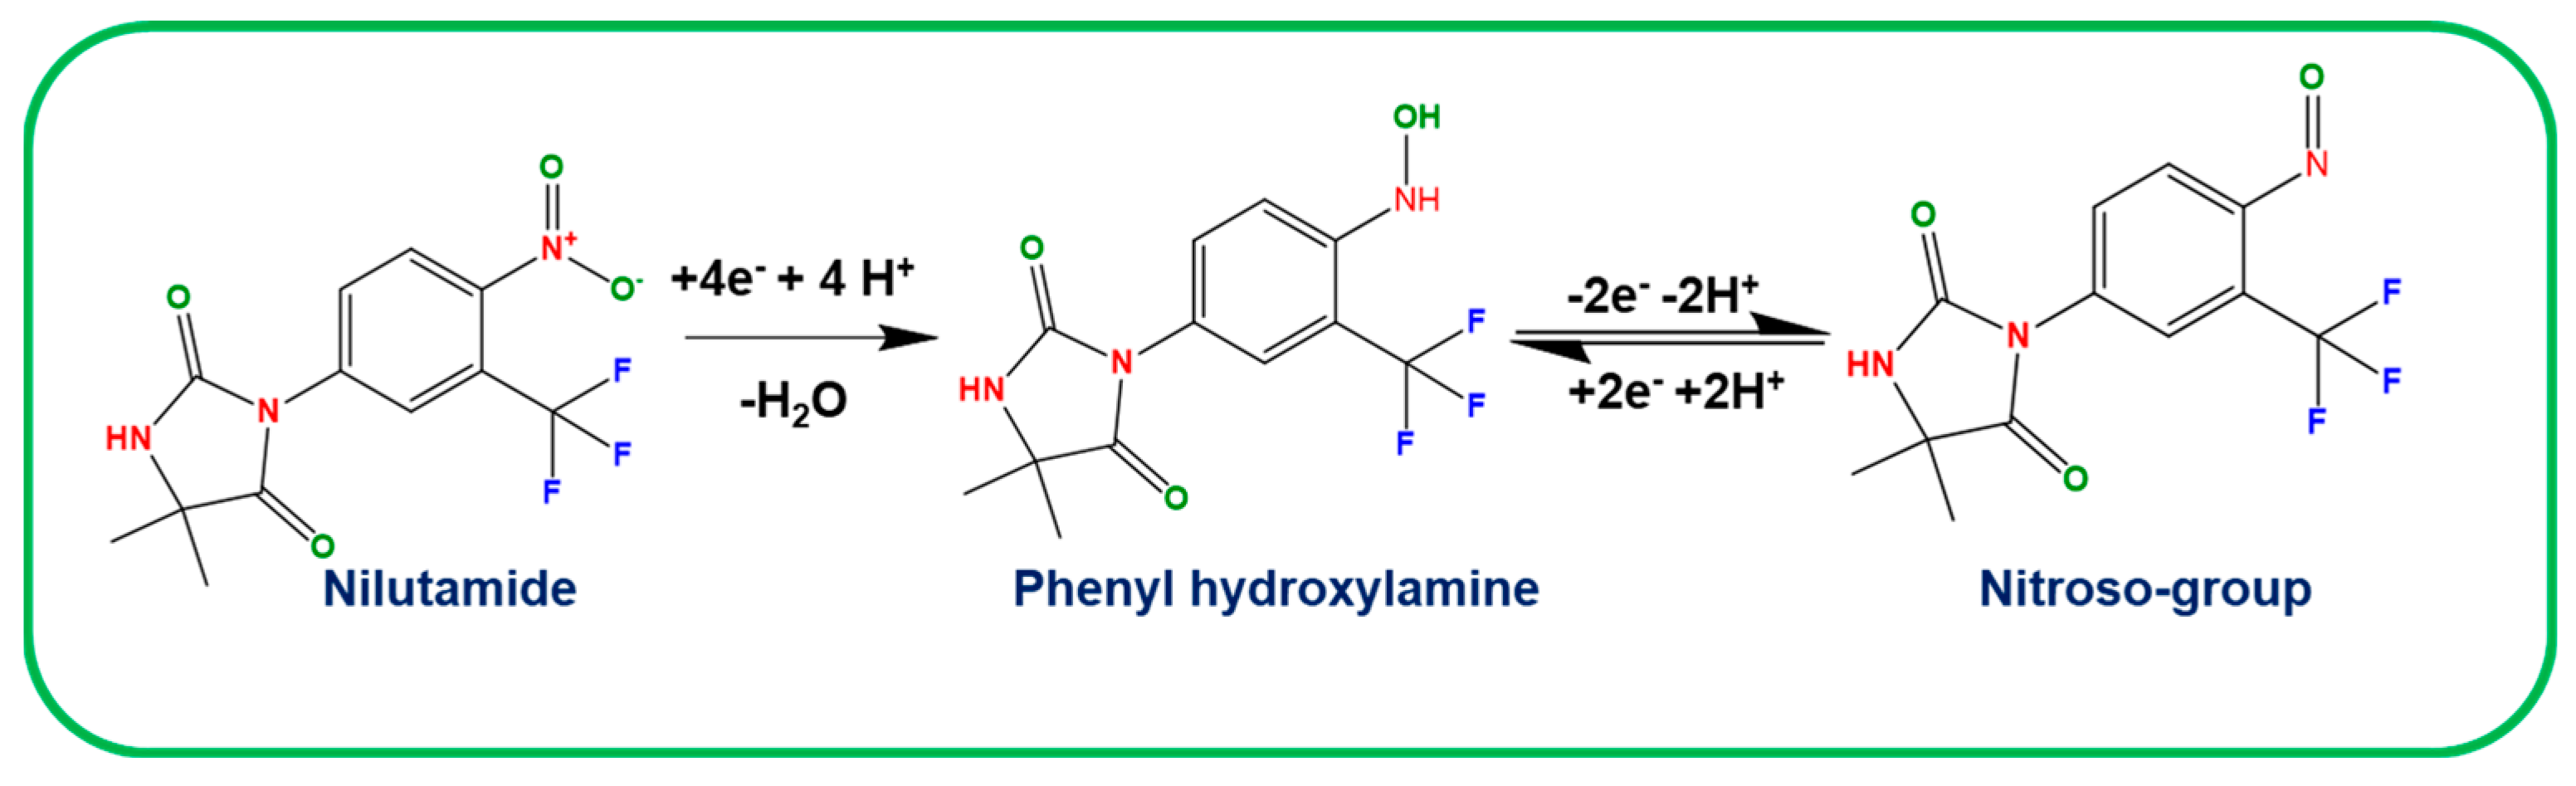
3.4.2. Electrochemical Behavior of Electrode

The CV analysis was carried out to test the electrocatalytic performance of the bare GCE, Cu-MOF/GCE, F-CNF/GCE, and Cu-MOF/f-CNF/GCE in 0.1 M PB solution at a 50 mV s−1 scan rate with the addition of 100 µM Nlu, as shown in Figure 8a. The results demonstrate that the bare GCE showed poor response compared to the other modified GCEs. When Cu-MOF was modified on the surface of GCE, it showed a better response compared to the bare GCE. Further, the f-CNF carbon material provided a higher response compared to the bare GCE and Cu-MOF. Last, the MOF material combined with f-CNF under the sonication process yielded a higher response in double the time compared to bare GCE (Figure 8b). It is evident that the results obtained with the various modified electrodes are better than those obtained with previous electrocatalytic tests. Cu-MOF/f-CNF adsorbed Nlu to their active sites, and when the electrocatalyst subsequently converted the Nlu to its reduced form, with a small oxidation peak. In contrast, the f-CNF supported charge transport from catalytic sites to electrode circuits, thus generating higher electrochemical responses. The loading concentration of Cu-MOF/f-CNF to the bare GCE with 50 µM Nlu in the 0.1 M PB solution was varied to achieve a higher electrochemical response in Nlu, and Figure 7b shows the electrochemical response of the various coating concentrations (2, 4, 6, and 8 µL) of Cu-MOF/f-CNF. Nlu had the highest maximal reduction peak response when coated with 6 µL and the lowest maximum reduction peak response when coated with 4 µL. The high mass loading of Cu-MOF/f-CNF at the interfaces led to significant reductions in electrochemical response compared to that of the 8 µL coating.
Electrochemical response is heavily influenced by the pH of electrolytes, so CV performance was tested for pH changes. The CV results of the addition of Cu-MOF/f-CNF/GCE to 100 M Nlu in a 0.1 M PB solution at different pH levels are shown in Figure 8c. The peak Ip results of Nlu grew steadily with increasing pH from pH 3.0 to 7.0, but it began to decrease from pH 7.0 to 11.0. This increase and decrease was due to the active engagement of protons in the reduction process of Nlu in a modified electrode. Figure 8d depicts the relationship between the achieved reduction peak current vs. pH vs. reduction peak current potential, with a linear relationship where Ip = −0.0484 [µM] − 0.2116 and correlation coefficient R2 = 0.9905. The volcanic cure and linear plot were the most common representations of pH current variation from a steady increment of pH 3.0 and subsequently a reduction in current from pH 7.0 for a linear representation of peak potential. Based on the pH impact, pH 7.0 (0.1 M of PB) was adequate for electrochemical performance analysis and was employed in all subsequent studies. Based on a plot of cathodic peak potential and pH, 48 mV/s was calculated as the slope value. The value was substituted from Equation (4) below [40]:
dEp/dpH = (−2.303 mRT)/nF
In this equation, dEp/dpH represents the slope, m represents the protons transferred, n represents the electrons transferred, T represents the measurement temperature, R represents the gas constant, and F represents the Faraday constant. In the reduction of Nlu at Cu-MOF/f-CNF/GCE, the calculated m/n ratio was equal to 0.82 based on Equation (4). This is nearly equal to one, indicating that equal numbers of protons and electrons were involved. The electrochemical reduction of Nlu at Cu-MOF/f-CNF/GCE was carried out by a reduction followed by an oxidation peak, i.e., the Nlu was initially reduced to phenylhydroxylamine. Then, the phenylhydroxylamine was reduced to a nitroso group (via a quasi-reversible reaction) (Scheme 1).
The electrochemical performance of Cu-MOF/f-CNF/GCE towards Nlu was studied by adding different amounts of Nlu to confirm the influence of concentration on the modified material, as shown in Figure 9a. Extensive testing was carried out with Nlu concentrations that varied from 10 to 100 µM at 0.1 M PB at pH 7.0 with a sweep rate of 50 mV s−1. The impacts of concentration demonstrate that, as the Nlu concentration rose gradually, its reduction current increased linearly, which was because of an increase in electrolyte ionic strength and a reduction in product and interaction with the surface area of the synthesized material. The calibration curve derived from the straight-line connection between the increased Nlu concentration and the cathodic peak current obtained is shown in Figure 9b, showing a regression equation of Ipc = −0.4402 (Nlu (µM)) × −0.5327 and a correlation coefficient of R2 = 0.9977. The graph shows that as Nlu concentration increased, the peak current increased gradually from lower to higher levels, resulting in an ideal result for the interrelationship between the specified analyte and the produced material.
A scan rate is important in electrochemical sensing performance to explain how the electrode is formed via an adsorption- or diffusion-controlled process. As shown in Figure 9c, a reduction peak current was obtained within the 20 to 200 mVs−1 range for 100 µM of Nlu scanning for Cu-MOF/f-CNF/GCE. An increase in the reduction peak current potential, along with a small peak shift in potential (Ep) and a regression equation of R2 = 0.9968 and Ipc (µA) = −0.0777 (m Vs−1) × −12.305, indicates that an irreversible natural process occurred with the electrode and its surface. In Figure 9d, the calibration curve obtained for the effect of the scan rate can be seen, where the rise in the scan rate was accompanied by an increase in peak current, which might have been due to the active ion charge transfer, which illustrates the surface charge distribution between the analyte and the prepared material for the specific amount of Nlu. Finally, Cu-MOF/f-CNF/GCE determined Nlu under the adsorption control process.

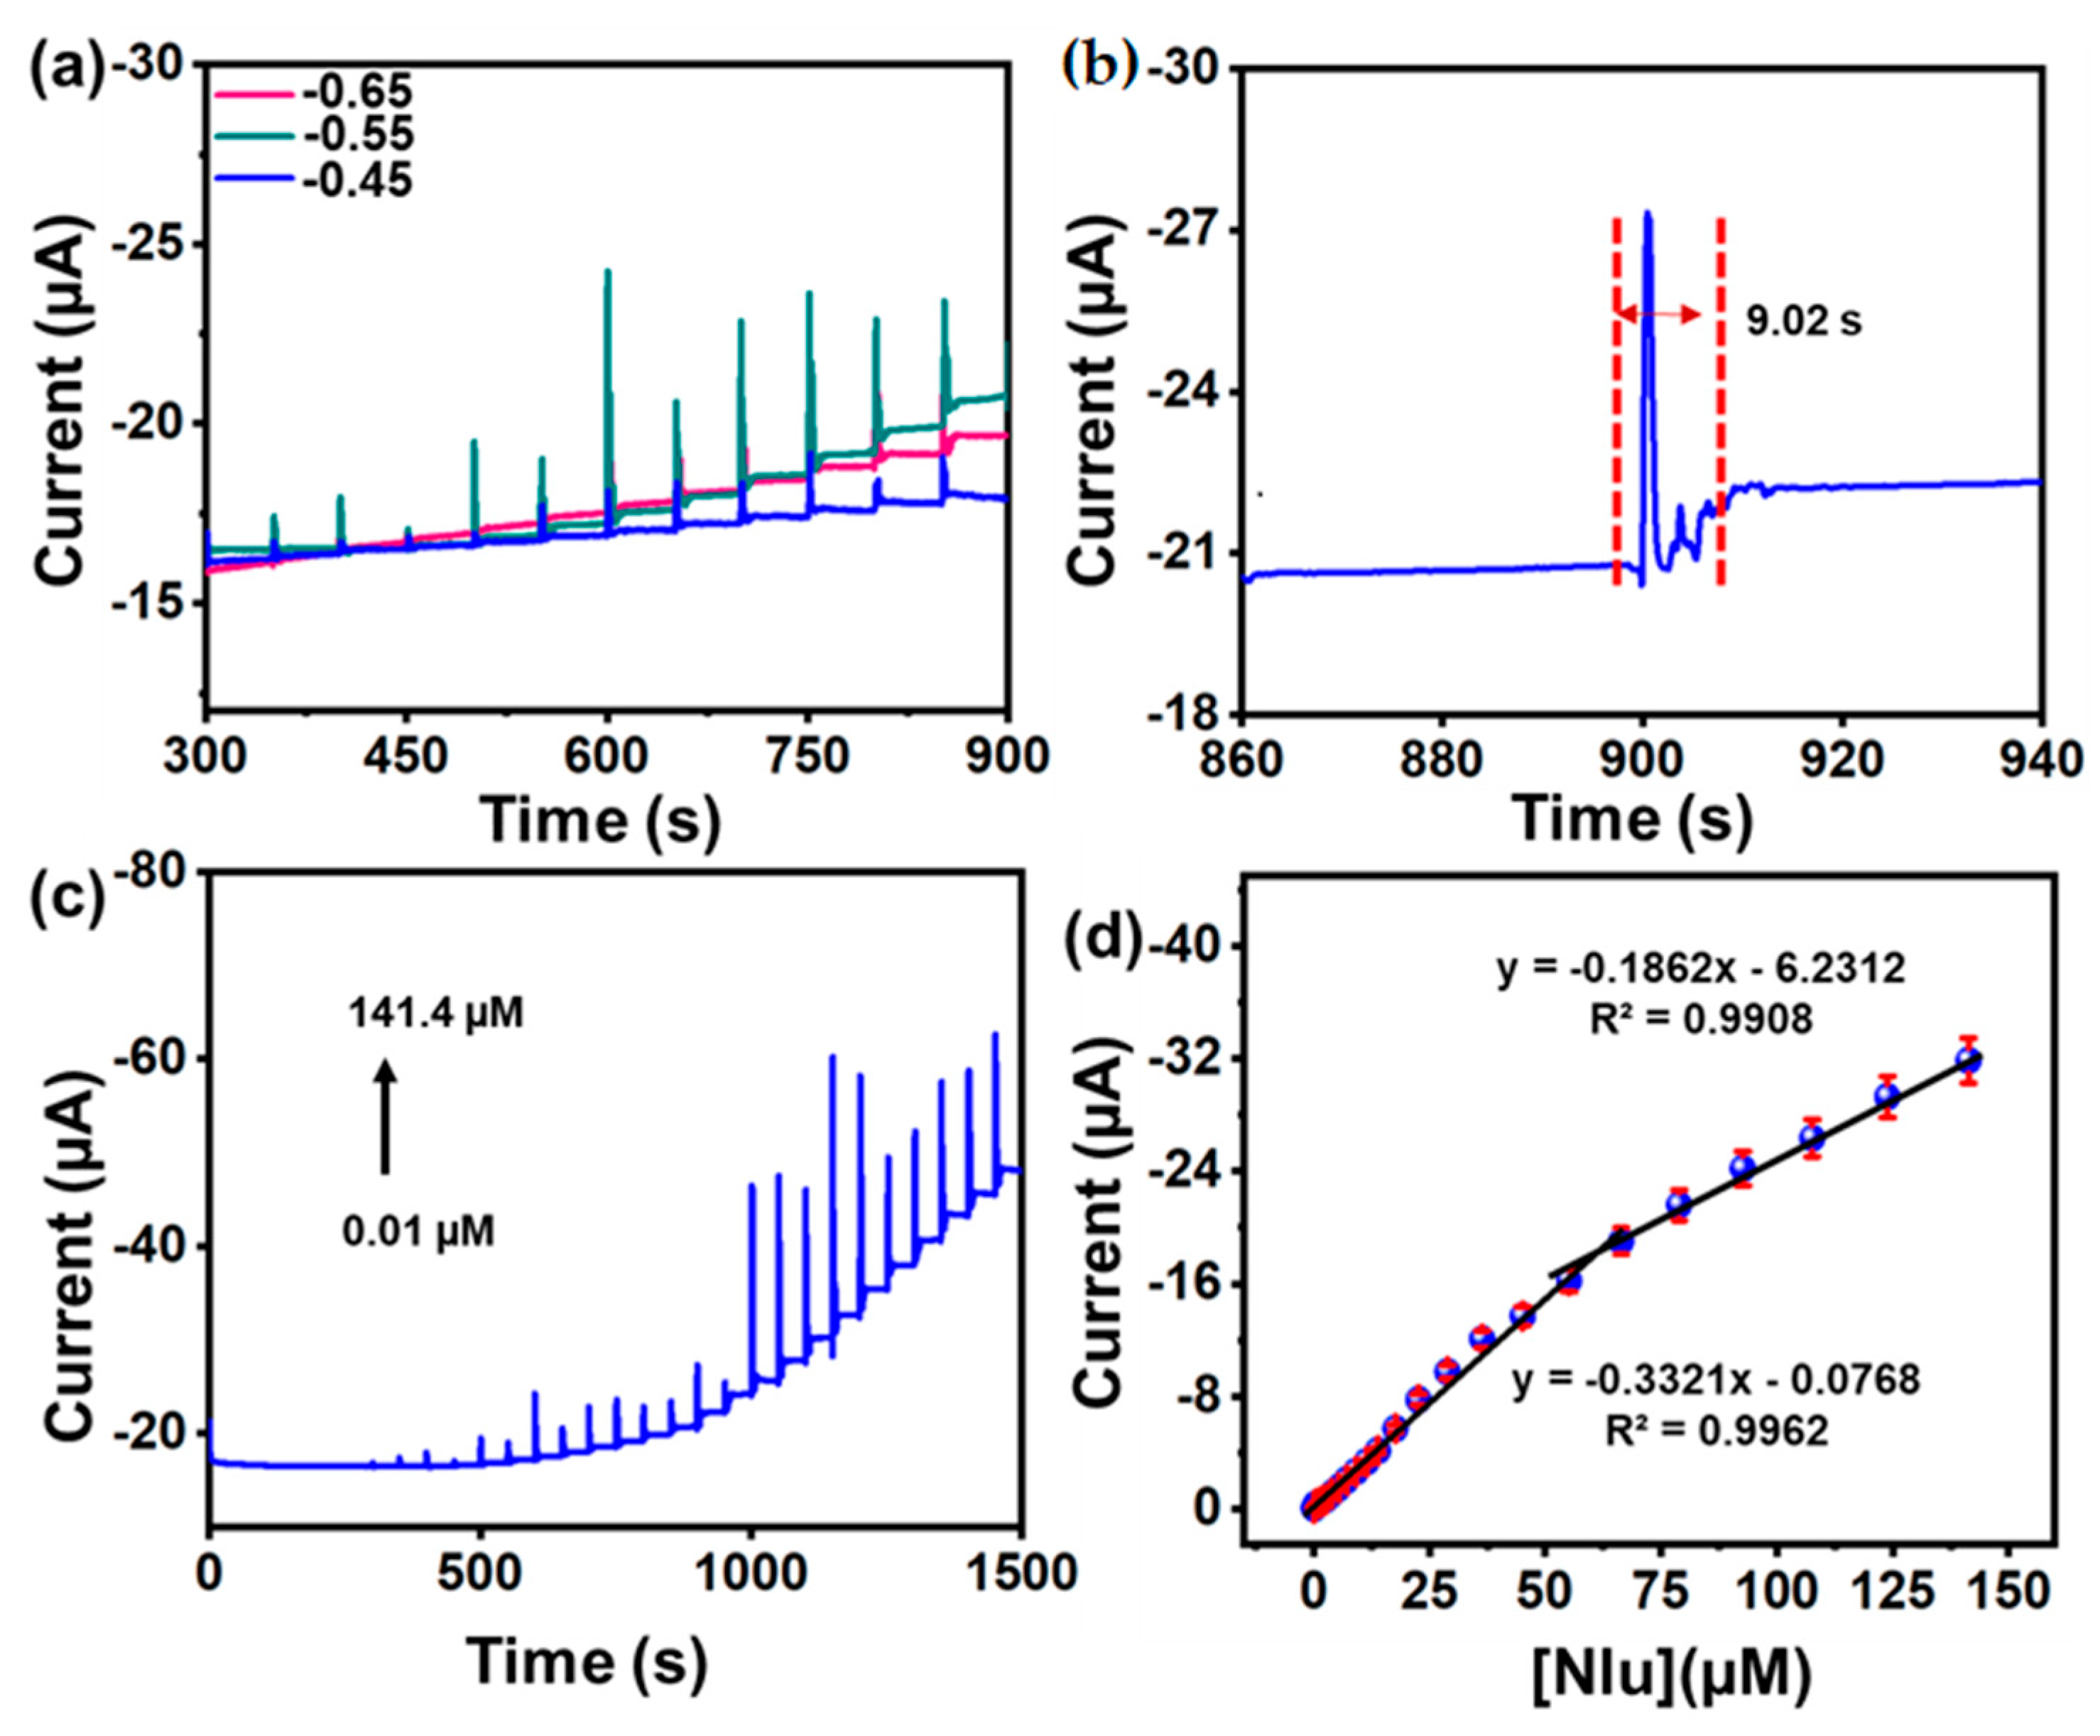
3.4.3. Amperometric (i-t) Determination of Nlu

Nlu was measured using the amperometry-i-t technique and the Cu-MOF/f-CNF composite. Nlu was conventionally added to the electrochemical cell, which was filled with 80 mL of 0.1 M PB solution (pH 7) and N2 gas and complied with the aforementioned experimental conditions. Amperometry with the potential applied was initially assessed to ensure that the Nlu received the best response possible. Cu-MOF/f-CNF/ rotating disc electrode (RDE) provided better findings, and the study yielded results of the current response of Nlu within 9.02 S at −0.55 V (Figure 10a,b). The Cu-MOF/f-CNF-modified RDE amperometric responses are illustrated in Figure 10c at a cathodic peak of 0.55 V. The Nlu concentration increased linearly from 0.01 to 141.4 µM, and the cathodic current response increased proportionally. Based on the calibration plot in Figure 10b, the cathodic peak currents were linearly related to Nlu concentration (R2 = 0.996 and 0.9908, respectively). The slope (0.3321) of the calibration plot calculated from the linear plot and its substitute in Equations (5) and (6) yielded the limit of detection (LOD) (slope) and sensitivity (slope of calibration plot/active surface area), which were 0.0026 µM and 1.69 µA/µM.cm−2, respectively. As shown in Table 1, the Cu-MOF/f-CNF-modified electrode was comparable to previously published Nlu electrochemical detection studies.
LOD = 3 S/Q
where Q is the slope value (0.3321) and S is the standard deviation (three measurements of blank value).
Sensitivity = Q/A
The Q (slope) and A (active surface area) of RDE were used in this experiment.

3.4.4. Effect of Anti-Interference, Reproducible Nature, and Operational and Storage Stability of Modified Electrode

In order to ensure a sensor’s dependability, it is crucial to evaluate how well it performs while there are potential interferons present. At concentrations 20 times greater than Nlu, interferons like uric acid, dopamine, ascorbic acid, Na+, SO42−, Mg2+, nitrofurantoin, furazolidone, and 4-nitrobenzene were added. The Nlu amperometric signals at Cu-MOF/f-CNF (Figure S2a) show that the presence of interfering molecules had no effect on the Nlu current response. Additionally, the Cu-MOF/f-CNF-modified electrode displayed exceptional amperometric performance across a 1500 s period of stable operation (Figure S2b). By performing four distinct packs of four different GCEs modified with Cu-MOF/f-CNF in the presence of Nlu, the sensor’s repeatability was assessed. As shown in Figure S2c, the Cu-MOF/f-CNF/GCE sensors’ peak current responses for 25 µM Nlu resulted in an RSD of 1.33%. Additionally, it was discovered that Cu-MOF/f-CNF-modified RDE stored and used for 20 days in the presence of Nlu exhibited good lifetime stability, with an RSD value of 1.56% (Figure S2d). The developed electrochemical sensor had outstanding anti-interference capabilities, remarkable stability, and good, acceptable reproducibility, according to the findings.

3.4.5. Real-Time Sample Analysis for Nlu

By measuring the concentration of Nlu in human urine and water samples, the usefulness of the Cu-MOF/f-CNF-modified electrode for real-time sensing was determined. The Xindian River in Taipei was used to collect the water sample. To eliminate any undesirable materials, the human urine sample taken from a healthy person was filtered. The standard addition procedure, as previously published, was used to calculate the recovery % of the Nlu-spiked samples [40]. The results in Figure S3a,b show good recovery rates for the water and urine samples of 97.3–99.1% (Table 2), which indicates a high degree of accuracy for electrochemical measurement of NT in real-world samples.

4. Conclusions

In conclusion, an easy hydrothermal process was used to create a polyhedron-like composite of Cu-MOF on f-CNF, which was then used for the electrochemical identification of Nlu. The Cu-MOF/f-CNF composite’s physical properties were carefully studied using XRD patterns, SEM, EDX spectra, elemental mapping, and XPS analyses. In comparison to bare GCE, Cu-MOF/GCE, and f-CNF/GCE, Cu-MOF/f-CNF/GCE exhibited excellent electrocatalytic activity in terms of the reduction peak current and cathodic peak potential for the determination of Nlu. The broad linear range, low limit of detection, excellent sensitivity, good reproducibility, repeatability, and long-term stability highlight the electrode’s superior electrochemical performance. Additionally, it performed admirably in determining Nlu in samples of river water and human urine, with acceptable recovery values. Therefore, the Cu-MOF/f-CNF composite may be a viable and intriguing candidate for use in actual electrochemical sensing applications.

Supplementary Materials

The following supporting information can be downloaded at: https://www.mdpi.com/article/10.3390/chemosensors11100544/s1, Figure S1: Scanning electron microscopic images of (a,b) Cu-MOF (c-d) f-CNF and (e–f) Cu-MOF/f-CNF composite; Figure S2. (a) anti interference response of Cu-MOF/f-CNF/RDE in presence of Nlu addition, (b) operation stability of Cu-MOF/f-CNF/RDE in presence of Nlu, (c), (d) Cu-MOF/f-CNF modified different GCEs and storage stability in presence of Nlu; Figure S3. i-t current response of real samples (a) water, and (b) urine.

Author Contributions

Conceptualization, E.E. and S.-F.W.; Methodology, E.E. and S.-F.W.; Validation, E.E. and S.-F.W.; Formal analysis, E.E. and S.-F.W.; Investigation, E.E.; Resources, E.E. and S.-F.W.; Writing—original draft, E.E.; Writing—review & editing, E.E.; Funding acquisition, S.-F.W. All authors have read and agreed to the published version of the manuscript.

Funding

The authors are thankful to the Ministry of Science and Technology (Special Research Project-MOST-108-2221-E-027-063) and National Taipei University of Technology, Taiwan, for the research grants.

Institutional Review Board Statement

Not applicable.

Informed Consent Statement

Informed consent was obtained from all subjects involved in the study.

Data Availability Statement

Data sharing not applicable.

Conflicts of Interest

The authors declare no conflict of interest.

References

  1. Haidyrah, A.S.; Sundaresan, P.; Venkatesh, K.; Ramaraj, S.K.; Thirumalraj, B. Fabrication of functionalized carbon nanofibers/carbon black composite for electrochemical investigation of antibacterial drug nitrofurantoin. Colloids Surf. A Physicochem. Eng. Asp. 2021, 627, 127112. [Google Scholar] [CrossRef]
  2. Turner, A.P.F. Perspective-an age of sensors. ECS Sens. Plus 2022, 1, 011601. [Google Scholar] [CrossRef]
  3. Moonla, C.; Lee, D.H.; Rokaya, D.; Rasitanon, N.; Kathayat, G.; Lee, W.-Y.; Kim, J.; Jeerapan, I. Lab-in-a-mouth and advanced point-of-care sensing systems: Detecting bioinformation from the oral cavity and saliva. ECS Sens. Plus 2022, 1, 021603. [Google Scholar] [CrossRef]
  4. Hwa, K.; Ganguly, A.; Santhan, A.; Sharma, T. Construction of three-dimensional/one-dimensional heterostructure of flower-like Sr nanoflowers on Se microrods decorated on reduced graphene oxide: An efficient electrocatalyst for oxidation of promethazine hydrochloride. Mater. Today Chem. 2022, 23, 100654. [Google Scholar] [CrossRef]
  5. Hortobagyi, G. Anthracyclines in the treatment of cancer: An overview. Drugs 1997, 54, 1–7. [Google Scholar] [PubMed]
  6. Znaleziona, J.; Maier, V.; Petr, J.; Chrastina, J.; Ševčík, J. MEKC determination of nilutamide in human serum using sweeping in high salt sample matrix. Chromatographia 2011, 74, 151–155. [Google Scholar] [CrossRef]
  7. Janknegt, R.; Abbou, C.; Bartoletti, R.; Bernstein-Hahn, L.; Bracken, B.; Brisset, J.; Da Silva, F.C.; Chisholm, G.; Crawford, E.; Debruyne, F. Orchiectomy and nilutamide or placebo as treatment of metastatic prostatic cancer in a multinational double-blind randomized trial. J. Urol. 1993, 149, 77–82. [Google Scholar] [CrossRef]
  8. Álvarez-Lueje, A.; Pena, C.; Núñez-Vergara, L.J.; Squella, J. Electrochemical study of flutamide, an anticancer drug, and its polarographic, UV spectrophotometric and HPLC determination in tablets. Electroanalysis 1998, 10, 1043–1051. [Google Scholar] [CrossRef]
  9. Madan, R.A.; Gulley, J.L.; Schlom, J.; Steinberg, S.M.; Liewehr, D.J.; Dahut, W.L.; Arlen, P.M. Analysis of overall survival in patients with nonmetastatic castration-resistant prostate cancer treated with vaccine, nilutamide, and combination therapy. Clin. Cancer Res. 2008, 14, 4526–4531. [Google Scholar] [CrossRef]
  10. Harris, M.G.; Coleman, S.G.; Faulds, D.; Chrisp, P. Nilutamide: A review of its pharmacodynamic and pharmacokinetic properties, and therapeutic efficacy in prostate cancer. Drugs Aging 1993, 3, 9–25. [Google Scholar] [CrossRef] [PubMed]
  11. Sarat, P.; Ramachandran, D. Two new UV-visible spectrophotometric methods for the determination of nilutamide in pure and their tablets using 2, 3-Dichloro-5, 6-Dicyano-1, 4-benzoquinone (DDQ) and Para Chloranilic acid (PCA). Int. J. Pharm. Pharm. Res. 2015, 2, 161–171. [Google Scholar]
  12. Payen, O.; Top, S.; Vessières, A.; Brulé, E.; Plamont, M.-A.; McGlinchey, M.J.; Müller-Bunz, H.; Jaouen, G. Synthesis and structure–activity relationships of the first ferrocenyl-aryl-hydantoin derivatives of the nonsteroidal antiandrogen nilutamide. J. Med. Chem. 2008, 51, 1791–1799. [Google Scholar] [CrossRef]
  13. Arlen, P.M.; Gulley, J.L.; Todd, N.; Lieberman, R.; Steinberg, S.M.; Morin, S.; Bastian, A.; Marte, J.; Tsang, K.-Y.; Beetham, P. Antiandrogen, vaccine and combination therapy in patients with nonmetastatic hormone refractory prostate cancer. J. Urol. 2005, 174, 539–546. [Google Scholar] [CrossRef]
  14. Temerk, Y.; Ibrahim, H.; Farhan, N. Square wave adsorptive stripping voltammetric determination of anticancer drug nilutamide in biological fluids using cationic surfactant cetyltrimethylammonium bromide. Anal. Methods 2015, 7, 9137–9144. [Google Scholar] [CrossRef]
  15. Sundaresan, P.; Yamuna, A.; Chen, S.-M. Sonochemical synthesis of samarium tungstate nanoparticles for the electrochemical detection of nilutamide. Ultrason. Sonochem. 2020, 67, 105146. [Google Scholar] [CrossRef]
  16. Carvalho, M.M.; Ribeiro, D.S.; Santos, J.L.; Prior, J.A. pH-sensitive spectrophotometric control of nilutamide in an automatic micro-flow system. New J. Chem. 2014, 38, 2856–2864. [Google Scholar] [CrossRef]
  17. Sriram, B.; Baby, J.N.; Hsu, Y.-F.; Wang, S.-F.; George, M.; Veerakumar, P.; Lin, K.-C. Electrochemical sensor-based barium zirconate on sulphur-doped graphitic carbon nitride for the simultaneous determination of nitrofurantoin (antibacterial agent) and nilutamide (anticancer drug). J. Electroanal. Chem. 2021, 901, 115782. [Google Scholar] [CrossRef]
  18. Sharma, T.S.K.; Hwa, K.-Y. Rational design and preparation of copper vanadate anchored on sulfur doped reduced graphene oxide nanocomposite for electrochemical sensing of antiandrogen drug nilutamide using flexible electrodes. J. Hazard. Mater. 2021, 410, 124659. [Google Scholar] [CrossRef] [PubMed]
  19. Sriram, B.; Kogularasu, S.; Wang, S.-F.; Sheu, J.-K. Deep Eutectic Solvent-Mediated Synthesis of Spinel Zinc Chromite Nanoparticles: A Simple Label-Free Electrochemical Sensor for Dopamine and Ascorbic Acid. ACS Appl. Nano Mater. 2023, 6, 17593–17602. [Google Scholar] [CrossRef]
  20. Dey, B.; Ahmad, M.W.; Kim, B.H.; Kamal, T.; Yang, D.-J.; Patra, C.N.; Hossain, S.; Choudhury, A. Manganese cobalt-MOF@carbon nanofiber-based non-enzymatic histamine sensor for the determination of food freshness. Anal. Bioanal. Chem. 2023, 415, 3487–3501. [Google Scholar] [CrossRef] [PubMed]
  21. Li, J.; Xia, J.; Zhang, F.; Wang, Z.; Liu, Q. An electrochemical sensor based on copper-based metal-organic frameworks-graphene composites for determination of dihydroxybenzene isomers in water. Talanta 2018, 181, 80–86. [Google Scholar] [CrossRef] [PubMed]
  22. Lin, K.-Y.A.; Hsieh, Y.-T. Copper-based metal organic framework (MOF), HKUST-1, as an efficient adsorbent to remove p-nitrophenol from water. J. Taiwan Inst. Chem. Eng. 2015, 50, 223–228. [Google Scholar]
  23. Micheroni, D.; Lan, G.; Lin, W. Efficient electrocatalytic proton reduction with carbon nanotube-supported metal–organic frameworks. J. Am. Chem. Soc. 2018, 140, 15591–15595. [Google Scholar] [CrossRef]
  24. Dey, B.; Sarkhel, G.; Choudhury, A. Facile synthesis of copper MOF/carbon nanofiber nanocomposite paper for electrochemical detection of toxic 4-nitrophenol. J. Macromol. Sci. Part A 2023, 60, 150–160. [Google Scholar] [CrossRef]
  25. Mariyappan, V.; Chen, S.-M.; Jeyapragasam, T.; Devi, J.M. Designing and construction of a cobalt-metal-organic framework/heteroatoms co-doped reduced graphene oxide mesoporous nanocomposite based efficient electrocatalyst for chlorogenic acid detection. J. Alloys Compd. 2022, 898, 163028. [Google Scholar] [CrossRef]
  26. Ramaraj, S.; Mani, S.; Chen, S.-M.; Kokulnathan, T.; Lou, B.-S.; Ali, M.A.; Hatamleh, A.; Al-Hemaid, F.M. Synthesis and application of bismuth ferrite nanosheets supported functionalized carbon nanofiber for enhanced electrochemical detection of toxic organic compound in water samples. J. Colloid Interface Sci. 2018, 514, 59–69. [Google Scholar] [CrossRef]
  27. Sukanya, R.; Chen, S.-M. Amorphous cobalt boride nanosheets anchored surface-functionalized carbon nanofiber: An bifunctional and efficient catalyst for electrochemical sensing and oxygen evolution reaction. J. Colloid Interface Sci. 2020, 580, 318–331. [Google Scholar] [CrossRef] [PubMed]
  28. Kokulnathan, T.; Sharma, T.S.K.; Chen, S.-M.; Han-Yu, Y. Synthesis and characterization of zirconium dioxide anchored carbon nanofiber composite for enhanced electrochemical determination of chloramphenicol in food samples. J. Electrochem. Soc. 2018, 165, B281. [Google Scholar] [CrossRef]
  29. Song, J.; Lin, X.; Ee, L.Y.; Li, S.F.Y.; Huang, M. A review on electrospinning as versatile supports for diverse nanofibers and their applications in environmental sensing. Adv. Fiber Mater. 2023, 5, 429–460. [Google Scholar] [CrossRef]
  30. Kang, S.; Zhao, K.; Yu, D.-G.; Zheng, X.; Huang, C. Advances in biosensing and environmental monitoring based on electrospun nanofibers. Adv. Fiber Mater. 2022, 4, 404–435. [Google Scholar] [CrossRef]
  31. Ahmad, M.W.; Dey, B.; Kim, B.-H.; Sarkhel, G.; Yang, D.-J.; Hossain, S.S.; Kamal, T.; Choudhury, A. Bimetallic copper-cobalt MOFs anchored carbon nanofibers hybrid mat based electrode for simultaneous determination of dopamine and tyramine. Microchem. J. 2023, 193, 109074. [Google Scholar] [CrossRef]
  32. Elanthamilan, E.; Ganeshkumar, A.; Wang, S.-F.; Rajaram, R. In situ synthesis of a non-toxic cobalt–benzimidazole metal–organic framework decorated reduced graphene oxide composite for asymmetric supercapacitor applications. New J. Chem. 2023, 47, 4832–4844. [Google Scholar] [CrossRef]
  33. Potter, M.E.; Ross, C.P.; Gianolio, D.; Rios, R.; Raja, R. Cobalt-containing zeolitic imidazole frameworks for C–H activation using visible-light redox photocatalysis. Catal. Sci. Technol. 2020, 10, 7262–7269. [Google Scholar] [CrossRef]
  34. Priscillal, I.J.D.; Wang, S.-F. Synchronously activated strontium aluminate nanoflakes anchored functionalized carbon nanofiber nanocomposite for sensitive amperometric detection of food additive: Propyl gallate. Food Chem. 2022, 389, 133119. [Google Scholar] [CrossRef]
  35. Priscillal, I.J.D.; Wang, S.J. Coral reef-like zinc niobate nanostructures decorated functionalized carbon nanofiber as electrode modifier for detection of oxidative stress biomarker: 3-nitro-L-tyrosine. Mater. Today Chem. 2022, 25, 100970. [Google Scholar] [CrossRef]
  36. Patil, Y.A.; Shankarling, G.S. Deep eutectic solvent-mediated, energy-efficient synthesis of copper terephthalate metal-organic framework and its application in degradation of an azo dye. Chem. Eng. J. Adv. 2020, 3, 100032. [Google Scholar] [CrossRef]
  37. Elanthamilan, E.; Wang, S.-F. Construction of 3D flower-like SnS particles anchored Ni-metal-organic framework composite: A novel positive electrode material for high-performance asymmetric supercapacitors. J. Energy Storage 2023, 71, 108144. [Google Scholar] [CrossRef]
  38. Brown, A.P.; Anson, F.C. Electron transfer kinetics with both reactant and product attached to the electrode surface. J. Electroanal. Chem. Interfacial Electrochem. 1978, 92, 133–145. [Google Scholar] [CrossRef]
  39. Hambly, B.P.; Sheppard, J.B.; Pendley, B.D.; Lindner, E. Voltammetric Determination of Diffusion Coefficients in Polymer Membranes: Guidelines to Minimize Errors. Electroanalysis 2018, 30, 681–689. [Google Scholar] [CrossRef]
  40. Karthik, R.; Sasikumar, R.; Chen, S.-M.; Kumar, J.V.; Elangovan, A.; Muthuraj, V.; Muthukrishnan, P.; Al-Hemaid, F.M.; Ali, M.A.; Elshikh, M.S. A highly sensitive and selective electrochemical determination of non-steroidal prostate anti-cancer drug nilutamide based on f-MWCNT in tablet and human blood serum sample. J. Colloid Interface Sci. 2017, 487, 289–296. [Google Scholar] [CrossRef] [PubMed]
  41. Hwa, K.-Y.; Santhan, A.; Ganguly, A.; Sharma, T.S.K. Two dimensional architectures of graphitic carbon nitride with the substitution of heteroatoms for bifunctional electrochemical detection of nilutamide. Chemosphere 2023, 320, 138068. [Google Scholar] [CrossRef] [PubMed]
  42. Rajaji, U.; Raghu, M.; Kumar, K.Y.; Almutairi, T.M.; Mohammed, A.A.; Juang, R.-S.; Liu, T.-Y. A sonochemical synthesis of SrTiO3 supported N-doped graphene oxide as a highly efficient electrocatalyst for electrochemical reduction of a chemotherapeutic drug. Ultrason. Sonochem. 2023, 93, 106293. [Google Scholar] [CrossRef]
  43. Balasubramanian, S.; Baby, J.N.; Hsu, Y.-F.; Wang, S.-F.; George, M. Design of Neodymium Vanadate Nanoparticles Decorated on Carbon–Boron Core-Shell Microspheres Matrix: An Electrochemical Detection of Nilutamide. J. Electrochem. Soc. 2022, 169, 087508. [Google Scholar] [CrossRef]
  44. Devi, R.K.; Ganesan, M.; Chen, T.-W.; Chen, S.-M.; Lou, B.-S.; Ali, M.A.; Al-Hemaid, F.M.; Li, R.-H. Gadolinium vanadate nanosheets entrapped with 1D-halloysite nanotubes-based nanocomposite for the determination of prostate anticancer drug nilutamide. J. Electroanal. Chem. 2022, 923, 116817. [Google Scholar] [CrossRef]
  45. Keerthana, S.; Rajapriya, A.; Viswanathan, C.; Ponpandian, N. Hybrid nanostructures of WS2 nanoflowers on N, B co-doped rGO for sensitive amperometric detection of Nilutamide. Mater. Today Chem. 2022, 26, 101052. [Google Scholar] [CrossRef]
  46. Kokulnathan, T.; Karthik, R.; Chen, S.-M.; Kumar, J.V.; Sakthinathan, S. A cerium vanadate interconnected with a carbon nanofiber heterostructure for electrochemical determination of the prostate cancer drug nilutamide. Microchim. Acta 2019, 186, 579. [Google Scholar] [CrossRef]
  47. Akhter, S.; Zain, N.K.M.; Shalauddin, M.; Singh, V.K.; Misnon, I.I.; Sharma, R.K.; Das, S.; Basirun, W.J.; Johan, M.R.; Jose, R. Tri-metallic Co-Ni-Cu based metal organic framework nanostructures for the detection of an anticancer drug nilutamide. Sens. Actuators A Phys. 2021, 325, 112711. [Google Scholar] [CrossRef]
Figure 1. Schematic representation of the synthesis of the Cu-MOF/f-CNF composite for the determination of Nlu.
Chemosensors 11 00544 g001
Figure 2. (a) XRD (b) FT-IR spectrum of Cu-MOF, f-CNF and Cu-MOF/f-CNF composite (c) crystal and (d) chemical structure of Cu-MOF.
Chemosensors 11 00544 g002
Figure 3. SEM images of (a) Cu-MOF, (b) f-CNF, and (c) the Cu-MOF/f-CNF composite.
Chemosensors 11 00544 g003
Figure 4. (ae) Elemental color-mapping analysis and (f) EDAX analysis of the Cu-MOF/f-CNF composite.
Chemosensors 11 00544 g004
Figure 5. (a) XPS survey spectrum, (b) Cu 2p, (c) C 1s, (d) N 1s, (e) O 1s.
Chemosensors 11 00544 g005
Figure 6. (a) Nyquist plots of different modified electrodes (inset: zoomed-in plot), (b) CV plots of different modified electrodes and bare GCE, (c) CV response of Cu-MOF/f-CNF/GCE in different scan rates (20 to 300 mV s−1), and (d) corresponding linear plot. Here every reaction takes place in a 5 mM [Fe(CN)6]3−/4− electrolyte.
Chemosensors 11 00544 g006
Figure 7. (a) CV response of different ratios of Cu-MOF and f-CNF with 50 µM Nlu at 50 mV s−1; (b) CV response of different volumes of Cu-MOF/f-CNF/GCE with 50 µM Nlu at 50 mV s−1.
Chemosensors 11 00544 g007
Figure 8. (a) CV response of different modified GCE and bare GCE with 100 µM Nlu in 0.1 M PBS (pH 7.0) at 50 mV s−1, (b) corresponding bar diagram, (c) CV response of Cu-MOF/f-CNF/GCE in different pH (3–11) with 100 µM Nlu at 50 mV s−1, and (d) corresponding plots of pH vs. cathodic peak current vs. potential.
Chemosensors 11 00544 g008
Scheme 1. Electrochemical mechanism of Nlu reduction at Cu-MOF/f-CNF/GCE.
Chemosensors 11 00544 sch001
Figure 9. (a) CV response of Cu-MOF/f-CNF/GCE with linear addition of Nlu (10 to 100 µM) in 0.1 M PBS at 50 mV s−1, (b) corresponding liner plots, (c) CV response of Cu-MOF/f-CNF/GCE at different scan rates (20 to 200 mV s−1) with 100 µM Nlu in 0.1 M PBS, and (d) corresponding linear plots.
Chemosensors 11 00544 g009
Figure 10. (a) i-t representation of different potential optimization, (b) steady-state i-t results, (c) i-t response of linear Nlu concentration, and (d) corresponding linear plot.
Chemosensors 11 00544 g010
Table 1. Comparison table of Cu-MOF/f-CNF with previously reported literature.
ElectrodesMethodsLinear Range (µM)LOD (µM)Reference
a S/P/g-C3N4i-t0.01–158.30.0024[41]
b SrTiO3/NGO/LIGEj DPV0.02–8920.0012[42]
c NdVO4/B-Ci-t0.001–3440.0002[43]
d GdV/HNTDPV0.5–4780.0018[44]
e WS2/N, B-rGOi-t0.1–2500.003[45]
f BZO/SCNDPV0.09–189.610.006[17]
g CeV/CNFDPV0.01–5402.0[46]
h Co-Ni-Cu-MOF/NFDPV0.5–9000.00048[47]
SNPsDPV0.05–9180.0026[10]
Cu-MOF/f-CNFi-t0.01–141.40.002This work
a S/P/g-C3N4—sulfur- and phosphorous-doped graphitic carbon nitride; b SrTiO3—strontium titanate, NGO—nitrogen-doped graphene oxide, LIGE—laser-induced graphene electrode; c NdVO4—neodymium vanadate, B-C—carbon–boron; d GdV—gadolinium vanadate, HNT—halloysite nanotubes; e WS2—tungsten disulfide, N, B-rGO—nitrogen, boron-doped reduced graphene oxide; f BZO—barium zirconate, SCN—sulfur-doped graphitic carbon nitride; g CeV—cerium vanadate, CNF—carbon nanofiber; h Co-Ni-Cu-MOF—cobalt, nickel, and copper metal–organic framework, NF—nickel foam; j DPV—differential pulse voltammetry.
Table 2. Real sample recovery percentage.
Real SamplesAdded
(nM)
Found
(nM)
Recovery
(%)
8079.8599.1
River water10099.7998.8
120119.7898.9
10099.5997.7
Human urine120119.6598.2
140139.4397.3
Disclaimer/Publisher’s Note: The statements, opinions and data contained in all publications are solely those of the individual author(s) and contributor(s) and not of MDPI and/or the editor(s). MDPI and/or the editor(s) disclaim responsibility for any injury to people or property resulting from any ideas, methods, instructions or products referred to in the content.

