Article

Quantitative Analysis of Meteorite Elements Based on the Multidimensional Scaling–Back Propagation Neural Network Algorithm Combined with Raman Mapping-Assisted Micro-Laser Induced Breakdown Spectroscopy

1
Key Laboratory of Space Active Opto-Electronics Technology of the Chinese Academy of Sciences, Shanghai Institute of Technical Physics, Chinese Academy of Sciences, Shanghai 200083, China
2
College of Surveying and Geo-Informatics, Tongji University, Shanghai 200092, China
3
University of the Chinese Academy of Sciences, Beijing 100049, China
4
Key Laboratory of Systems Health Science of Zhejiang Province, School of Life Science, Hangzhou Institute for Advanced Study, University of Chinese Academy of Sciences, Hangzhou 310024, China
5
Geological Brigade 105, Bureau of Geology and Mineral Exploration and Development of Guizhou Province, Guiyang 550018, China
6
College of Resources and Environmental Engineering, Guizhou University, Guiyang 550025, China
*
Authors to whom correspondence should be addressed.
These authors contributed equally to this work.
Chemosensors 2023, 11(11), 567; https://doi.org/10.3390/chemosensors11110567
Submission received: 25 August 2023 / Revised: 30 October 2023 / Accepted: 13 November 2023 / Published: 20 November 2023

Abstract

:
Meteorites are an essential reference for human exploration of the universe and its cosmic evolution and an essential research object for searching for extraterrestrial life. Ways to quickly identify and screen suspected meteorite samples have become the foundation and prerequisite for research on high-value meteorite samples. Therefore, this paper proposes a Raman mapping-assisted micro-laser induced breakdown spectroscopy (micro-LIBS) technology for field detection of suspected meteorite material composition without sample pre-processing, with a high detection speed and cost-effectiveness, to realize the detection of element composition and molecular structure. Raman mapping carries out multispectral imaging with high spectral resolution of the region of interest. The fusion of Raman mapping and optical microscopy images can provide mineral categories and spatial distribution characteristics in regions of interest. A quantitative analysis model for Fe, Mg, and Na elements was constructed based on the multidimensional scaling–back propagation neural network (MDS-BPNN) algorithm. The determination coefficient of the model test set was better than 0.997, and the root mean square error was better than 0.65. The content of Fe, Mg, and Na elements in the meteorite was preliminarily evaluated, providing a reference for further analysis of element information in spectral image fusion data. The Raman–LIBS combined technology has significant application potential in rapidly evaluating suspected meteorite samples. Without high-end precision instruments or field research, this technology can provide scientists with significant reference value atomic and molecular spectral information. At the same time, this technology can be extended to other petrology research. We offer a fast, efficient, cost-effective, and reliable analysis scheme for reference.

1. Introduction

As an optical emission spectroscopy technology, Laser-induced breakdown spectroscopy (LIBS) ablates the sample surface by focusing on a pulsed laser and generating plasma luminescence. The generation process of LIBS is similar to that of arc/spark emission spectroscopy [1,2]. LIBS is widely used in deep space exploration [3,4,5,6,7], as it can realize the analysis of almost all elements and applies to gas [8,9], liquid [10,11], and solid [12] samples. In addition, in combination with different optical path systems, LIBS can achieve rapid response real-time monitoring of remote sensing or in situ detection [13,14], showing significant advantages and potential in biomedicine [15,16], environmental protection [17], geological exploration [18], archaeological research [19], metallurgical detection [20], and coal and carbon analysis [21].
The fusion of LIBS and Raman data can effectively improve the classification and identification of rock and geological samples. Rammelkamp et al. [22] conducted a low-level fusion of LIBS and Raman data to improve its ability to identify rock samples. Wang et al. [23] proposed a mid-level data fusion of LIBS and Raman data. They constructed a convolutional neural network (CNN) model to classify and recognize ore samples, with an identification accuracy of 98%. Moros et al. [24] proposed a high-level data fusion architecture, to type most rock samples correctly.
With the development of in situ detection methods, 2- or 3-D elemental mapping techniques have become an essential tool in geochemical analysis, combining geochemical information with geomorphological features to obtain structural and compositional characteristics. Compared with the traditional X-ray fluorescence (XRF) method, LIBS mapping has the advantages of fast speed, high-depth resolution, and light elemental analysis ability [25]. Sun et al. [26] used the BPNN (back propagation neural network) with input variables optimized by RF (random forest) to classify the LIBS–Raman joint spectra of three kinds of meat, and the classification accuracy was as high as 99.42%. Chen et al. [27] used LIBS and a convolutional neural network with two-dimensional input (2D CNN) to recognize five rock samples. Lu et al. [28] used the CNN model to analyze the time-resolved LIBS data and improved the soil’s potassium determination. The R2 and RMSE of the CNN model were 0.9968 and 0.0785.
Traditional meteorite analysis methods include inductively coupled plasma mass spectrometry (ICP-MS), energy dispersive X-ray spectroscopy (EDX), scanning electron microscopy (SEM), X-ray diffraction (XRD), and electron probe microanalysis (EPMA). Stead et al. [29] used laser ablation quadrupole ICP-MS to detect the content of rare earth elements (La, Ce, Pr, Nd, Sm, Eu, Gd, Dy, Er, and Yb) in olivine. This method’s limit of determination (LOD) reached a level lower than ng/g, with a deviation of ~5–10%. Bsdok et al. [30] used reflection microscopy, electron probe microanalyses (EPMA), and electron microscopy (SEM) with energy-dispersive X-ray spectroscopy (EDX) to determine the concentration of trace elements in the Santa Rosa de Viterbo iron meteorite for the first time. As a result, significant concentrations of Au (>400 ppm) and Ge (>230 ppm) and major elements such as Fe, Ni, and Co in this meteorite were demonstrated. However, these traditional methods have drawbacks, such as XRD requiring time-consuming sample preparation and the evaluation of raw data. By contrast, EPMA is faster but relatively expensive and has high requirements for experimental equipment [31]. Compared with traditional techniques, LIBS and Raman spectra have the advantages of high precision, low cost, high speed, and in situ detection. In addition, LIBS can realize the identification of almost all elements, including light elements, rare earth elements, and halogen elements, which is very suitable for the analysis of meteorites.
LIBS performs well in qualitative and quantitative elements analysis, but it still has an inevitable defect, i.e., destructive detection. To solve the above problem, a new method based on spectral image fusion is proposed to assist in the detection of micro-LIBS, in which the randomness detection problem of LIBS is optimized. The detection efficiency and analysis accuracy of LIBS are improved through the molecular identification of Raman spectra and spatial positioning of microscopic images. Taking meteorite as an example, the feasibility of using spectral image fusion-assisted micro-LIBS technology to realize the space-selective detection of meteorite samples is validated, and the accuracy of LIBS quantitative analysis is discussed with the multidimensional scaling–back propagation neural network (MDS-BPNN) algorithm.

2. Materials and Methods

The technical concept of Raman mapping-assisted micro-LIBS is shown in Figure 1, where Figure 1a shows the implementation of Raman mapping, Figure 1b shows the fusion of Raman mapping and optical microscopy images, and Figure 1c shows the spatial localization of micro-LIBS ablation cavities based on Raman mapping assistance.

2.1. Sample Description and Preparation

For this study, we used 34 kinds of certified reference materials (CRMs) to establish a micro-area LIBS database. Please refer to the Supporting Information (Table S1) for the specific number and composition. We used a tablet press and set its pressure to 20 MPa to press the certified reference material powder into a target with a diameter of 1.5 inches and a thickness of about 2 mm (we maintained the pressure for 5 min during the pressing process). The meteorite sample came from the Boyuan geological specimen studio and was discovered in the wild by the staff. The external environment that surrounds the earth will have an impact on the meteorites that have been dispersed there, resulting in changes in the meteorite’s composition surface. Therefore, to accurately analyze the composition information of meteorites, we must go deep into the interior of meteorites. The meteorite was cut and polished, and the composition of the olivine meteorite on the cut surface was analyzed by laser spectroscopy.

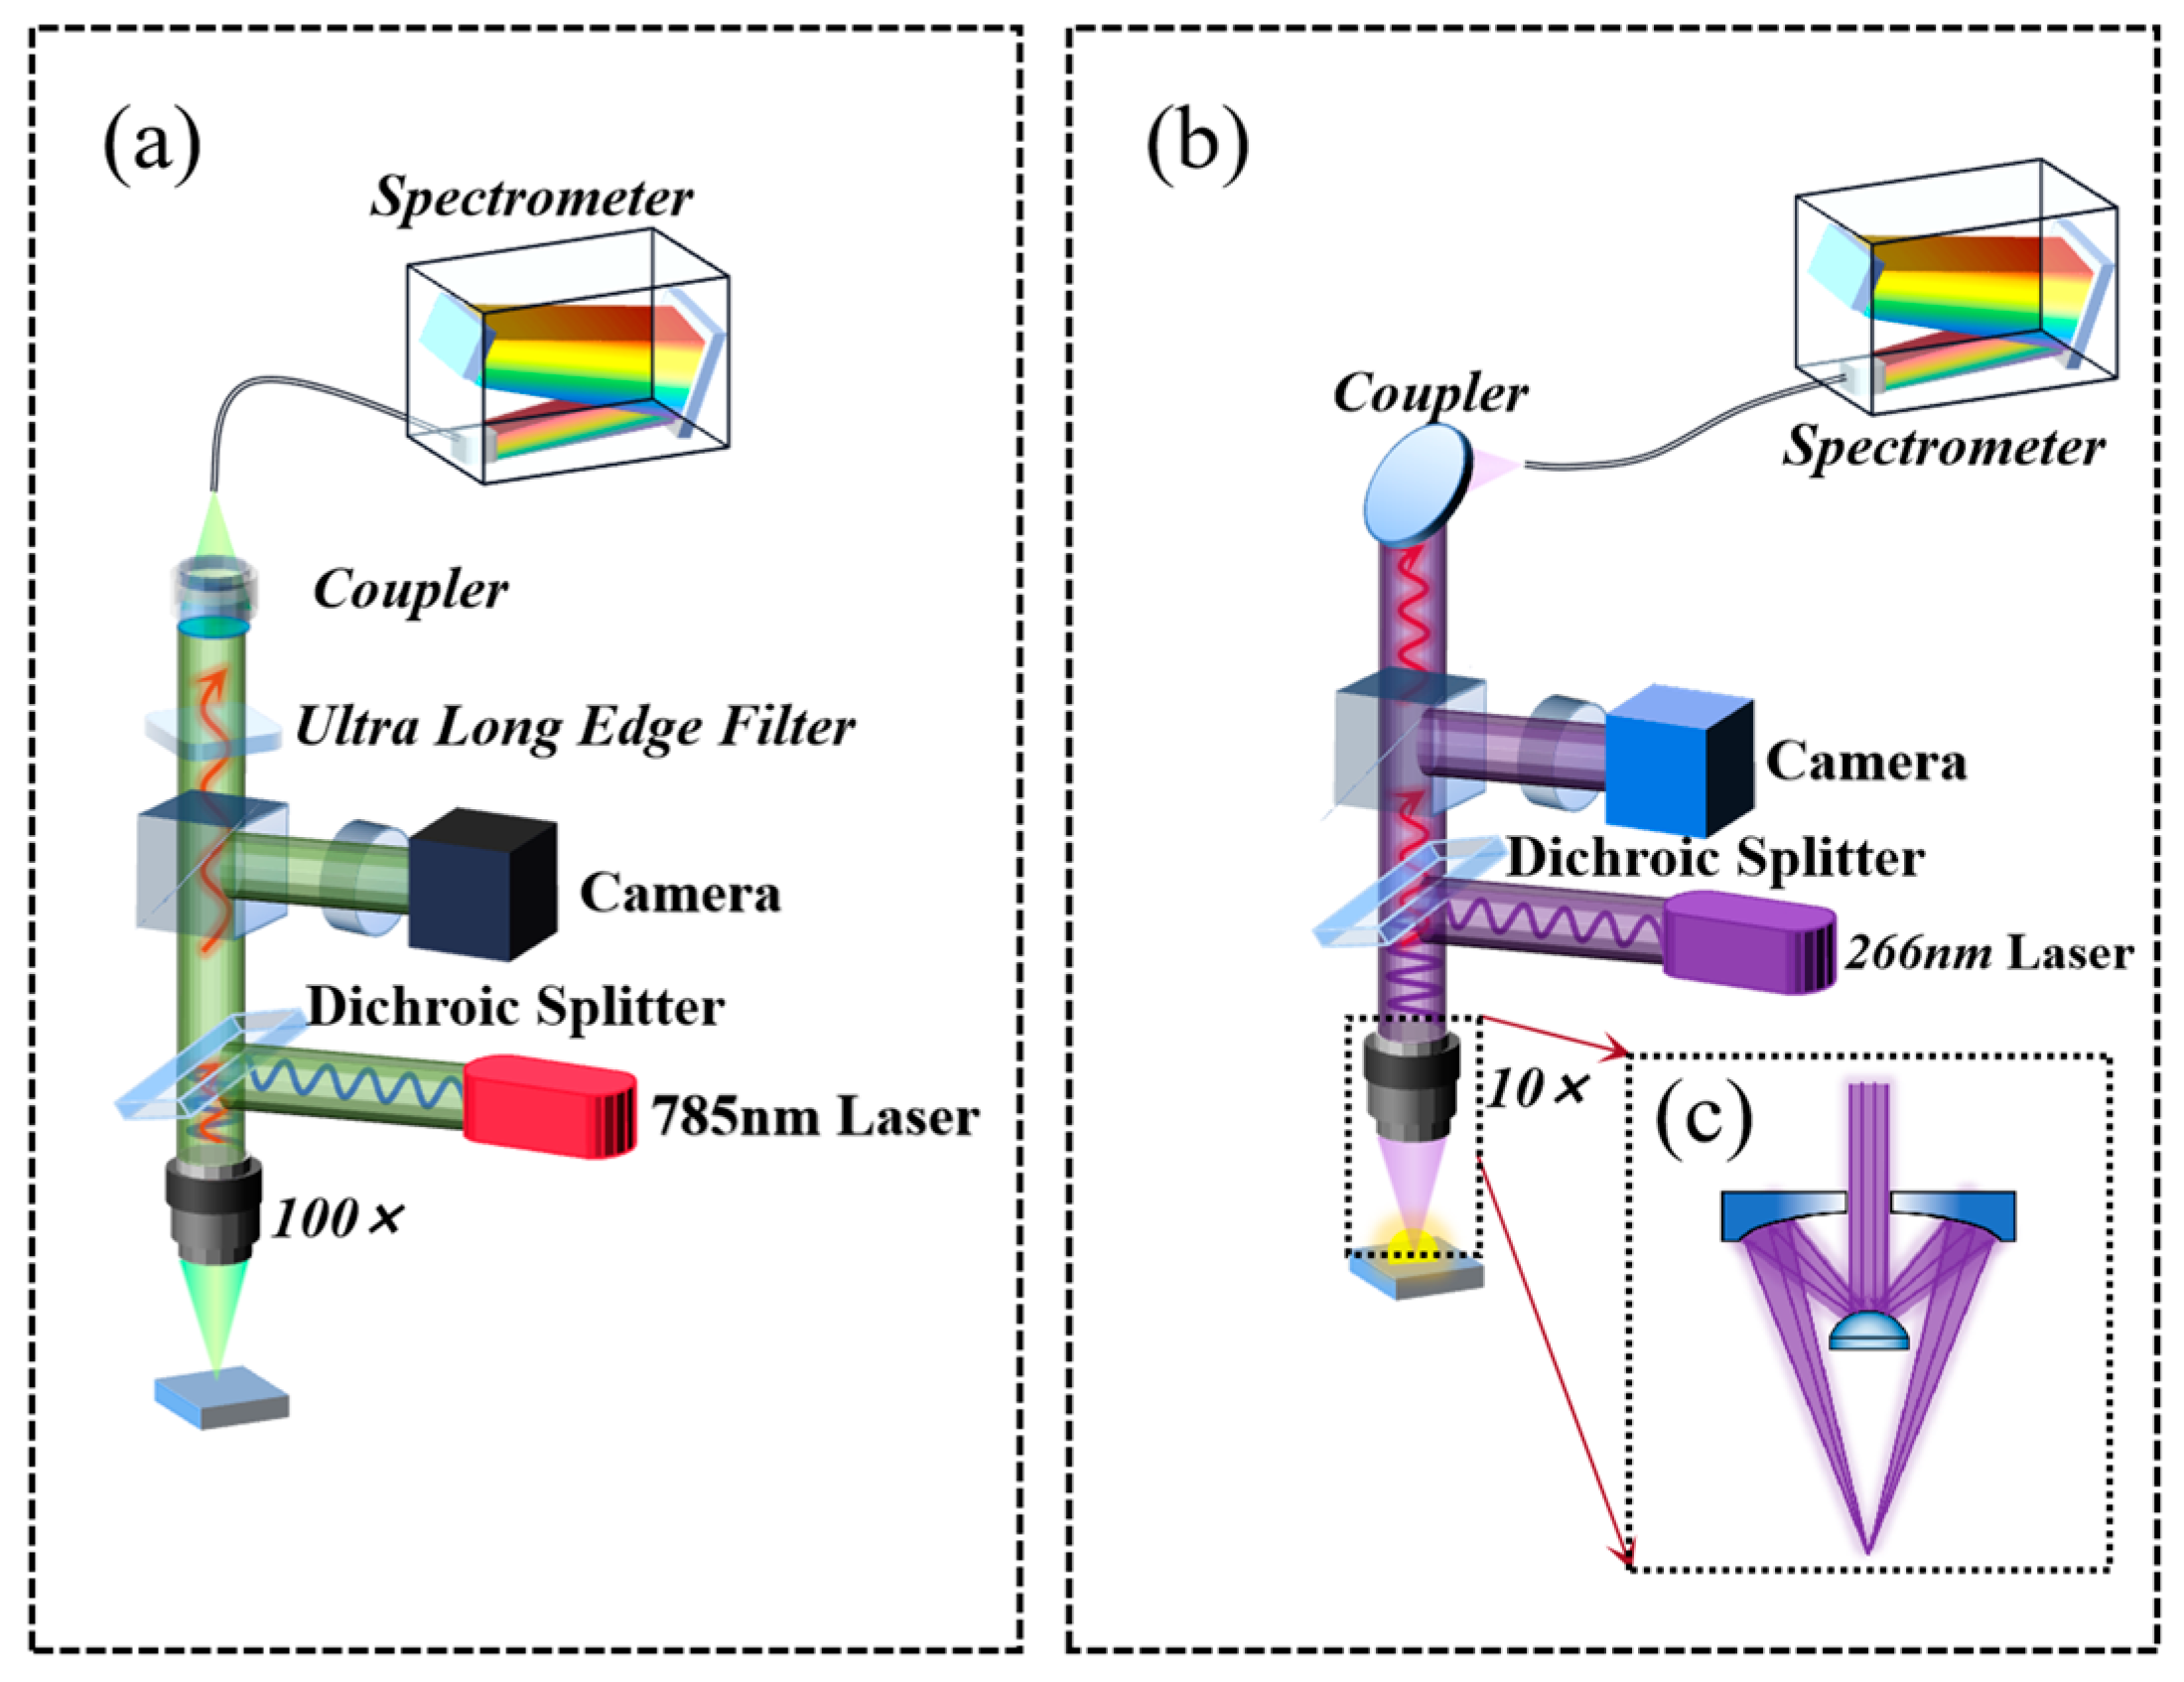
2.2. Raman Spectroscopy Setup

The schematic diagram of the Raman mapping experimental device is illustrated in Figure 2a. A red laser (operating mode: CW, central wavelength: 785 ± 0.5 nm, spectral line width: <0.06 nm, maximum power: 100 mW, power stability: <3%) was focused on the meteorite profile through a 100× Olympus microscope. The spectrometer was a NOVA (IdeaOptics Technology, Shanghai, China) with a 1200 lines/mm grating in a range of 534–633 nm. The integration time of a single Raman spectrum was 100 ms. The signal-to-noise ratio of the spectrometer was 1000:1. The Ultra Long Edge Filter (Semrock Inc., New York, NY, USA, LP02-785RE-25) further extracted weak signals, i.e., filtering the excitation light and penetrate the weak signal closer to the laser line; the Dichroic Splitter (Semrock Inc., LPD02-785RU-25) played the role of light splitting, i.e., reflecting a standard 785 laser incident at 45° and transmitting the longer Raman-shifted wavelengths. The laser spot diameter of the Raman system was 1 μm, and the scanning step was 1 μm. Raman spectrum detection was achieved through automatic focusing.

2.3. Laser-Induced Breakdown Spectroscopy (LIBS) Setup

The schematic diagram of the micro-LIBS experimental device is shown in Figure 2b. An ultraviolet high repetition rate pulse 266 nm laser was the excitation source of micro-LIBS (central wavelength: 266 nm, single pulse energy: better than 12 uJ @1 kHz, repetition frequency: 1 kHz, pulse width: less than 1.0 ns, pulse-to-pulse RMS: less than 2% @1 kHz, and beam diameter: 900 ± 200 µm). The UV laser was focused on the meteorite profile through a Cassegrain microscope objective (REFLX OBJ. 10×/0.23NA DUV INFIN, the coating was DUV-enhanced aluminum (150–11,000 nm), NA: 0.22, aperture diameter: 8.6 mm, focal length: 19.3 mm, working distance: 30.56 mm). The spectrometer was an AvaSpec-ULS2048 × 64TEC (Avantes Technology, Apeldoorn, Netherlands) with a 1200 lines/mm grating in a range of 350–592 nm. The coupler was a UV reflective collecting mirror. The spot diameter of the LIBS system was 20 μm, and the diameter of the ablation hole was 40 μm. The integration time of a single LIBS signal was 10 ms.

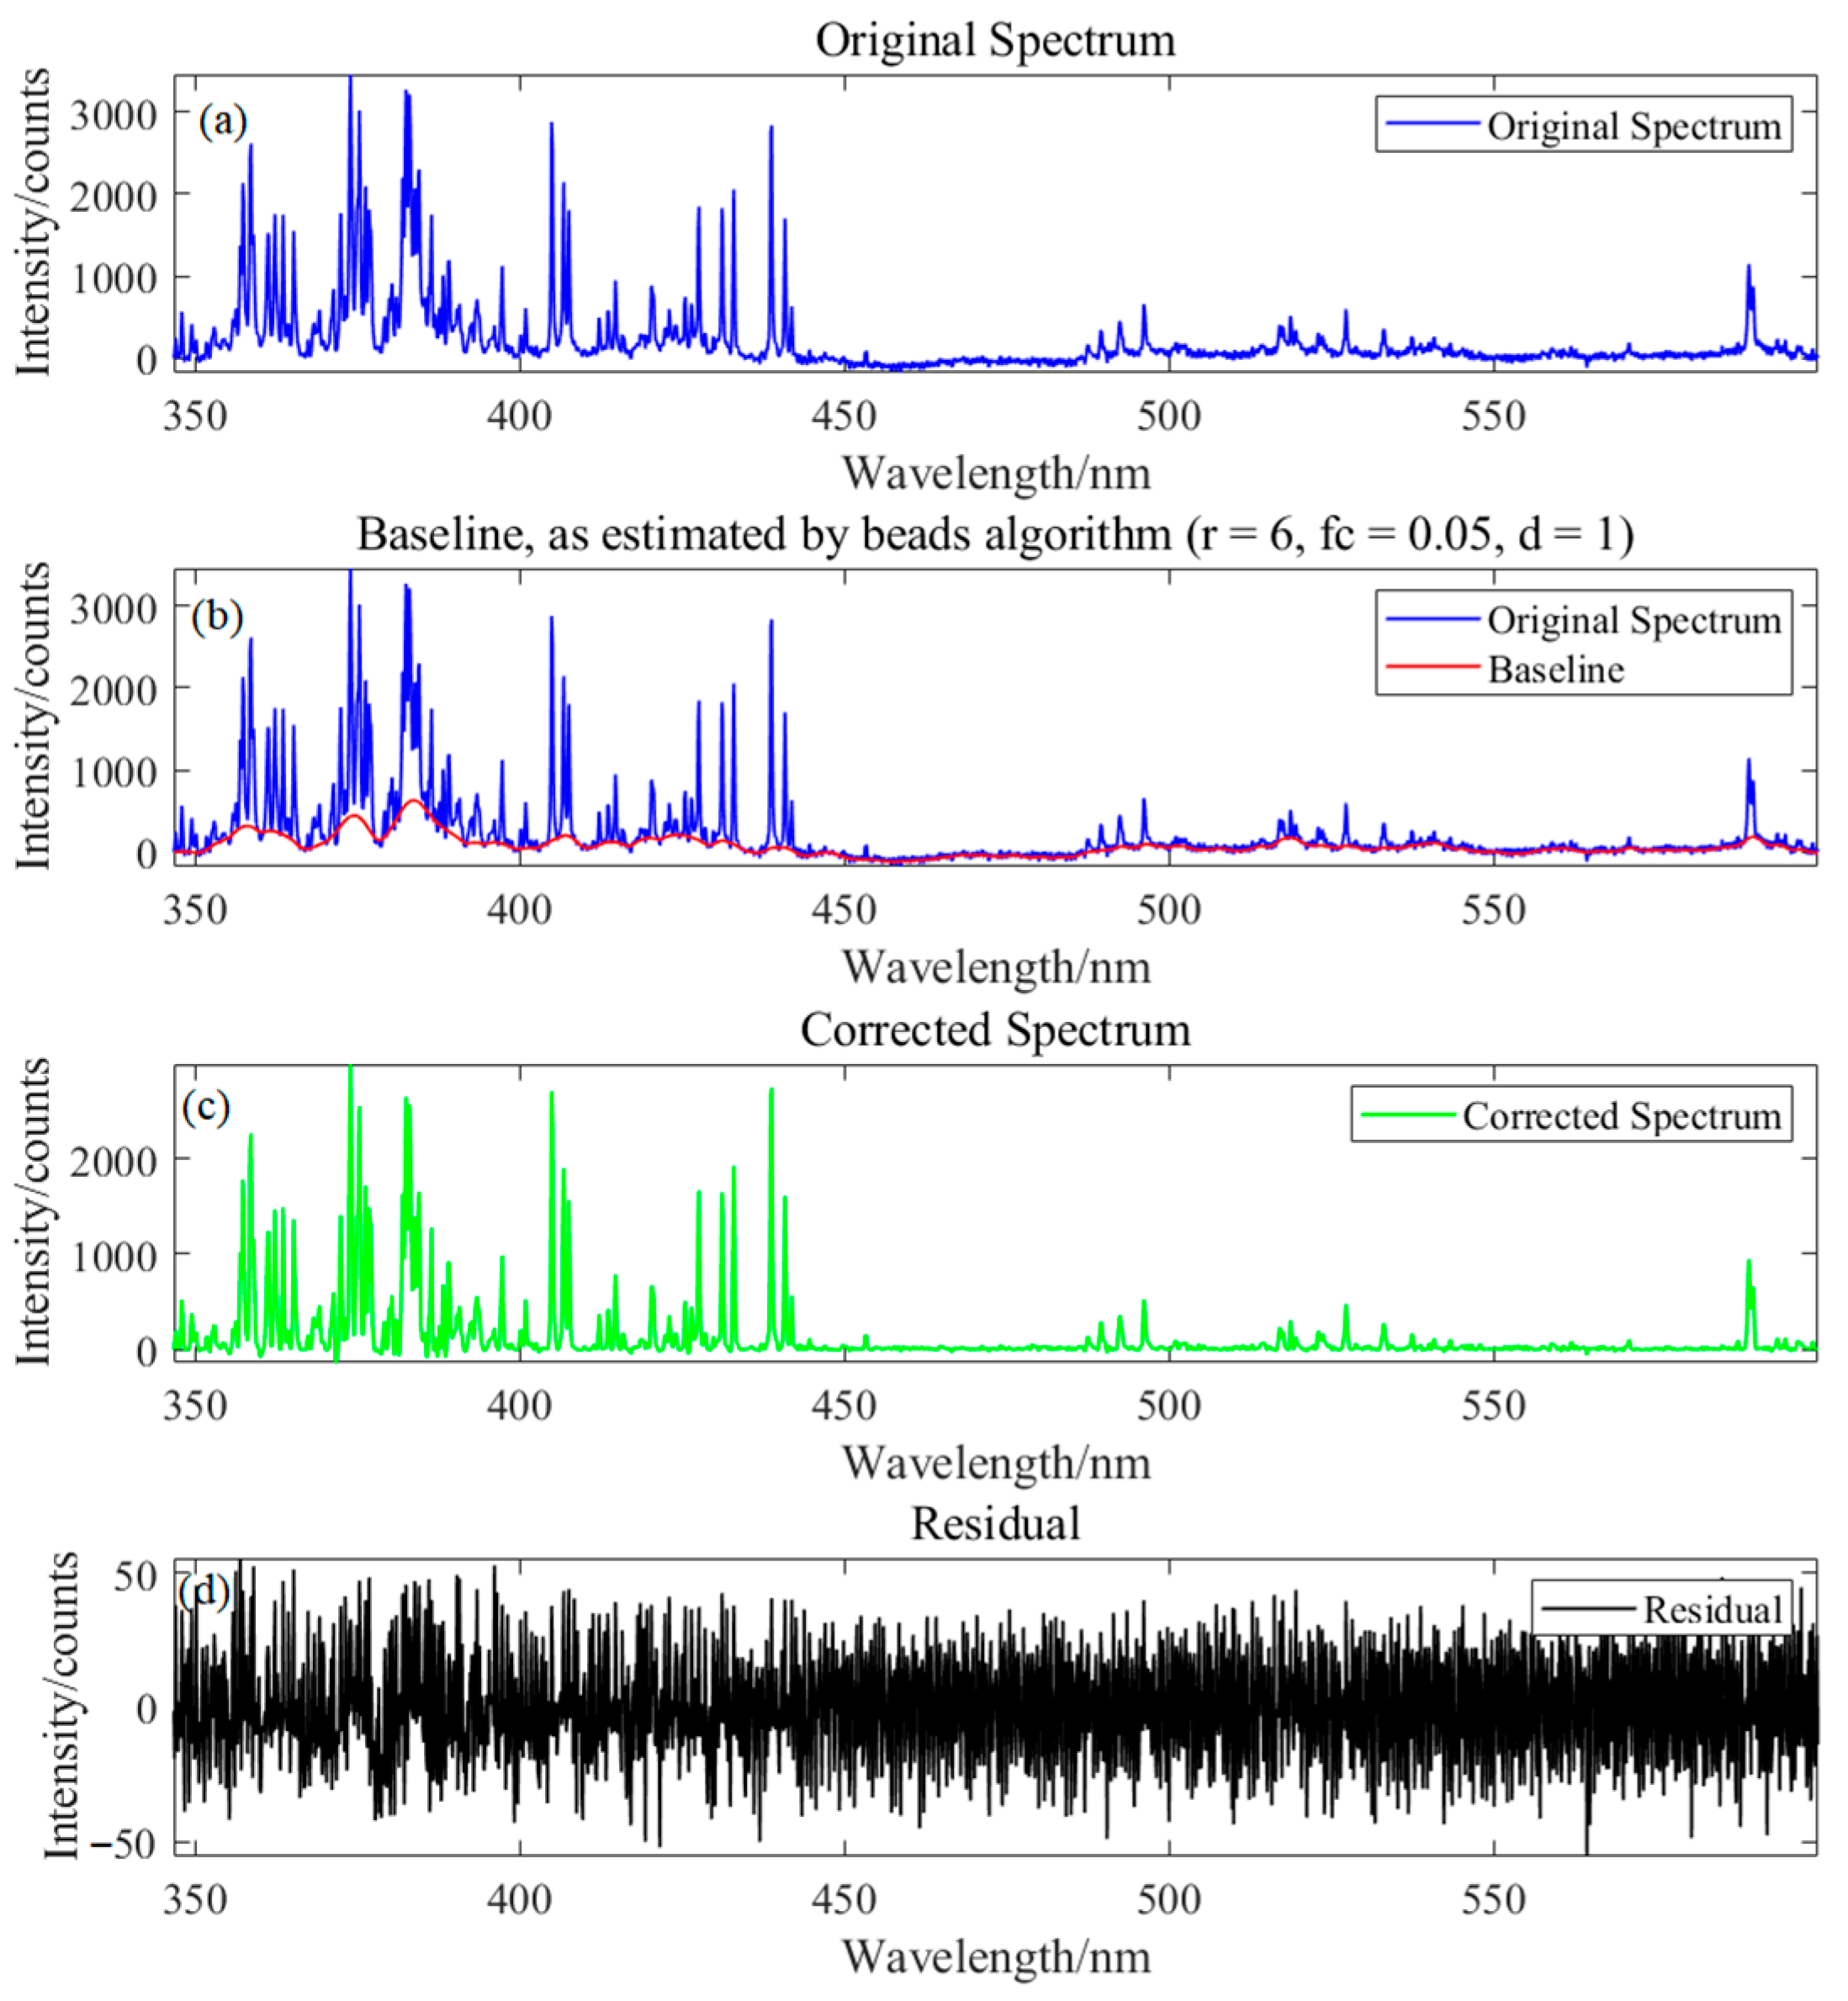
2.4. Spectral Data Pre-Processing

Due to the pulsed ultraviolet laser with a high pulse repetition rate as the excitation source of micro-LIBS devices, it is impossible to accurately pick up the LIBS signal generated by each pulse through a digital delay controller. Therefore, using a long exposure window to collect signals makes reducing the impact of bremsstrahlung and other effects difficult, resulting in LIBS having significant baseline and background noise. Raman spectroscopy is a nondestructive detection technology that has a clear baseline and is easily influenced by ambient fluorescence, background light, and the dark current of the spectrometer, so it also has an obvious baseline.
Fortunately, Raman spectrum and LIBS are both signals with sparse spectral peaks and a continuous baseline. The Baseline Estimation And Denoising with Sparsity (BEADS) algorithm can simultaneously solve the baseline correction and the noise reduction problems of spectral signals. The algorithm is based on modeling the series of spectral peaks as mostly positive, sparse with sparse derivatives, and on modeling the baseline as a low-pass signal. The algorithm has the characteristics of fast iterative convergence, high efficiency, and good stability [32]. Our team uses the BEADS algorithm to achieve baseline correction and the denoising of spectra [33,34,35,36]. The cut-off frequency (Fc), filtering order parameter (D), and asymmetry parameter (R) of the BEADS algorithm used in this study are 0.05, 1.00, and 6.00, respectively. Taking micro-LIBS as an example, its baseline correction and noise reduction results are shown in Figure 3.

2.5. Chemometric Analysis

In terms of data processing, Matlab R2020a (Massachusetts Institute of Technology, Natick, MA, USA) was used for chemical analysis and scientific drawing, respectively. Research on global climate change, stellar spectrum, human gene distribution, and other high-dimensional data usually faces the problem of dimensionality reduction. It is extremely important to find hidden and meaningful low-dimensional data information in high-dimensional data mining. Principal components analysis (PCA) is a common data dimensionality reduction algorithm. It projects data into the direction with the maximum variance but still ignores the corresponding relationship between data points. To address this issue, we used the multidimensional scaling (MDS) data dimension reduction method. MDS is a mathematical model that can analyze the distance between objects. The key information of a group of data is usually represented by a series of points in space. The arrangement of these points creates different geometric distances, which reflect the empirical relationship of the data. This geometric relationship can be multidimensional or one-dimensional. “Approximation” refers to the difference between observed objects, which can be described by similarity or difference. MDS is based on the similarity between pairs of samples and uses this feature to build an appropriate low-dimensional space, so that the distances between sets of objects in the high-dimensional space are as consistent as possible with the object similarity in the constructed low-dimensional space [37,38].
With enough neurons, neural networks can fit any type of data with arbitrary precision, making them ideal for dealing with nonlinear issues. Back propagation neural networks (BPNN) are particularly good at tackling function-fitting difficulties [39]. A training neural network is constructed using a set of input data sets during the function-fitting process to produce a set of associated target outputs. The neural network will generalize the relationship between input and output once it has fitted the data.

2.6. Methods and Steps of Data Analysis

The article involves the use of two spectral techniques, Raman spectroscopy and LIBS, where Raman spectroscopy was only used for qualitative analysis of mineral categories. LIBS was used for qualitative and quantitative analysis of elements. Therefore, when processing Raman spectra, after removing the baseline and normalization, mineral classification was determined, and the spatial distribution pattern of characteristic molecules was detected by selecting Raman spectral peak strengths combined with mapping technology. After removing the baseline and normalization, LIBS data were used for the element recognition of feature peaks. Quantitative analysis requires the construction of a quantitative analysis model using a database. The specific steps we followed are as follows:
Step 1: Prepare a target sample library for CRMs and construct a LIBS database for CRMs based on micro-LIBS technology;
Step 2: Utilize the MDS algorithm to reduce and scale high-dimensional LIBS data and implement feature extraction for 20 data dimensions. Then, use seven features as input vectors for the BPNN model, and establish a quantitative analysis model for Fe, Mg, and Na;
Step 3: Establish the MDS–BPNN quantitative inversion model, based on CRMs, to analyze the Fe, Mg, and Na content in different regions of meteorites.

3. Results

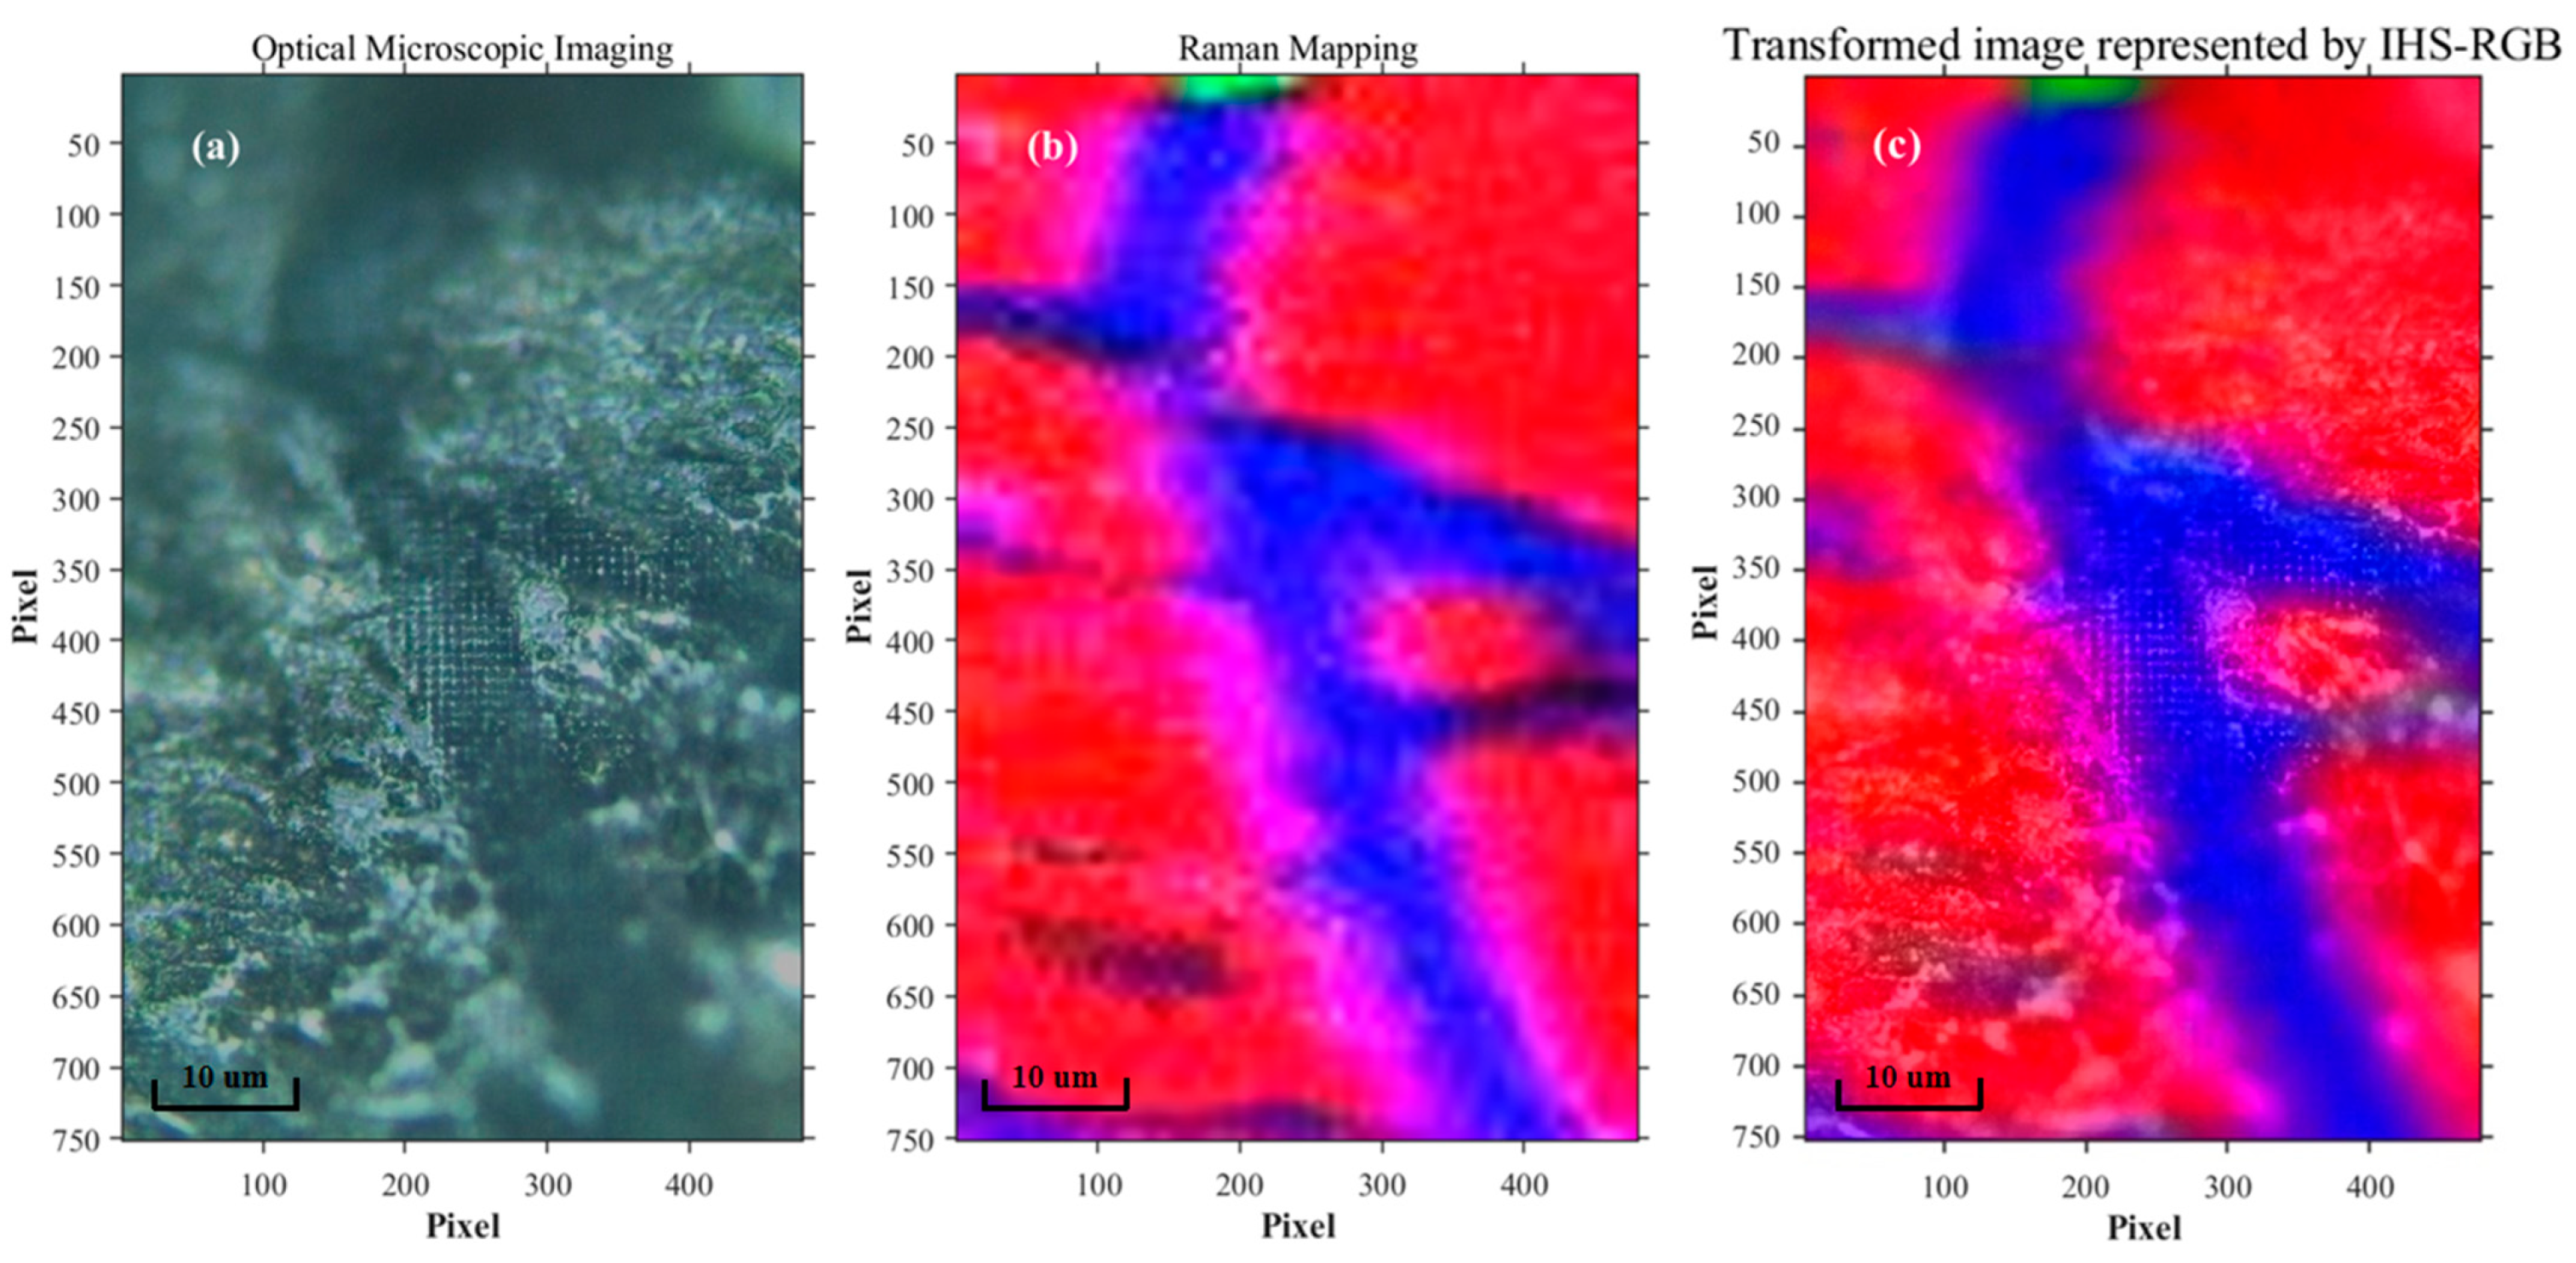
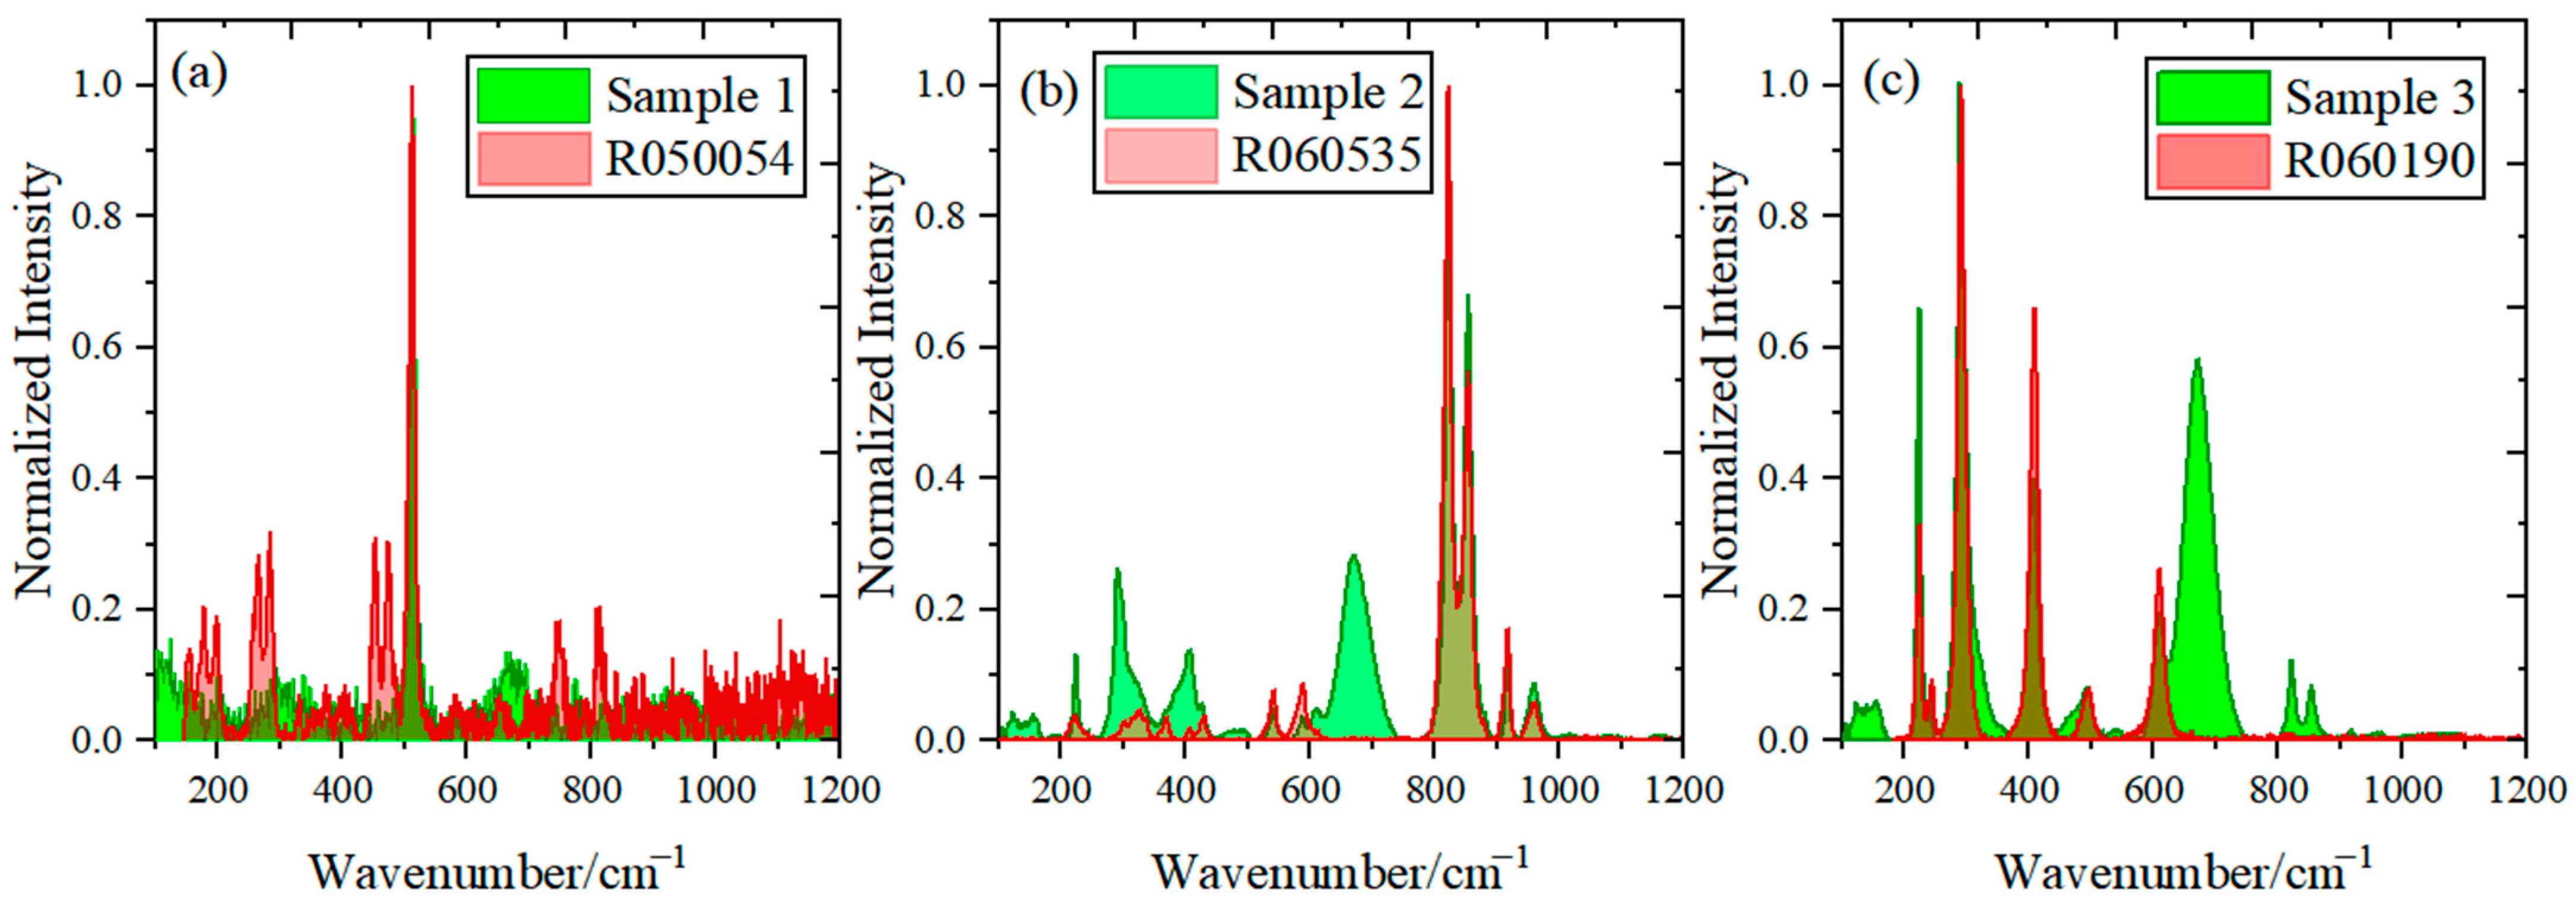
3.1. The Fusion of Raman Mapping and Microscopic Image
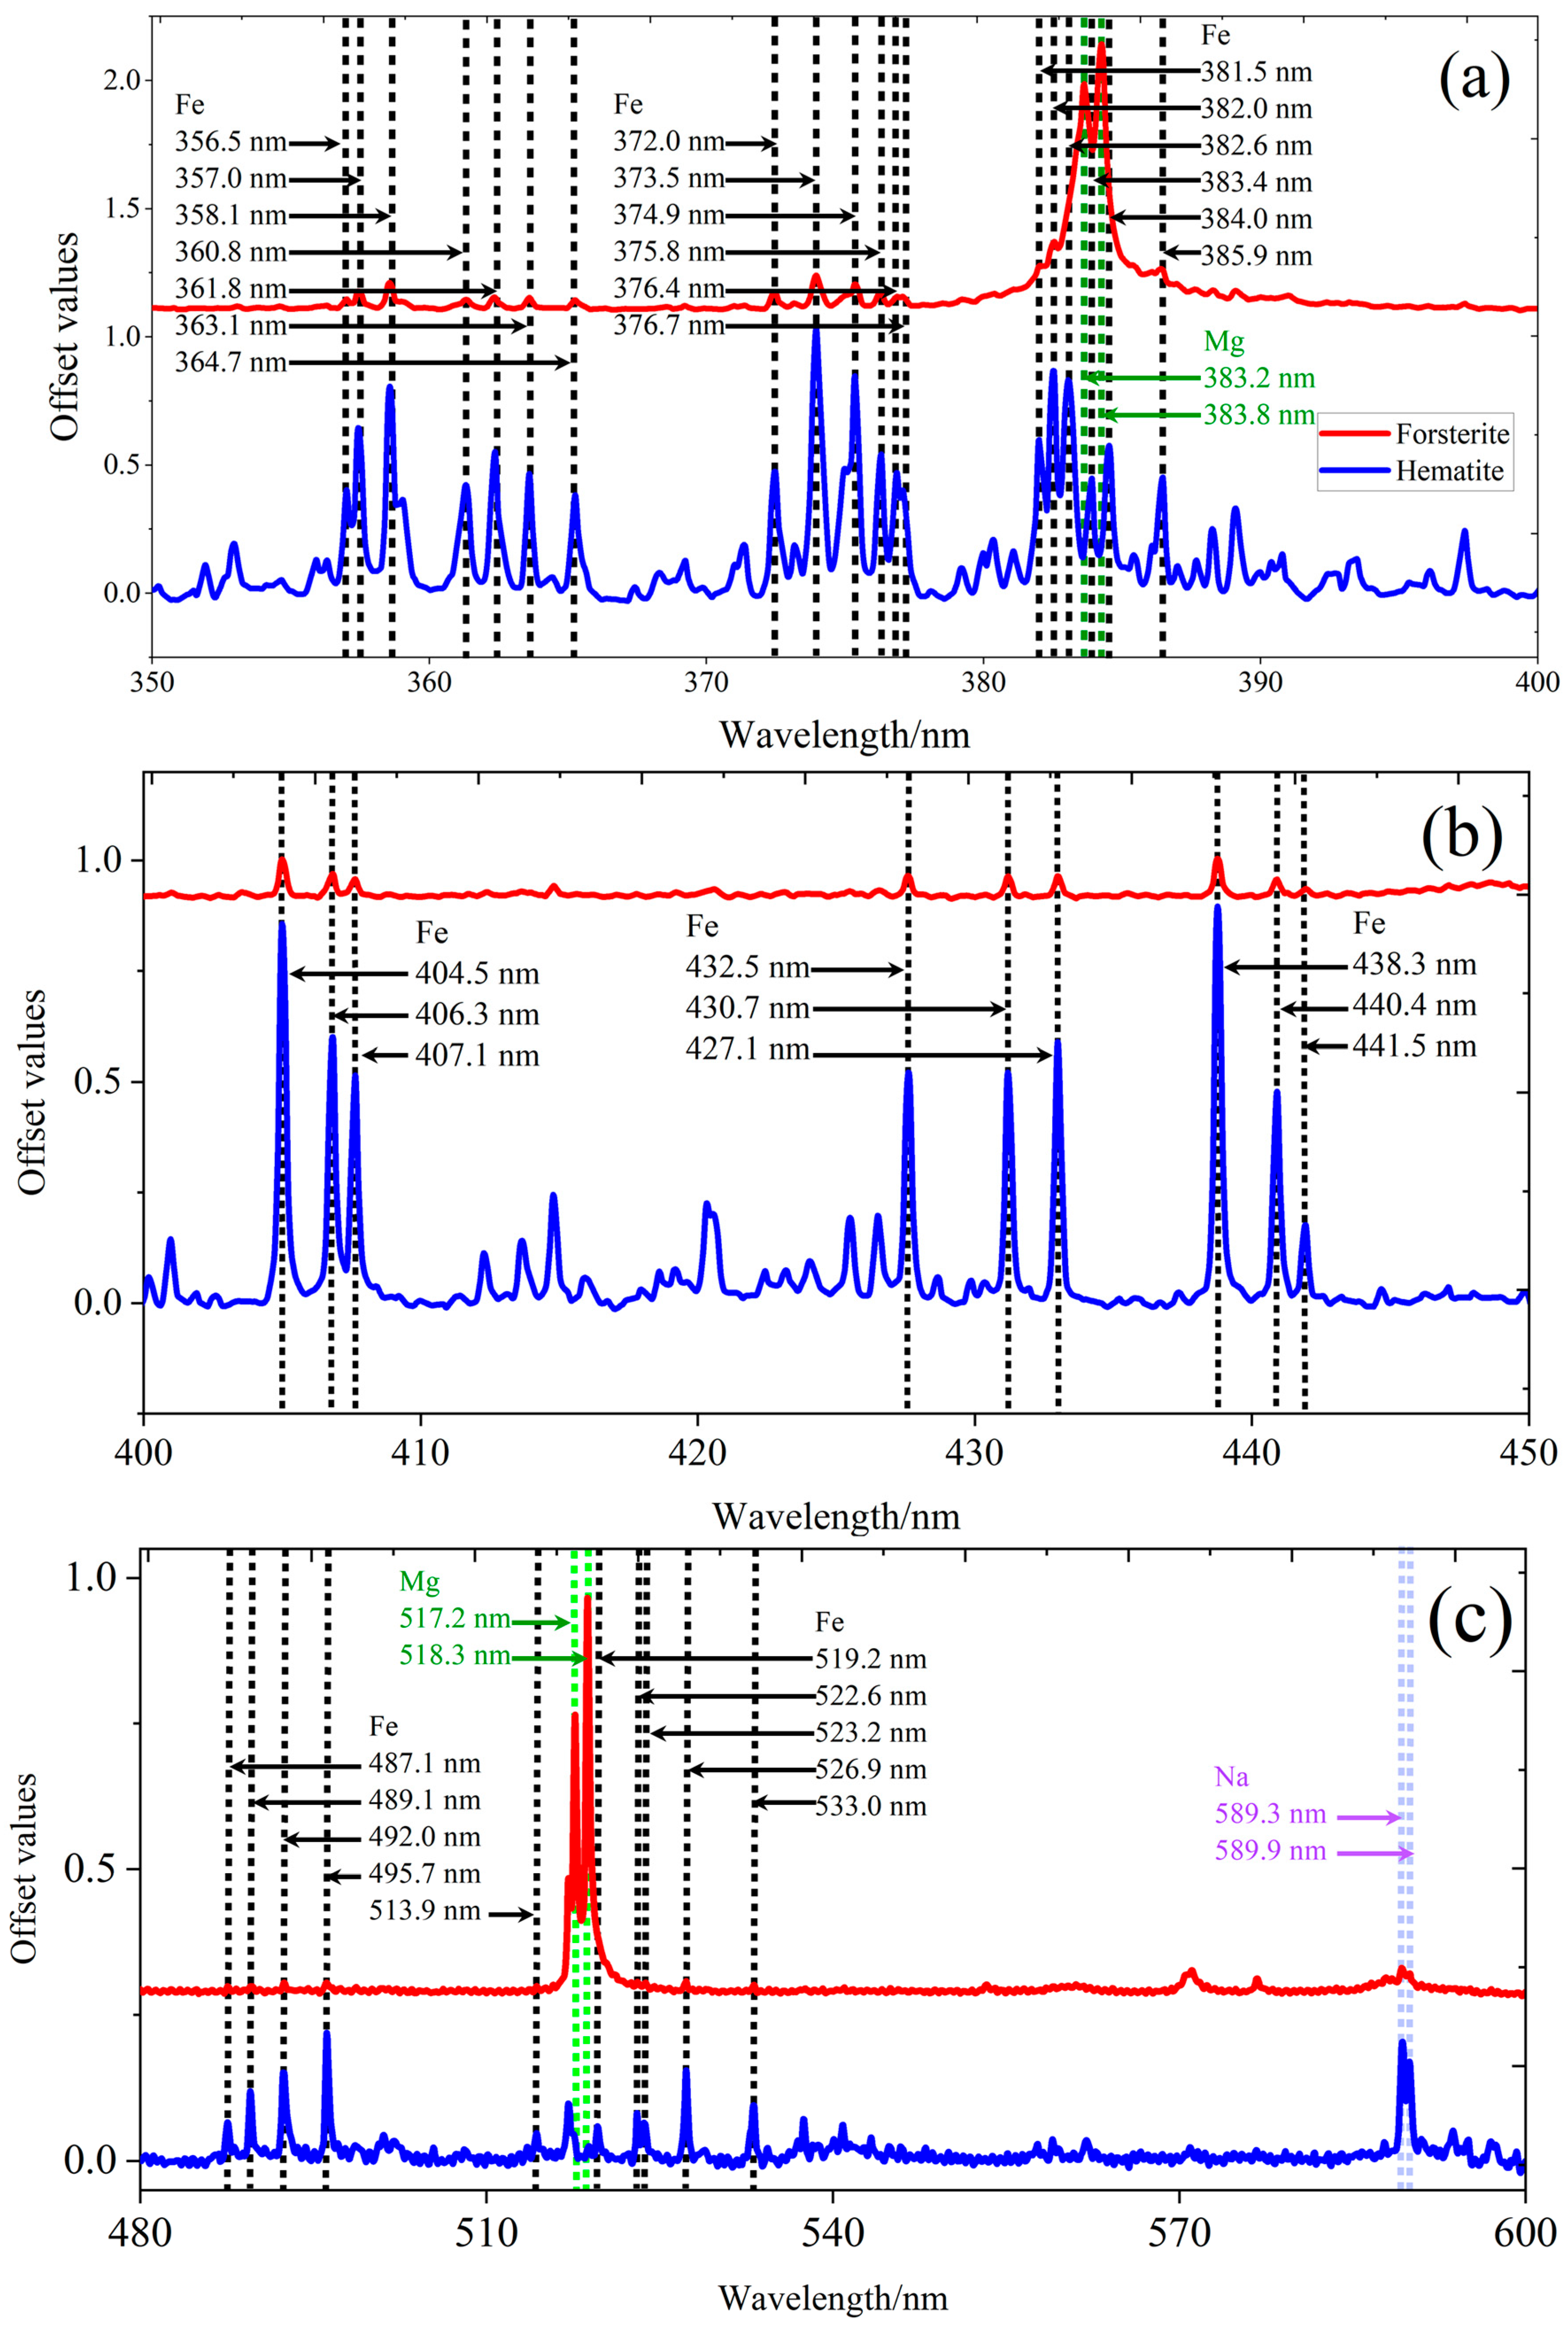
First, we determined the scanning area of Raman mapping through visible microscopic images and obtained microscopical images. The microscopic images included 357,600 pixels (752 × 480). Then, the region was scanned for Raman spectral points with a scanning step of 1 μm, and 4131 spectra (81 × 51) were obtained. These spectra were clustered into three categories, as shown in the Supporting Information in Figure S1. We took the spectral peaks of these three kinds of substances as the gray-scale images, as shown in the Supporting Information in Figure S2. Given that the area was mainly composed of three minerals, the intensities of 823 cm−1, 513 cm−1, and 291 cm−1 were selected as R, G, and B information for compositing an RGB image. As illustrated in Figure 4b, the number of Raman mapping pixels was expanded to be consistent with the microscopic image. Figure 4 shows that optical microscopic images have a high spatial resolution, while Raman mapping has a high spectral resolution, which is shown as follows: optical microscopic photographs clearly show the spatial texture morphology but describing the differences in material compositions and their spatial distribution is challenging; Raman mapping has a low spatial resolution due to the scanning step size restriction, but it has a high spectrum resolution and can show the spatial distribution of molecules. Therefore, based on the intensity–hue–saturation (IHS) algorithm [40,41], the fusion of Raman imaging and microscopic images can be achieved, and the composite images of multi-source data fusion with high spatial and spectral resolution can be obtained, as shown in Figure 4c. See the Supporting Information in Figure S3 for the gray-scale images of three channels.
After searching the average Raman spectra of the three minerals in the Raman spectrum database of the RRUFF Project website, we found that the mineral matched by Sample 1 was microcline (RRUFF ID: R050054), the mineral matched by Sample 2 was forsterite (RRUFF ID: R060535), and the mineral matched by Sample 3 was hematite (RRUFF ID: R060190), respectively, as shown in Figure 5. The primary composition of the minerals in the red area is forsterite, the main composition of the minerals in the green area is microcline, and the main composition of the minerals in the blue area is hematite, as shown by the identification findings of the Raman spectrum in Figure 5c. However, it should be emphasized that only seven spectra of Sample 1 were obtained within the entire mapping region, and there was only one distinguishable Raman peak. When performing feature matching in a limited spectral database, the matching results (microcline) may be controversial. Therefore, controversial data will not be considered in the subsequent discussion.

3.2. Micro-LIBS

In the Raman mapping area, the mineral distribution proportion of Forsterite and Hematite accounted for over 99.83%. The detection of the atomic emission spectra in this region was undertaken using micro-LIBS technology. Fe, Mg, and Na elements could be analyzed qualitatively and quantitatively because the spectrometer’s spectral range is 350–592 nm, as illustrated in Figure 6. Forsterite is the main component of Sample 2’s magnesium olivine, with a tiny quantity of fayalite, as indicated by the copious Mg and trace amounts of Fe and Na elements. The abundant Fe element and trace Na element were detected in Sample 3, demonstrating that this sample is a metal oxide and contains a trace Na element inside. 15 LIBS were randomly detected in each mineral area for the quantitative analysis of the test model.

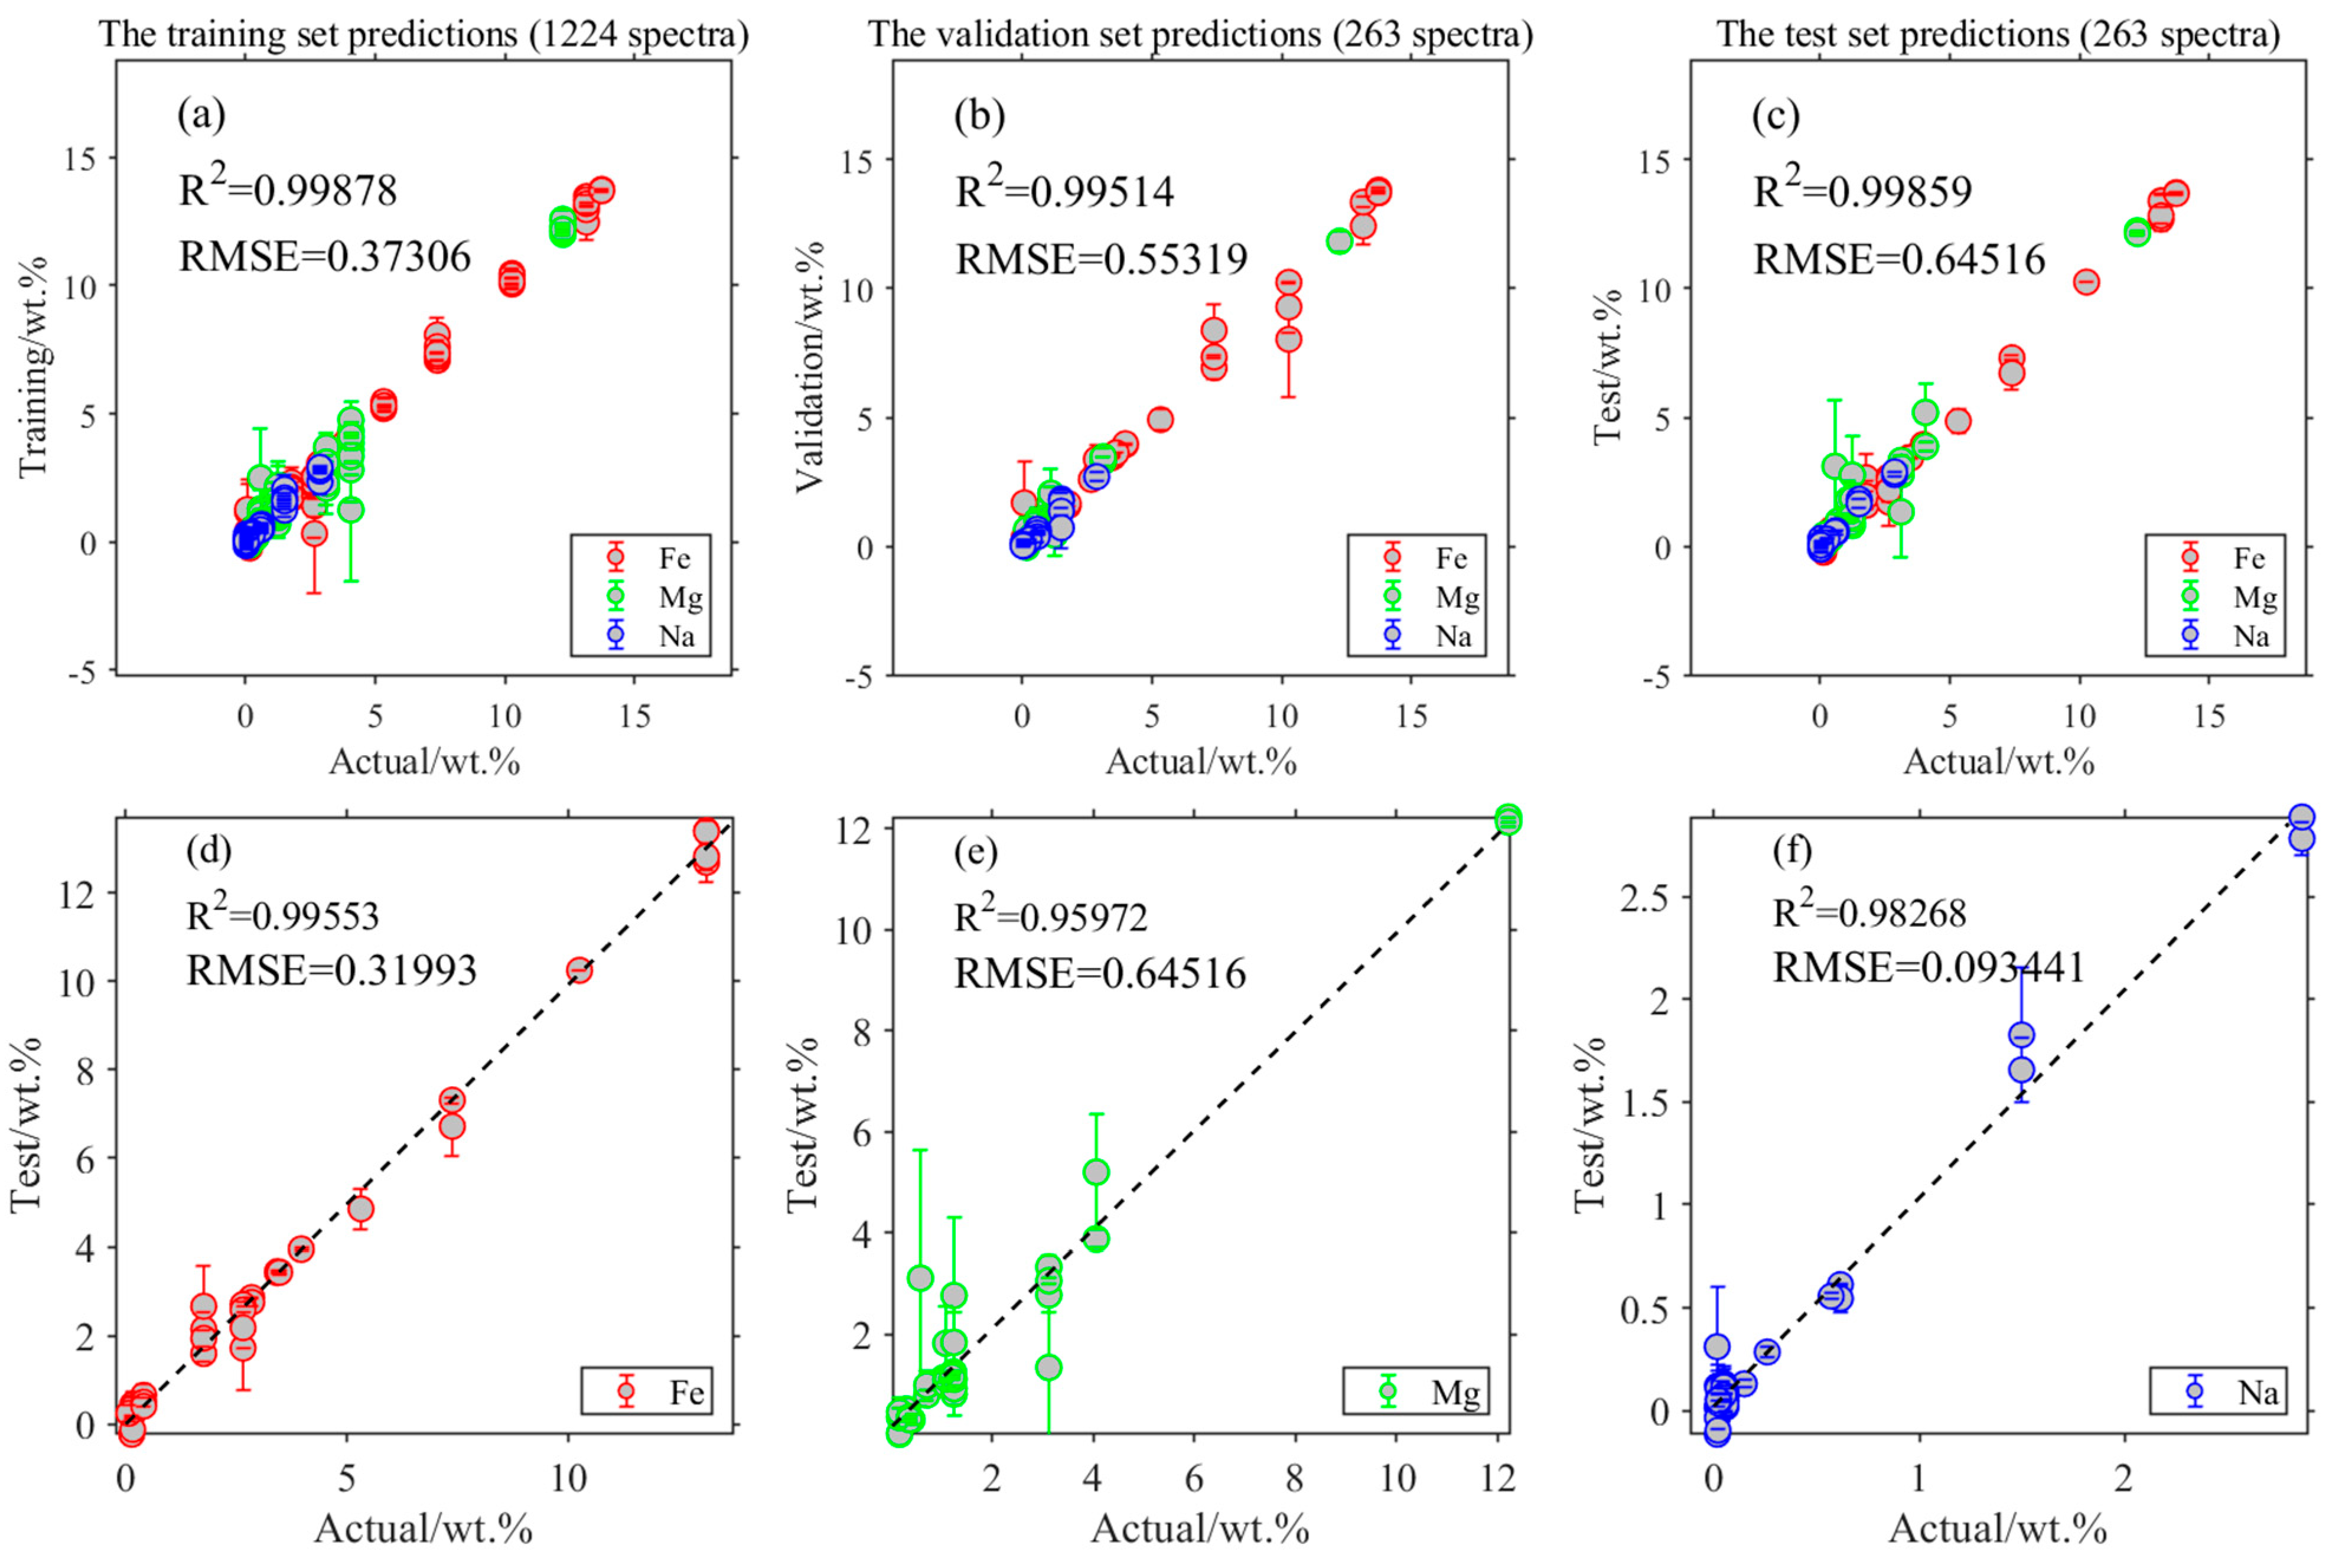
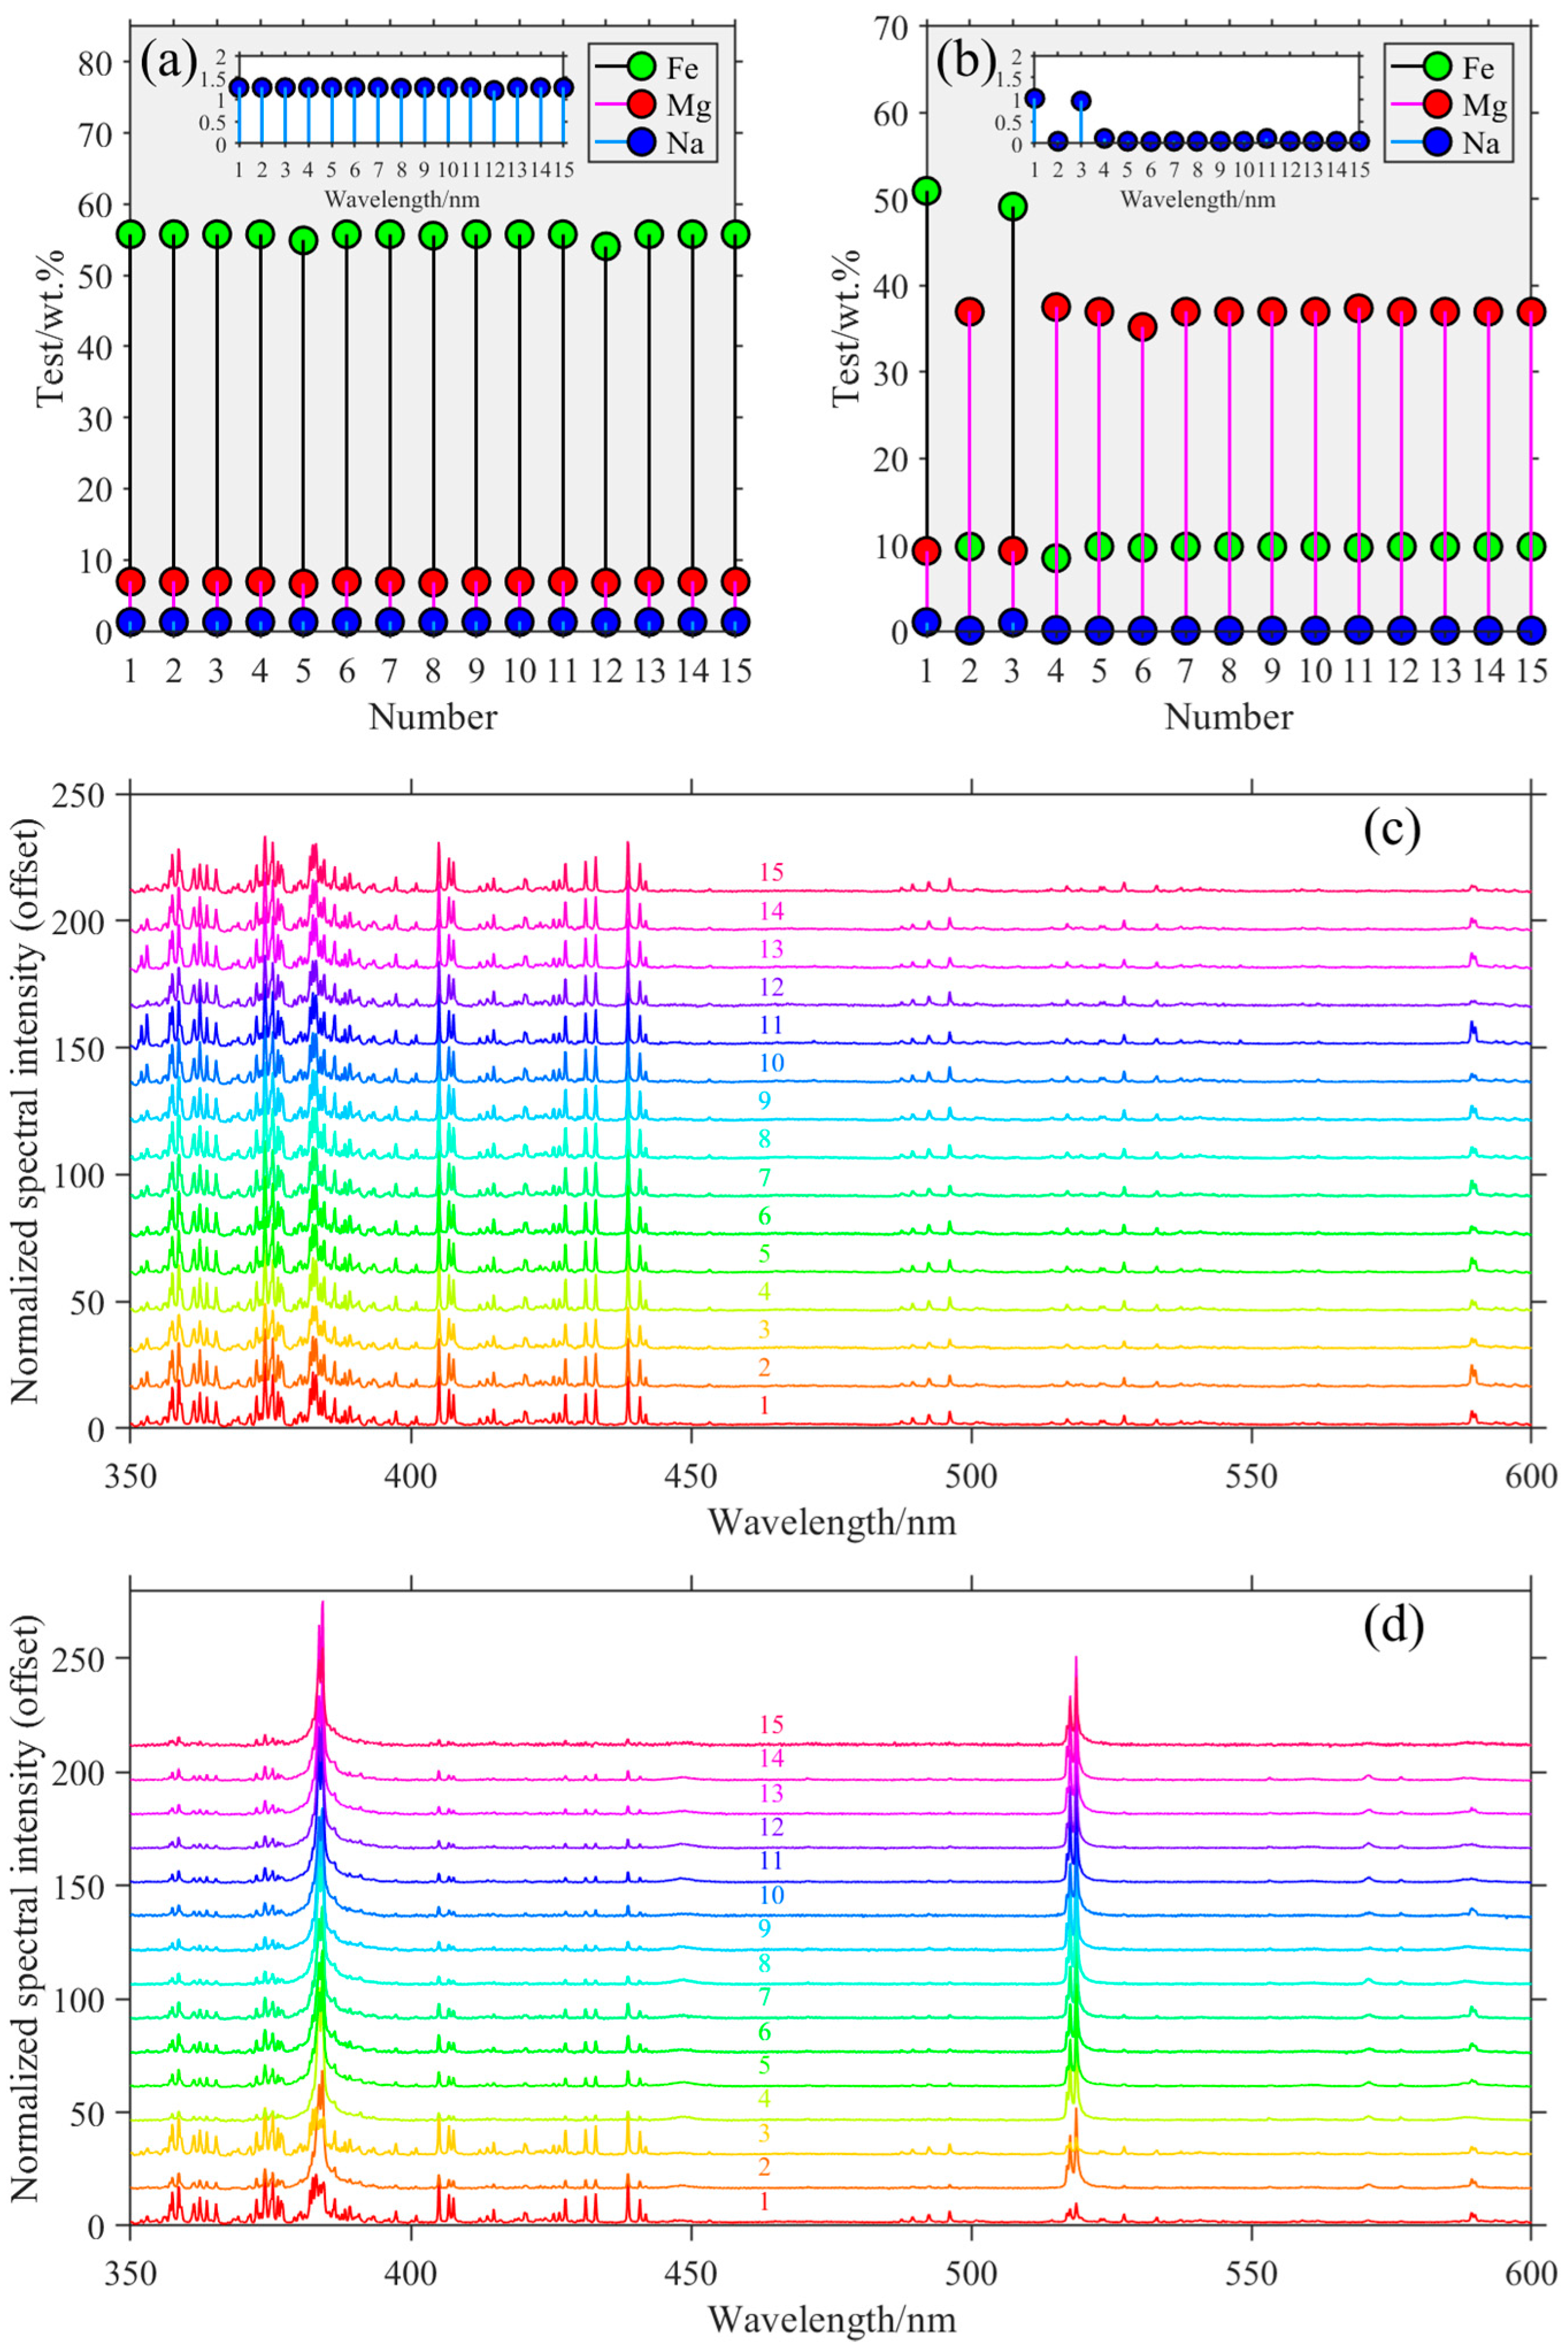
3.3. Element Quantitative Analysis

First, 34 standard minerals were detected by micro-LIBS, and 15 spectra were generated for each mineral, with 2048 pixels for each spectrum. Second, spectral data were preprocessed and normalized to reduce spectral jitter caused by focusing and other factors. Finally, by calculating the standard deviation of 15 spectra of each mineral, the repeatability of the LIBS spectrum in each mineral was evaluated by the maximum standard deviation [42], which can be calculated according to the following formula:
S D j = i = 1 n ( y i j y i ¯ ) 2 n
S D max = max S D j
where y i j is the intensity of the j spectrum at pixel i , y i ¯ is the intensity of the average spectrum of m spectra at pixel i , n is the number of pixels in each spectrum, and S D max is the maximum value of S D j .
As mentioned above, we determined the highest standard deviation for each mineral spectrum, as shown in Figure 7a. Because of the target sample’s particle size, the focus region, and other variables, the stability of the 15 LIBS spectral data for each mineral varied. Therefore, minerals with a maximum standard deviation of less than 0.048 were used to build the MDS–BPNN quantitative analysis model, and 19 CRMs with good spectral stability and repeatability were selected, as shown in Figure 7b.
In the quantitative analysis model of MDS–BPNN, first, the MDS dimension reduction algorithm was used to compress the filtered and optimized data, and 2048 feature points of each spectrum were compressed to 20 feature points. Then, the dimensional reduced data were input into a forward network composed of an input layer, a hidden layer, and an output layer. In forwarding propagation, the input dimension reduction data were transferred from the input layer to the output layer by the tan sigmoid function through the neurons of each hidden layer, and the prediction value of the output layer was compared with the expected value. Reverse training was carried out if there was a significant difference between the output layer’s projected value and the expected value. It propagated backward along the initial forward propagation channel during the reverse training and modified the weight coefficient between each neuron to bring the error closer to the predetermined standards. The number of neurons in the three hidden layers was defined as 100, 60, and 40, respectively. Finally, the determination coefficient (R2) and root mean square error (RMSE) were used to evaluate the quantitative analysis of the MDS–BPNN model. The closer R2 is to 1, and the smaller RMSE is, the better the prediction ability of the model is.
The modeling data set was divided into a training set, a validation set, and a test set. There were 1224 spectral data in the training set, 263 spectral data in the validation set, and 263 spectral data in the test set, respectively. Quantitative models of Fe, Mg, and Na are shown in Figure 8.
The obtained LIBS data of meteorite are imported into the MDS–BPNN model for quantitative analysis of Fe, Mg, and Na elements. The obtained quantitative analysis results of 30 LIBS are shown in Figure 9. Figure 9a shows that the average contents of Fe, Mg, and Na are 55.59%, 6.90%, and 1.26%, respectively. Figure 9b shows that the average contents of Fe, Mg, and Na are 15.03%, 33.22%, and 0.18%, respectively. Figure 9c shows that this group of spectra has good stability and high sufficiency. The composition of 15 ablation holes in the scanning area is similar. Figure 9d shows that, besides the first and third spectra, this group of spectra also shows good stability and sufficiency. The composition of thirteen ablation holes in the scanning area is similar, and the composition of the other two ablation holes is similar. The aforementioned spectral properties are consistent with the outcomes of the quantitative investigation.

4. Discussion

4.1. Physical and Chemical Matrix Effects of Quantitative Models

Physical and chemical matrix effects are crucial for quantifying the chemical composition of the substance being tested, which can increase the error in analyzing the elemental content of the substance. Firstly, because the LIBS system is a deep ultraviolet optical microscopy system, the laser ablation aperture is small (micrometer level). Therefore, in cases of uneven particle size or large particles, the obtained CRMs may have varying degrees of spectral jitter, which means that the spectrum cannot reflect the actual component content, thereby affecting the accuracy of the quantitative analysis model. Therefore, when establishing a national standard LIBS database, the spectral quality of CRMs is measured through standard deviation (SD). In addition, the quantitative analysis model for Fe, Mg, and Na elements in CRMs has good predictive performance. However, under different chemical matrix effects, the model’s predictive performance will decrease. Therefore, when predicting the content of Fe, Mg, and Na elements in meteorites, the deviation between the predicted and actual values may be worse than that of the BPNN model trained on CRMs. However, suppose the meteorite to be measured is put into the model training set. In that case, there may be an overfitting phenomenon, which makes it impossible to ensure the predictive performance of the quantitative model. Therefore, a later work will collect various meteorite samples with different element contents, establish a meteorite sample database, use this technology to establish a LIBS spectral database, and then construct a quantitative analysis model strategy based on this spectral database. However, due to the large sample size of the types, quantities, and different element contents of the meteorites involved, and the fact that modeling meteorite samples must be certified by professional institutions, the team still needs some time to solve such problems.

4.2. Relevance of Analyzed Elements Fe, Mg, and Na for Meteorite Analysis

The elements Fe, Mg, and Na are important in meteorite analysis because they are the most abundant elements in meteorites. Fe is the most abundant element in meteorites and is used to classify them into different groups. Iron in Earth’s rocks mainly occurs in the form of Fe (III), while newly fallen meteorites contain little or almost no Fe (III). Therefore, Fe (III) is an essential parameter for evaluating whether meteorites have undergone severe terrestrial alteration on the ground [43,44]. In addition, among meteorites, MgO necessarily increases with Fe2O3(T) + MgO (for convenience, Fe2O3 is usually used to represent Fe values). Some terrestrial rocks lie off the trend because they have MgO/Fe2O3(T) ratios outside the range for meteorites. The ratio of magnesium to iron content does not change much in most stony meteorites. In contrast, iron content in the iron meteorites totals approximately 90 to 95%, with the remainder comprising nickel and trace amounts of heavy metals, including iridium, gallium, and sometimes gold. They are classified using two different systems: chemical composition and structure. There are thirteen chemical groups for irons, of which IAB is the most common. Magnesium is also used to determine the age of meteorites, because it has two stable isotopes and one that is radioactive. The radioactive isotope decays into aluminum over time. Scientists can determine how long ago the meteorite formed by measuring the ratio of magnesium to aluminum isotopes in a meteorite. Sodium is used to determine the origin of meteorites because it is a volatile element that is easily lost during heating. The ratio of sodium to other elements in a meteorite can help scientists determine whether the meteorite came from the inner or outer solar system. In addition, sodium is one of the best elements to distinguish between terrestrial rocks and meteorites. This is because most terrestrial rocks contain more Na2O than any meteorite. Therefore, when the Na2O content exceeds 2%, the sample is almost impossible to be a meteorite. The quantitative results of Na2O from 30 LIBS data using the MDS–BPNN model indicate that the concentration of Na2O in the two scanning regions ranges from 0.17 to 0.20. Potassium is also an alkali element, and compared to most terrestrial rocks, the concentration of all alkali elements in meteorites is deficient. Therefore, when the K2O content is more significant than 0.6%, the sample is almost impossible to be a meteorite. In addition, other major elements such as Si, Ti, Cr, Al, Mn, and Ca have essential roles in determining the origin and classification of meteorites. As is well known, LIBS can achieve almost all element analyses. However, due to the limitations of the detection range of laboratory spectrometers, the current detection range of existing spectrometers only covers the wavelength range of 350–600 nm, which precisely includes the LIBS peaks of Fe, Mg, and Na elements. Therefore, quantitative analysis of other elements was not possible. Still, as long as the spectral detection range of the spectrometer is expanded, this technology can cover qualitative and quantitative analysis of elements of interest.
According to the factor group analysis, the magnesium iron silicate structure with Pnma symmetry has 36 Raman-active vibration modes: 11Ag +11B1g + 7B2g + 7B3g [45]. The Raman spectra of the silicate crystals have a characteristic set of two intense lines near 837–858 cm−11: Si–O asymmetric stretching band Ag (Si–O)a-str) and 808–825 cm−12: Si–O symmetric stretching band Ag (Si–O)s-str) [46]. The ratio of the two Raman characteristic peaks of 854 and 822 cm−1 could reflect the content difference between forsterite and fayalitic olivine [47], as shown in Figure 10a. In the detection area of Raman–LIBS, the peak ratio, based on a partial least squares regression, is approximately 0.59, indicating that the content difference between forsterite and fayalitic olivine is relatively stable. Therefore, a reference can be provided by preparing reference materials of forsterite and fayalitic olivine to determine the mixing ratio of unknown objects. In addition, the quantitative results of LIBS for Mg/(Mg + Fe) in this detection area are approximately 0.78, while the quantitative results of EDS for Mg/(Mg + Fe) are approximately 0.88, which conforms to the semi-quantitative accuracy of LIBS. Figure 10c shows that the ratio reflects the content difference between forsterite and fayalitic olivine.

4.3. The General Utility of the Approach and Its Comparison with State-of-the-Art Meteorite Analysis Method

Energy dispersive spectroscopy (EDS) in scanning electron microscopy (SEM) is a crucial technique for determining the elemental composition of samples at micro spatial resolution in analytical science. EDS is the optimal solution in geological analysis, which can obtain the mineral distribution in samples through non-destructive detection. However, the detection limit of EDS is usually in the order of 1000 ppm. Furthermore, it is not sensitive to trace elements, making it impossible to reveal the numerous characteristics during the formation of and changes in meteorites. Cathodoluminescence (CL) is commonly used to characterize trace elements. The composition and distribution of trace elements are investigated by analyzing the spectra of different wavelengths emitted by the sample. The detection limit of CL is 10,000 times that of EDS. The latest research couples EDS with CL, achieving complementarity between the two technologies [48]. However, this technology has a series of problems, such as high experimental costs and difficulty in equipment maintenance. The Raman mapping-assisted micro-LIBS method can achieve qualitative and quantitative analyses of elements and molecules. Although LIBS technology is a semi-quantitative analysis method, it can achieve almost full element analysis and has significant advantages in quickly assessing mineral element composition and content. Raman mapping can quickly analyze anions in minerals with nondestructive testing, combined with LIBS technology to identify metal cations. In addition, this combined technology can obtain direct evidence of minerals’ atomic and molecular composition through information fusion. In summary, EDS–CL technology is more suitable for finely analyzing high-value samples in large laboratories or analysis and testing centers. At the same time, Raman mapping-assisted micro-LIBS technology is ideal for various application scenarios, especially in the rapid assessment of many suspected samples and the rapid screening of high-value samples, which has significant application potential.

5. Conclusions

First, before laser-induced breakdown spectroscopy damages the composition of the detecting components, Raman spectroscopy is one of the most favored instruments for the non-invasive detection of the molecular structure of substances. It is also the most promising molecular pre-evaluation technology. The fusion of Raman mapping and microscopic image technology has undeniable benefits in assisting the quantitative analysis of various minerals in the micro-LIBS. Raman mapping provides high spectral resolution for mineral spatial distribution laws, while microscopic images provide high spatial resolution for mineral texture and morphology features. The spectral image fusion technology can assist the micro-LIBS to quickly and accurately locate the region of interest (ROI), avoiding random destructive detection. Second, using ultraviolet micro-LIBS experimental equipment, the MDS–BPNN quantitative analysis model of the three elements Fe/Mg/Na in the certified reference material was established through the ultraviolet micro-LIBS experimental equipment. The determination coefficients of the elements Fe, Mg, and Na in the test concentration were 0.9955, 0.9597, and 0.9827, respectively. The RMSE of the elements Fe, Mg, and Na were 0.3199, 0.6452, and 0.0934, respectively. Finally, the analysis of meteorites reveals that an important aspect of this work is the use of Raman mapping to assist micro-LIBS in achieving the quantitative analysis of elements, to better understand the mineral distribution and element composition of meteorites. For our future works, we will also focus on the implementation of micro-LIBS mapping and the fusion of Raman mapping, LIBS mapping, and microscopic images to further improve the information abundance of large imaging data sets.

Supplementary Materials

The following supporting information can be downloaded at: https://www.mdpi.com/article/10.3390/chemosensors11110567/s1, Table S1: Chemical composition reference of certified reference materials (in wt%); Figure S1: Three types of substances identified and their Raman spectra; Figure S2: Mapping of different Raman peaks; Figure S3: The gray-scale images of three channels; Figures S4–S37 Spectral data preprocessing of CRMs.

Author Contributions

Conceptualization, H.W., L.Z., Y.X., P.F., Y.W., M.D., W.W. and R.Y.; methodology, H.W., X.W., Y.X., P.F., Y.W., M.D., W.W. and R.Y.; software, H.W., Y.X., P.F., M.D. and Y.W.; validation, H.W., Y.X., P.F., Y.W., M.D., W.W. and S.L.; formal analysis, H.W., Y.X., P.F., Y.W., M.D., W.W., R.Y. and L.Z.; investigation, H.W., M.D., W.W. and S.L.; resources, W.W. and R.Y.; data curation, H.W. and M.D.; writing—original draft preparation, H.W., Y.X. and X.W.; writing—review and editing, H.W., Y.X. and S.L.; visualization, H.W. and P.F.; supervision, X.W. and L.Z; project administration, L.Z.; funding acquisition, X.W., S.L. and L.Z. All authors have read and agreed to the published version of the manuscript.

Funding

This research was funded by the National Key R&D Program of China (Grant No. 2021YFA0716100, 2021YFF0601201 and 2021YFF0601202), the National Natural Science Foundation of China (Grant No. U1931211, 42074210 and 42241130), the Natural Science Foundation of Shanghai (Grant No. 21ZR1473700), the Shanghai Municipal Science and Technology Major Project (Grant No. 2019SHZDZX01), the Shanghai Pilot Program for Basic Research—Chinese Academy of Science, Shanghai Branch (Grant No. JCYJ-SHFY-2021-04), and the Shanghai Rising Star Program (Grant No. 21QA1409100). This work was also supported by the Youth Innovation Promotion Association of the Chinese Academy of Sciences.

Institutional Review Board Statement

Not applicable.

Informed Consent Statement

Not applicable.

Data Availability Statement

Data underlying the results presented in this paper are not publicly available at this time but may be obtained from the authors upon reasonable request.

Conflicts of Interest

The authors declare no conflict of interest.

References

  1. Miziolek, A.W.; Palleschi, V.; Schechter, I. Laser-Induced Breakdown Spectroscopy (LIBS)—Fundamentals and Applications; Cambridge University Press: Cambridge, UK, 2006. [Google Scholar]
  2. Asquini, C.P. Laser Induced Breakdown Spectroscopy (LIBS); Woodhead Publishing: Sawston, UK, 2013. [Google Scholar]
  3. Chen, S.; Weijie, X.; Yongqi, T.; Yuqing, Z.; Zengqi, Y.; Long, Z.; Sahar, S.; Mengting, W.; Fengye, C.; Jin, Y. From machine learning to transfer learning in laser-induced breakdown spectroscopy analysis of rocks for Mars exploration. Sci. Rep. 2021, 11, 21379. [Google Scholar]
  4. Dyar, M.D.; Tucker, J.M.; Humphries, S.; Clegg, S.M.; Wiens, R.C.; Lane, M.D. Strategies for Mars remote Laser-Induced Breakdown Spectroscopy analysis of sulfur in geological samples. Spectrochim. Acta Part B At. Spectrosc. 2011, 66, 39–56. [Google Scholar]
  5. Farley, K.A.; Williford, K.H.; Stack, K.M.; Bhartia, R.; Chen, A.; de la Torre, M.; Hand, K.; Goreva, Y.; Herd, C.D.K.; Hueso, R.; et al. Mars 2020 Mission Overview. Space Sci. Rev. 2020, 216, 142. [Google Scholar] [CrossRef]
  6. Manrique, J.A.; Lopez-Reyes, G.; Cousin, A.; Rull, F.; Maurice, S.; Wiens, R.C.; Madsen, M.B.; Madariaga, J.M.; Gasnault, O.; Aramendia, J.; et al. SuperCam Calibration Targets: Design and Development. Space Sci. Rev. 2020, 216, 138. [Google Scholar] [CrossRef]
  7. Xu, W.; Liu, X.; Yan, Z.; Li, L.; Zhang, Z.; Kuang, Y.; Jiang, H.; Yu, H.; Yang, F.; Liu, C.; et al. The MarSCoDe Instrument Suite on the Mars Rover of China’s Tianwen-1 Mission. Space Sci. Rev. 2021, 217, 64. [Google Scholar] [CrossRef]
  8. Zhang, Z.; Li, T.; Huang, S. Influence of the pressure and temperature on LIBS for gas concentration measurements. Spectrochim. Acta Part B At. Spectrosc. 2019, 155, 24–33. [Google Scholar]
  9. Tran, M.; Smith, B.W.; Hahn, D.W.; Winefordner, J.D. Detection of Gaseous and Particulate Fluorides by Laser-Induced Breakdown Spectroscopy. Appl. Spectrosc. 2001, 55, 1455–1461. [Google Scholar] [CrossRef]
  10. Ripoll, L.; Navarro-González, J.; Legnaioli, S.; Palleschi, V.; Hidalgo, M. Evaluation of Thin Film Microextraction for trace elemental analysis of liquid samples using LIBS detection. Talanta 2021, 223, 121736. [Google Scholar] [CrossRef] [PubMed]
  11. Zhang, D.C.; Hu, Z.Q.; Su, Y.B.; Hai, B.; Zhu, X.L.; Zhu, J.F.; Ma, X. Simple method for liquid analysis by laser-induced breakdown spectroscopy (LIBS). Opt. Express 2018, 26, 18794–18802. [Google Scholar] [CrossRef]
  12. Rifai, K.; Laflamme, M.; Constantin, M.; Vidal, F.; Sabsabi, M.; Blouin, A.; Bouchard, P.; Fytas, K.; Castello, M.; Kamwa, B.N. Analysis of gold in rock samples using laser-induced breakdown spectroscopy: Matrix and heterogeneity effects. Spectrochim. Acta Part B At. Spectrosc. 2017, 134, 33–41. [Google Scholar] [CrossRef]
  13. Killinger, D.K.; Allen, S.D.; Waterbury, R.D.; Stefano, C.; Dottery, E.L. Enhancement of Nd:YAG LIBS emission of a remote target using a simultaneous CO_2 laser pulse. Opt. Express 2007, 15, 12905–12915. [Google Scholar] [CrossRef]
  14. Qiang, H.E.; Xiong, W.; Hong-peng, W.; Ru-jun, Y. Study on the Distribution of Ca Elements in Ammonite Stones Based on micro LIBS. Spectrosc. Spectr. Anal. 2019, 39, 2917–2921. [Google Scholar]
  15. Chen, X.; Li, X.; Yang, S.; Yu, X.; Liu, A. Discrimination of lymphoma using laser-induced breakdown spectroscopy conducted on whole blood samples. Biomed. Opt. Express 2018, 9, 1057–1068. [Google Scholar] [CrossRef] [PubMed]
  16. Rehse, S.J.; Diedrich, J.; Palchaudhuri, S. Identification and discrimination of Pseudomonas aeruginosa bacteria grown in blood and bile by laser-induced breakdown spectroscopy. Spectrochim. Acta Part B At. Spectrosc. 2007, 62, 1169–1176. [Google Scholar] [CrossRef]
  17. Meng, D.; Zhao, N.; Ma, M.; Fang, L.; Gu, Y.; Jia, Y.; Liu, J.; Liu, W. Application of a mobile laser-induced breakdown spectroscopy system to detect heavy metal elements in soil. Appl. Opt. 2017, 56, 5204–5210. [Google Scholar] [CrossRef] [PubMed]
  18. Rai, A.K.; Pati, J.K.; Rai, A.K. Chapter 16—LIBS Study of Geological Samples Coupled with Chemometric Methods. In Laser-Induced Breakdown Spectroscopy, 2nd ed.; Singh, J.P., Thakur, S.N., Eds.; Elsevier: Amsterdam, The Netherlands, 2020; pp. 369–384. [Google Scholar] [CrossRef]
  19. Pérez-Diez, S.; Fernández-Menéndez, L.J.; Veneranda, M.; Morillas, H.; Prieto-Taboada, N.; de Vallejuelo, S.F.-O.; Bordel, N.; Martellone, A.; De Nigris, B.; Osanna, M.; et al. Chemometrics and elemental mapping by portable LIBS to identify the impact of volcanogenic and non-volcanogenic degradation sources on the mural paintings of Pompeii. Anal. Chim. Acta 2021, 1168, 338565. [Google Scholar] [CrossRef]
  20. Sun, L.; Yu, H.; Cong, Z.; Xin, Y. On-line semi-quantitative analysis of molten steel composition using laser-induced breakdown spectroscopy. Chin. J. Sci. Instrum. 2011, 32, 2602–2608. [Google Scholar]
  21. Cai, J.; Dong, M.; Zhang, Y.; Chen, Y.; Liang, Y.; Lu, J. Temporally and spatially resolved study of laser-induced plasma generated on coals with different volatile matter contents. Spectrochim. Acta Part B At. Spectrosc. 2021, 180, 106195. [Google Scholar] [CrossRef]
  22. Rammelkamp, K.; Schröder, S.; Kubitza, S.; Vogt, D.S.; Frohmann, S.; Hansen, P.B.; Böttger, U.; Hanke, F.; Hübers, H.-W. Low-level LIBS and Raman data fusion in the context of in situ Mars exploration. J. Raman Spectrosc. 2019, 51, 1682–1701. [Google Scholar]
  23. Wang, Q.; Xiao, J.; Li, Y.; Lu, Y.; Guo, J.; Tian, Y.; Ren, L. Mid-level data fusion of Raman spectroscopy and laser-induced breakdown spectroscopy: Improving ores identification accuracy. Anal. Chim. Acta 2023, 1240, 340772. [Google Scholar]
  24. Moros, J.; ElFaham, M.M.; Laserna, J.J. Dual-Spectroscopy Platform for the Surveillance of Mars Mineralogy Using a Decisions Fusion Architecture on Simultaneous LIBS-Raman Data. Anal. Chem. 2018, 90, 2079–2087. [Google Scholar] [CrossRef]
  25. Raneri, S.; Botto, A.; Campanella, B.; Momčilović, M.; Palleschi, V.; Poggialini, F.; Sciuto, C.; Gattiglia, G.; Volpintesta, F.; Selvaraj, T.; et al. Increasing resolution in chemical mapping of geomaterials: From X-ray fluorescence to laser-induced breakdown spectroscopy. Spectrochim. Acta Part B At. Spectrosc. 2022, 194, 106482. [Google Scholar] [CrossRef]
  26. Sun, H.; Song, C.; Lin, X.; Gao, X. Identification of meat species by combined laser-induced breakdown and Raman spectroscopies. Spectrochim. Acta Part B At. Spectrosc. 2022, 194, 106456. [Google Scholar] [CrossRef]
  27. Chen, J.; Pisonero, J.; Chen, S.; Wang, X.; Fan, Q.; Duan, Y. Convolutional neural network as a novel classification approach for LIBS applications in lithological recognition. Spectrochim. Acta Part B At. Spectrosc. 2020, 166, 105801. [Google Scholar] [CrossRef]
  28. Chengxu, L.; Bo, W.; Jiang, X.; Zhang, J.; Kang, N.; Yanwei, Y. Detection of K in the soil using time-resolved laser induced breakdown spectroscopy based on convolutional neural networks. Plasma Sci. Technol. 2019, 21, 034014. [Google Scholar]
  29. Stead, C.V.; Tomlinson, E.L.; Kamber, B.S.; Babechuk, M.G.; McKenna, C.A. Rare Earth Element Determination in Olivine by Laser Ablation-Quadrupole-ICP-MS: An Analytical Strategy and Applications. Geostand. Geoanalytical Res. 2017, 41, 197–212. [Google Scholar] [CrossRef]
  30. Bsdok, B.; Altenberger, U.; Concha-Perdomo, A.E.; Wilke FD, H.; Gil-Rodríguez, J.G. The Santa Rosa de Viterbo meteorite, Colombia. New work on it’s petrological, geochemical and economical characterization. J. S. Am. Earth Sci. 2020, 104, 102779. [Google Scholar] [CrossRef]
  31. Deon, F.; Förster, H.J.; van Ruitenbeek, F.; Appelt, O. Performance of analytical techniques (SWIR imaging, XRD, EPMA) for the identification of minerals frequently formed during natural and technological geothermal processes. Int. J. Terr. Heat Flow Appl. Geotherm. 2022, 5, 34–44. [Google Scholar] [CrossRef]
  32. Ning, X.; Selesnick, I.W.; Duval, L. Chromatogram baseline estimation and denoising using sparsity (BEADS). Chemom. Intell. Lab. Syst. 2014, 139, 156–167. [Google Scholar] [CrossRef]
  33. Wang, H.; Fang, P.; Yan, X.; Zhou, Y.; Cheng, Y.; Yao, L.; Jia, J.; He, J.; Wan, X. Study on the Raman spectral characteristics of dynamic and static blood and its application in species identification. J. Photochem. Photobiol. B Biol. 2022, 232, 112478. [Google Scholar] [CrossRef]
  34. Wang, H.; Wan, X. Effect of chlorophyll fluorescence quenching on quantitative analysis of adulteration in extra virgin olive oil. Spectrochim. Acta Part A Mol. Biomol. Spectrosc. 2021, 248, 119183. [Google Scholar] [CrossRef] [PubMed]
  35. Wang, H.; Xin, Y.; Wan, X. Spectral detection technology of vegetable oil: Spectral analysis of porphyrins and terpenoids. Spectrochim. Acta Part A Mol. Biomol. Spectrosc. 2021, 261, 119965. [Google Scholar] [CrossRef] [PubMed]
  36. Wang, H.; Xin, Y.; Ma, H.; Fang, P.; Li, C.; Wan, X.; He, Z.; Jia, J.; Ling, Z. Rapid detection of Chinese-specific peony seed oil by using confocal Raman spectroscopy and chemometrics. Food Chem. 2021, 362, 130041. [Google Scholar] [CrossRef]
  37. van der Maaten, L.J.P.; Postma, E.O.; van den Herik, H.J. Dimensionality Reduction: A Comparative Review. Tilburg University Technical Report, TiCC-TR 2009-005, 2009. J. Mach. Learn. Res. 2009, 10, 13. [Google Scholar]
  38. van der Maaten, L.J.P.; Hinton, G.E. Visualizing High-Dimensional Data Using t-SNE. J. Mach. Learn. Res. 2008, 9, 2579–2605. [Google Scholar]
  39. Hecht-Nielsen, R. Theory of the backpropagation neural network. Neural Netw. 1988, 1, 445. [Google Scholar] [CrossRef]
  40. Harris, J.R.; Murray, R.; Hirose, T. IHS transform for the integration of radar imagery with other remotely sensed data. Photogramm. Eng. Remote Sens. 1990, 56, 1631–1641. [Google Scholar]
  41. Rahmani, S.; Strait, M.; Merkurjev, D.; Moeller, M.; Wittman, T. An adaptive IHS pan-sharpening method. IEEE Geosci. Remote Sens. Lett. 2010, 7, 746–750. [Google Scholar] [CrossRef]
  42. Gosetti, F.; Mazzucco, E.; Gennaro, M.C.; Marengo, E. Simultaneous determination of sixteen underivatized biogenic amines in human urine by HPLC-MS/MS. Anal. Bioanal. Chem. 2012, 405, 907–916. [Google Scholar] [CrossRef]
  43. Alan, E.R. Mineralogy of meteorite groups. Meteorit. Planet. Sci. 1997, 32, 153–328. [Google Scholar]
  44. Chen, M.; Xie, X. Ahmed EL GORESY. A shock-produced (Mg, Fe)SiO3 glass in the Suizhou meteorite. Meteorit. Planet. Sci. 2010, 39, 1797–1808. [Google Scholar] [CrossRef]
  45. Chopelas, A. Single crystal Raman spectra of forsterite, fayalite, and monticellite. Am. Meteoriteogist 1991, 76, 1101–1109. [Google Scholar] [CrossRef]
  46. Mouri, T.; Enami, M. Raman spectroscopic study of olivine-group minerals. J. Miner. Pet. Sci. 2008, 103, 100–104. [Google Scholar] [CrossRef]
  47. Wang, A.; Kuebler, K.; Jolliff, B.; Haskin, L.A. Mineralogy of a Martian meteorite as determined by Raman spectroscopy. J. Raman Spectrosc. 2004, 35, 504–514. [Google Scholar] [CrossRef]
  48. Gatan Inc. Improving Sample Analysis Using Cathodoluminescence (CL) and Energy Dispersive Spectroscopy (EDS). AZoM. Available online: https://www.azom.com/article.aspx?ArticleID=20761 (accessed on 5 May 2023).
Figure 1. The technical concept of Raman mapping-assisted micro-LIBS. (a) Raman mapping; (b) Spectral image fusion ((1). Raman mapping; (2). Microscopic image; (3). The fusion results of the Raman mapping and microscopic image); (c) Raman mapping assisted micro-LIBS.
Chemosensors 11 00567 g001
Figure 2. The schematic diagram of the experimental device. (a) Raman spectroscopy setup; (b) micro-LIBS setup.
Chemosensors 11 00567 g002
Figure 3. Spectral data pre-processing. (a) The original spectrum of the micro-LIBS; (b) the baseline of the micro-LIBS; (c) the corrected spectrum of micro-LIBS; (d) the residual of the micro-LIBS.
Chemosensors 11 00567 g003
Figure 4. The fusion of Raman mapping and microscopic image. (a) The microscopic image of the region of interest (ROI); (b) the Raman mapping of the region of interest (ROI); (c) the fusion results of the Raman mapping and the microscopic image.
Chemosensors 11 00567 g004
Figure 5. Matching between the measured spectrum and the RRUFF Project website’s Raman spectrum database. (a) Sample 1’s matching mineral is microcline (RRUFF ID: R050054); (b) Sample 2’s matching mineral is forsterite (RRUFF ID: R060535); (c) Sample 3’s matching mineral is hematite (RRUFF ID: R060190).
Chemosensors 11 00567 g005
Figure 6. Elements corresponding to the micro-LIBS peak positions of two minerals. (a) Determination of element attribution of LIBS peaks in 350–400 nm range; (b) determination of element attribution of LIBS peaks in 400–450 nm range; (c) determination of element attribution of LIBS peaks in 480–600 nm range.
Chemosensors 11 00567 g006
Figure 7. Maximum standard deviation of 34 CRMs. (a) The stem chart of S D max ; (b) the histogram of S D max . (CRMs with a maximum standard deviation of less than 0.048 are marked in green, while others are marked in yellow).
Chemosensors 11 00567 g007
Figure 8. Calibration curve for quantitative analysis of Fe, Mg, and Na elements of MDS–BPNN. (a) The training set prediction results for quantitative analysis of Fe, Mg and Na elements of MDS–BPNN; (b) the validation set prediction results for quantitative analysis of Fe, Mg, and Na elements of MDS–BPNN; (c) the test set prediction results for quantitative analysis of Fe, Mg, and Na elements of MDS–BPNN; (d) the test set prediction calibration curve for quantitative analysis of Fe element of MDS–BPNN; (e) the test set prediction calibration curve for quantitative analysis of Mg element of MDS–BPNN; (f) the test set prediction calibration curve for quantitative analysis of Na element of MDS–BPNN.
Chemosensors 11 00567 g008
Figure 9. Quantitative analysis results of meteorite micro-LIBS. (a) Quantitative analysis results of micro-LIBS of Sample 3. (b) Quantitative analysis results of micro-LIBS of Sample 2. (c) Micro-LIBS spectra of Sample 3. (d) Micro-LIBS spectra of Sample 2.
Chemosensors 11 00567 g009
Figure 10. (a) Peak ratios of all Raman spectra (Sample 2) and their regression equations; (b) Raman bands of all silicate ions in the region; (c) color image generated by Raman peak ratio normalization index.
Chemosensors 11 00567 g010
Disclaimer/Publisher’s Note: The statements, opinions and data contained in all publications are solely those of the individual author(s) and contributor(s) and not of MDPI and/or the editor(s). MDPI and/or the editor(s) disclaim responsibility for any injury to people or property resulting from any ideas, methods, instructions or products referred to in the content.

