
Comparison of Surface and Spectral Properties of Optical Sensor Layers Prepared by Spin/Spray Coating and Printing Techniques

Abstract
:1. Introduction
2. Materials and Methods
2.1. Preparation of Optical Sensor Layers
2.1.1. Spin Coating
2.1.2. Inkjet Printing
2.1.3. Inkjet Printing
2.2. Characterization of Optical Sensors
2.2.1. ATR-FTIR Spectroscopy
2.2.2. Surface Free Energy (SFE)
2.2.3. Surface Chemical Composition (XPS)
2.2.4. Avantes AvaSpec Spectrophotometer
2.2.5. Real-Time Response of Optical Sensors
3. Results
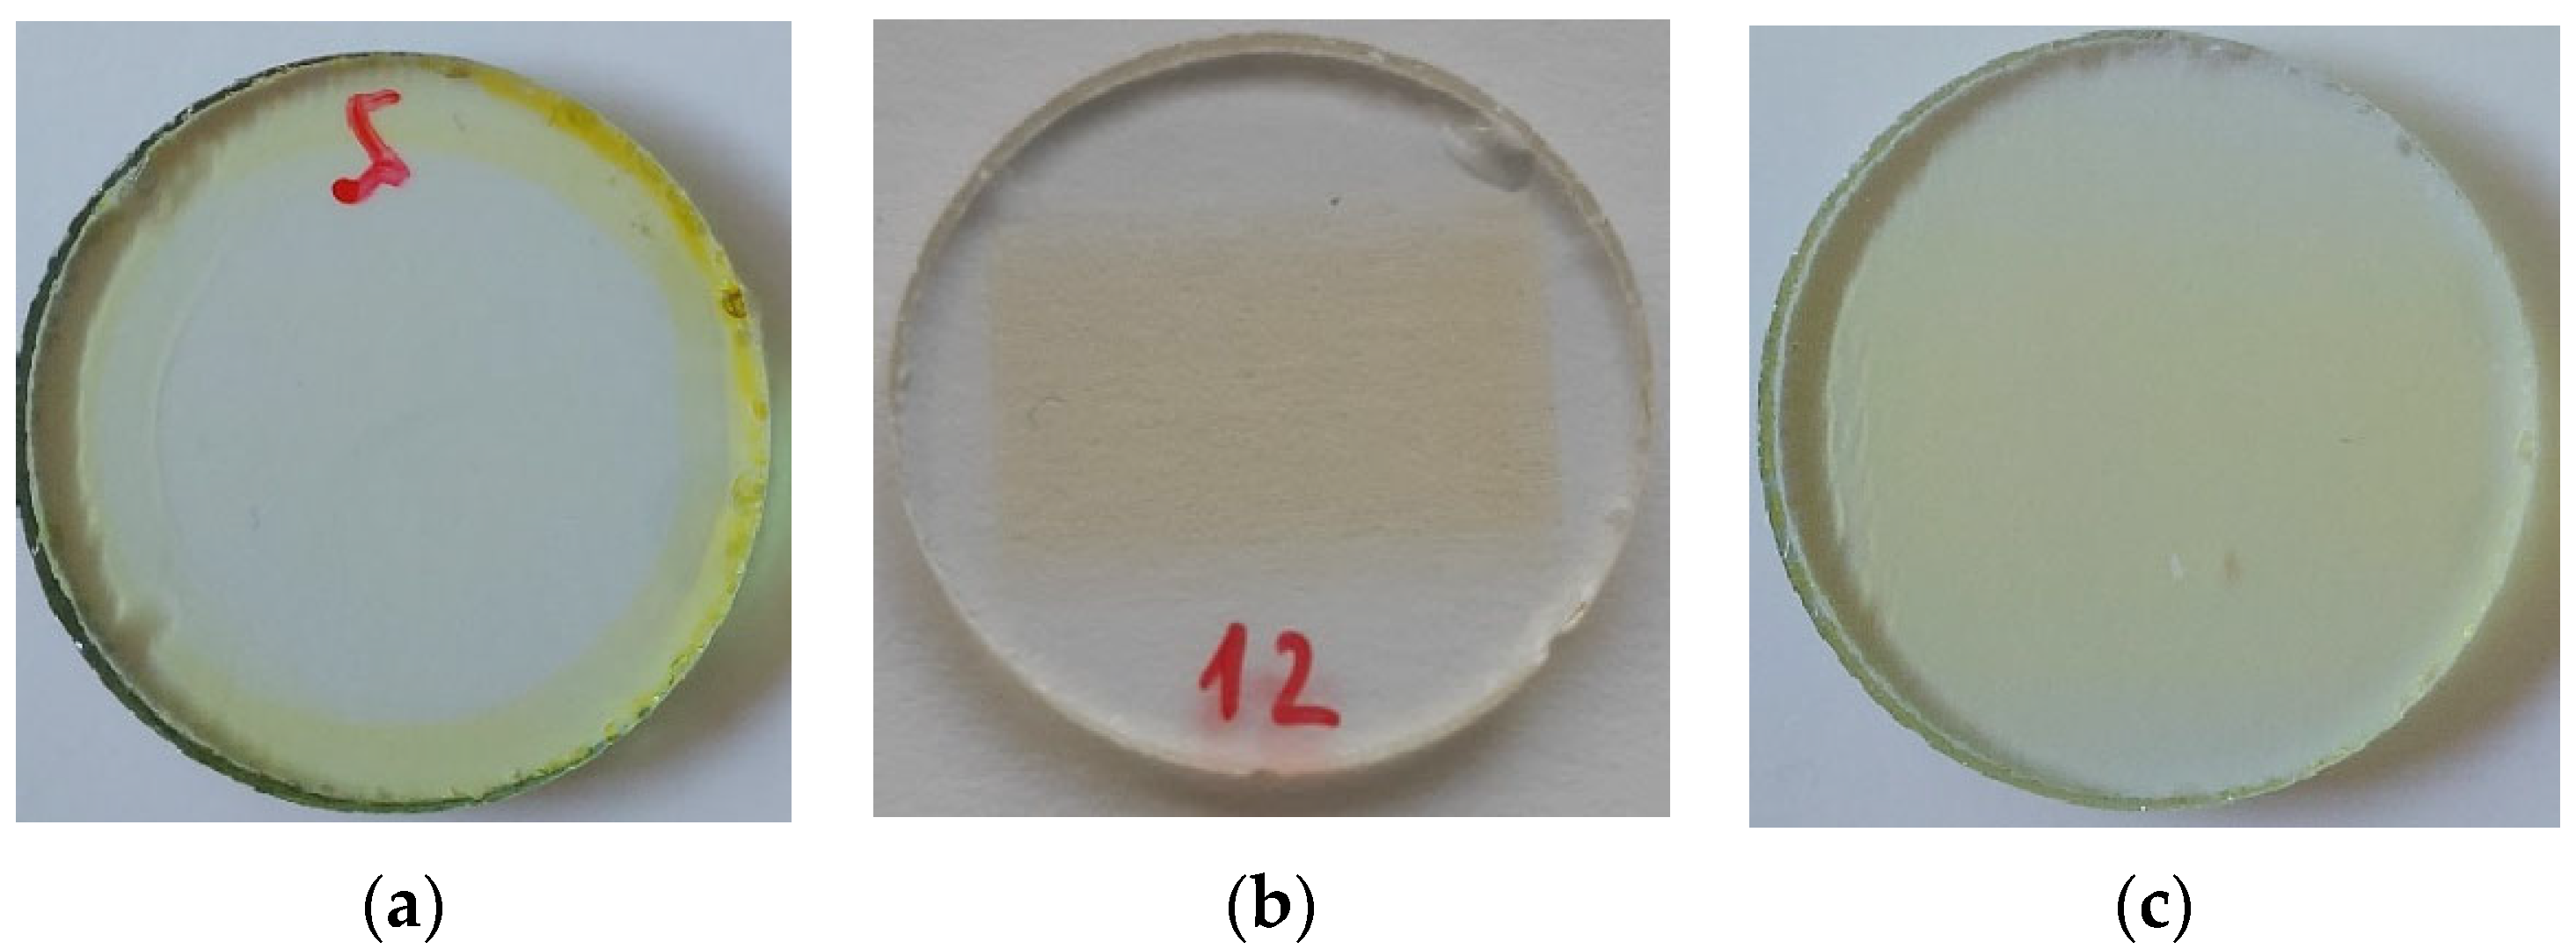
3.1. Preparation of Optical Sensor Layers with Different Techniques
3.2. Characterization of Optical Sensor Layers
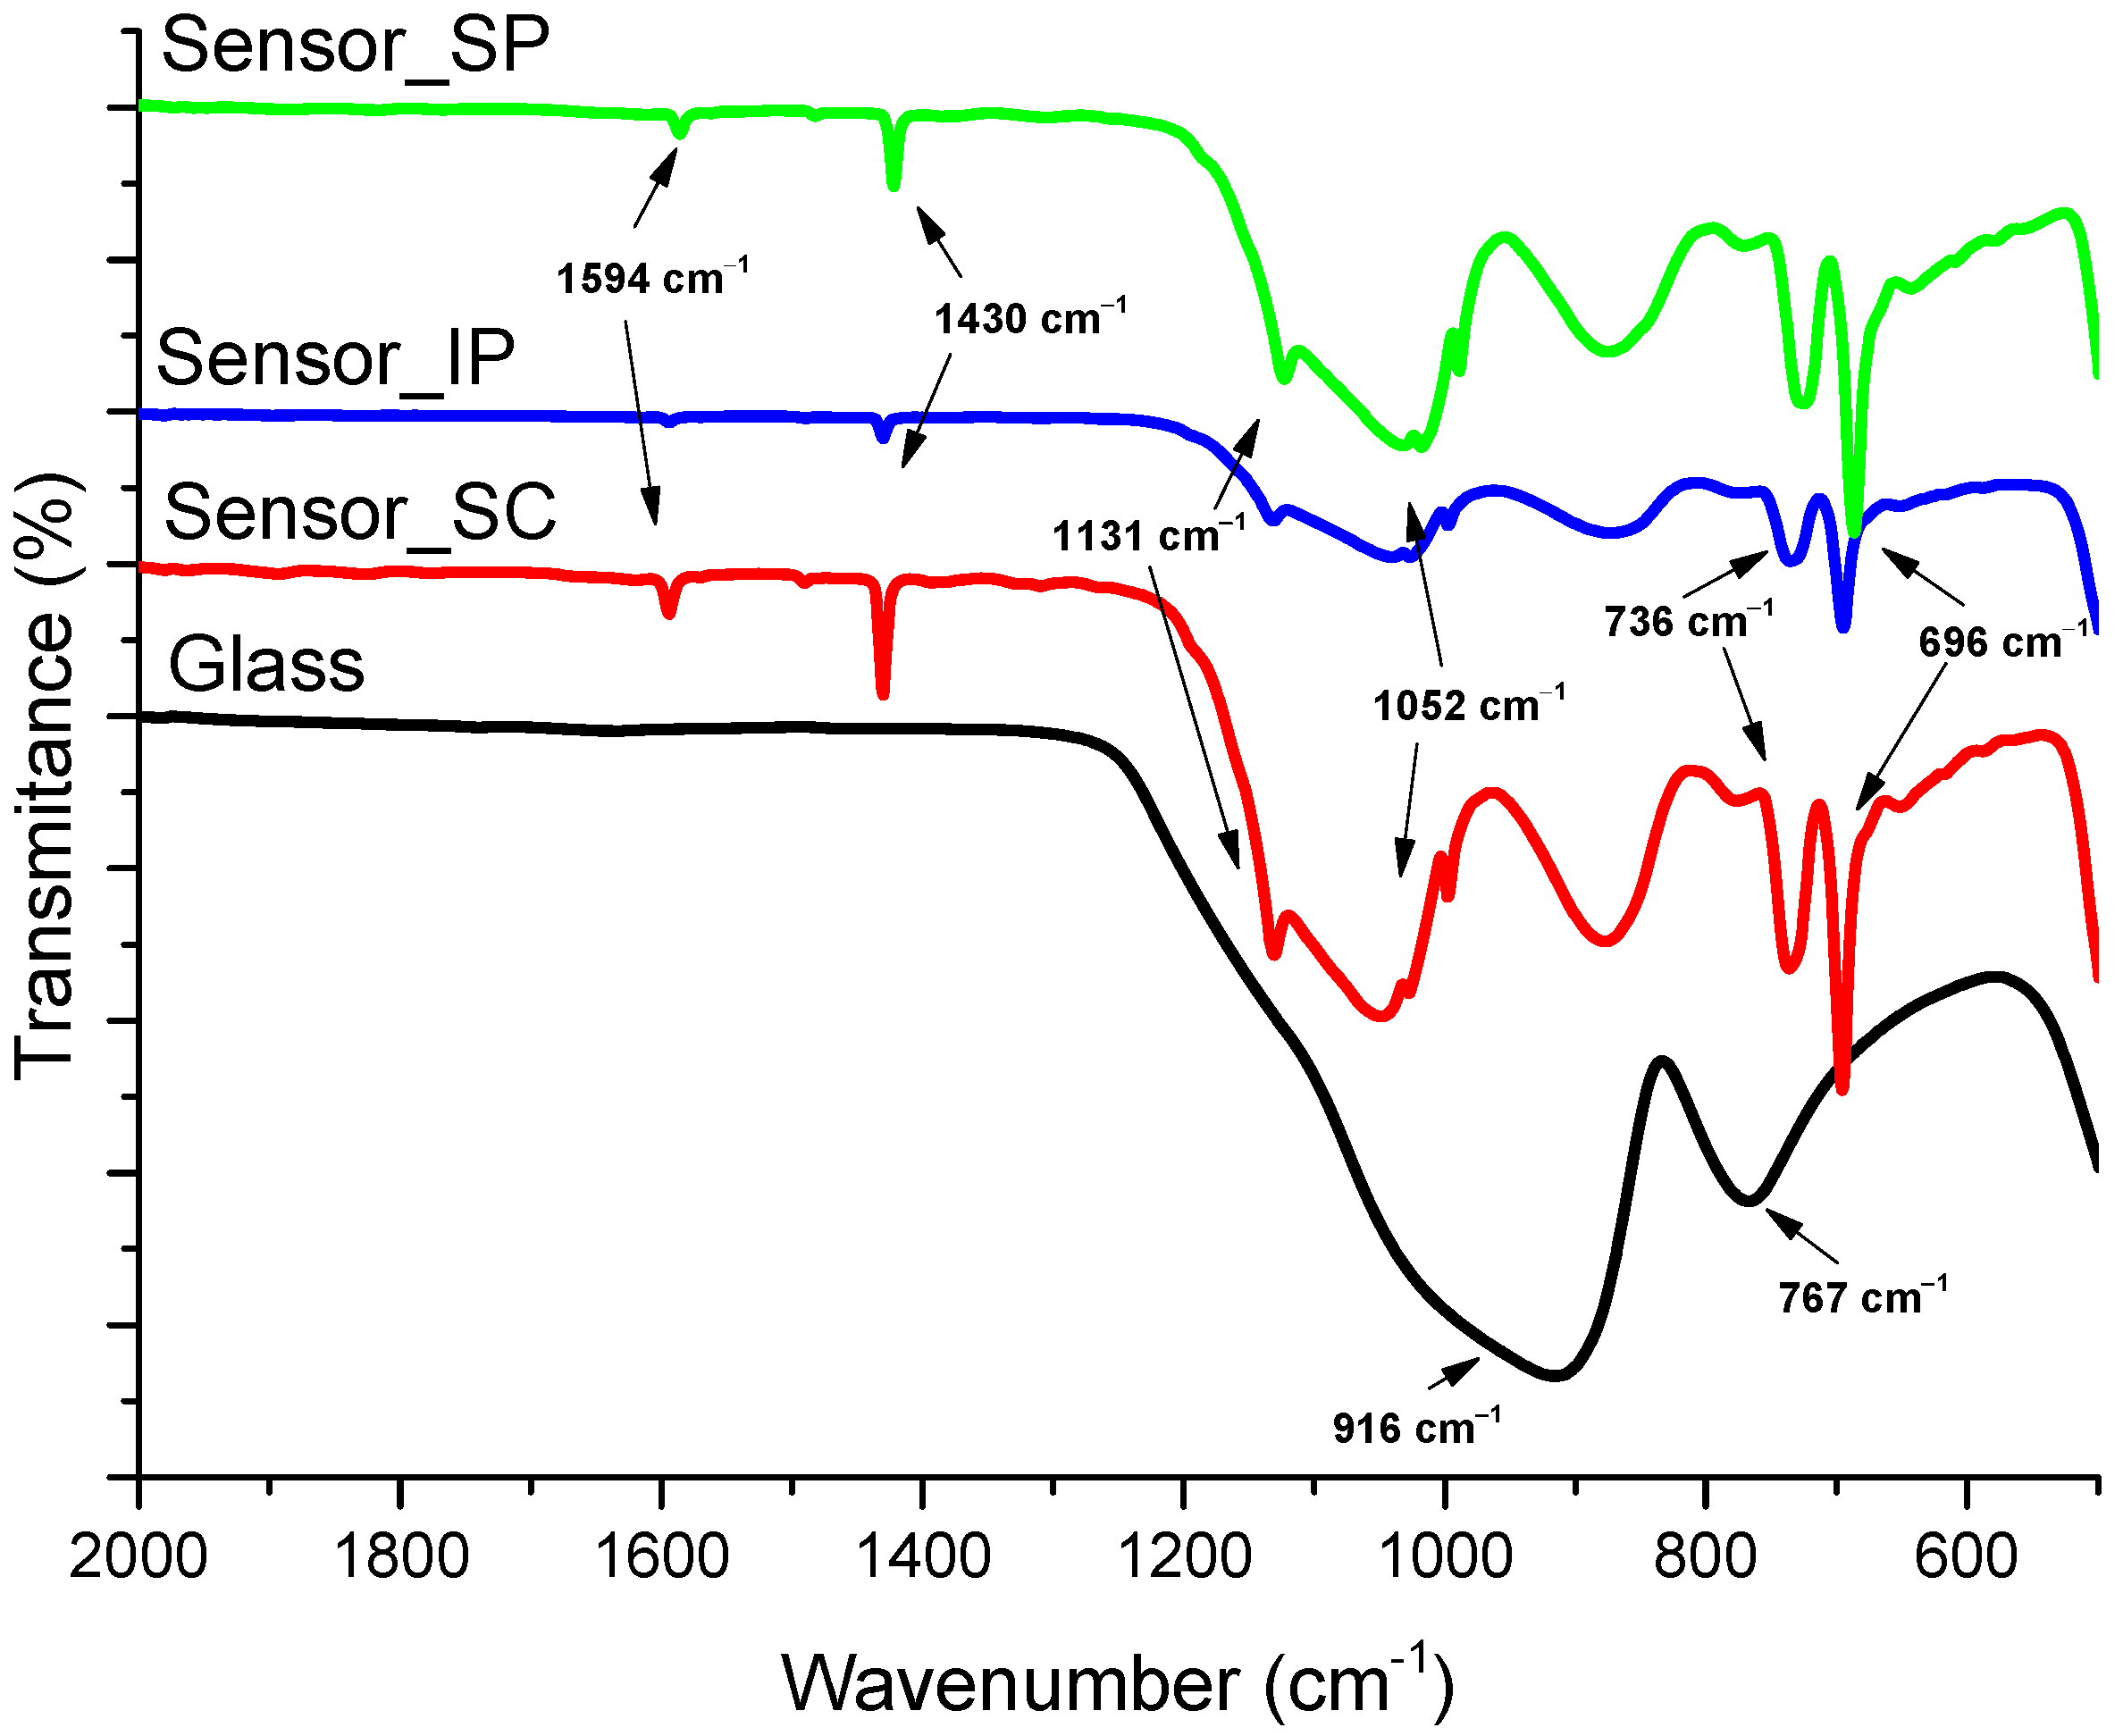
3.2.1. ATR-FTIR Spectroscopy
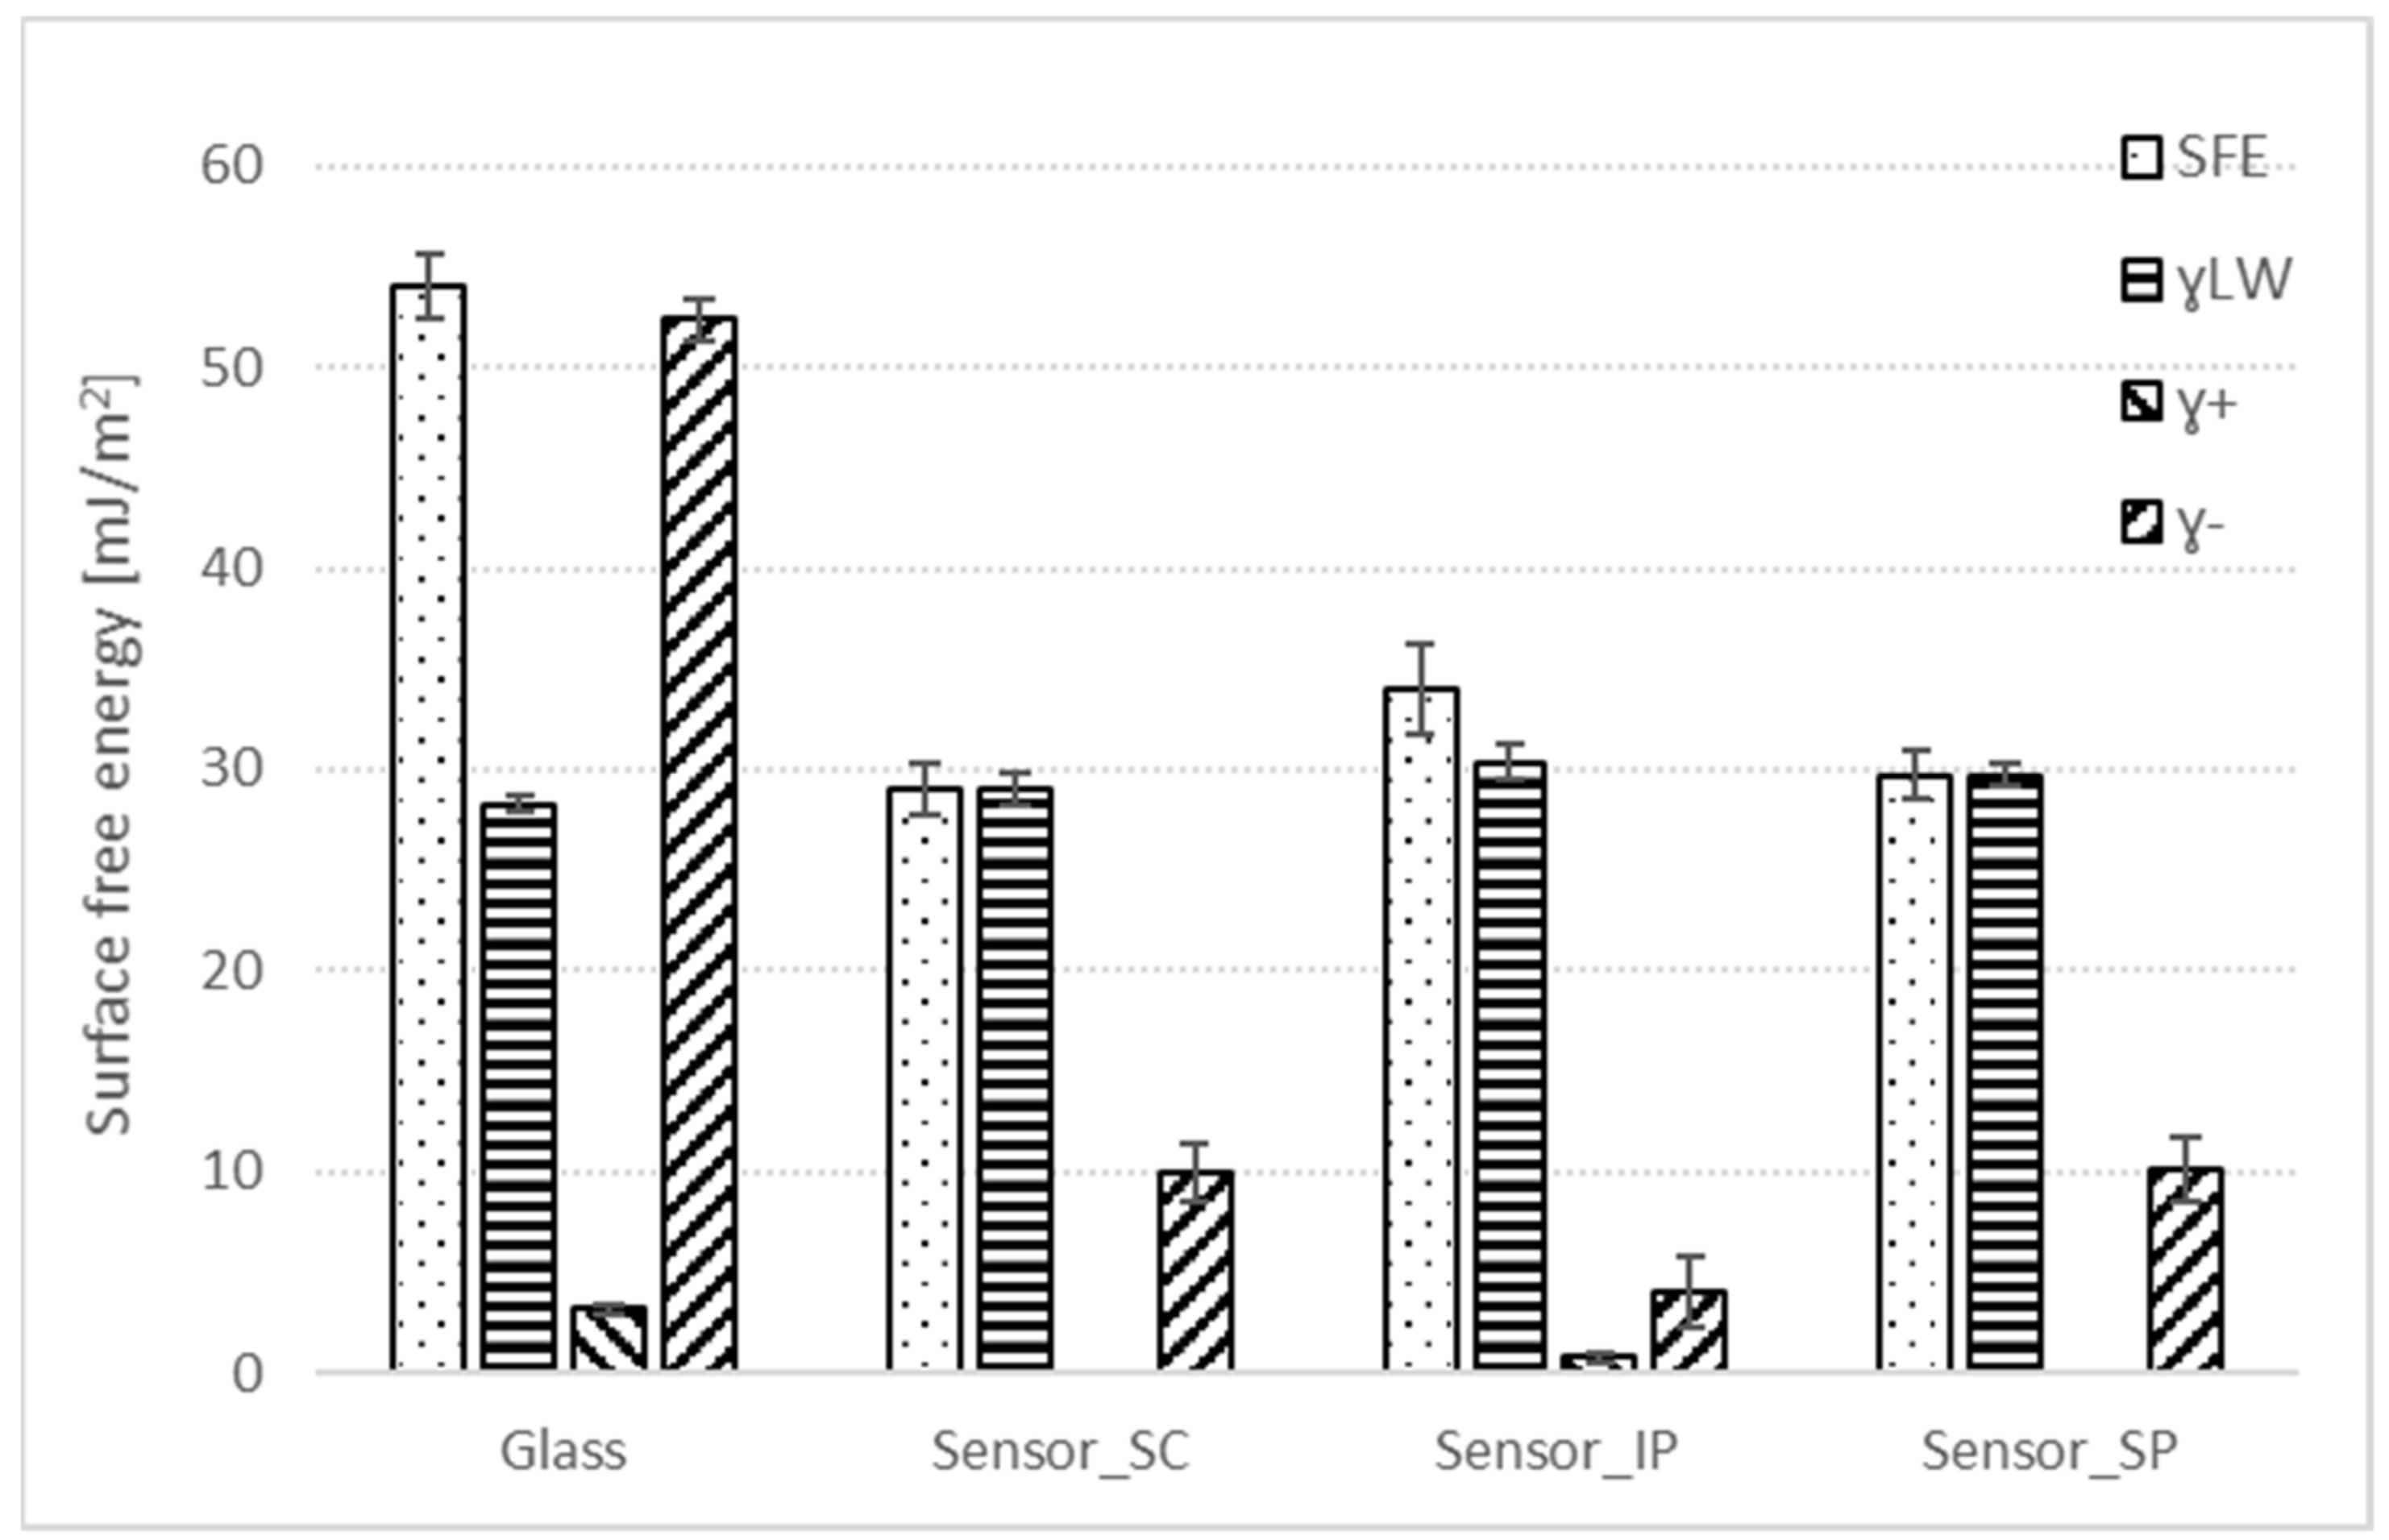
3.2.2. Water Contact Angle and Surface Free Energy
Hydrophilic/Hydrophobic Character of Glass and Optical Sensor Layers Prepared with Different Techniques
Surface Free Energy of Glass and Optical Sensor Layers Prepared with DifferentTechniques
3.2.3. X-ray Photoelectron Spectroscopy (XPS)
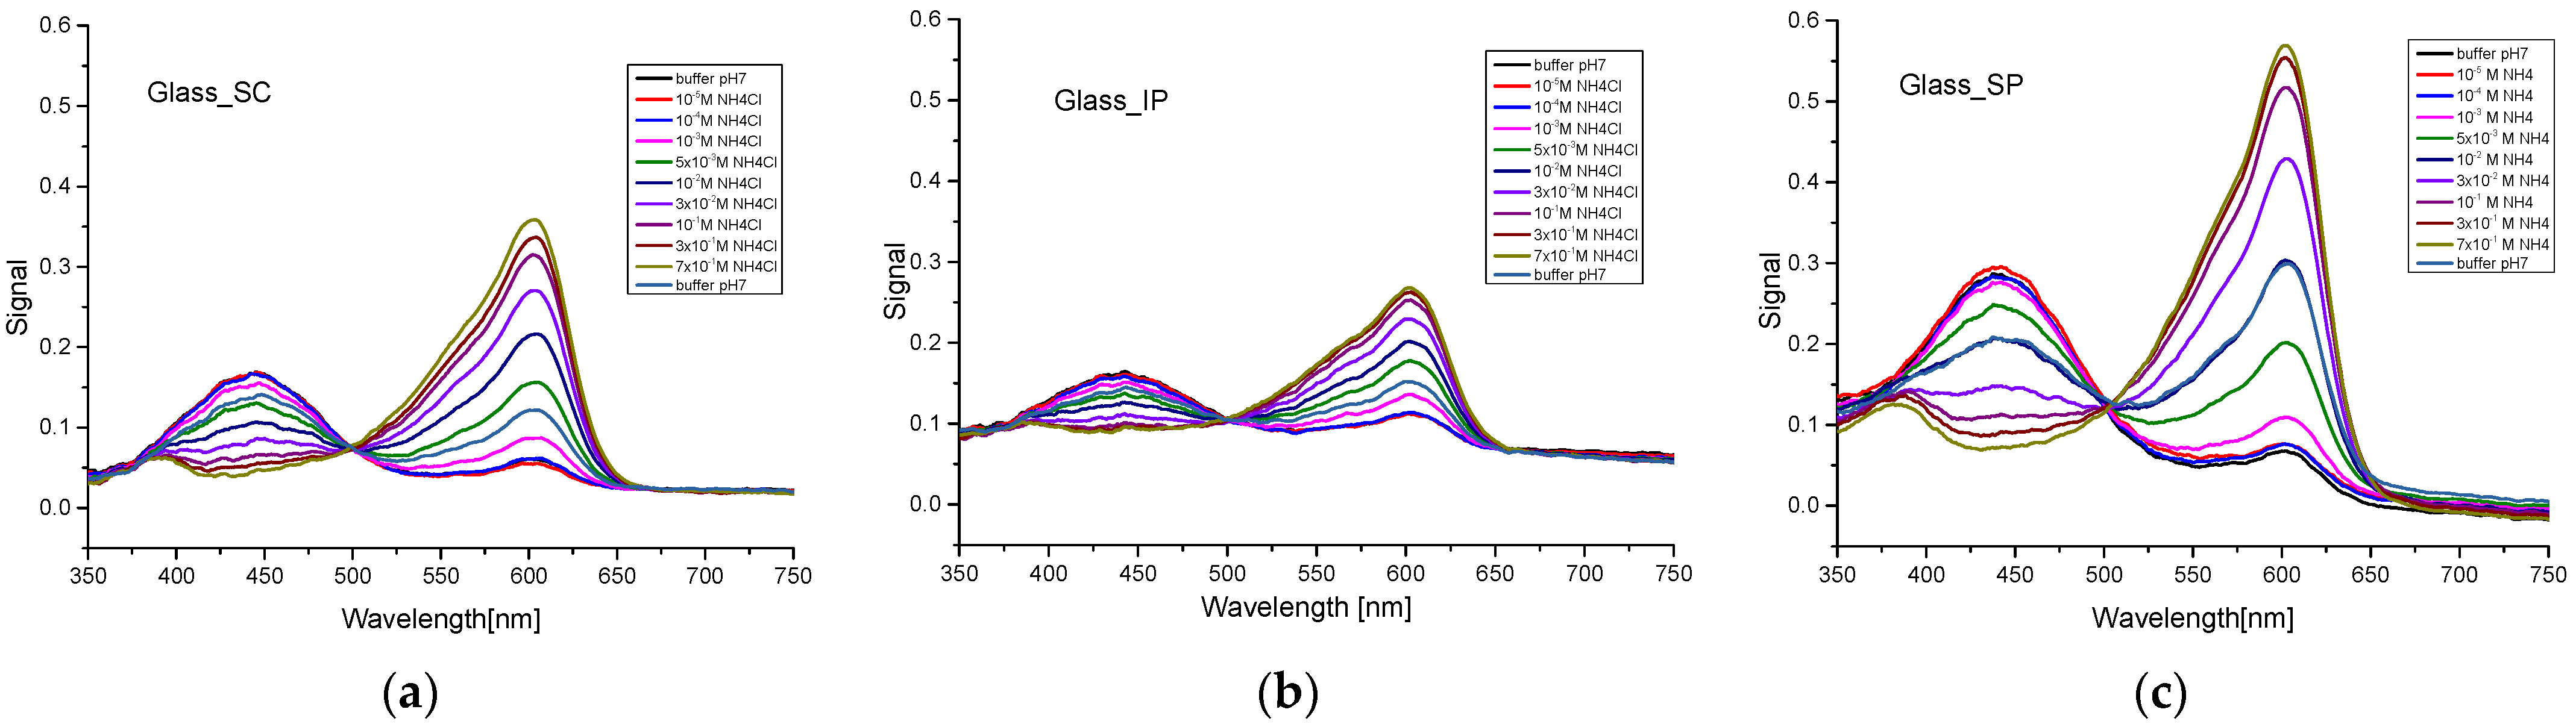
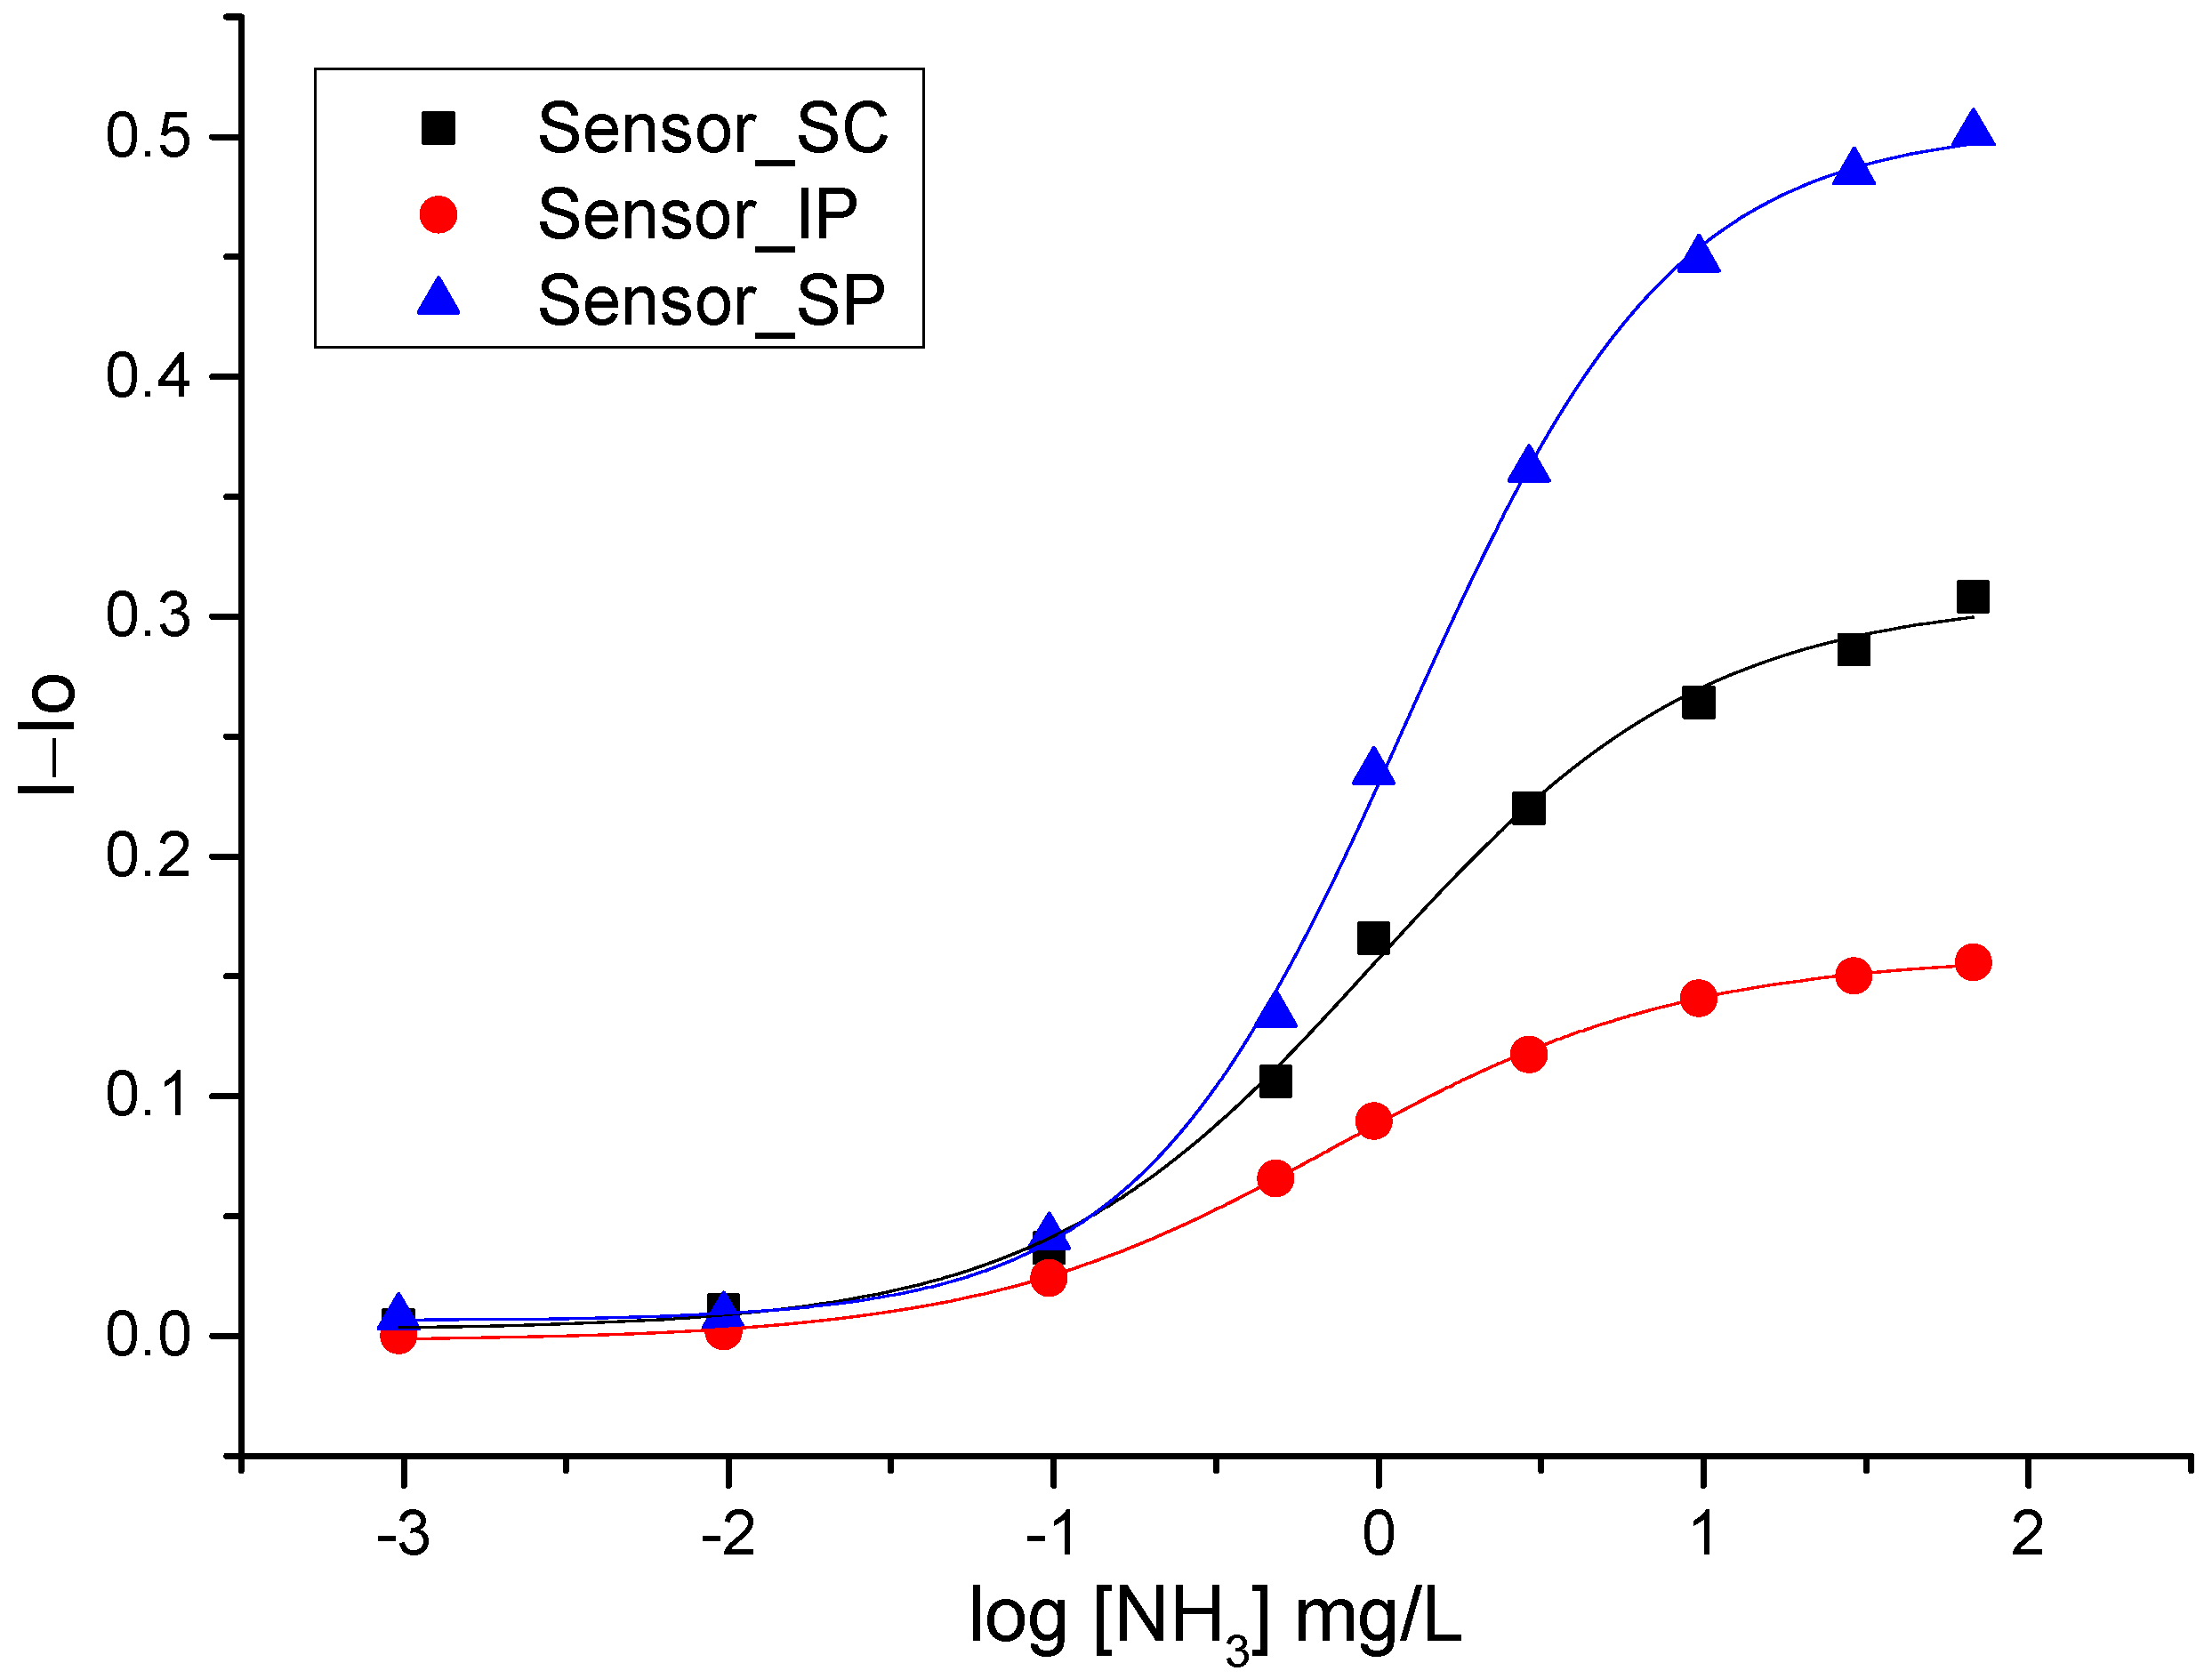
3.2.4. Spectral Properties of Sensor Layers in the Presence of Ammonia
Response to Ammonia in an Aqueous Medium
Response Time of Sensor Layers (Time Drive)
3.2.5. Real-Time Response of Optical Sensor Layers
4. Conclusions
Author Contributions
Funding
Institutional Review Board Statement
Informed Consent Statement
Data Availability Statement
Acknowledgments
Conflicts of Interest
References
- Enríquez, E.; de La Rubia, M.Á.; González, F.; Alburquerque, A.; Fernández, J.F. Effective Air-Spray Deposition of Thin Films Obtained by Sol-Gel Process onto Complex Pieces of Sanitary Ware. J. Am. Ceram. Soc. 2016, 99, 72–78. [Google Scholar] [CrossRef]
- Kaloumenou, M.; Skotadis, E.; Lagopati, N.; Efstathopoulos, E.; Tsoukalas, D. Breath Analysis: A Promising Tool for Disease Diagnosis— The Role of Sensors. Sensors 2022, 22, 1238. [Google Scholar] [CrossRef]
- Jerónimo, P.C.A.; Araújo, A.N.; Conceição, M. Optical sensors and biosensors based on sol-gel films. Talanta 2007, 72, 13–27. [Google Scholar] [CrossRef] [PubMed]
- Barczak, M.; McDonagh, C.; Wencel, D. Micro- and nanostructured sol-gel-based materials for optical chemical sensing (2005–2015). Microchim. Acta 2016, 183, 2085–2109. [Google Scholar] [CrossRef]
- Zhang, J.; Zhou, L. Preparation and Optimization of Optical pH Sensor Based on Sol-Gel. Sensors 2018, 18, 3195. [Google Scholar] [CrossRef]
- Biring, S.; Sadhu, A.S.; Deb, M. An Effective Optical Dual Gas Sensor for Simultaneous Detection of Oxygen and Ammonia. Sensors 2019, 19, 5124. [Google Scholar] [CrossRef] [PubMed]
- Matsuura, S.; Yamasaku, N.; Nishijima, Y.; Okazaki, S.; Arakawa, T. Characteristics of Highly Sensitive Hydrogen Sensor Based on Pt-WO3/Si Microring Resonator. Sensors 2020, 20, 96. [Google Scholar] [CrossRef]
- Duong, H.D.; Rhee, J. Development of Ratiometric Fluorescence Sensors Based on CdSe/ZnS Quantum Dots for the Detection of Hydrogen Peroxide. Sensors 2019, 19, 4977. [Google Scholar] [CrossRef]
- Steirer, K.X.; Berry, J.J.; Reese, M.O.; van Hest, M.F.; Miedaner, A.; Liberatore, M.W.; Collins, R.; Ginley, D.S. Ultrasonically sprayed and inkjet printed thin film electrodes for organic solar cells. Thin Solid Films 2009, 517, 2781–2786. [Google Scholar] [CrossRef]
- Aziz, F.; Ismail, A.F. Spray coating methods for polymer solar cells fabrication: A review. Mater. Sci. Semicond. Process. 2015, 39, 416–425. [Google Scholar] [CrossRef] [Green Version]
- Park, S.Y.; Kang, Y.-J.; Lee, S.; Kim, D.-G.; Kim, J.-K.; Kim, J.H.; Kang, J.-W. Spray-coated organic solar cells with large-area of 12.25 cm 2. Sol. Energy Mater. Sol. Cells 2011, 95, 852–855. [Google Scholar] [CrossRef]
- Peřinka, N.; Držková, M.; Randjelović, D.V.; Bondavalli, P.; Hajná, M.; Bober, P.; Syrový, T.; Bonnassieaux, Y.; Stejskal, J. Characterization of Polyaniline-Based Ammonia Gas Sensors Prepared by Means of Spray Coating and Ink-Jet Printing. Sens. Lett. 2014, 12, 1620–1627. [Google Scholar] [CrossRef]
- Kangur, T.; Nurmis, L.; Järvekülg, M. Influence of some system parameters on silica surface patterns by sol-gel phase separation method. IOP Conf. Ser. Mater. Sci. Eng. 2013, 49, 012035. [Google Scholar] [CrossRef]
- Peřinka, N.; Držková, M.; Randjelović, D.V.; Bondavalli, P.; Hajná, M.; Bober, P.; Syrový, T.; Bonnassieaux, Y.; Stejskal, J. Application of Ink-Jet Printing and Spray Coating for the Fabrication of Polyaniline/Poly(N-Vinylpyrrolidone)-Based Ammonia Gas Sensor. Key Eng. Mater. 2015, 644, 61–64. [Google Scholar] [CrossRef]
- Gonzalez-Macia, L.; Morrin, A.; Smyth, M.R.; Killard, A.J. Advanced printing and deposition methodologies for the fabrication of biosensors and biodevices. Analyst 2010, 135, 845–867. [Google Scholar] [CrossRef]
- Komuro, N.; Takaki, S.; Suzuki, K.; Citterio, D. Inkjet printed (bio)chemical sensing devices. Anal. Bioanal. Chem. 2013, 405, 5785–5805. [Google Scholar] [CrossRef]
- De Gans, B.-J.; Duineveld, P.C.; Schubert, U.S. Inkjet Printing of Polymers: State of the Art and Future Developments. Adv. Mater. 2004, 16, 203–213. [Google Scholar] [CrossRef]
- Monton, M.R.N.; Forsberg, E.M.; Brennan, J.D. Tailoring sol-gel-derived silica materials for optical biosensing. Chem. Mater. 2012, 24, 796–811. [Google Scholar] [CrossRef]
- Zakir Hossain, S.M.; Luckham, R.E.; Smith, A.M.; Lebert, J.M.; Davies, L.M.; Pelton, R.H.; Filipe, C.D.M.; Brennan, J.D. Development of a bioactive paper sensor for detection of neurotoxins using piezoelectric inkjet printing of sol-gel-derived bioinks. Anal. Chem. 2009, 81, 5474–5483. [Google Scholar] [CrossRef]
- Mensing, J.P.; Wisitsoraat, A.; Tuantranont, A.; Kerdcharoen, T. Inkjet-printed sol–gel films containing metal phthalocyanines/porphyrins for opto-electronic nose applications. Sens. Actuators B Chem. 2013, 176, 428–436. [Google Scholar] [CrossRef]
- Di Risio, S.; Yan, N. Piezoelectric ink-jet printing of horseradish peroxidase: Effect of ink viscosity modifiers on activity. Macromol. Rapid Commun. 2007, 28, 1934–1940. [Google Scholar] [CrossRef]
- Omar, S.; Pellice, S.; Ballarre, J.; Ceré, S. Hybrid Organic-inorganic Silica-based Coatings Deposited by Spray Technique. Procedia Mater. Sci. 2015, 9, 469–476. [Google Scholar] [CrossRef]
- Garcia, R.B.R.; Silva, F.S.; Kawachi, E.Y. Evaluation of dip and spray coating techniques in corrosion inhibition of AA2024 alloy using a silicon/zirconium sol-gel film as coating. AIP Conf. Proc. 2017, 1809, 020017. [Google Scholar] [CrossRef]
- Carey, T.; Jones, C.; le Moal, F.; Deganello, D.; Torrisi, F. Spray-Coating Thin Films on Three-Dimensional Surfaces for a Semitransparent Capacitive-Touch Device. ACS Appl. Mater. Interfaces 2018, 10, 1994–19956. [Google Scholar] [CrossRef]
- Arun Kumar, K.D.; Valanarasu, S.; Ponraj, J.S.; Fernandes, B.J.; Shkir, M.; AlFaify, S.; Murahari, P.; Ramesh, K. Effect of Er doping on the ammonia sensing properties of ZnO thin films prepared by a nebulizer spray technique. J. Phys. Chem. Solids 2020, 144, 109513. [Google Scholar] [CrossRef]
- Chen, X.; Dai, Y.; Li, Z.; Zhang, Z.; Wang, X. Optical rubbery ormosils sensor for the detection of ammonia. Fresenius J. Anal. Chem. 2001, 370, 1048–1051. [Google Scholar] [CrossRef]
- Fahad, O.A.; Mohammed, A.S. Thin films of tungsten oxide based on NH3 and NO2 gas sensors. Mater. Today Proc. 2021, 42, 2405–2409. [Google Scholar] [CrossRef]
- Kundu, S.; George, S.J.; Kulkarni, G.U. Parts per billion sensitive, highly selective ambient operable, ammonia sensor with supramolecular nanofibres as active element. Sens. Actuators B Chem. 2021, 347, 130634. [Google Scholar] [CrossRef]
- Deshpande, N.G.; Gudage, Y.G.; Sharma, R.; Vyas, J.C.; Kim, J.B.; Lee, Y.P. Studies on tin oxide-intercalated polyaniline nanocomposite for ammonia gas sensing applications. Sens. Actuators B Chem. 2009, 138, 76–84. [Google Scholar] [CrossRef]
- Markovics, Á.; Kovács, B. Fabrication of optical chemical ammonia sensors using anodized alumina supports and sol–gel method. Talanta 2013, 109, 101–106. [Google Scholar] [CrossRef]
- Tang, H.; Yan, M.; Zhang, H.; Li, S.; Ma, X.; Wang, M.; Yang, D. A selective NH3 gas sensor based on Fe2O3–ZnO nanocomposites at room temperature. Sens. Actuators B Chem. 2006, 114, 910–915. [Google Scholar] [CrossRef]
- Mani, G.K.; Rayappan, J.B.B. A highly selective room temperature ammonia sensor using spray deposited zinc oxide thin film. Sens. Actuators B Chem. 2013, 183, 459–466. [Google Scholar] [CrossRef]
- Van Oss, C.J.; Chaudhury, M.K.; Good, R.J. Interfacial Lifshitz-van der Waals and Polar Interactions in Macroscopic Systems. Available online: https://pubs.acs.org/sharingguidelines (accessed on 30 January 2022).
- Mohan, T.; Kargl, R.; Doliška, A.; Vesel, A.; Köstler, S.; Ribitsch, V.; Stana-Kleinschek, K. Wettability and surface composition of partly and fully regenerated cellulose thin films from trimethylsilyl cellulose. J. Colloid Interface Sci. 2011, 358, 604–610. [Google Scholar] [CrossRef] [PubMed]
- Moulder, J.F.; Stickle, W.F.; Sobol, P.E.; Bomben, K.D. Handbook of X-ray Photoelectron Spectroscopy: A Reference Book of Standard Spectra for Identification and Interpretation of XPS Data; Chastain, J., Jr., Ed.; Physical Electronics: Chanhassen, MN, USA, 1995; Available online: https://search.library.wisc.edu/catalog/999931119402121 (accessed on 30 January 2022).
- Serra, J.; González, P.; Liste, S.; Serra, C.; Chiussi, S.; León, B.; Pérez-Amor, M.; Ylänen, H.; Hupa, M. FTIR and XPS studies of bioactive silica based glasses. J. Non Cryst. Solids 2003, 332, 20–27. [Google Scholar] [CrossRef]
- Capeletti, L.B.; Zimnoch, J.H. Fourier Transform Infrared and Raman Characterization of Silica-Based Materials. In Applications of Molecular Spectroscopy to Current Research in the Chemical and Biological Sciences; InTech: London, UK, 2016. [Google Scholar] [CrossRef]
- Li, Y.-S.; Wang, Y.; Ceesay, S. Vibrational spectra of phenyltriethoxysilane, phenyltrimethoxysilane and their sol–gels. Spectrochim. Acta A Mol. Biomol. Spectrosc. 2009, 1819, 71–1824. [Google Scholar] [CrossRef] [PubMed]
- Deng, X.M.; Castillo, E.J.; Anderson, J.M. Surface modification of soft contact lenses: Silanization, wettability and lysozyme adsorption studies. Biomaterials 1986, 7, 247–251. [Google Scholar] [CrossRef]
- Stuart, B.H. Infrared Spectroscopy: Fundamentals and Applications; John Wiley: Chichester, UK; Hoboken, NJ, USA, 2004; Available online: https://search.library.wisc.edu/catalog/999974109102121 (accessed on 30 January 2022).
- Nordin, N.; Ahmad, Z. Monitoring chemical changes on the surface of borosilicate glass covers during the silanisation process. J. Phys. Sci. 2015, 26, 11–22. [Google Scholar]
- Kangur, T.; Kiisk, V.; Loot, A.; Timusk, M.; Järvekülg, M. Optical functionality of micro- and nanostructured silica surfaces prepared by a sol-gel phase separation method. Thin Solid Films 2017, 622, 11–16. [Google Scholar] [CrossRef]


| Material | Method | Media | LOD (ppm) | Response Time (s) | Recovery Time (s) | Ref. |
|---|---|---|---|---|---|---|
| 3% Er-doped ZnO | Nebulizer spray | gas | 125 | 120 | 10 | [25] |
| CA matrix | Spin coating | gas | / | 1320 | 3600 | [6] |
| Sol-gel | coating | aqueous | 0.2 | 300 | / | [26] |
| WO3/Si; WO3/PS | spin coating | gas | / | 16.1; 14.1 | 19.7; 19.2 | [27] |
| 1D supramolecular nanofibres | drop-casting | humidity | <1 ppb | 2.05 | 2.25 | [28] |
| Pani-SnO2 Nanocomposite | Spin coating | gas | / | 12–15 | 80 | [29] |
| Sol-gel | Spin coating | gas | 34 | <600 | 480 | [30] |
| α-Fe O2 3-ZnOsol-gel | Spin coating | gas | / | 20 | 20 | [31] |
| ZnO | Spray pyrolysis | gas | / | 20 | 25 | [32] |
| Sol-gel | Spray coating | aqueous | 0.1 | 5 | 1500 | Present work |
| Samples | Water Contact Angles (˚) |
|---|---|
| Glass | 21.19 ± 0.63 |
| Sensor_SC | 79.84 ± 1.41 |
| Sensor_IP | 83.69 ± 2.46 |
| Sensor_SP | 80.06 ± 1.36 |
| Samples | Atomic Proportion (at. %) of Surface Composition | |||
|---|---|---|---|---|
| C | O | Si | O/C | |
| Glass | 47.4 | 34.8 | 15.2 | 0.73 |
| Sensor_SC | 63.5 | 22.4 | 14.1 | 0.35 |
| Sensor_IP | 61.6 | 24.1 | 14.2 | 0.39 |
| Sensor_SP | 64.6 | 22.5 | 12.8 | 0.35 |
| Samples | C1 (%) C-C; C-H | C2 (%) C-O; C-OH; C-Si | C4 (%) O-C=O |
|---|---|---|---|
| Glass | 88.5 | 6.9 | 4.6 |
| Sensor_SC | 91.0 | 9.0 | 0 |
| Sensor_IP | 93.2 | 6.8 | 0 |
| Sensor_SP | 91.2 | 8.8 | 0 |
| SC_Sensor | IP_Sensor | SP_Sensor | ||||
|---|---|---|---|---|---|---|
| dEab* | Colour | dEab* | Colour | dEab* | Colour | |
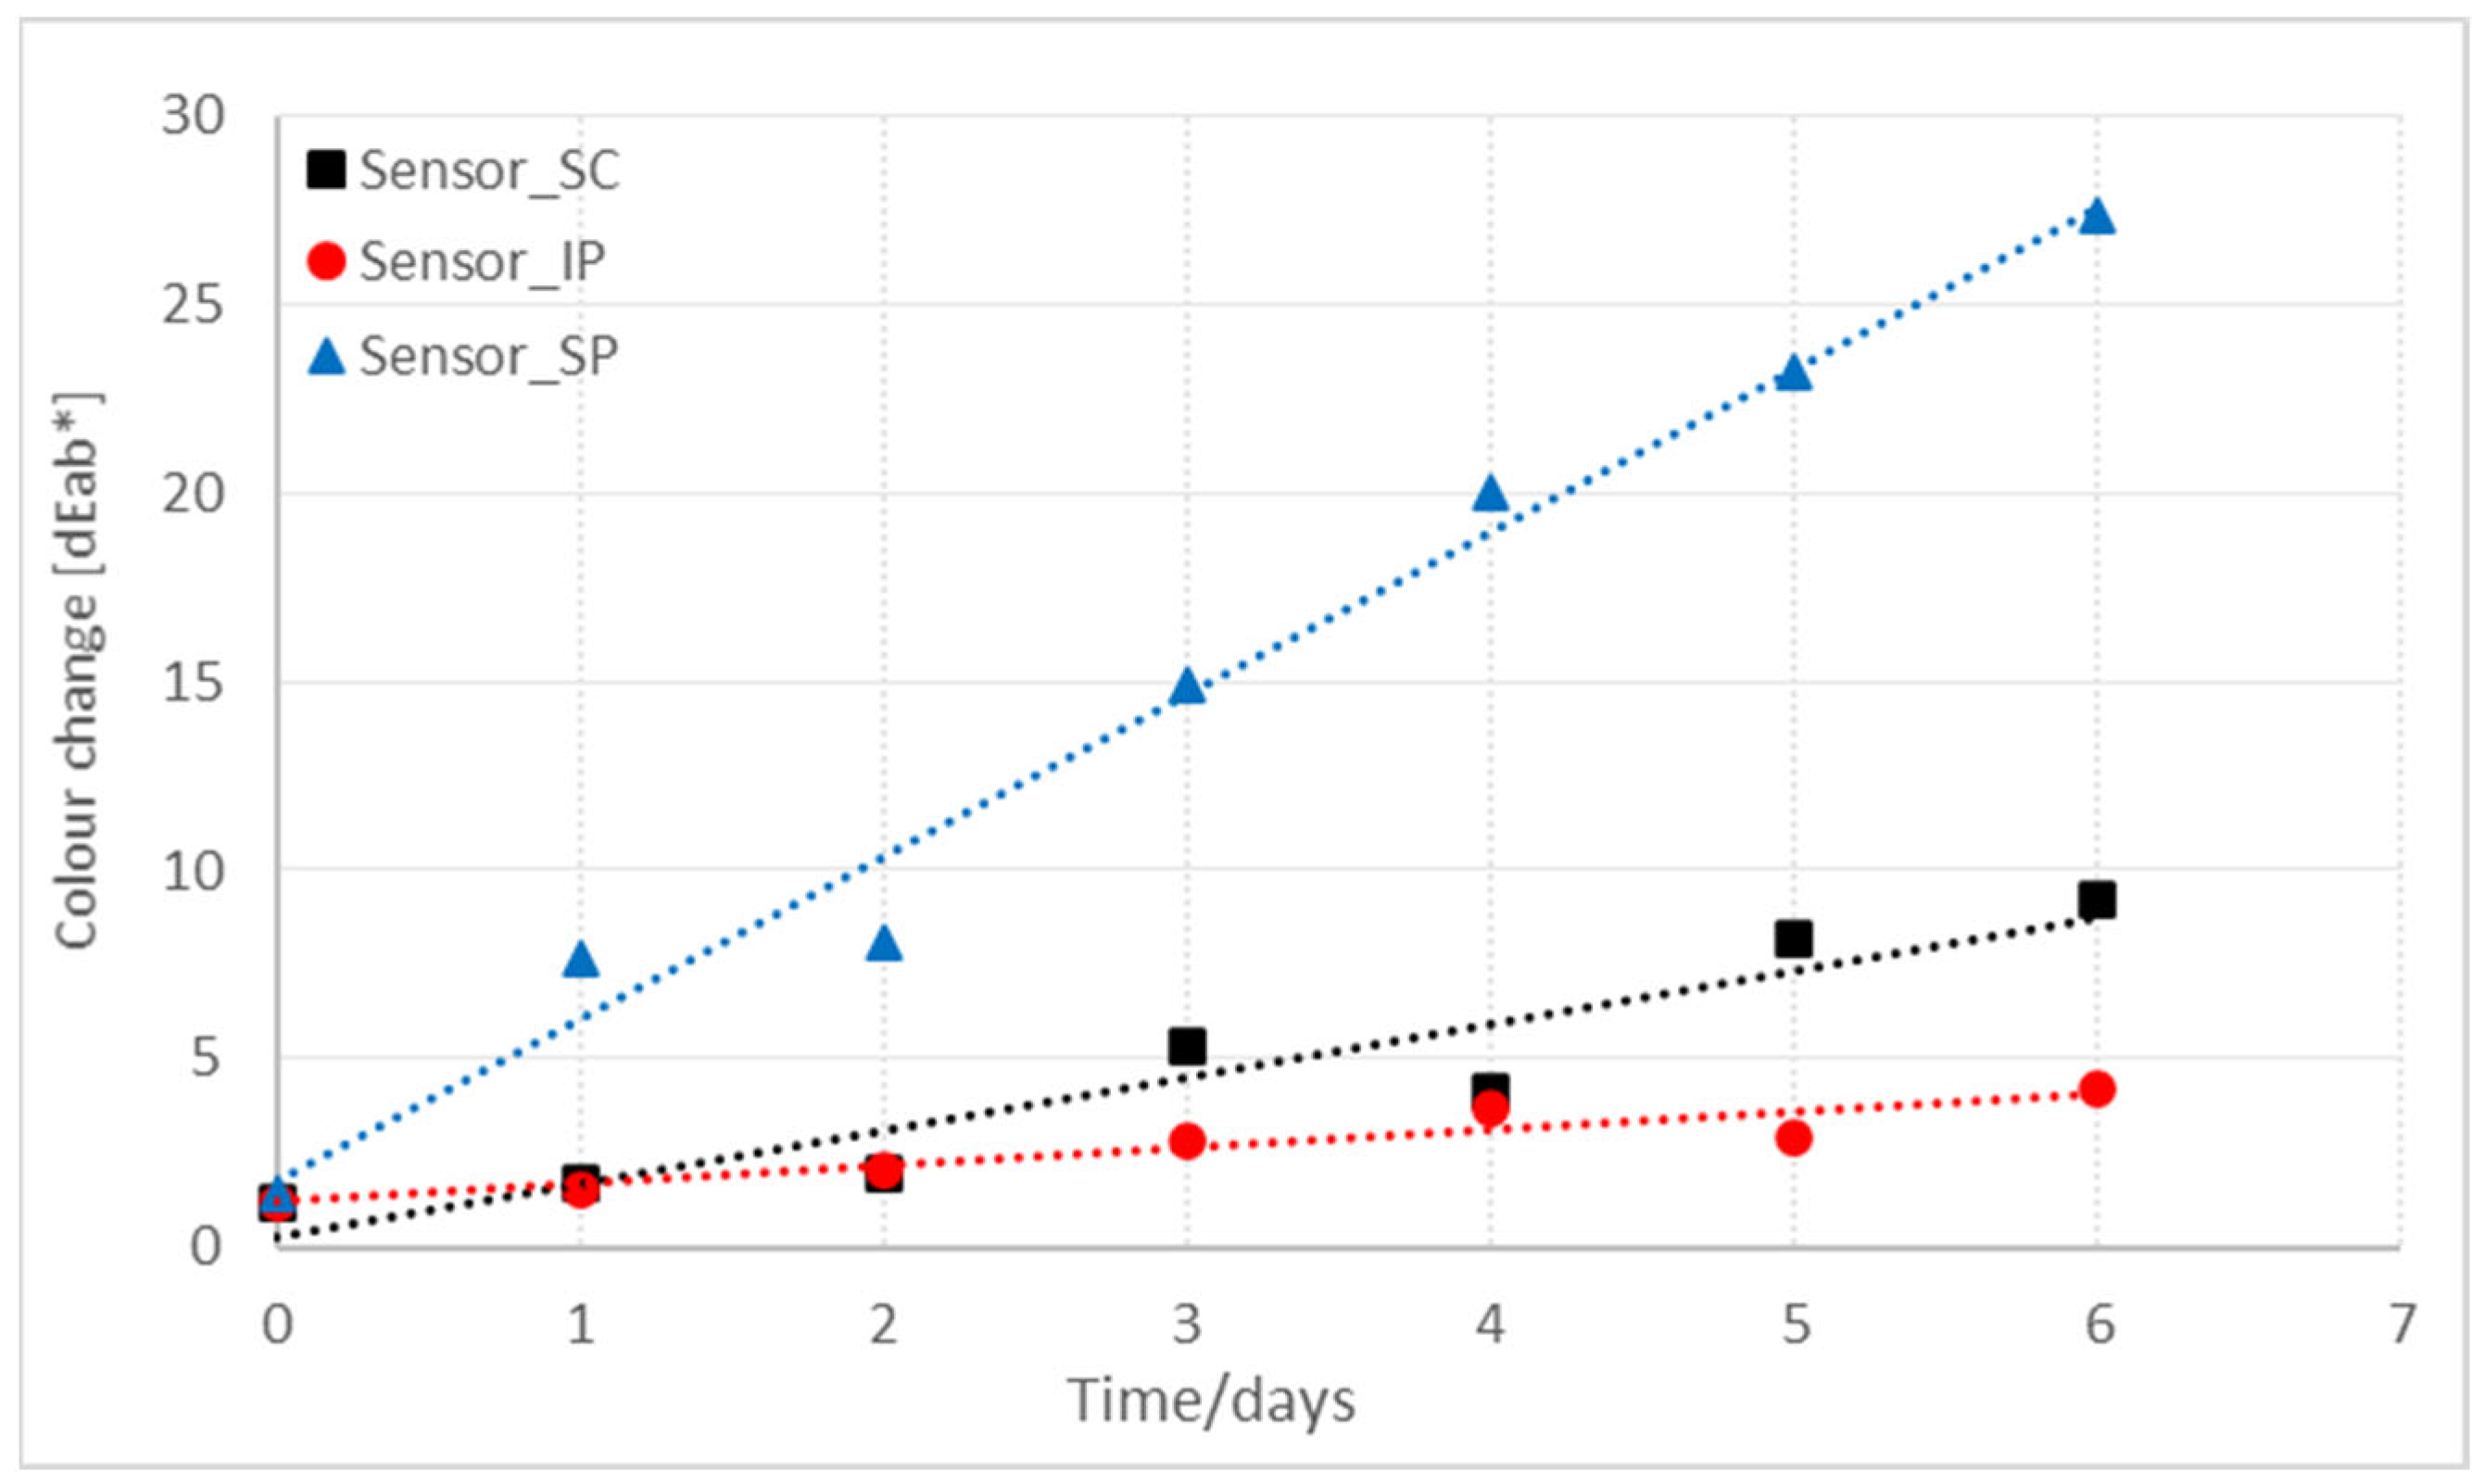
| Day 0 | 1.13 |  | 1.19 |  | 1.46 |  |
| Day 1 | 1.69 |  | 1.53 |  | 7.7 |  |
| Day 2 | 1.93 |  | 2.03 |  | 8.12 |  |
| Day 3 | 5.3 |  | 2.8 |  | 14.9 |  |
| Day 4 | 4.07 |  | 3.66 |  | 20 |  |
| Day 5 | 8.14 |  | 2.92 |  | 23.27 |  |
| Day 6 | 9.25 |  | 4.17 |  | 27.38 |  |
Disclaimer/Publisher’s Note: The statements, opinions and data contained in all publications are solely those of the individual author(s) and contributor(s) and not of MDPI and/or the editor(s). MDPI and/or the editor(s) disclaim responsibility for any injury to people or property resulting from any ideas, methods, instructions or products referred to in the content. |
© 2023 by the authors. Licensee MDPI, Basel, Switzerland. This article is an open access article distributed under the terms and conditions of the Creative Commons Attribution (CC BY) license (https://creativecommons.org/licenses/by/4.0/).
Share and Cite
Dimitrušev, N.; Nedeljko, P.; Mabes Raj, A.F.P.A.; Lobnik, A. Comparison of Surface and Spectral Properties of Optical Sensor Layers Prepared by Spin/Spray Coating and Printing Techniques. Chemosensors 2023, 11, 136. https://doi.org/10.3390/chemosensors11020136
Dimitrušev N, Nedeljko P, Mabes Raj AFPA, Lobnik A. Comparison of Surface and Spectral Properties of Optical Sensor Layers Prepared by Spin/Spray Coating and Printing Techniques. Chemosensors. 2023; 11(2):136. https://doi.org/10.3390/chemosensors11020136
Chicago/Turabian StyleDimitrušev, Nena, Polonca Nedeljko, A. F. P. Allwin Mabes Raj, and Aleksandra Lobnik. 2023. "Comparison of Surface and Spectral Properties of Optical Sensor Layers Prepared by Spin/Spray Coating and Printing Techniques" Chemosensors 11, no. 2: 136. https://doi.org/10.3390/chemosensors11020136