Communication

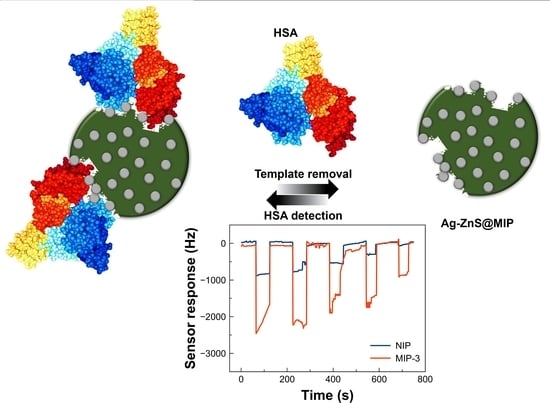
Ag-ZnS Embedded Polymeric Receptors for the Recognition of Human Serum Albumin

1
School of Chemistry, University of the Punjab, Quaid-i-Azam Campus, Lahore 54590, Pakistan
2
Interdisciplinary Research Centre for Biomedical Materials, COMSATS University Islamabad, Lahore Campus, Defense Road, Off. Raiwind Road, Lahore 54000, Pakistan
3
Department of Chemistry, University of Agriculture, Faisalabad 38000, Pakistan
4
Department of Chemistry, College of Science, University of Hafr Al Batin, P.O. Box 1803, Hafr Al Batin 39524, Saudi Arabia
5
Department of Applied Chemistry, Government College University, Faisalabad 38000, Pakistan
*
Author to whom correspondence should be addressed.
Chemosensors 2023, 11(4), 240; https://doi.org/10.3390/chemosensors11040240
Submission received: 9 December 2022 / Revised: 3 April 2023 / Accepted: 5 April 2023 / Published: 12 April 2023
(This article belongs to the Section Nanostructures for Chemical Sensing)

Abstract

:
The detection of human serum albumin (HSA) is of significant clinical importance in disease diagnoses. In this work, polymer-based synthetic receptors are designed by incorporating Ag-ZnS microspheres in molecularly imprinted poly(methacrylic acid-co-ethylene glycol dimethacrylate) (MIPs) for the gravimetric detection of HSA. Among different compositions of Ag-ZnS@MIPs, MIPs having methacrylic acid and ethylene glycol dimethacrylate volume ratio of 3:2 exhibit enhanced HSA sensitivity in the concentration range of 5–200 ng/mL. A remarkably low threshold limit of detection (LOD = 0.364 ng/mL) is achieved with quartz crystal microbalance (QCM) based gravimetric sensors. Furthermore, the Ag-ZnS@MIPs/QCM sensors show high selectivity for HSA compared to other proteins, e.g., bovine serum albumin (BSA), glycoprotein, ribonuclease, and lysozyme. Hence, the gravimetric quantification of HSA realizes a highly sensitive, selective, and label-free detection mechanism with a limit of quantification down to 1.1 ng/mL.

Graphical Abstract

1. Introduction

Human serum albumin (HSA) is versatile and is the most abundant protein, constituting almost 60% of the total protein present in the blood plasma of a healthy individual [1]. HSA is synthesized completely in the liver [2], and it comprises a single chain of non-glycosylated polypeptides with a molecular weight of about 66 kDa and 35 cysteine units that form disulfide linkage and stabilize HSA shape [3]. HSA is responsible for many functions in the human body, such as maintenance of oncotic pressure, prevention of folic acid photo-degradation, transportation of unconjugated bilirubin, thyroid hormones, fatty acids, and many drugs [4,5,6].
The exact concentration of HSA in blood plasma is 3.5–5.0 g/dL, and its abnormal concentration indicates multiple myeloma and many heart diseases [7]. A low level of HSA in plasma shows up as cirrhosis, cancer, liver failure, and chronic hepatitis. A moderate level of HSA (30–300 µg/mL) in the urea causes kidney failure due to an increase in concentrations of albuminuria, mostly resulting from hypertension and diabetes [8].
From this perspective, it is important to develop a simple and reliable method for the accurate detection of HSA in clinical diagnoses [9]. Smart chemical sensors with functionalized receptor surfaces are widely reported for the detection of various bio-analytes, including HSA [10,11,12,13]. Nevertheless, the synthesis of receptor surfaces that have a tailored functionality for the selective recognition of target analyte is a challenging task.
To attain good sensitivity and selectivity, several bioactive materials including aptamers [14,15], antibodies [16,17,18], and enzymes [19,20] have been used widely to develop efficient sensor coatings. However, there are certain limitations in using these biomolecules, such as increased processing cost, involvement of living animals, difficult purification steps, and a requirement of special conditions for storage.
Molecular imprinting [21,22] is a generic approach for the generation of tailor-made highly selective recognition coatings for a target analyte, e.g., proteins and biomarkers [23,24], and molecularly imprinted polymers (MIPs) possess several advantages over their natural competitors. The facile synthesis, low production cost, long-term stability, and ability to integrate with different transducers are some of the promising features of MIPs. For instance, MIPs have been designed as efficient sensing platforms for label-free detection, extraction, and delivery of different analytes [25,26,27,28,29,30].
Recently, ZnS-based materials [31] have gained increasing attention due to their remarkable properties that can be utilized in different fields including biosensors [32,33], electroluminescence [34,35], electro-catalysts [36,37], and field emitters [38]. The doping of Ag in various metal sulfide nanostructures has been reported in recent studies to further tune these properties for a variety of applications [39,40]. From a typical sensing perspective, Ag could interact with amino acids of the target proteins through electrostatic interactions [41]; thus, it could be utilized for improved recognition of proteins. These functionalized materials have found many applications in different fields ranging from bio-labeling to bio-sensing.
Keeping in view the characteristic properties of Ag-ZnS and MIPs, in the present research, Ag-doped ZnS particles are embedded in poly(methacrylic acid-co-ethylene glycol dimethacrylate) for developing highly sensitive and selective recognition coatings for HSA detection. The MIP formulation, including the monomer-crosslinker ratio, is optimized to achieve enhanced sensor response. For label-free sensing of HSA, Ag-ZnS@MIP coating is integrated with the QCM chip. The fabricated Ag-ZnS@MIP QCM sensor has demonstrated appreciably high sensitivity and selectivity for HSA recognition at extremely low concentrations, thereby showing its potential for clinical diagnosis and other related applications.

2. Materials and Methods

2.1. Chemicals and Reagents

Methacrylic acid (MAA), ethylene glycol dimethacrylate (EGDMA), and zinc acetate dihydrate were obtained from Daejung chemicals. The free radical initiator IRGACURE blend was purchased from Uni-chem. Human serum albumin (HSA), α1-acid glycoprotein, bovine serum albumin (BSA), lysozyme, chymotrypsin, ribonuclease, and silver nitrate were purchased from Sigma-Aldrich. Thiourea was obtained from Merck. Phosphate buffer saline (PBS) of pH 7.4 was prepared by dissolving PBS tablets in deionized water from Elga Pure lab water deionizer. All the solvents used during the experiments were of analytical grade and used as received.

2.2. Synthesis of Ag-ZnS Microspheres

The synthesis of Ag-ZnS microspheres was carried out following the already reported method [42,43]. Briefly, the aqueous solutions of 0.1 M zinc acetate dihydrate and 0.1 M silver nitrate of equal volumes were mixed and subjected to continuous magnetic stirring. Separately, 0.1 M thiourea solution was added to the above mixture. The resulting solution was shifted in an autoclave and heated at 180 °C for 12 h. The as-prepared Ag-ZnS microspheres were separated and washed with distilled water and ethanol, and then dried in an oven for further use.

2.3. Synthesis of HSA-Imprinted Polymer

Figure 1 shows a schematic for the synthesis of Ag-ZnS incorporated, HSA-imprinted polymer. For the synthesis of HSA-imprinted polymer, 45 µL of MAA was mixed along with 14 µL of HSA solution taken from a stock of 5 mg/mL. A total of 30 µL of EGDMA and 114 µL of ethanol were then added to the above solution and subjected to magnetic stirring. A total of 100 µL of Ag-ZnS suspension was then taken from a stock of 4 mg/mL and was added to the above mixture. To initiate polymerization, a 2 µL IRGACURE blend was added to the mixture and sonicated for 20 min. Immediately, 3.5 µL of aliquot was applied to a gold electrode of the QCM chip and subjected to the spin coater. After spin coating, the QCM was placed on a clean, dry glass slide and irradiated with a UV lamp at 328 nm to polymerize the layer. After photo-polymerization, the MIP film was formed on a gold electrode that had HSA embedded in it. To remove the template from the MIP layer, the QCM chip was immersed in 70 µL of 20% methanol for 20 min.
The non-imprinted polymer or control was synthesized following the same procedure as for MIP without adding has, and it was coated on a separate QCM under the same conditions. To optimize MIP composition and achieve optimum sensor response, the amounts of monomer (MAA) and crosslinker (EGDMA) were varied to synthesize different combinations while keeping the amounts of HSA and Ag-ZnS microspheres constant. The developed formulations are listed in Table 1. These MIP formulations were fabricated with separate QCM chips and assessed for their respective sensor shifts on exposing standard HSA solutions.

2.4. Materials Characterization

The functionality of as-prepared Ag doped ZnS was examined by Fourier transform infrared (FTIR) spectroscopy using Thermo Fisher Scientific, Nicolet 6700 spectrophotometer that has an attenuated total reflectance (ATR) mode in the range of 4000–600 cm−1. The as-prepared Ag doped ZnS particles were characterized by an X-ray powder diffraction (XRD) pattern that was recorded in the range of 10–80° (2θ) using Cu Kα radiation from a PANalytical X’pert powder diffractometer with diffractive beam operated at 100 mA and 40 kV. To develop thin films of Ag-ZnS@MIP composite, a vacuum spin coater from MTI Corporation was used. The UV curing machine from Heraeus Noblelight America LLC was used for initiating photo-polymerization at 328 nm.

2.5. Quartz Crystal Microbalance (QCM) Setup

For gravimetric measurements, the AT-cut quartz crystal microbalance (QCM) with a frequency of 5 MHz with a diameter of 2.54 cm that had gold electrodes on both sides was purchased from Stanford Research System (Sunnyvale, CA, USA). Before coating MIP/NIP layers on QCM, the bare gold electrode was washed with 1N NaOH and 1N HCl, respectively, for 10 min each. After that, it was rinsed thoroughly with distilled water and dried at 60 °C. The layer-coated QCM chip was placed in a crystal holder and fixed by two O-rings to ensure contact between one side of the gold electrode and the testing solution.

2.6. Sensor Measurements

For measuring sensor shifts resulting from Ag-ZnS@MIP and Ag-ZnS@NIP coated QCM sensors, six different concentrations of HSA were prepared in phosphate buffer solution (7.4 pH, 10 mM) ranging from 5 ng/mL to 200 ng/mL. The Ag-ZnS@MIP and Ag-ZnS@NIP coated QCMs were transferred to the QCM200, set up one-by-one, and fitted in the chip holder for mass-sensitive measurements, respectively. After the removal of the template, the chip was again inserted into the crystal holder, and frequency change was noted. Before evaluating each analyte concentration, the QCM chip was immersed in PBS to stabilize the baseline frequency. After about 10 min, a stable baseline was recorded.
For evaluating the selectivity of Ag-ZnS@MIP coated QCM, the sensor was exposed to bovine serum albumin (BSA), α1-acid glycoprotein, lysozyme, chymotrypsin, and ribonuclease separately, and their responses were compared with sensor shifts for HSA. The tested concentration for each analyte was 200 ng/mL prepared in PBS of 7.4 pH. Both Ag-ZnS@MIP and Ag-ZnS@NIP sensors were subjected to the same concentrations of analytes.

3. Results and Discussion

3.1. Characterizations

The as-prepared Ag-ZnS microspheres are characterized by XRD as shown in Figure 2a. XRD of Ag-ZnS exhibited sharp peaks, which are suitably matched with the reference pattern of cubic (F-43m) ZnS (JCPDS 1-080-0020) [42]. The diffraction peaks for cubic ZnS are observed around 29°, 48°, and 57°, corresponding to (111), (220), and (311) planes, respectively [43]. It is reported that due to the addition of Ag in ZnS, these peaks become sharper. Moreover, XRD peaks for Ag were not observed, which could be due to its amorphous nature and the relatively lesser amount.
The FTIR spectrum of as-prepared Ag-ZnS microspheres was also recorded, as shown in Figure 2b. A sharp peak can be observed around 3620 cm−1, which could be assigned to stretching vibrations of the O-H groups resulting from absorbed moisture. A weak peak around 1540 cm−1 may indicate -NH bending vibrations of residual free amines. A sharp peak around 669 cm−1 suggests Zn-S vibrations [44]. The shifting of the Zn-S peak from the literature value of 617 cm−1 to 669 cm−1 could be due to the difference in particle size and morphology [45].
Figure 3a shows a typical micrograph of sensor coatings containing Ag-ZnS microspheres embedded in the MIP receptor layer. The surface profiles of the coating are shown in Figure 3b. The surface of the layer exhibits the presence of micro-sized Ag-ZnS spheres with diameters in the range of 1.5–2.5 µm. The microspheres are uniformly dispersed on the surface.

3.2. Optimization of MIP Formulations

To achieve enhanced sensor shifts for HSA, four different Ag-ZnS@MIP compositions that had variable amounts of monomer and cross-linker were synthesized and tested. As shown in Table 1, volumes of MAA and EGDMA are varied, whereas the amounts of HSA, Ag-ZnS microspheres, and initiator are kept constant. The as-synthesized four Ag-ZnS@MIP formulations, i.e., MIP-1, MIP-2, MIP-3, and MIP-4, are coated on four different QCMs under the same conditions. Their respective sensor shifts on exposure to equal concentrations of HSA are recorded and shown in Figure 4. It can be observed that MIP-1 coated QCM has resulted in an average sensor response of 2.1 kHz, whereas MIP-2 has about 2.5 kHz sensor response showing unstable analyte-layer saturation, which could be due to the stability of sensor coating or inadequate analyte-layer interactions. MIP-3-coated QCM exhibited the highest sensor shift of 3.8 kHz while MIP-4-coated QCM yielded a 1.5 kHz response.
The data suggest that the MIP-3 sensor layer composition is optimal as it demonstrated the highest sensor response among four MIP formulations. To calculate the imprinting factor, the sensor shifts of all MIP-coated devices i.e., MIP-1, MIP-2, MIP-3, and MIP-4 are divided with their corresponding NIP layers and shown in Figure 5. The relative sensor shifts of all the MIP and NIP layers are also shown in Figure 5. It can be seen here that MIP-1 has an imprinting factor of 5.4 whereas MIP-3 coating possesses an imprinting factor of about 5. There is not much difference in values of the imprinting factor of MIP-1 and MIP-3, although MIP-3 demonstrated the highest sensor shift, and, thus, for further sensor measurements, the MIP-3 formulation was selected.

3.3. Sensor Measurements

3.3.1. Sensor Response and Sensitivity

The sensor shifts of Ag-ZnS@MIP and Ag-ZnS@NIP coated QCM devices on exposing different HSA concentrations ranging from 5 to 200 ng/mL are shown in Figure 6a. It can be noticed that the drop in frequency of Ag-ZnS@MIP coated QCM for 200 ng/mL of HSA is about 2410 Hz, while for Ag-ZnS@NIP, the drop in frequency is 940 Hz. The appreciably higher sensor shifts of the MIP layer are attributed to tailored affinity sites for has recognition, which are generated by the molecular imprinting process. It is proposed that the optimized amounts of MAA and EGDMA for MIP formation could yield geometrically and chemically adapted interaction sites for HSA recognition through a range of non-covalent interactions. Moreover, the incorporation of Ag-ZnS microspheres in MIP coating could also contribute to increased sensor shifts for HSA sensing. The sensor shifts resulting from the NIP layer could only be due to the non-specific binding interactions between polymer surface and analyte molecules, and, thus, NIP coatings could be taken as control.
On further testing of the lower concentrations of HSA, the sensor shifts by the Ag-ZnS@MIP layer remain significantly higher than Ag-ZnS@NIP. The lowest tested concentration was 5 ng/mL of HSA where the response of the Ag-ZnS@MIP layer was 1030 Hz and 110 Hz for Ag-ZnS@NIP. To compare the relative sensitivities of Ag-ZnS@MIP and Ag-ZnS@NIP coatings, their average sensor responses at all concentrations are shown in Figure 6b. Here, the slopes of Ag-ZnS@MIP and Ag-ZnS@NIP curves represent their respective sensitivities. From this graph, it can be observed that the sensitivity of the Ag-ZnS@MIP curve is 6.62 Hz/ng/mL, having an R2 value of 0.95; while for Ag-ZnS@NIP, the slope is 4.30 Hz/ng/mL and R2 is 0.99. This demonstrates that the sensitivity of Ag-ZnS@MIP coated QCM for HSA sensing is appreciably higher than Ag-ZnS@NIP.
The limit of detection (LOD) of the Ag-ZnS@MIP-based HSA sensor was calculated from the slope (S = 6.6207 Hz/ng/mL) and standard deviation (σ = 0.9157 Hz/ng/mL) of the respective calibration plot using the formula: (LOD = 3.3 σ/S), as reported earlier [46,47,48], and is found to be 0.456 ng/mL. This is well below the reported values for HSA sensors, as compared below in Table 2. Similarly, the limit of quantification (LOQ = 10 σ/S) is calculated to be 1.38 ng/mL.

3.3.2. Sensor Selectivity and Stability

The selectivity of Ag-ZnS@MIP coated QCM is evaluated by exposing the sensor surface to other proteins and enzymes under the same conditions. Figure 7a compares the frequency shifts of Ag-ZnS@MIP and Ag-ZnS@NIP coated devices for HSA, BSA, glycoprotein, chymotrypsin, ribonuclease, and lysozyme. All the analytes were evaluated at equal concentrations, i.e., 200 ng/mL, and their solutions were made in a PBS of pH 7.4. As shown in Figure 7, the sensor shift of Ag-ZnS@MIP for HSA is higher than all the tested analytes. Despite the close resemblance in molecular weights and structures of HSA and BSA, the sensor shifts for HSA are significantly higher than for BSA.
Moreover, the differential response of Ag-ZnS@MIP and Ag-ZnS@NIP layers for HSA is even more improved for HSA than for BSA. For the other tested analytes such as glycoprotein, chymotrypsin, ribonuclease, and lysozyme, the sensor response of the Ag-ZnS@MIP layer is much lower for these compounds than HSA. The Ag-ZnS@NIP layer did not show much differentiation for these analytes, though.
Figure 7b shows the repeatability of measurements and the sensor’s stability over a period of 3 weeks. When the same sensor is exposed to the same concentration (i.e., 200 ng/mL) of HSA for 3 weeks, it reveals a consistent response without any significant loss in sensor response. The overall loss in sensor response is 4.7% only, which exhibits the robustness and stability of the MIP coatings and the HSA sensors. Thus, Ag-ZnS@MIP sensor coatings are highly selective for HSA recognition due to the presence of tailored analyte-analogous interaction sites.

3.3.3. Sensor’s Performance Comparison

The performance of the Ag-ZnS@MIP sensor is compared with some of the already reported sensing technologies for HSA detection in terms of detection range and limit of detection (LOD). Table 2 summarizes a general comparison of various HSA sensors. From Table 2, it can be observed that the designed sensor set-up demonstrates a suitable linear working range and an exceptionally low detection limit, i.e., 0.364 ng/mL, compared to other methods reported for HSA detection in the literature.

4. Conclusions

The incorporation of Ag-ZnS microspheres in MIP results in highly sensitive sensor coatings for HSA detection. The optimized amounts of monomer and cross-linker for MIP formation is a rational approach to enhance the sensitivity. The combination of Ag-ZnS@MIP with QCM has lead us to develop a highly efficient sensing platform for HSA detection down to 5 ng/mL. Moreover, the designed sensor setup is highly selective for HSA recognition when evaluated against related proteins and enzymes. In general, the simple synthesis of sensor coating and label-free transduction by the QCM chip has the potential to utilize this setup for ultrasensitive detection of HSA in complex mixtures, thereby finding applications in clinical diagnostics.

Author Contributions

Conceptualization, A.A. (Asghar Ali), A.M. and U.L.; methodology, A.N., M.Z. and M.N.A.; validation, A.N., M.Z. and M.N.A.; formal analysis, T.H. and M.I.D.; investigation, A.N., M.Z. and M.N.A.; resources, A.M. and U.L.; data curation, A.A. (Asghar Ali), A.M. and A.A. (Adeel Afzal); writing—original draft preparation, A.N., A.M. and A.A. (Adeel Afzal); writing—review and editing, A.M., U.L. and A.A. (Adeel Afzal); visualization, T.H. and M.I.D.; supervision, A.M. and U.L.; project administration, A.A. (Asghar Ali), A.M. and U.L.; funding acquisition, A.A. (Asghar Ali) and A.M. All authors have read and agreed to the published version of the manuscript.

Funding

This research was funded by the Ministry of Education and the University of Hafr Al Batin, Saudi Arabia, grant number IFP-A-2022-2-3-13.

Institutional Review Board Statement

Not applicable.

Informed Consent Statement

Not applicable.

Data Availability Statement

The data presented in this study are available in the article.

Acknowledgments

This research work was funded by institutional fund projects under No. IFP-A-2022-2-3-13. Therefore, the authors gratefully acknowledge the technical and financial support from the Ministry of Education and the University of Hafr Al Batin, Hafr Al Batin, Saudi Arabia.

Conflicts of Interest

The authors declare no conflict of interest.

References

  1. Wang, R.E.; Tian, L.; Chang, Y.-H. A Homogeneous Fluorescent Sensor for Human Serum Albumin. J. Pharm. Biomed. Anal. 2012, 63, 165–169. [Google Scholar] [CrossRef] [Green Version]
  2. Levitt, D.G.; Levitt, M.D. Human Serum Albumin Homeostasis: A New Look at the Roles of Synthesis, Catabolism, Renal and Gastrointestinal Excretion, and the Clinical Value of Serum Albumin Measurements. Int. J. Gen. Med. 2016, 9, 229–255. [Google Scholar] [CrossRef] [Green Version]
  3. Sugio, S.; Kashima, A.; Mochizuki, S.; Noda, M.; Kobayashi, K. Crystal Structure of Human Serum Albumin at 2.5 Å Resolution. Protein Eng. Des. Sel. 1999, 12, 439–446. [Google Scholar] [CrossRef]
  4. Curry, S. Beyond Expansion: Structural Studies on the Transport Roles of Human Serum Albumin. Vox Sang. 2002, 83, 315–319. [Google Scholar] [CrossRef]
  5. Taverna, M.; Marie, A.-L.; Mira, J.-P.; Guidet, B. Specific Antioxidant Properties of Human Serum Albumin. Ann. Intensive Care 2013, 3, 4. [Google Scholar] [CrossRef] [Green Version]
  6. Rabbani, G.; Ahn, S.N. Review: Roles of Human Serum Albumin in Prediction, Diagnoses and Treatment of COVID-19. Int. J. Biol. Macromol. 2021, 193, 948–955. [Google Scholar] [CrossRef]
  7. Arques, S. Human Serum Albumin in Cardiovascular Diseases. Eur. J. Intern. Med. 2018, 52, 8–12. [Google Scholar] [CrossRef]
  8. Cieplak, M.; Szwabinska, K.; Sosnowska, M.; Chandra, B.K.C.; Borowicz, P.; Noworyta, K.; D’Souza, F.; Kutner, W. Selective Electrochemical Sensing of Human Serum Albumin by Semi-Covalent Molecular Imprinting. Biosens. Bioelectron. 2015, 74, 960–966. [Google Scholar] [CrossRef] [Green Version]
  9. Zheng, D.-J.; Xu, J.; Su, M.-M.; Sun, Z.-G.; Jiao, Q.-C.; Yang, Y.-S.; Zhu, H.-L. A Small, Steady, Rapid and Selective TICT Based Fluorescent HSA Sensor for Pre-Clinical Diagnosis. Sens. Actuators B Chem. 2018, 271, 82–89. [Google Scholar] [CrossRef]
  10. Ahn, Y.-H.; Lee, J.-S.; Chang, Y.-T. Selective Human Serum Albumin Sensor from the Screening of a Fluorescent Rosamine Library. J. Comb. Chem. 2008, 10, 376–380. [Google Scholar] [CrossRef]
  11. Ma, X.-T.; He, X.-W.; Li, W.-Y.; Zhang, Y.-K. Epitope Molecularly Imprinted Polymer Coated Quartz Crystal Microbalance Sensor for the Determination of Human Serum Albumin. Sens. Actuators B Chem. 2017, 246, 879–886. [Google Scholar] [CrossRef]
  12. Luo, Z.; Liu, B.; Zhu, K.; Huang, Y.; Pan, C.; Wang, B.; Wang, L. An Environment-Sensitive Fluorescent Probe for Quantification of Human Serum Albumin: Design, Sensing Mechanism, and Its Application in Clinical Diagnosis of Hypoalbuminemia. Dye. Pigment. 2018, 152, 60–66. [Google Scholar] [CrossRef]
  13. Yang, R.-J.; Tseng, C.-C.; Ju, W.-J.; Wang, H.-L.; Fu, L.-M. A Rapid Paper-Based Detection System for Determination of Human Serum Albumin Concentration. Chem. Eng. J. 2018, 352, 241–246. [Google Scholar] [CrossRef]
  14. Song, S.; Wang, L.; Li, J.; Fan, C.; Zhao, J. Aptamer-Based Biosensors. TrAC Trends Anal. Chem. 2008, 27, 108–117. [Google Scholar] [CrossRef]
  15. Zhou, W.; Jimmy Huang, P.-J.; Ding, J.; Liu, J. Aptamer-Based Biosensors for Biomedical Diagnostics. Analyst 2014, 139, 2627. [Google Scholar] [CrossRef] [Green Version]
  16. Sakti, S.P.; Hauptmann, P.; Zimmermann, B.; Bühling, F.; Ansorge, S. Disposable HSA QCM-Immunosensor for Practical Measurement in Liquid. Sens. Actuators B Chem. 2001, 78, 257–262. [Google Scholar] [CrossRef]
  17. Holford, T.R.J.; Davis, F.; Higson, S.P.J. Recent Trends in Antibody Based Sensors. Biosens. Bioelectron. 2012, 34, 12–24. [Google Scholar] [CrossRef]
  18. Omidfar, K.; Khorsand, F.; Darziani Azizi, M. New Analytical Applications of Gold Nanoparticles as Label in Antibody Based Sensors. Biosens. Bioelectron. 2013, 43, 336–347. [Google Scholar] [CrossRef]
  19. Bucur, B.; Munteanu, F.-D.; Marty, J.-L.; Vasilescu, A. Advances in Enzyme-Based Biosensors for Pesticide Detection. Biosensors 2018, 8, 27. [Google Scholar] [CrossRef] [Green Version]
  20. Kurbanoglu, S.; Erkmen, C.; Uslu, B. Frontiers in Electrochemical Enzyme Based Biosensors for Food and Drug Analysis. TrAC Trends Anal. Chem. 2020, 124, 115809. [Google Scholar] [CrossRef]
  21. Whitcombe, M.J.; Kirsch, N.; Nicholls, I.A. Molecular Imprinting Science and Technology: A Survey of the Literature for the Years 2004–2011. J. Mol. Recognit. 2014, 27, 297–401. [Google Scholar] [CrossRef] [PubMed] [Green Version]
  22. Chen, L.; Wang, X.; Lu, W.; Wu, X.; Li, J. Molecular Imprinting: Perspectives and Applications. Chem. Soc. Rev. 2016, 45, 2137–2211. [Google Scholar] [CrossRef] [PubMed]
  23. Nasrullah, A.; Afzal, A.; Mujahid, A.; Lieberzeit, P.A.; Bajwa, S.Z.; Mustafa, G.; Latif, U. Imprinted Polymer and Cu2O-Graphene Oxide Nanocomposite for the Detection of Disease Biomarkers. Meas. Sci. Technol. 2021, 32, 105111. [Google Scholar] [CrossRef]
  24. Nasrullah, A.; Roshan, S.; Latif, U.; Mujahid, A.; Mustafa, G.; Bajwa, S.Z.; Afzal, A. ZnO Nanoparticles and β-Cyclodextrin Containing Molecularly Imprinted Polymers for Gravimetric Sensing of Very-Low-Density Lipoprotein. Meas. Sci. Technol. 2022, 33, 045106. [Google Scholar] [CrossRef]
  25. Mujahid, A.; Mustafa, G.; Dickert, F. Label-Free Bioanalyte Detection from Nanometer to Micrometer Dimensions—Molecular Imprinting and QCMs †. Biosensors 2018, 8, 52. [Google Scholar] [CrossRef] [Green Version]
  26. Omidvar, A.H.; Amanati Shahri, A.; Serrano, A.L.C.; Gruber, J.; Pamplona Rehder, G. A Highly Sensitive Molecularly Imprinted Polymer (MIP)-Coated Microwave Glucose Sensor. Sensors 2022, 22, 8648. [Google Scholar] [CrossRef]
  27. Bajaber, M.A.; Kamel, A.H. All-Solid State Potentiometric Sensors for Desvenlafaxine Detection Using Biomimetic Imprinted Polymers as Recognition Receptors. Polymers 2022, 14, 4814. [Google Scholar] [CrossRef]
  28. Olivares Moreno, C.A.; Altintas, Z. Bioselective PES Membranes Based on Chitosan Functionalization and Virus-Imprinted NanoMIPs for Highly Efficient Separation of Human Pathogenic Viruses from Water. Membranes 2022, 12, 1117. [Google Scholar] [CrossRef]
  29. Wang, Y.; Shi, H.; Sun, J.; Xu, J.; Yang, M.; Yu, J. Hollow-Channel Paper Analytical Devices Supported Biofuel Cell-Based Self-Powered Molecularly Imprinted Polymer Sensor for Pesticide Detection. Biosensors 2022, 12, 974. [Google Scholar] [CrossRef]
  30. Liu, L.; Zhou, M.; Pan, J. Composite Hydrogel Microspheres Encapsulating Hollow Mesoporous Imprinted Nanoparticles for Selective Capture and Separation of 2′-Deoxyadenosine. Molecules 2022, 27, 7444. [Google Scholar] [CrossRef]
  31. Nanda, J.; Sapra, S.; Sarma, D.D.; Chandrasekharan, N.; Hodes, G. Size-Selected Zinc Sulfide Nanocrystallites: Synthesis, Structure, and Optical Studies. Chem. Mater. 2000, 12, 1018–1024. [Google Scholar] [CrossRef]
  32. Zhang, F.; Li, C.; Li, X.; Wang, X.; Wan, Q.; Xian, Y.; Jin, L.; Yamamoto, K. ZnS Quantum Dots Derived a Reagentless Uric Acid Biosensor. Talanta 2006, 68, 1353–1358. [Google Scholar] [CrossRef] [PubMed]
  33. Karki, B.; Uniyal, A.; Chauhan, B.; Pal, A. Sensitivity Enhancement of a Graphene, Zinc Sulfide-Based Surface Plasmon Resonance Biosensor with an Ag Metal Configuration in the Visible Region. J. Comput. Electron. 2022, 21, 445–452. [Google Scholar] [CrossRef]
  34. Cheng, Q.; Wang, Y.; Su, L.; Wang, H.; Zhu, G.; Yu, W. Wide-Spectrum Manipulation of Triboelectrification-Induced Electroluminescence by Long Afterglow Phosphors in Elastomeric Zinc Sulfide Composites. J. Mater. Chem. C 2019, 7, 4567–4572. [Google Scholar] [CrossRef]
  35. Lee, W.; Lyu, H.-K.; Cho, H.-S.; Lee, S.E.; Choi, B. Brightness Enhancement of a Direct-Current-Driven Electroluminescent Device Prepared with Zinc-Sulfide Powder. J. Lumin. 2020, 220, 117015. [Google Scholar] [CrossRef]
  36. Baniasadi, E.; Dincer, I.; Naterer, G.F. Hybrid Photocatalytic Water Splitting for an Expanded Range of the Solar Spectrum with Cadmium Sulfide and Zinc Sulfide Catalysts. Appl. Catal. A Gen. 2013, 455, 25–31. [Google Scholar] [CrossRef]
  37. Azarang, M.; Sookhakian, M.; Aliahmad, M.; Dorraj, M.; Basirun, W.J.; Goh, B.T.; Alias, Y. Nitrogen-Doped Graphene-Supported Zinc Sulfide Nanorods as Efficient Pt-Free for Visible-Light Photocatalytic Hydrogen Production. Int. J. Hydrog. Energy 2018, 43, 14905–14914. [Google Scholar] [CrossRef]
  38. Chen, Z.-G.; Cheng, L.; Zou, J.; Yao, X.; (Max) Lu, G.Q.; Cheng, H.-M. Zinc Sulfide Nanowire Arrays on Silicon Wafers for Field Emitters. Nanotechnology 2010, 21, 065701. [Google Scholar] [CrossRef]
  39. Khalil, A.A.I.; Abd El-Gawad, A.-S.H.M.; Gadallah, A.-S. Impact of Silver Dopants on Structural, Morphological, Optical, and Electrical Properties of Copper-Zinc Sulfide Thin Films Prepared via Sol-Gel Spin Coating Method. Opt. Mater. 2020, 109, 110250. [Google Scholar] [CrossRef]
  40. Abd El-Gawad, A.H.M.; Khalil, A.A.I.; Gadallah, A.-S. Influence of Preparation Conditions on the Properties of Silver Doped Copper-Zinc Sulfide Thin Films Prepared via Sol-Gel Spin Coating Technique. Optik 2020, 223, 165561. [Google Scholar] [CrossRef]
  41. Buglak, A.A.; Kononov, A.I. Comparative Study of Gold and Silver Interactions with Amino Acids and Nucleobases. RSC Adv. 2020, 10, 34149–34160. [Google Scholar] [CrossRef] [PubMed]
  42. Choi, Y.I.; Lee, S.; Kim, S.K.; Kim, Y.-I.; Cho, D.W.; Khan, M.M.; Sohn, Y. Fabrication of ZnO, ZnS, Ag-ZnS, and Au-ZnS Microspheres for Photocatalytic Activities, CO Oxidation and 2-Hydroxyterephthalic Acid Synthesis. J. Alloys Compd. 2016, 675, 46–56. [Google Scholar] [CrossRef]
  43. Mazhar, S.; Qazi, U.Y.; Nadeem, N.; Zahid, M.; Jalil, A.; Khan, F.; Ul-Hasan, I.; Shahid, I. Photocatalytic Degradation of Methylene Blue Using Polyaniline-Based Silver-Doped Zinc Sulfide (PANI-Ag/ZnS) Composites. Environ. Sci. Pollut. Res. 2022, 29, 9203–9217. [Google Scholar] [CrossRef]
  44. Patel, K.; Deshpande, M.P.; Chaki, S.H. Effect of Ag on Structural, Optical and Luminescence Properties of ZnS Nanoparticles Synthesized by Microwave-Assisted Chemical Route. Appl. Phys. A 2017, 123, 367. [Google Scholar] [CrossRef]
  45. Muraleedharan, K.; Rajan, V.K.; Abdul Mujeeb, V.M. Green Synthesis of Pure and Doped Semiconductor Nanoparticles of ZnS and CdS. Trans. Nonferrous Met. Soc. China 2015, 25, 3265–3270. [Google Scholar] [CrossRef]
  46. Xie, M.; Chen, Z.; Zhao, F.; Lin, Y.; Zheng, S.; Han, S. Correction: Xie et al. Selection and Application of SsDNA Aptamers for Fluorescence Biosensing Detection of Malachite Green. Foods 2022, 11, 801. Foods 2022, 11, 1933. [Google Scholar] [CrossRef]
  47. Arshad, U.; Mujahid, A.; Lieberzeit, P.; Afzal, A.; Zafar Bajwa, S.; Iqbal, N.; Roshan, S. Molecularly Imprinted Polymeric Coatings for Sensitive and Selective Gravimetric Detection of Artemether. RSC Adv. 2020, 10, 34355–34363. [Google Scholar] [CrossRef]
  48. Wang, B.; Lin, Y.; Tan, H.; Luo, M.; Dai, S.; Lu, H.; Huang, Z. One-Pot Synthesis of N-Doped Carbon Dots by Pyrolyzing the Gel Composed of Ethanolamine and 1-Carboxyethyl-3-Methylimidazolium Chloride and Their Selective Fluorescence Sensing for Cr(VI) Ions. Analyst 2018, 143, 1906–1915. [Google Scholar] [CrossRef]
  49. Wang, H.; Wu, Y.; Song, J.-F. Interface Potential Sensing from Adsorption of Human Serum Albumin (HSA) on Carbon Nanotube (CNT) Monitored by Zero Current Potentiometry for HSA Determination. Biosens. Bioelectron. 2015, 72, 225–229. [Google Scholar] [CrossRef] [PubMed]
  50. Gui, W.; Chen, X.; Ma, Q. A Novel Detection Method of Human Serum Albumin Based on CuInZnS Quantum Dots-Co2+ Sensing System. Anal. Bioanal. Chem. 2017, 409, 3871–3876. [Google Scholar] [CrossRef]
  51. Li, J.; Wu, J.; Cui, F.; Zhao, X.; Li, Y.; Lin, Y.; Li, Y.; Hu, J.; Ju, Y. A Dual Functional Fluorescent Sensor for Human Serum Albumin and Chitosan. Sens. Actuators B Chem. 2017, 243, 831–837. [Google Scholar] [CrossRef]
Figure 1. A schematic for the synthesis of human serum albumin (HSA)-imprinted Ag-ZnS@MIP composite receptors.
Chemosensors 11 00240 g001
Figure 2. (a) XRD pattern, and (b) FTIR spectrum of Ag-ZnS microspheres.
Chemosensors 11 00240 g002
Figure 3. (a) A micrograph of the receptor layer showing Ag-ZnS microspheres, (b) topographic surface profiles of the receptor layer showing surface features from bottom-to-top (Topography a) and across right-to-left (Topography b) of surface in (a).
Chemosensors 11 00240 g003
Figure 4. Sensor response of QCM devices coated with different MIP formulations containing varying ratios of monomer (MAA) and crosslinker (EGDMA).
Chemosensors 11 00240 g004
Figure 5. Sensor responses and imprinting factors of QCM devices coated with different MIP formulations. Imprinting factors are calculated by dividing the respective MIP and NIP sensor shifts.
Chemosensors 11 00240 g005
Figure 6. (a) Sensor response of Ag-ZnS@MIP and Ag-ZnS@NIP coated QCM devices toward different concentrations of HSA. (b) The linear detection range and sensitivity of Ag-ZnS@MIP and Ag-ZnS@NIP-based HSA sensors are depicted by the respective calibration curves.
Chemosensors 11 00240 g006
Figure 7. (a) The cross-sensitivity of HSA sensors toward different proteins, and (b) the stability and repeatability of the HSA sensor demonstrated by its sensor response to 200 ng/mL HSA over a period of 3 weeks.
Chemosensors 11 00240 g007
Table 1. A summary of different MIP formulations having varying amounts of the monomer (MAA) and the crosslinker (EGDMA).
FormulationsMAA (µL)EGDMA (µL)HAS 1 (µL)Ag-ZnS 2 (µL)
MIP-1502514100
MIP-238.538.514100
MIP-3453014100
MIP-4156014100
Table notes. 1 Template (human serum albumin, HSA) solution was taken from a 5 mg/mL stock solution. 2 Ag-ZnS volume was taken from a suspension of 4 mg/mL.
Table 2. A comparison of Ag-ZnS@MIP-based HSA sensor performance with different HSA sensing methods from the literature.
Sensing ElementTransducerRange LODRef.
Thiophene–based conducting polymersDPV800–20,000 ng/mL16.6 ng/mL[8]
EIS4000–80,000 ng/mL800 ng/mL
Epitope–imprinted polymer (zinc acrylate–co–EGDMA)QCM50–500 ng/mL26 ng/mL[11]
Multiwalled carbon nanotubes (MWCNTs)Potentiometry2.8 × 10−8–3.4 × 10⁻⁷ M2 × 10−8 M[49]
CuInZnS quantum dotsPhotoluminescence7.5  × 10–8 to 1.0 × 10⁻⁴ M 4.5 × 10⁻⁸ M[50]
Aggregation–induced emission based on salicylideneFluorescence0–100,000 ng/mL6110 ng/mL[51]
Ag–ZnS/poly(MAA–co–EGDMA)QCM5–200 ng/mL0.456 ng/mLThis work
Disclaimer/Publisher’s Note: The statements, opinions and data contained in all publications are solely those of the individual author(s) and contributor(s) and not of MDPI and/or the editor(s). MDPI and/or the editor(s) disclaim responsibility for any injury to people or property resulting from any ideas, methods, instructions or products referred to in the content.

