
A Sensor for Electrochemical pH Monitoring Based on Laser-Induced Graphene Modified with Polyfolate

 , , ,
, , ,
Abstract
:1. Introduction
2. Materials and Methods
2.1. Chemicals and Solutions
2.2. Methods
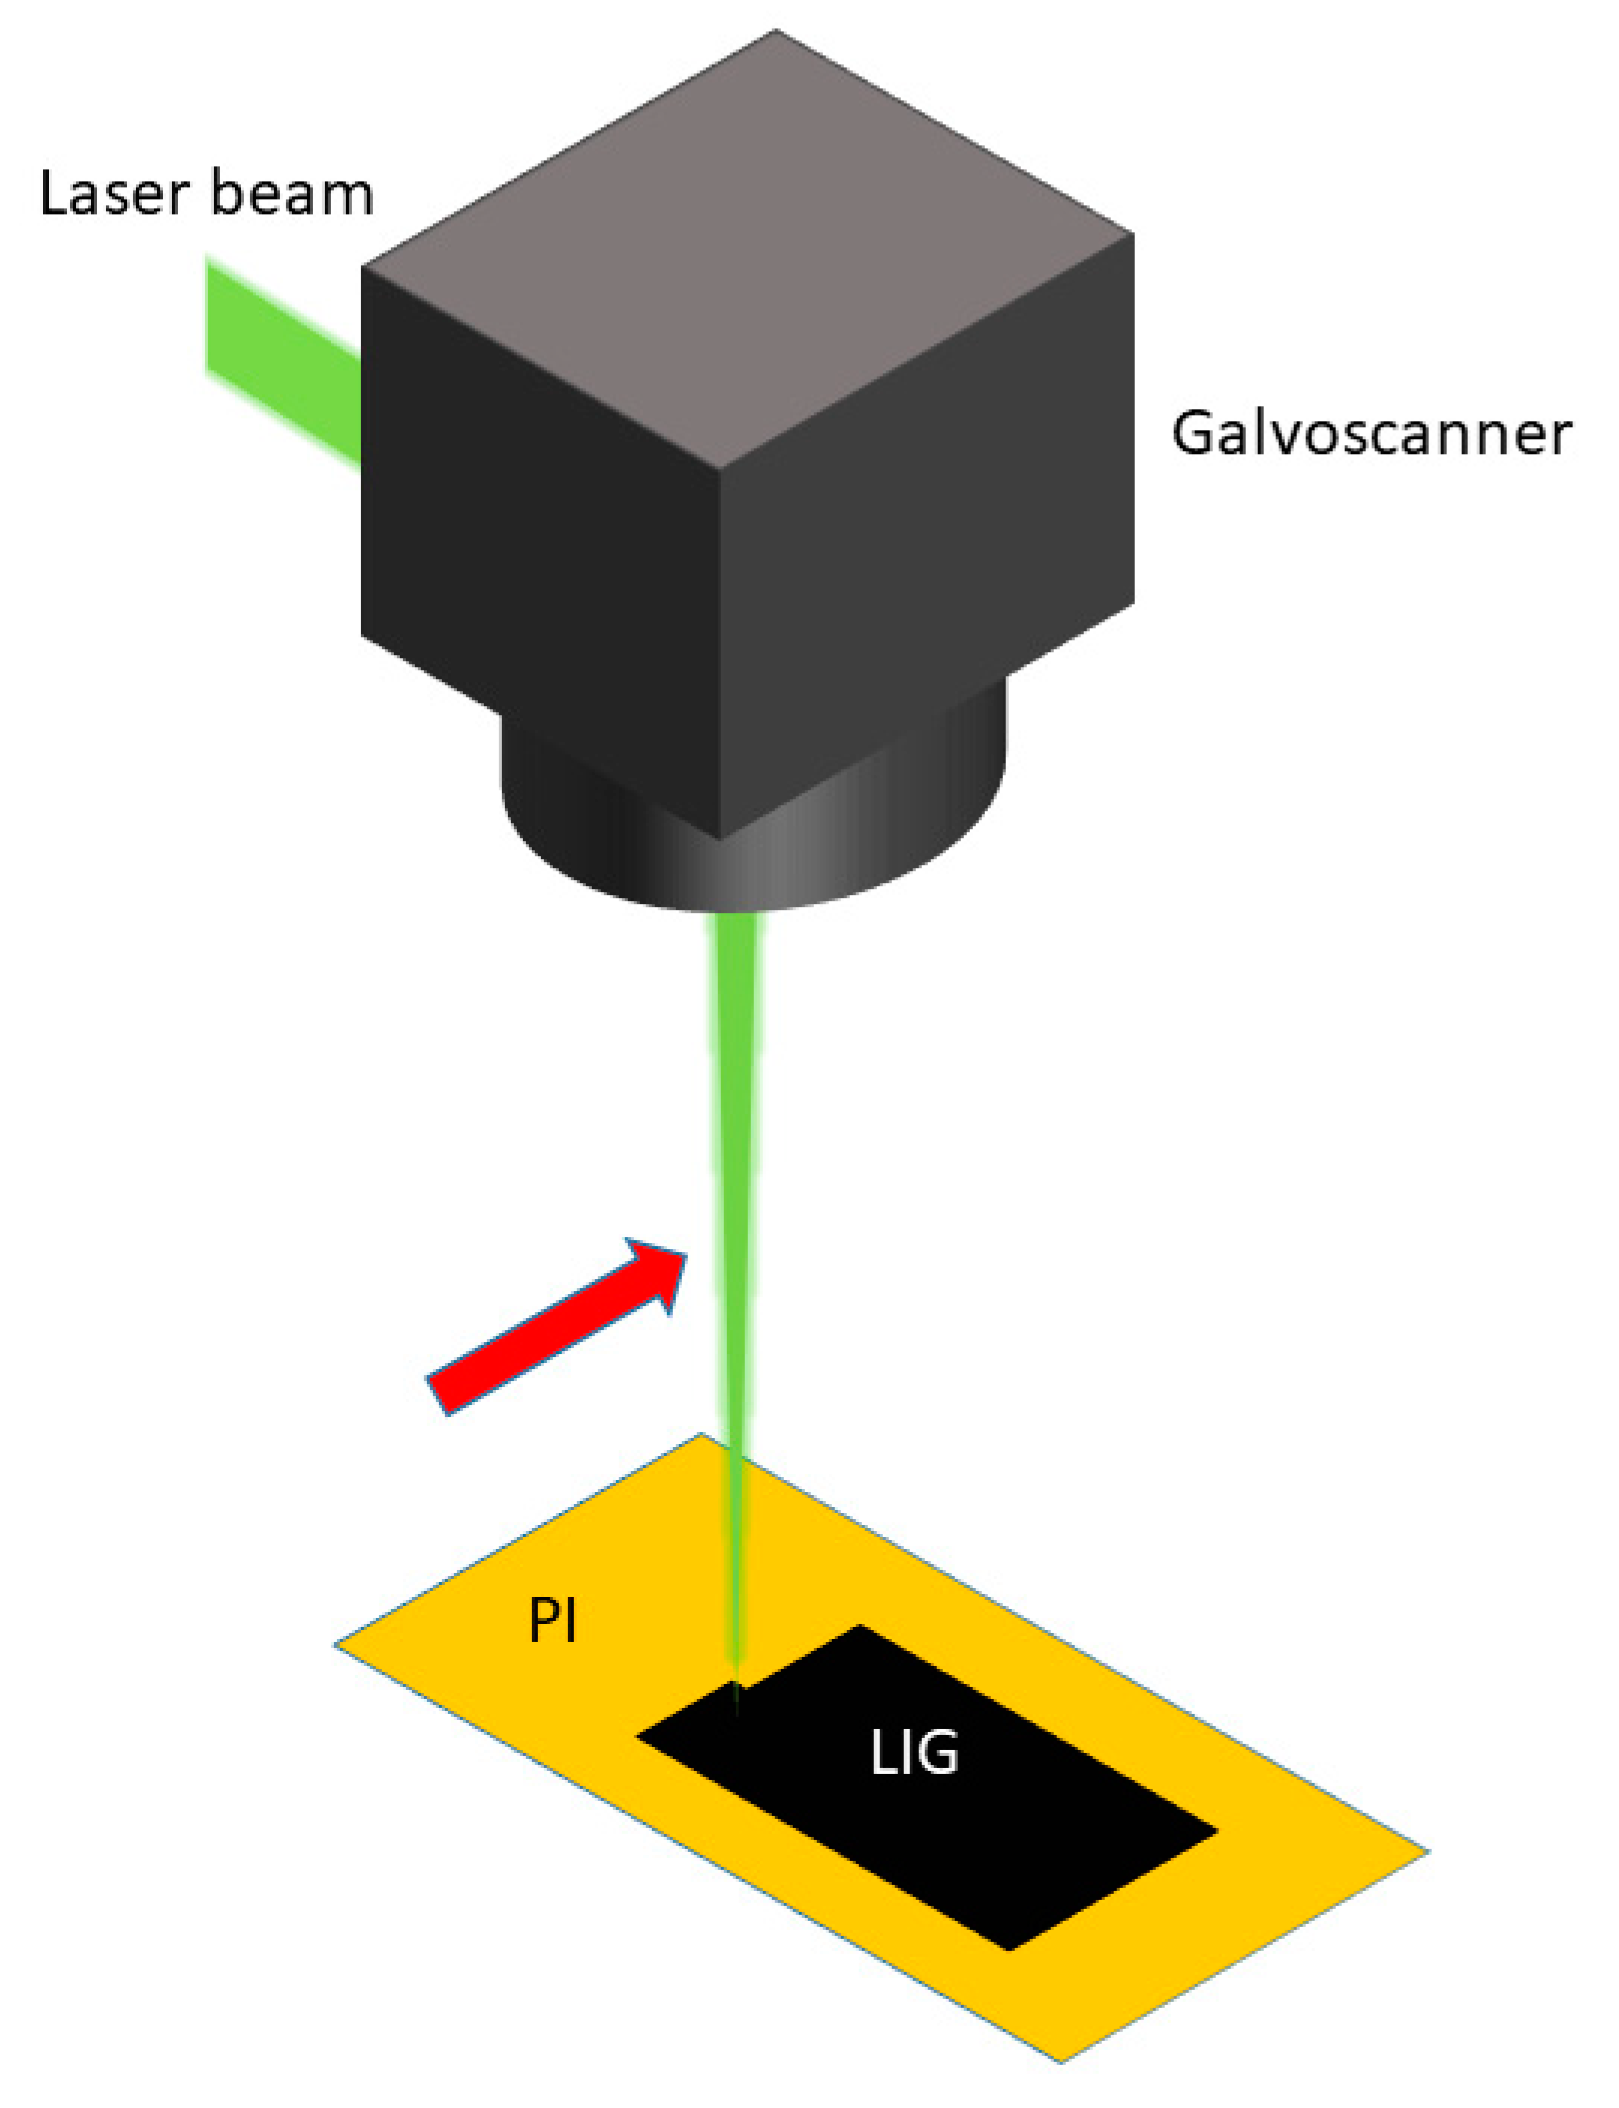
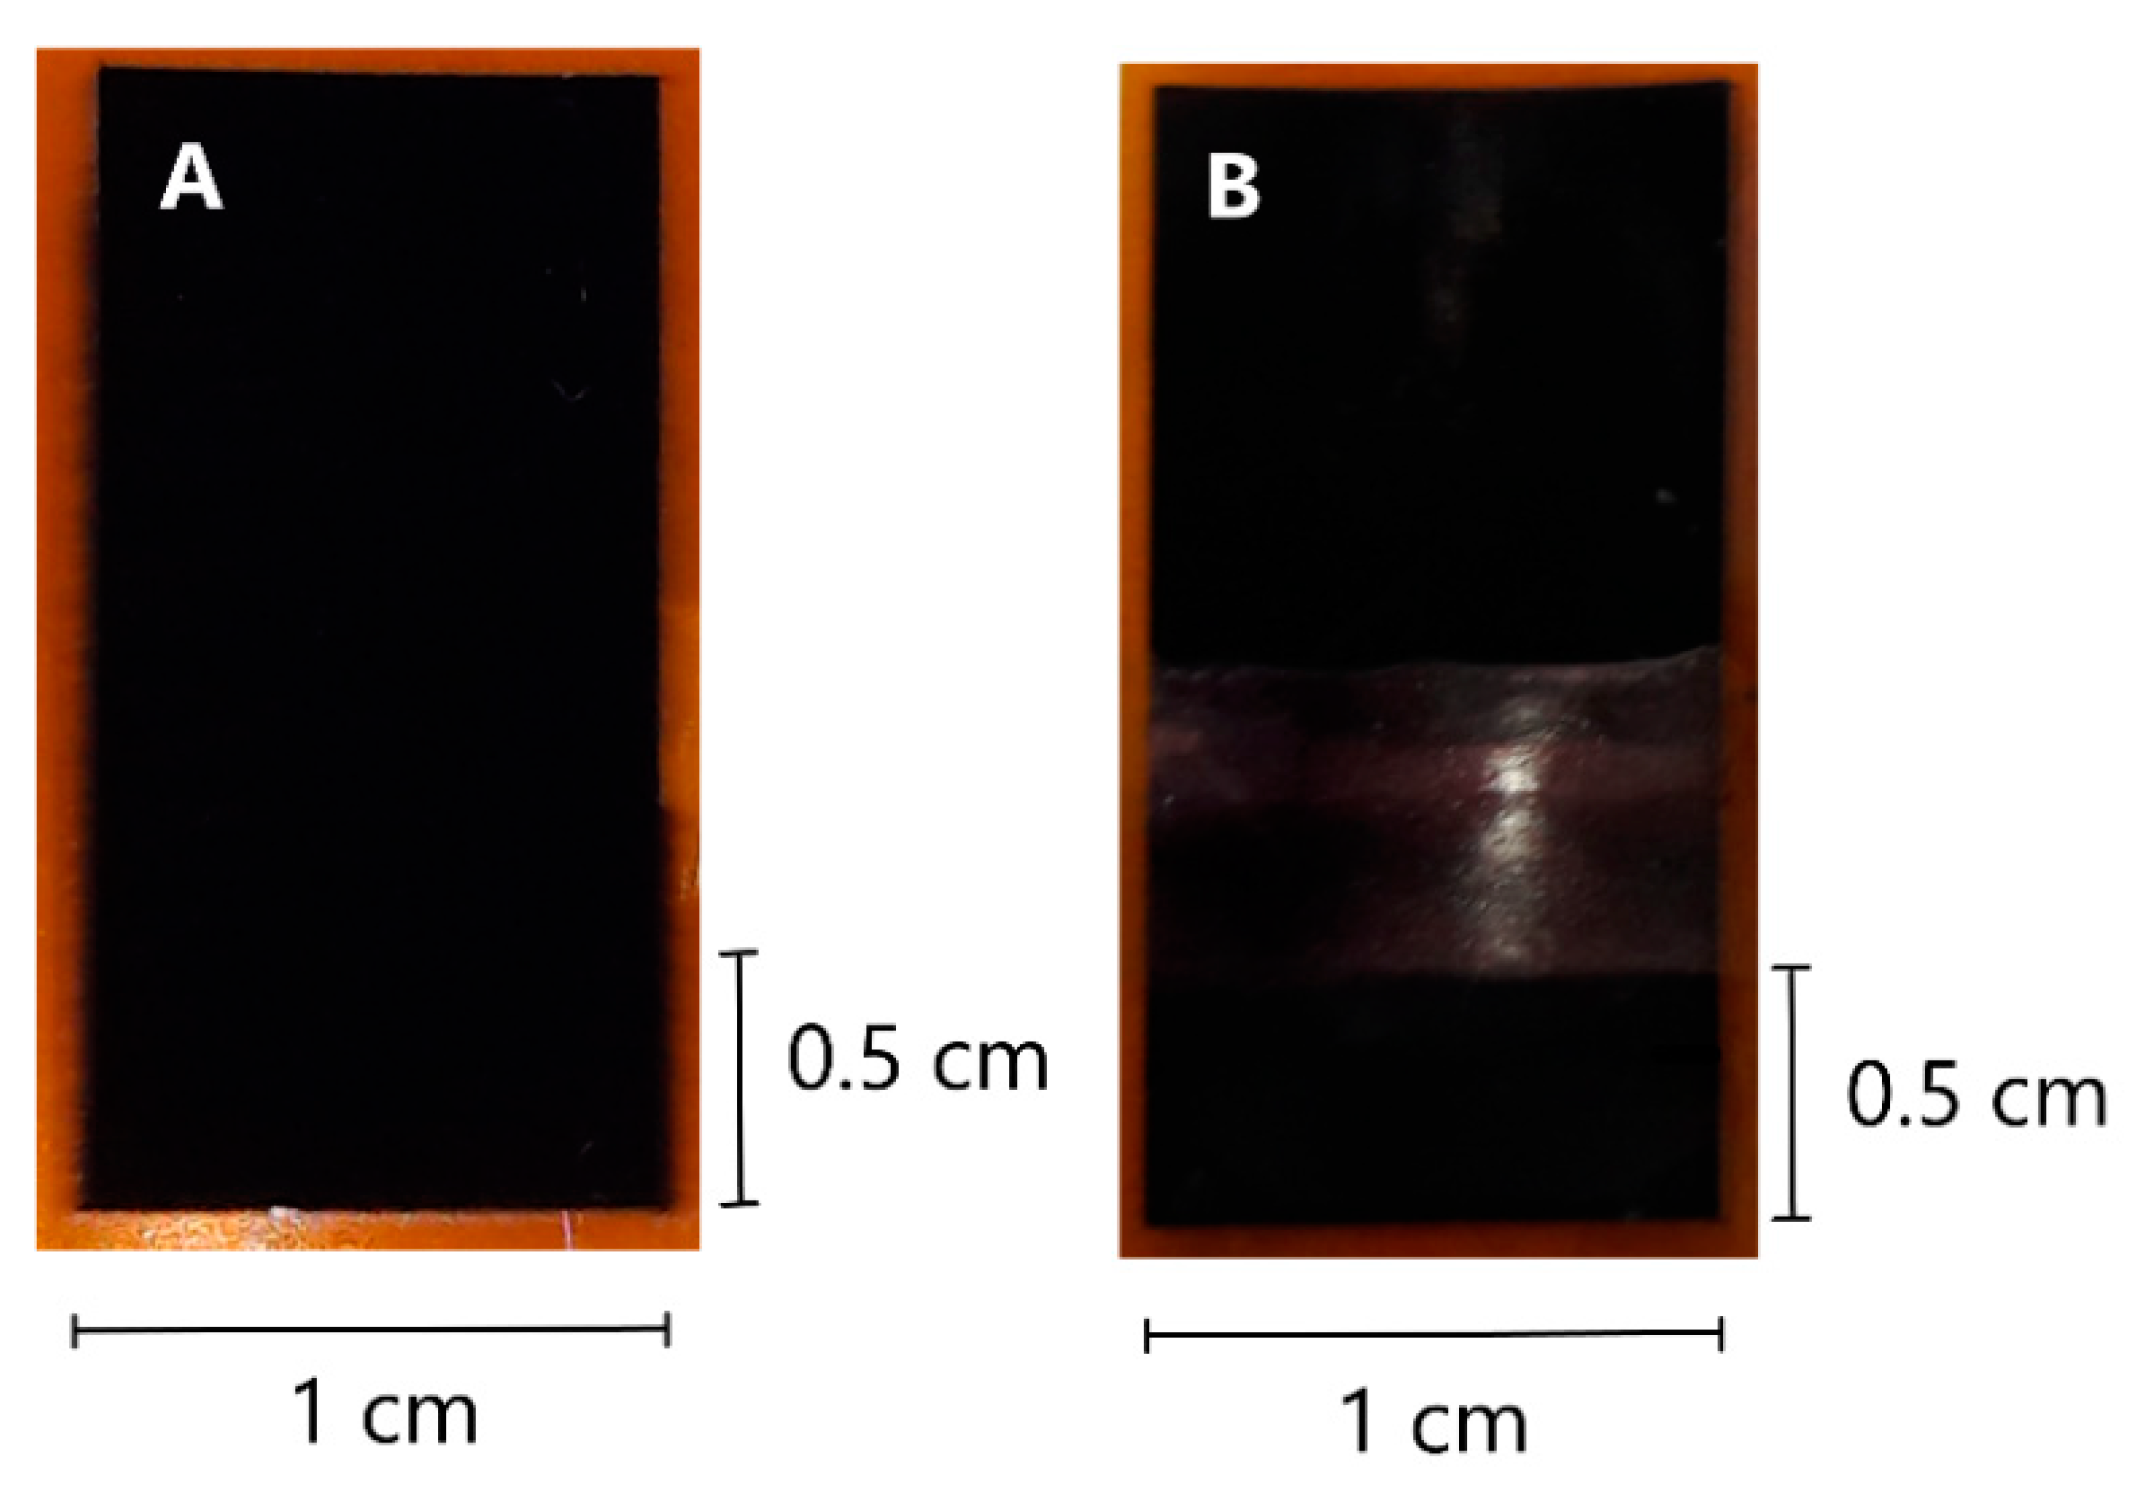
2.3. Preparation of the LIG Electrodes
3. Results
3.1. Characterisation of the LIG Electrode
3.2. Optimisation of Electrode Modification with Polyfolate
3.3. Characterisation of Modified LIG Electrodes
3.4. Response to pH
3.4.1. Sensor Performance
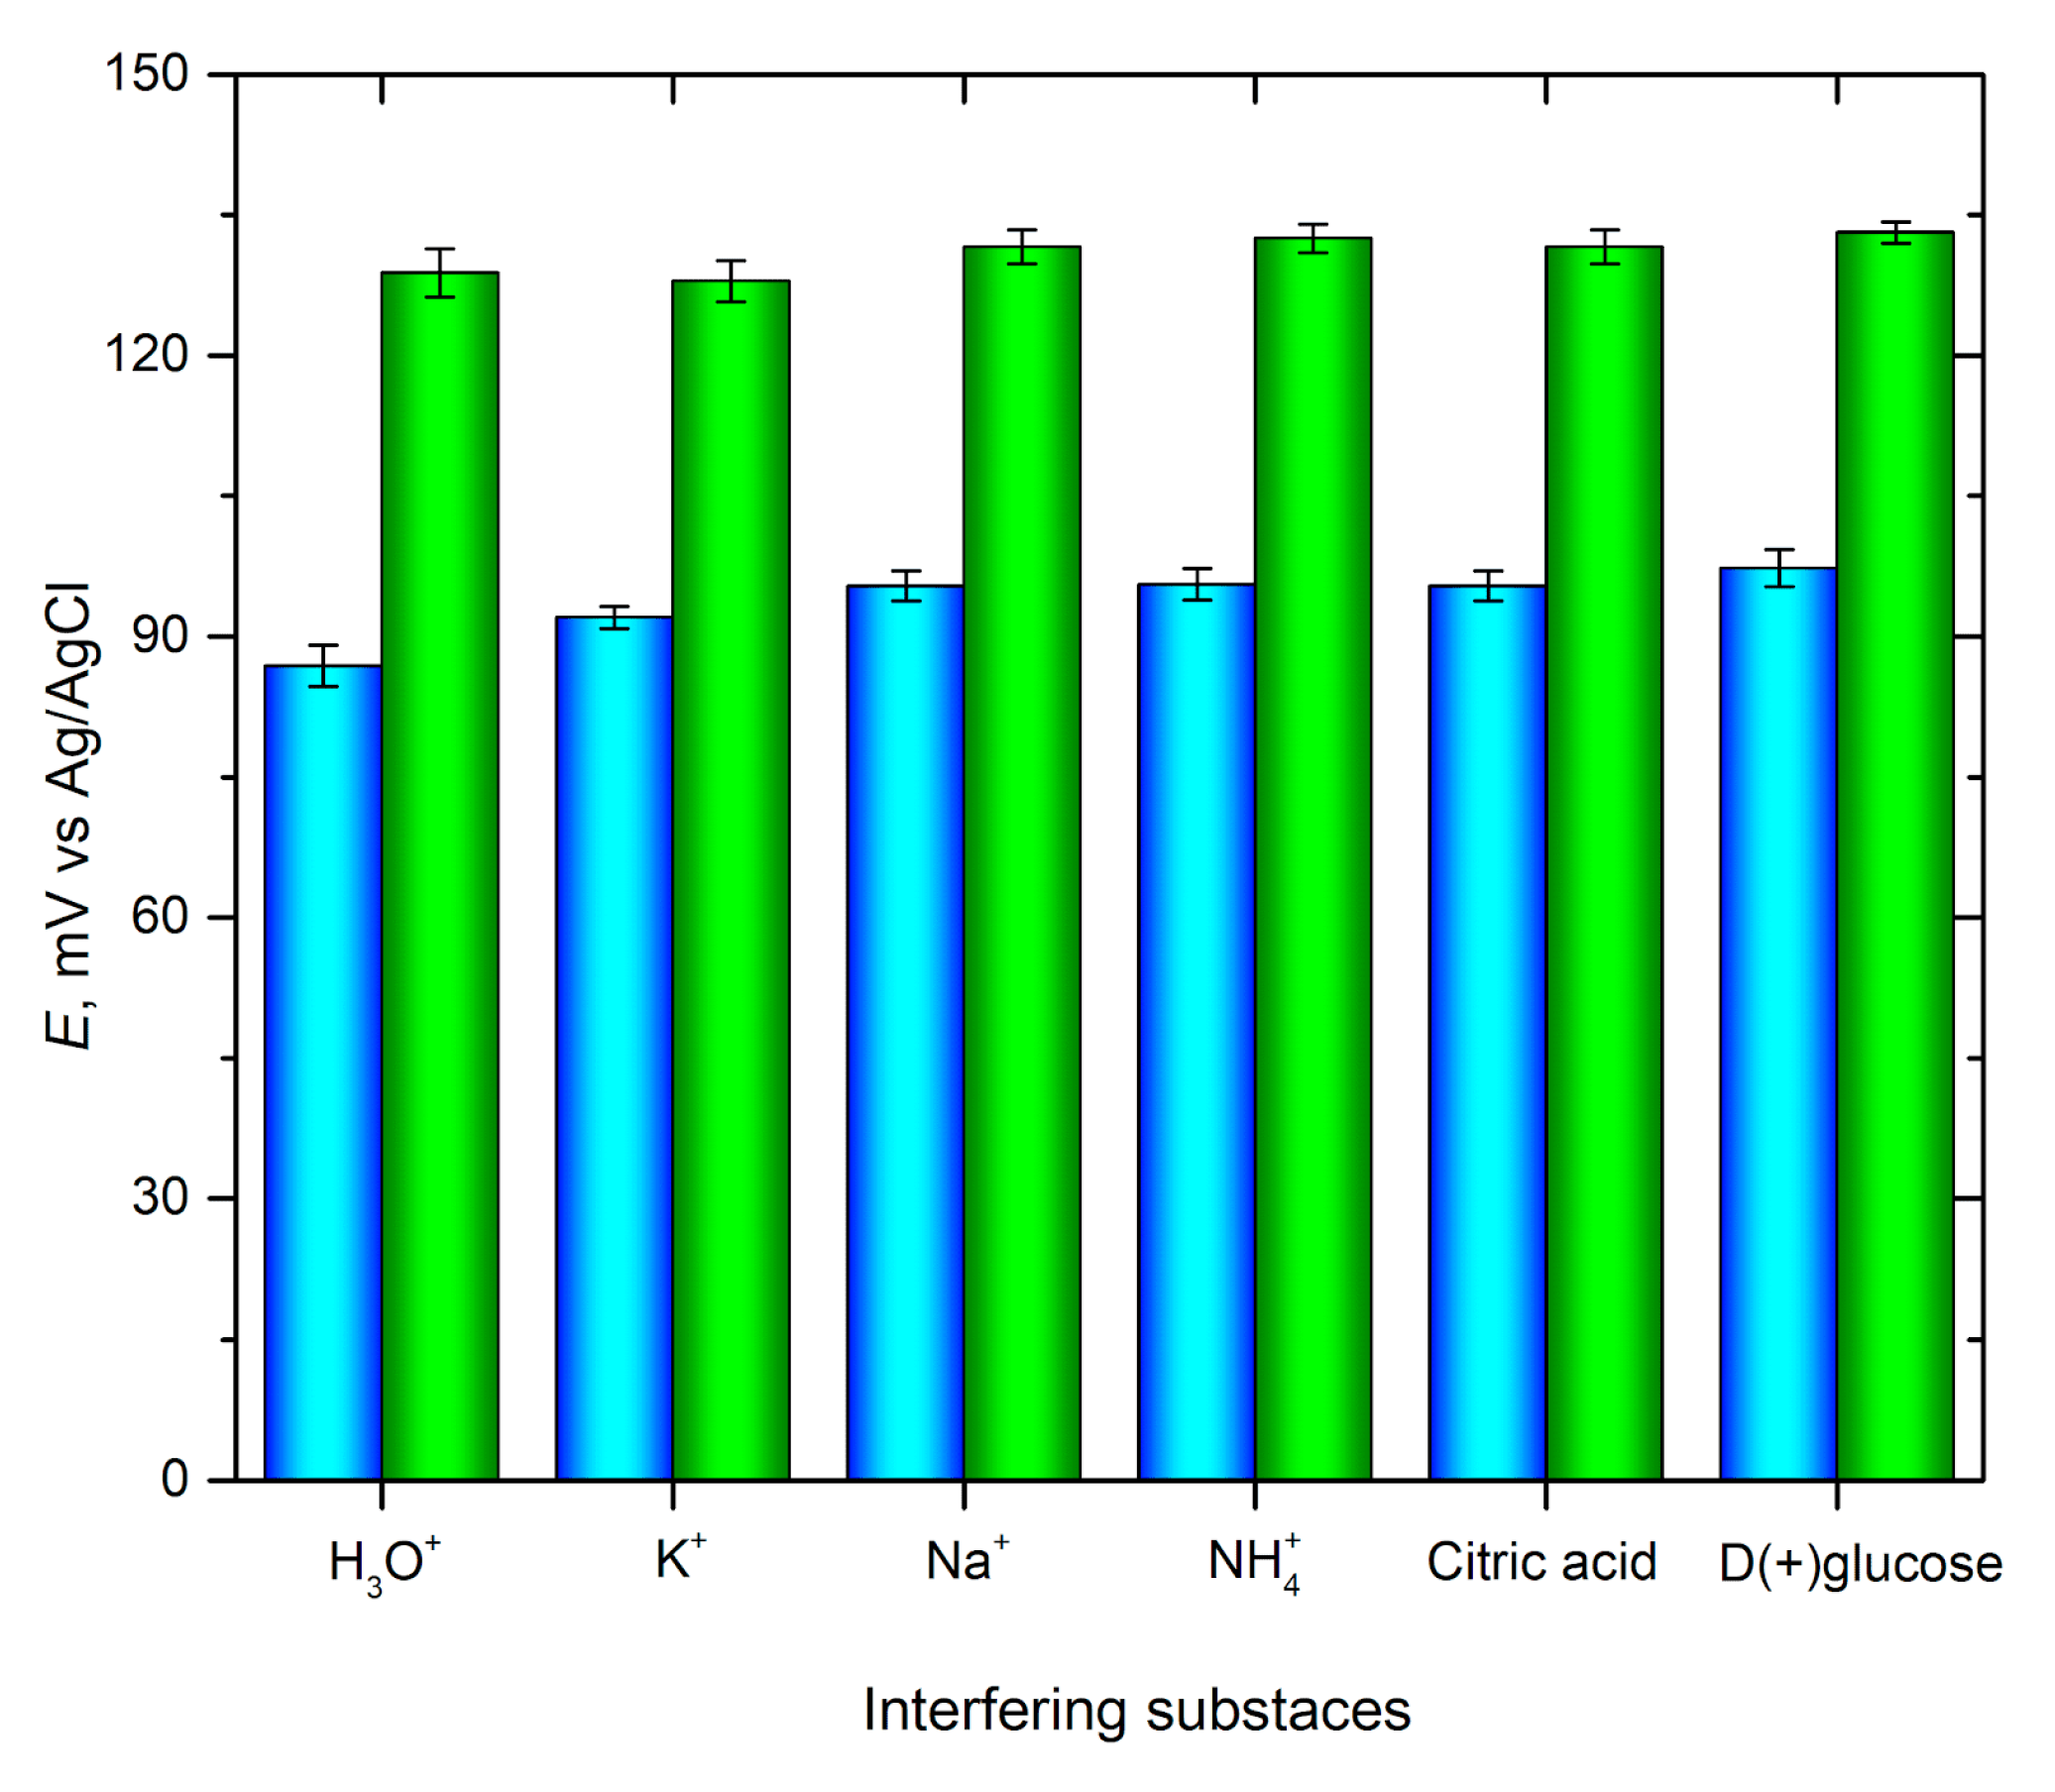
3.4.2. Stability, Reproducibility, and Selectivity of pH Sensor
3.4.3. pH Determination in Real Samples
4. Conclusions and Perspectives
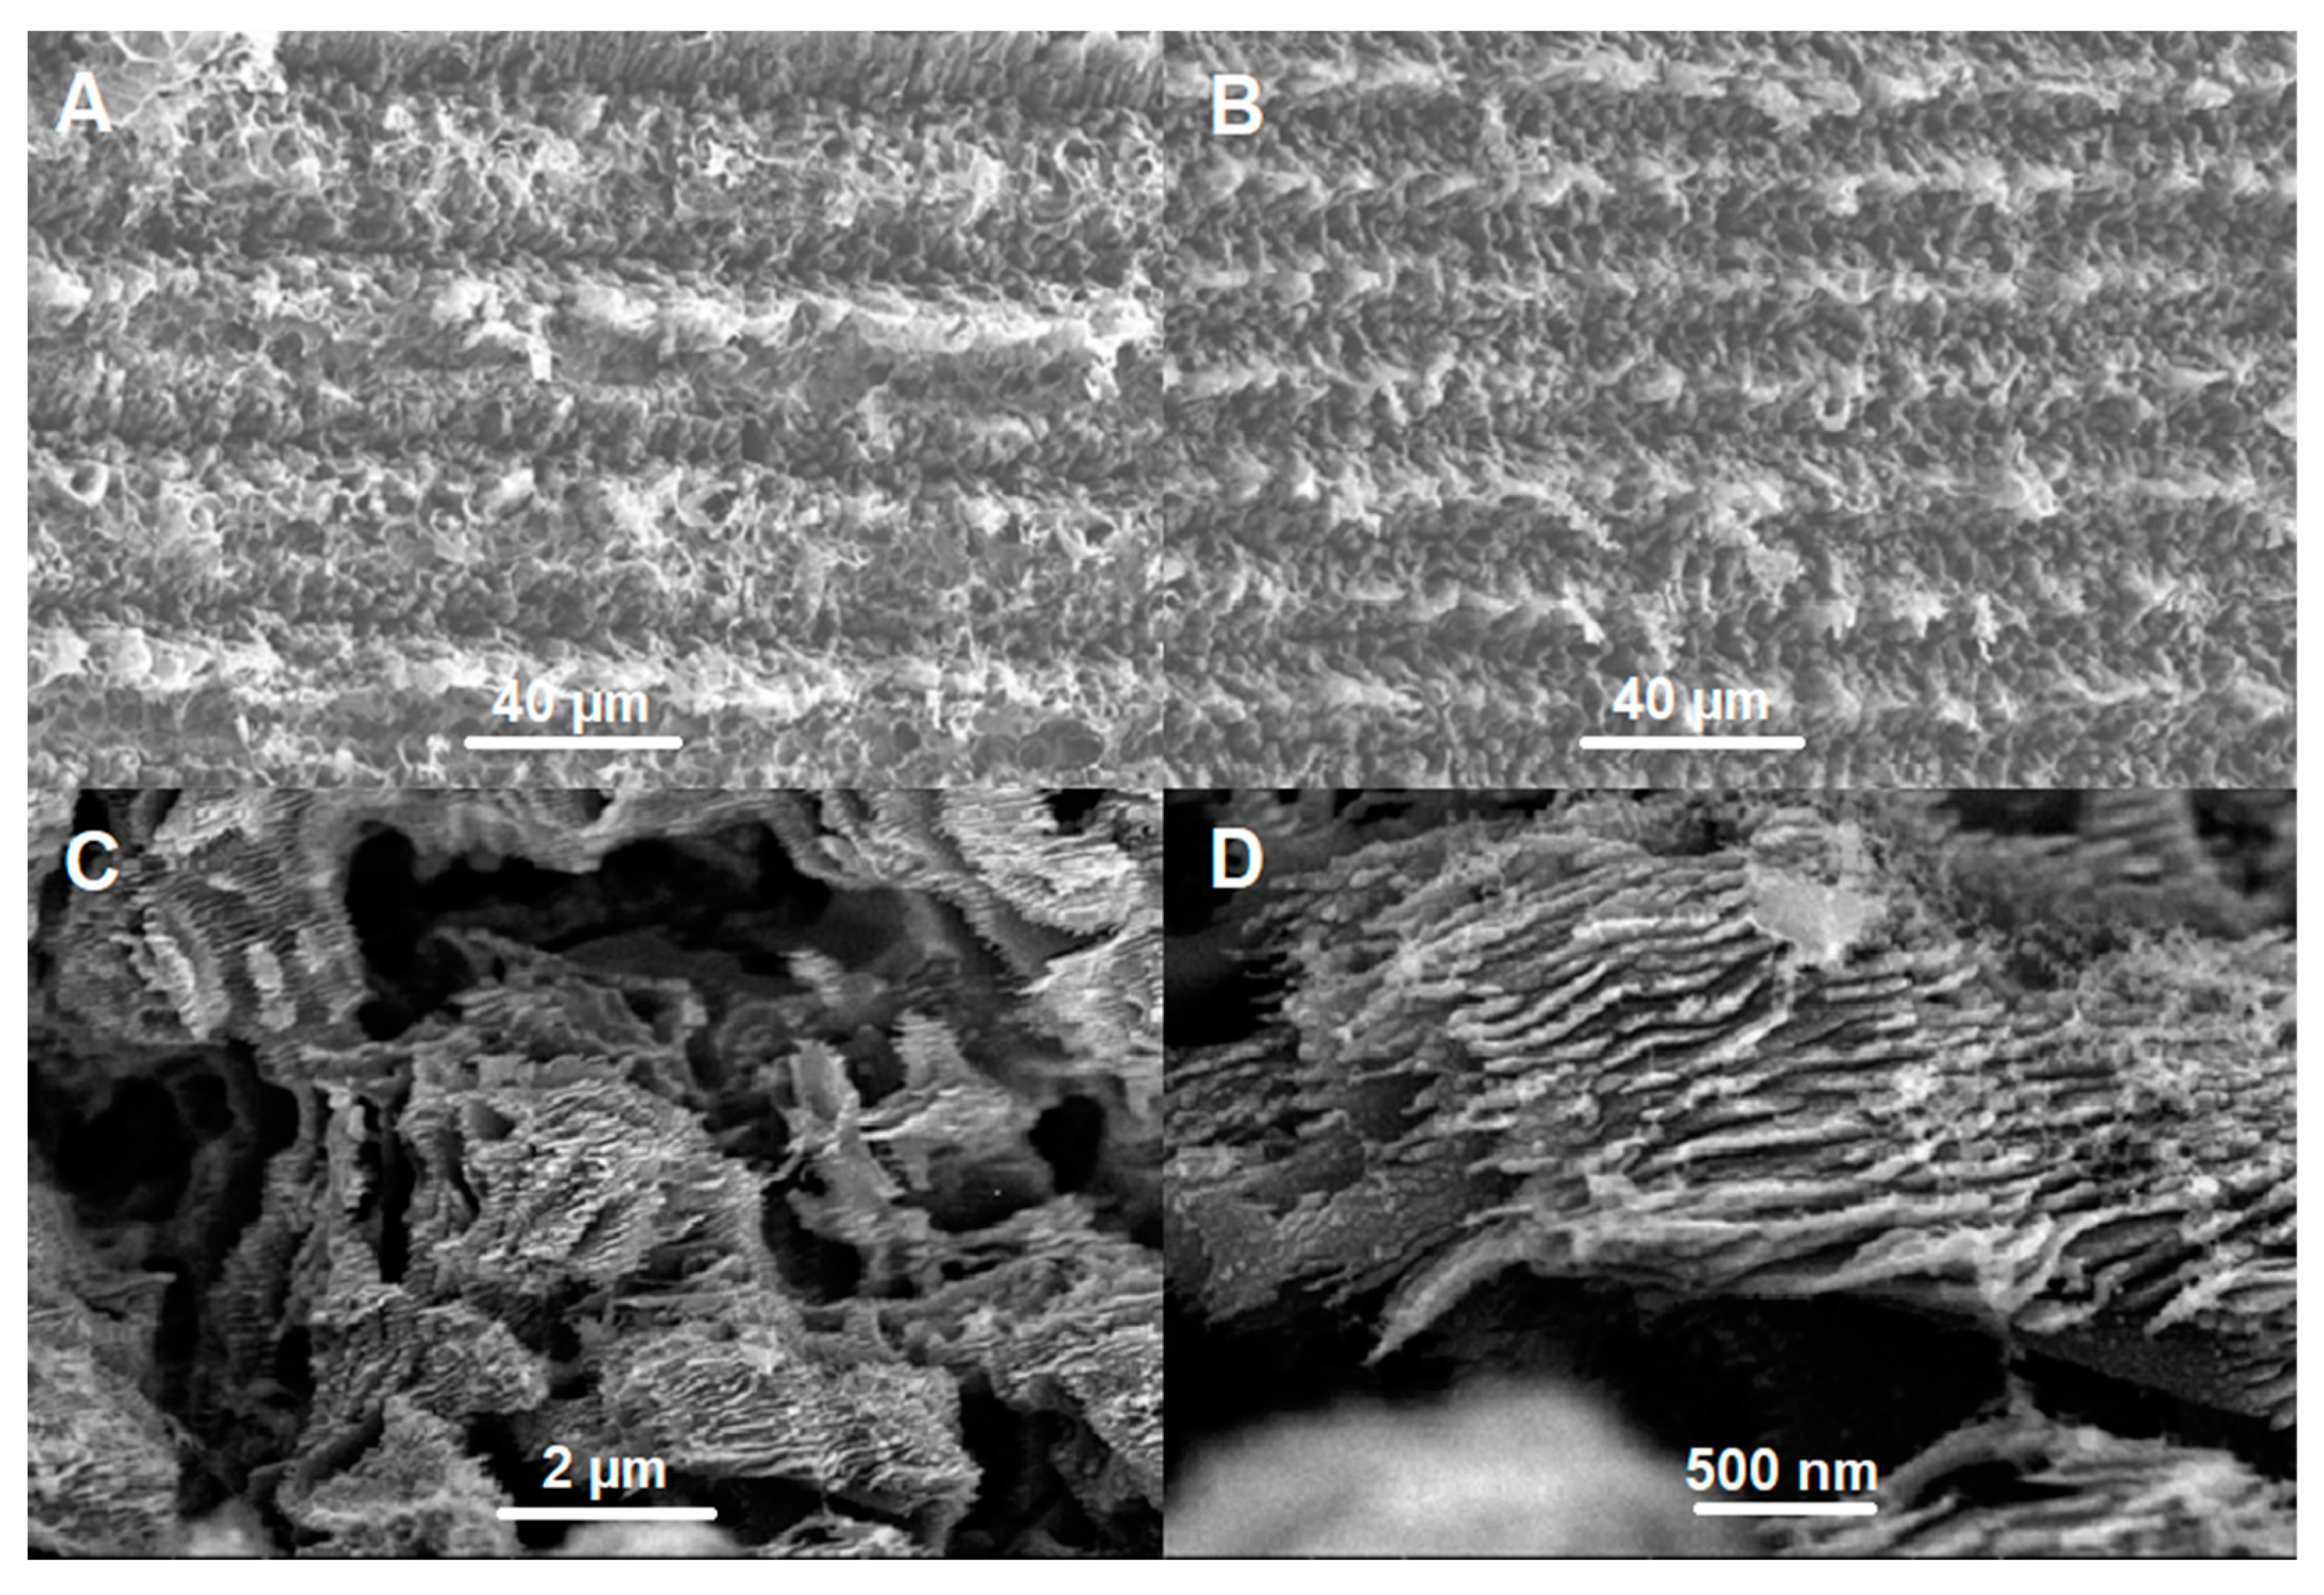
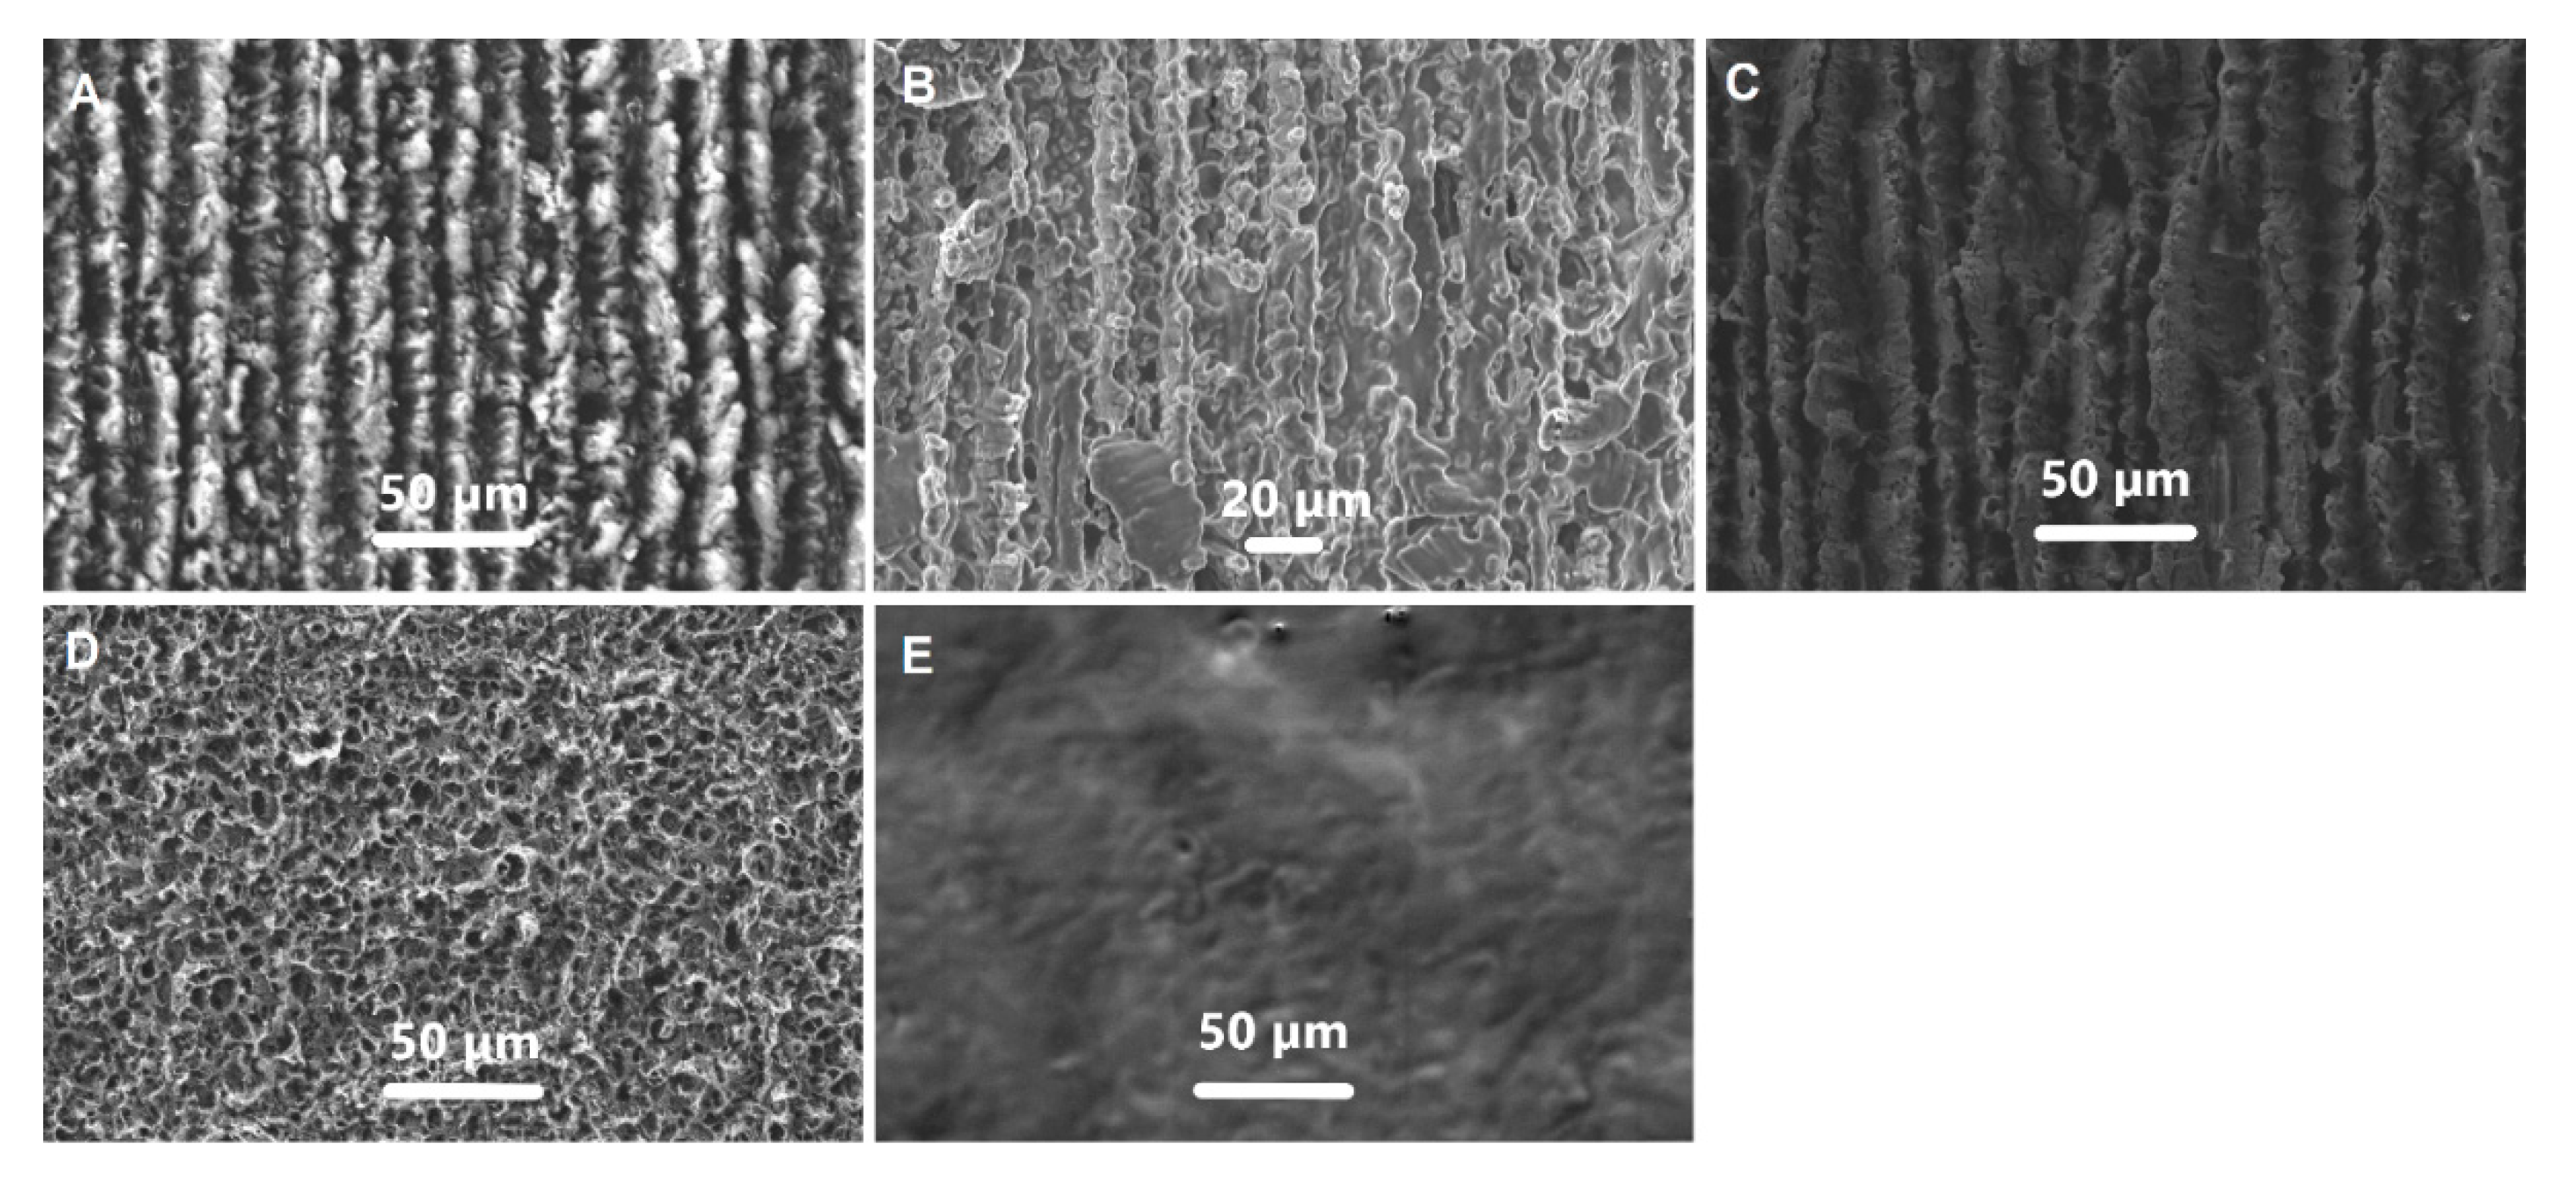
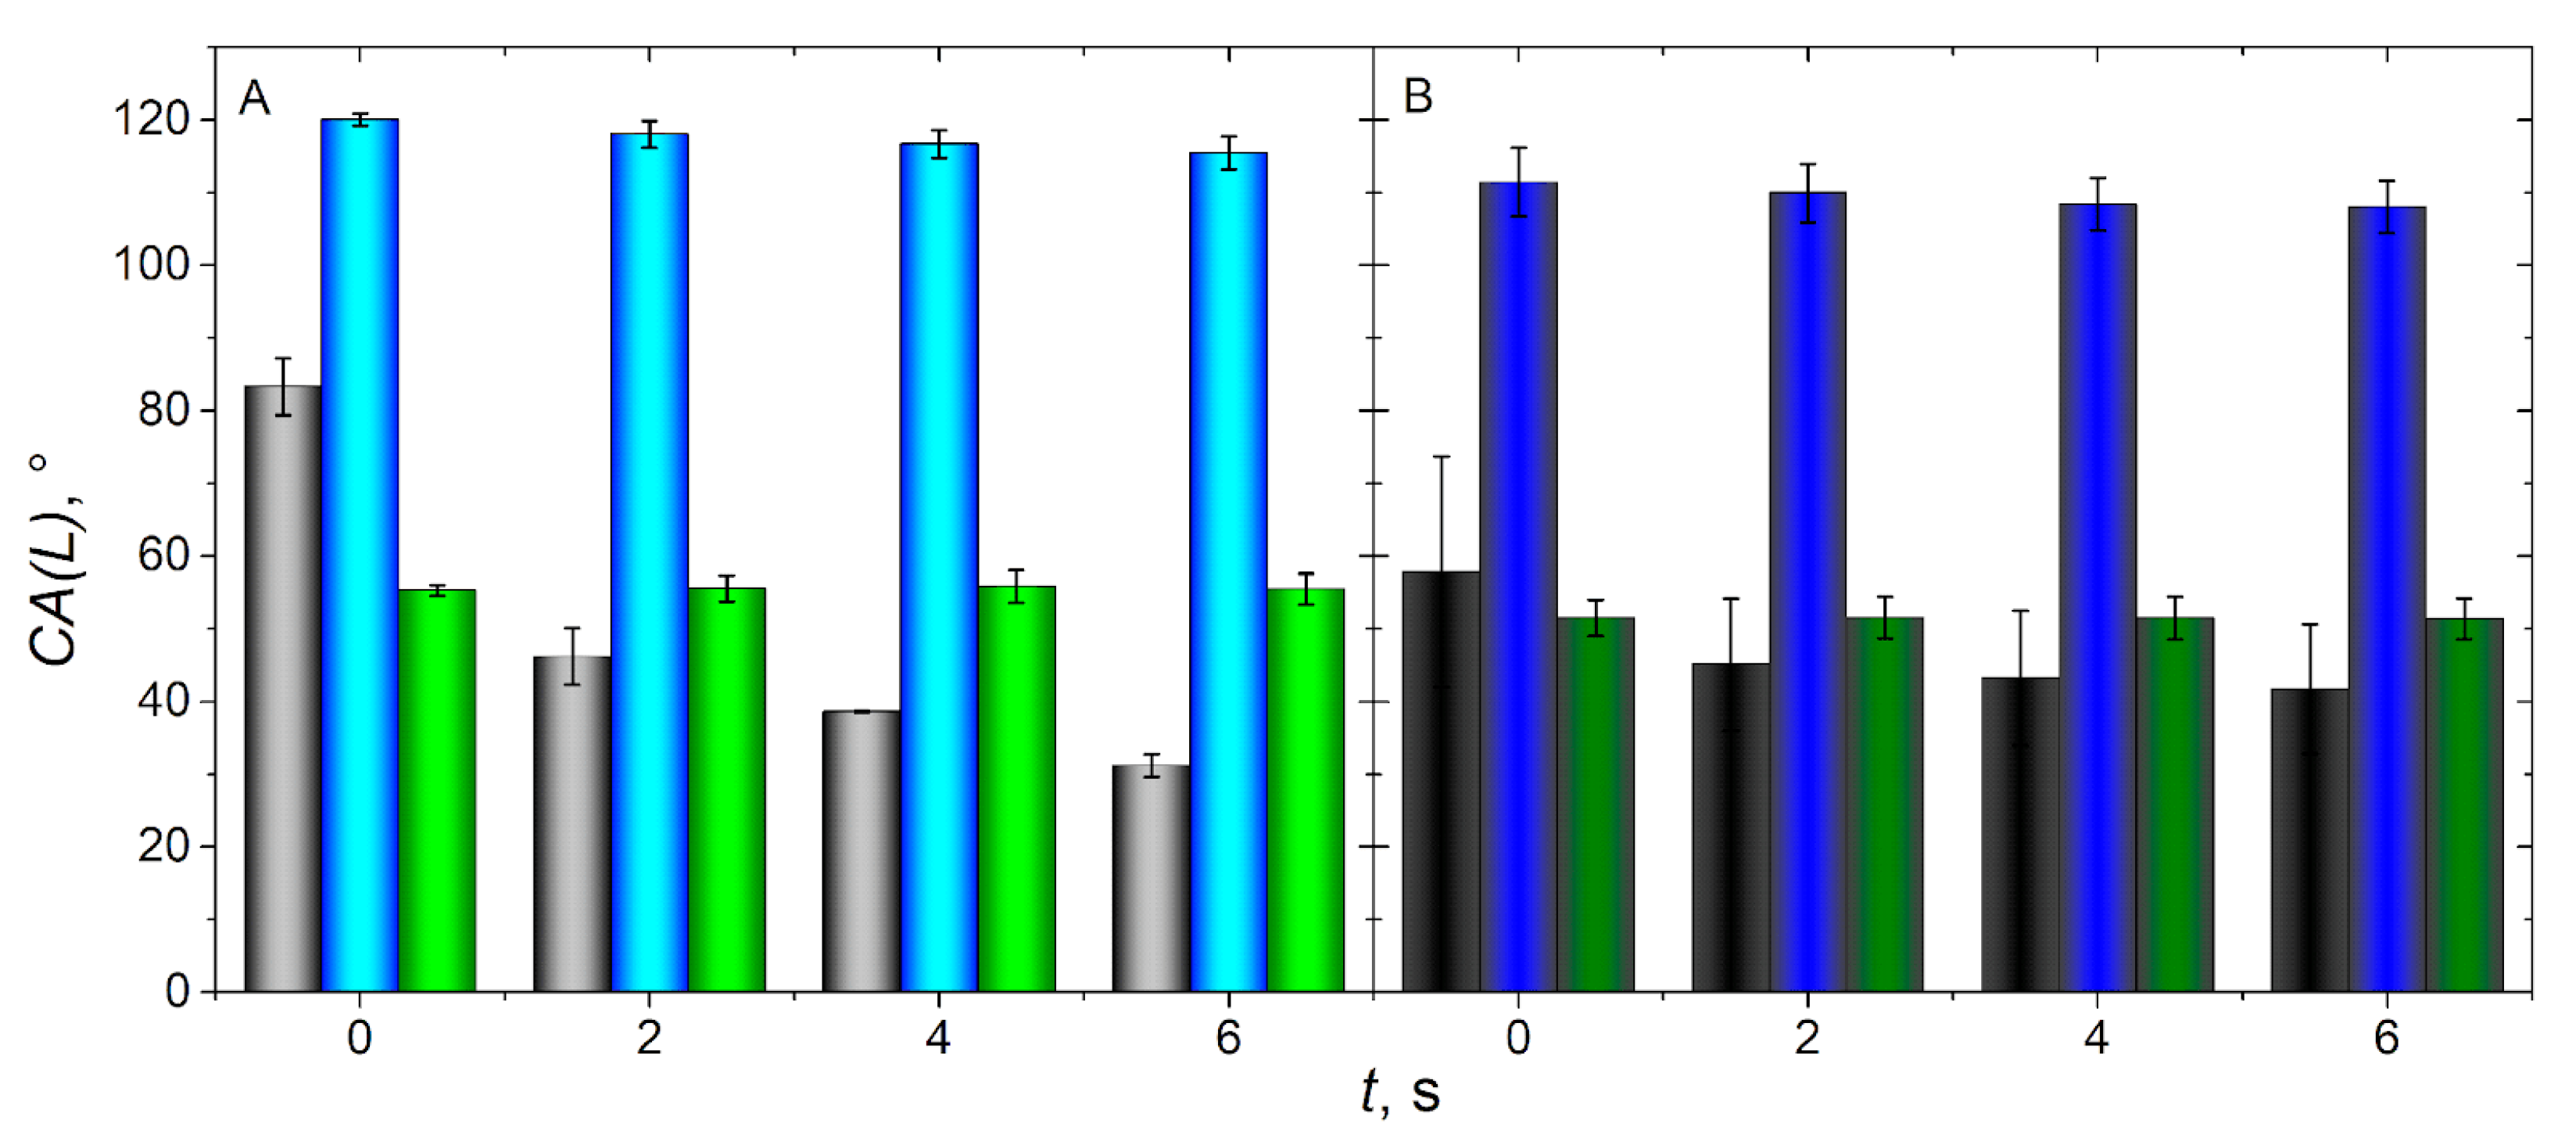
- Microscopic imaging revealed that bare LIG electrodes had rough structures after laser treatment giving hydrophilic properties, and PFA forms fibre-like structures on Chit coated LIG.
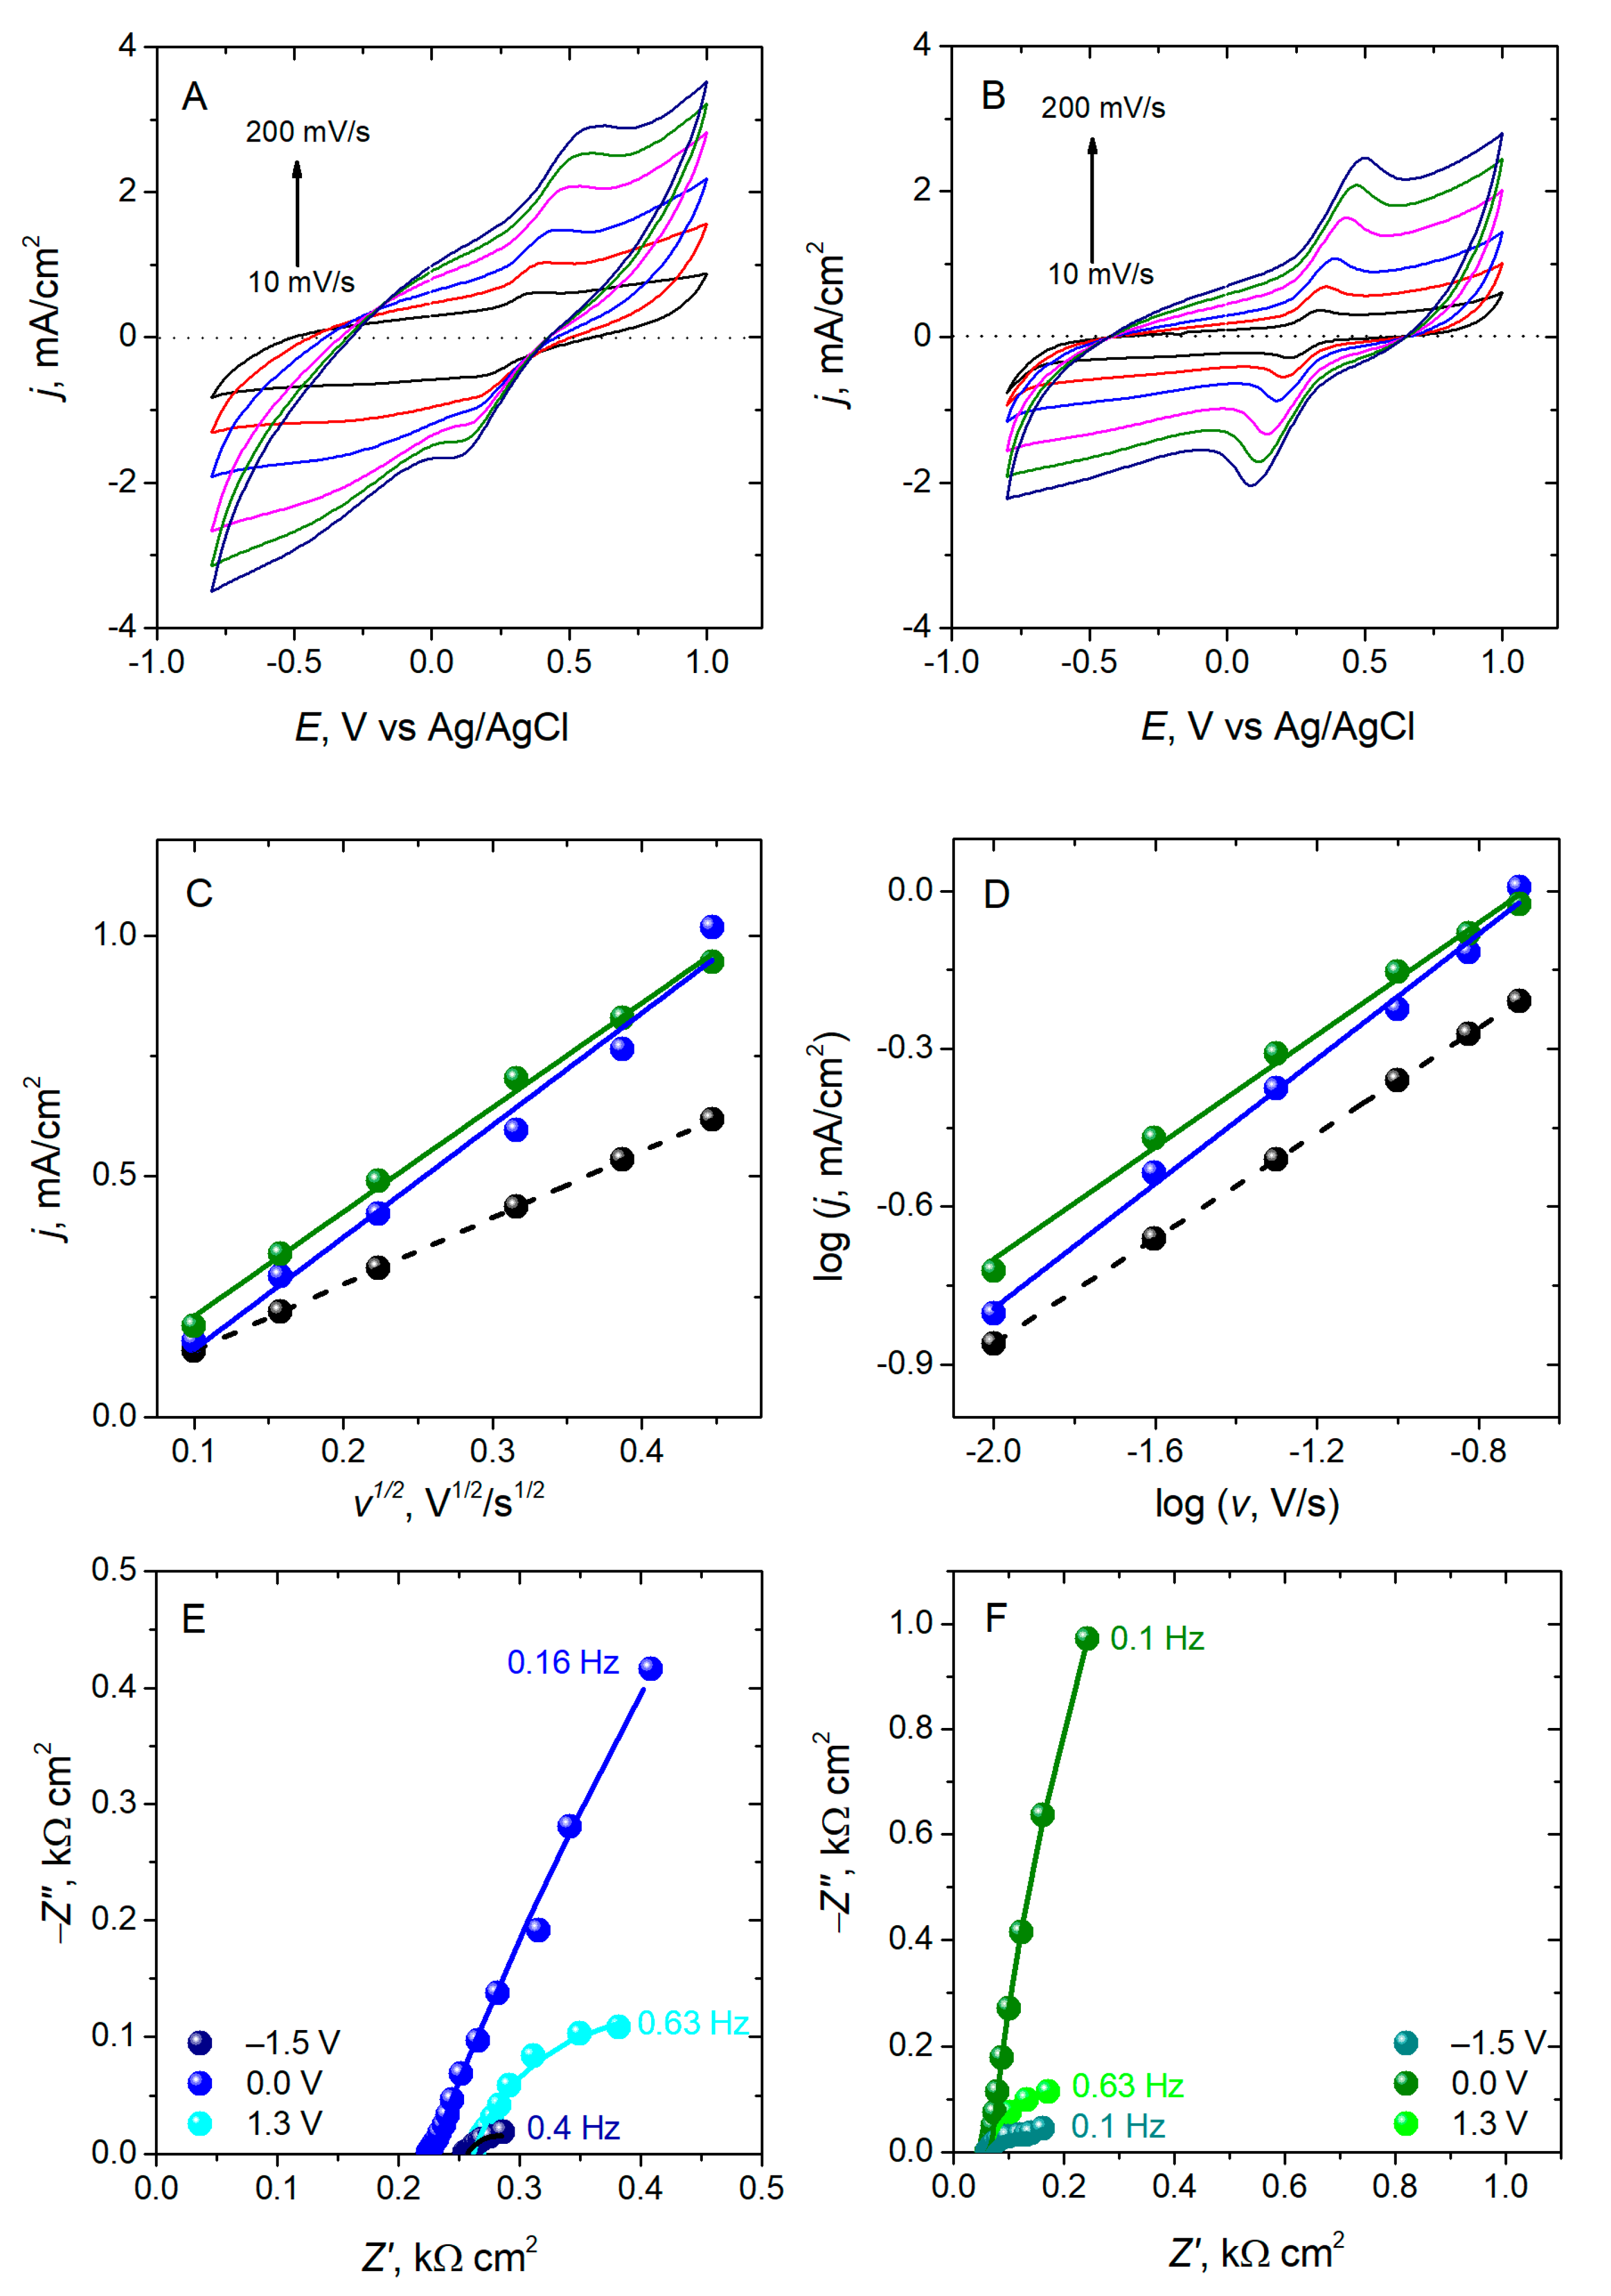
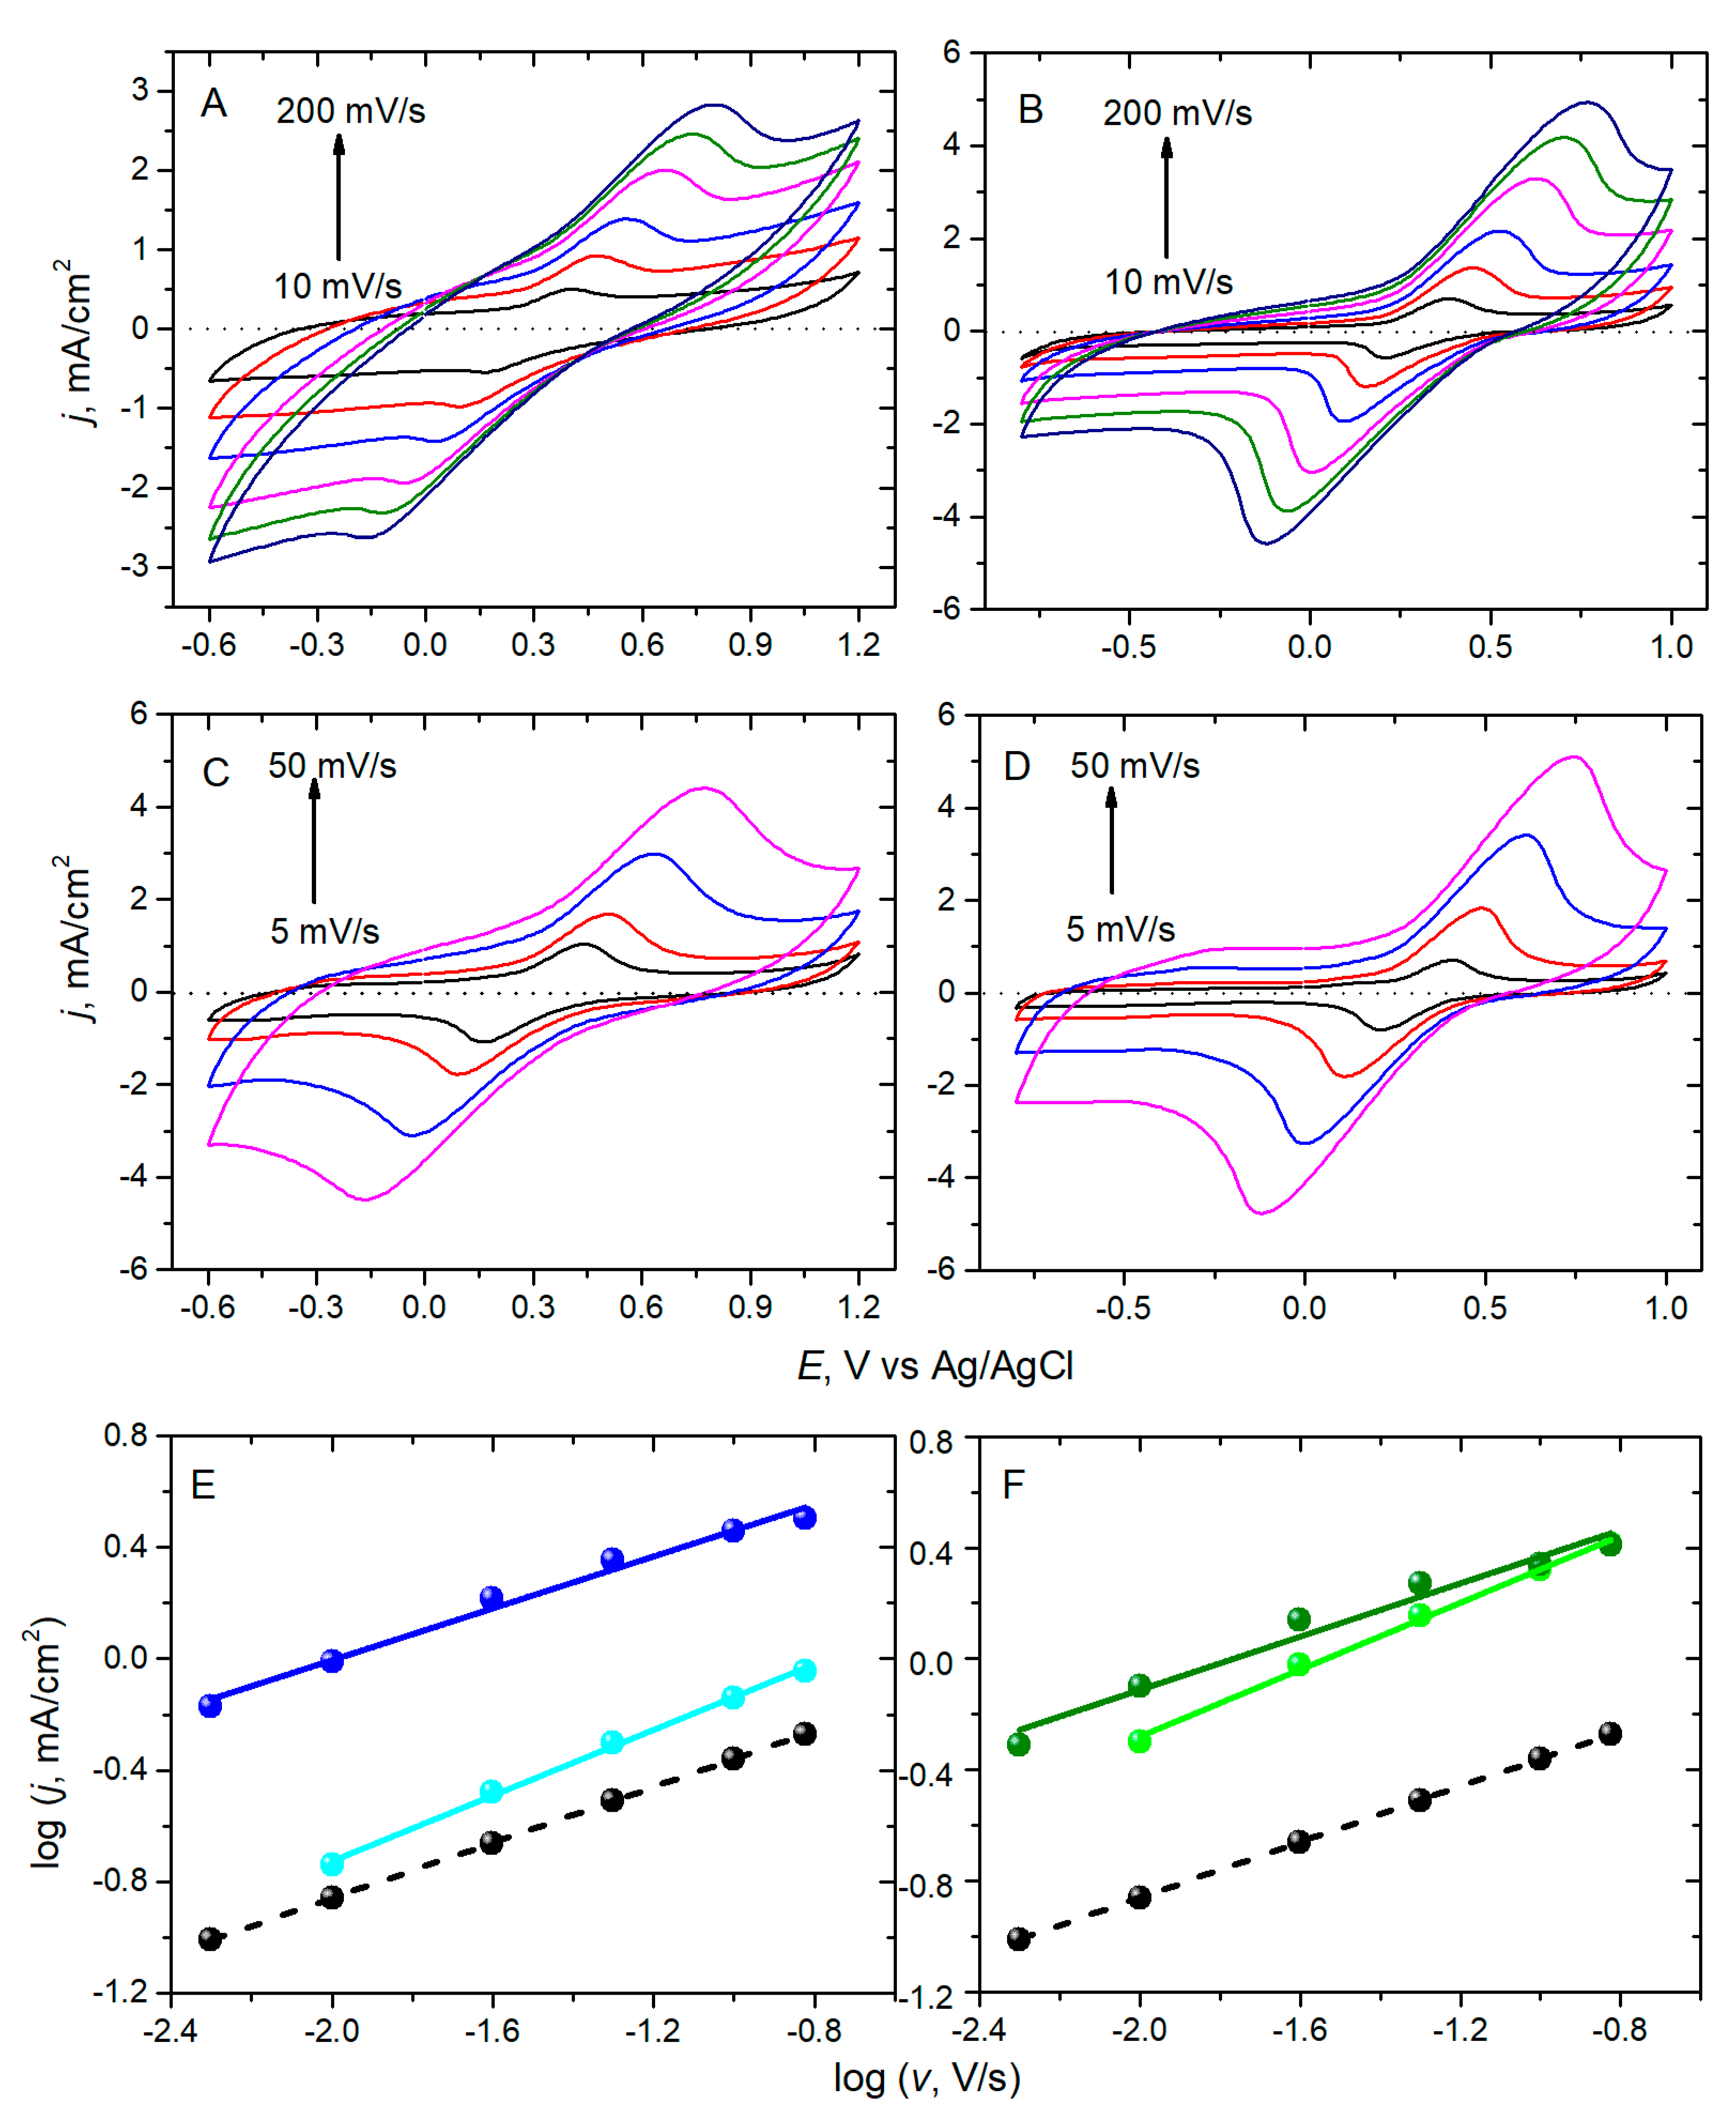
- Electrochemical investigation with the redox probe demonstrated that diffusion is a limiting process at the bare and modified LIG electrodes. A capacitive behaviour was observed from EIS spectra at bare electrodes showing a rather rough interface at LIG355 but a microporous one at LIG532 in the negative and positive potential regions. Diffusion of electroactive species was observed at Chit/LIG532 because the Randles equivalent circuit was fitting the spectra. However, this equivalent circuit was not fitting to the PFA/Chit/LIG532 spectra because diffusion was not a limiting step at this modified electrode.
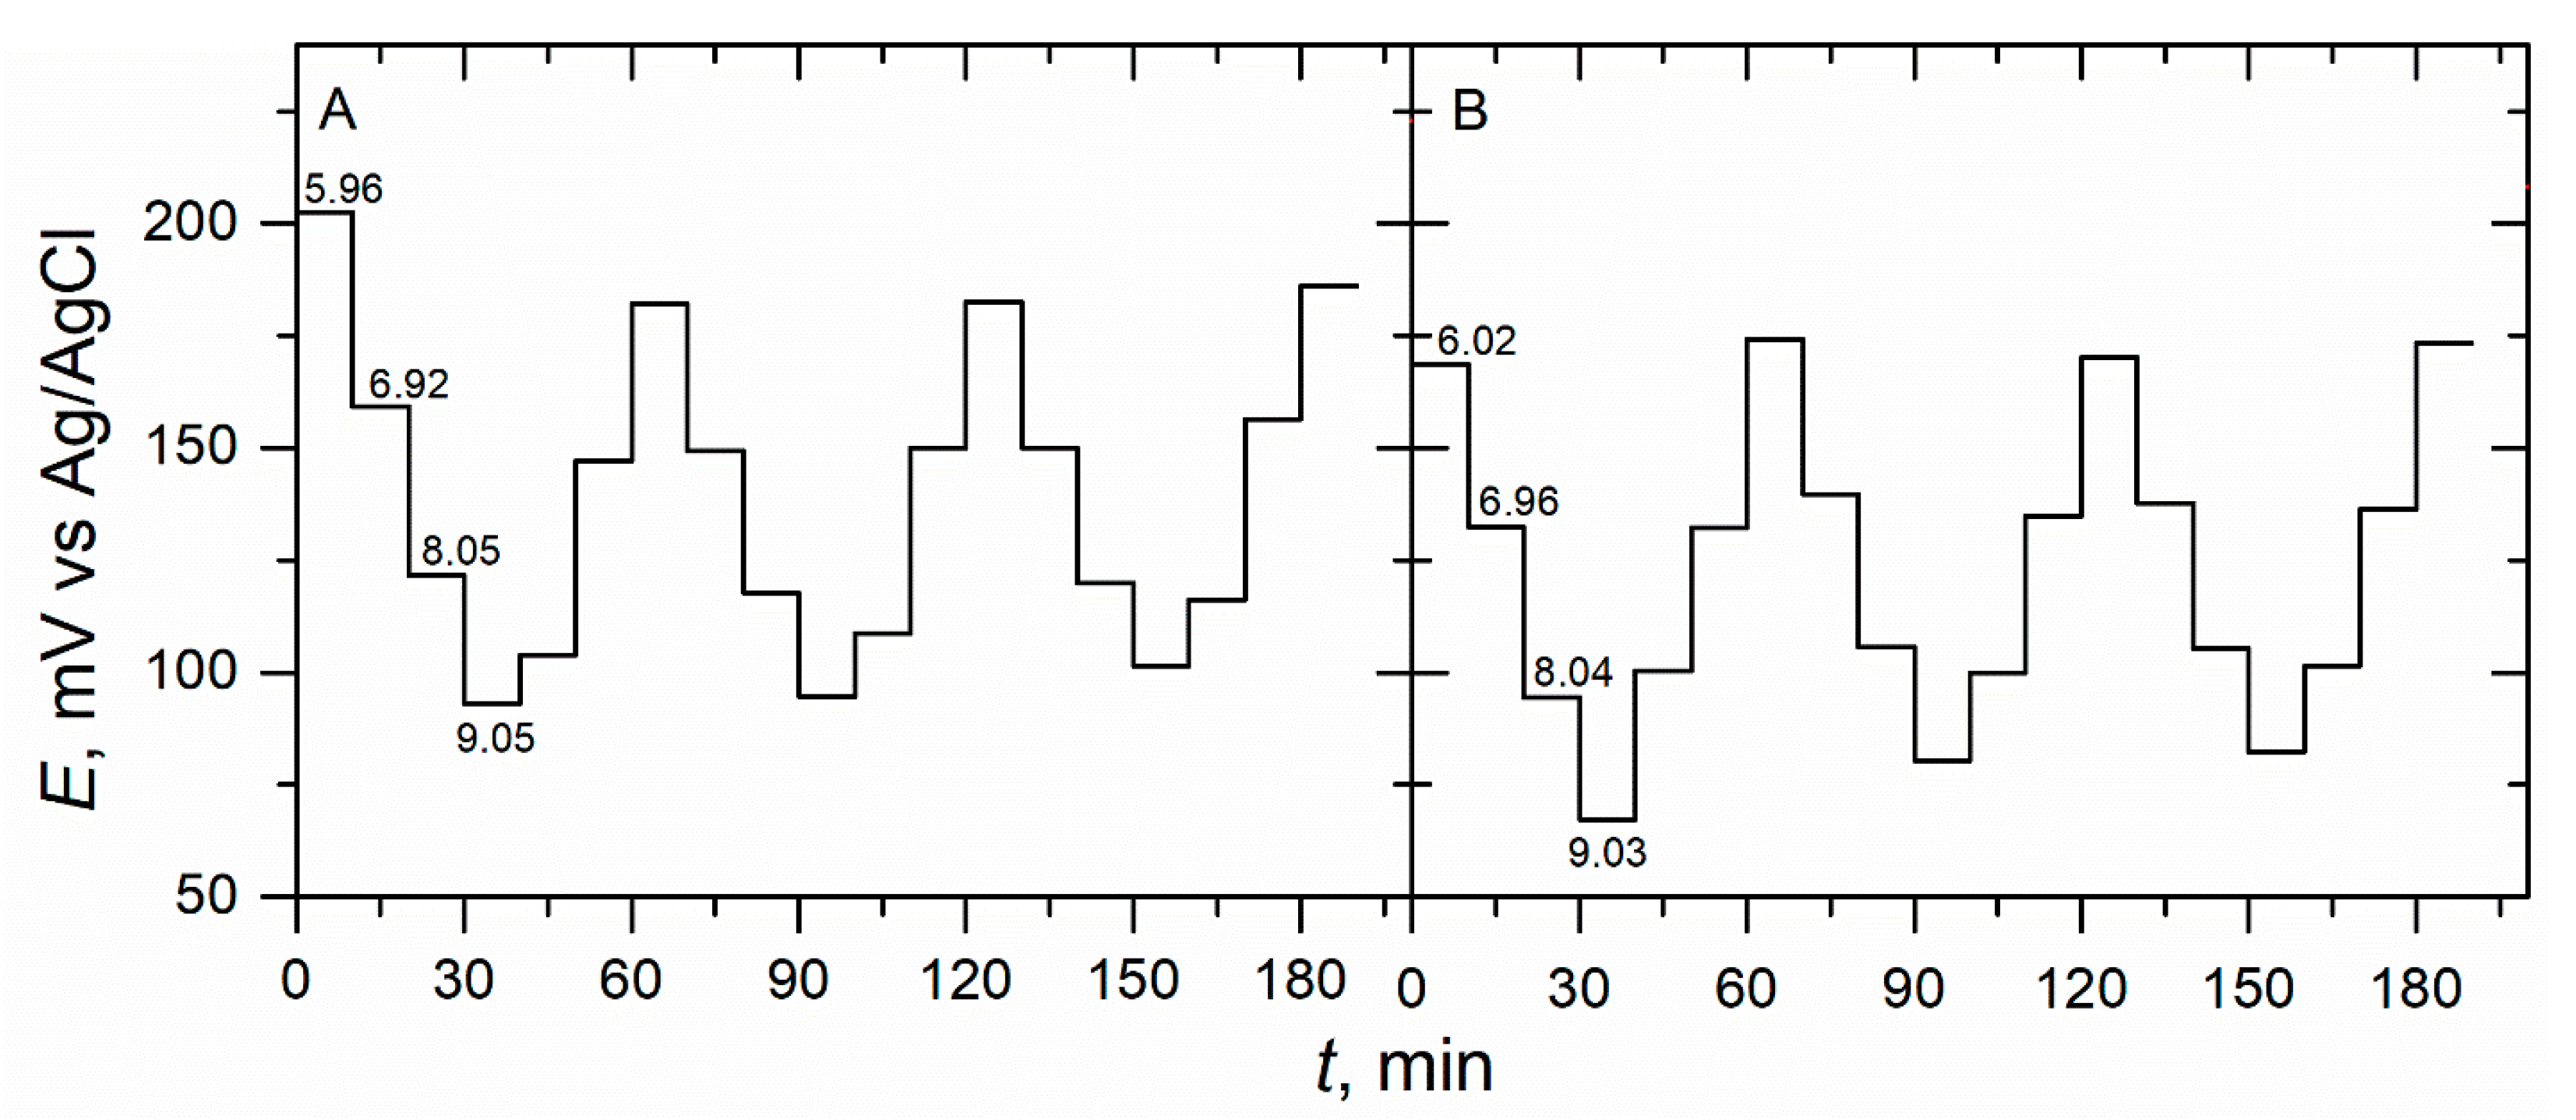
- The developed flat and flexible electrode was sensitive to pH in the region from 6.0 to 9.0. In the studied pH range, the sensitivity was 27.86 ± 0.81 for PFA/Chit/LIG355 and 30.32 ± 0.50 mV/pH for PFA/Chit/LIG532 with moderate stability for a period of more than two months.
- The deviation from pH-meter values was down to 1% for PFA/Chit/LIG355 sensor and down to 0.5% for PFA/Chit/LIG532 sensor. The disadvantage of PFA/Chit/LIG355 was just pure reproducibility in terms of voltammetric characterisation.
Supplementary Materials
Author Contributions
Funding
Institutional Review Board Statement
Informed Consent Statement
Acknowledgments
Conflicts of Interest
References
- Dixit, N.; Singh, S.P. Laser-induced graphene (LIG) as a smart and sustainable material to restrain pandemics and endemics: A perspective. ACS Omega 2022, 7, 5112–5130. [Google Scholar] [CrossRef] [PubMed]
- Marengo, M.; Marinaro, G.; Kosel, J. Flexible temperature and flow sensor from laser-induced graphene. In Proceedings of the 2017 IEEE Sensors, Glasgow, UK, 27 October–1 November 2017; pp. 1–3. [Google Scholar] [CrossRef]
- Rahimi, R.; Ochoa, M.; Yu, W.; Ziaie, B. Highly stretchable and sensitive unidirectional strain sensor via laser carbonization. ACS Appl. Mater. Interfaces 2015, 7, 4463–4470. [Google Scholar] [CrossRef] [PubMed]
- In, J.B.; Hsia, B.; Yoo, J.H.; Hyun, S.; Carraro, C.; Maboudian, R.; Grigoropoulos, C.P. Facile fabrication of flexible all solid-state micro-supercapacitor by direct laser writing of porous carbon in polyimide. Carbon 2015, 83, 144–151. [Google Scholar] [CrossRef]
- Cheng, C.; Wang, S.; Wu, J.; Yu, Y.; Li, R.; Eda, S.; Chen, J.; Feng, G.; Lawrie, B.; Hu, A. Bisphenol A sensors on polyimide fabricated by laser direct writing for onsite river water monitoring at attomolar concentration. ACS Appl. Mater. Interfaces 2016, 8, 17784–17792. [Google Scholar] [CrossRef] [PubMed]
- Liu, W.; Huang, Y.; Peng, Y.; Walczak, M.; Wang, D.; Chen, Q.; Liu, Z.; Li, L. Stable wearable strain sensors on textiles by direct laser writing of graphene. ACS Appl. Nano Mater. 2020, 3, 283–293. [Google Scholar] [CrossRef] [Green Version]
- Fiodorov, V.; Ratautas, K.; Mockus, Z.; Trusovas, R.; Mikoliūnaitė, L.; Račiukaitis, G. Laser-assisted selective fabrication of copper traces on polymers by electroplating. Polymers 2022, 14, 781. [Google Scholar] [CrossRef]
- Trusovas, R.; Ratautas, K.; Račiukaitis, G.; Niaura, G. Graphene layer formation in pinewood by nanosecond and picosecond laser irradiation. Appl. Surf. Sci. 2019, 471, 154–161. [Google Scholar] [CrossRef]
- Kulyk, B.; Silva, B.F.R.; Carvalho, A.F.; Silvestre, S.; Fernandes, A.J.S.; Martins, R.; Fortunato, E.; Costa, F.M. Laser-induced graphene from paper for mechanical sensing. ACS Appl. Mater. Interfaces 2021, 13, 10210–10221. [Google Scholar] [CrossRef]
- Chyan, Y.; Ye, R.; Li, Y.; Singh, S.P.; Arnusch, C.J.; Tour, J.M. Laser-induced graphene by multiple lasing: Toward electronics on cloth, paper, and food. ACS Nano 2018, 12, 2176–2183. [Google Scholar] [CrossRef]
- Santos, N.F.; Pereira, S.O.; Moreira, A.; Girão, A.V.; Carvalho, A.F.; Fernandes, A.J.S.; Costa, F.M. IR and UV laser-induced graphene: Application as dopamine electrochemical sensors. Adv. Mater. Technol. 2021, 6, 2100007. [Google Scholar] [CrossRef]
- Vivaldi, F.M.; Dallinger, A.; Bonini, A.; Poma, N.; Sembranti, L.; Biagini, D.; Salvo, P.; Greco, F.; Francesco, F.D. Three-dimensional (3D) laser-induced graphene: Structure, properties, and application to chemical sensing. ACS Appl. Mater. Interfaces 2021, 13, 30245–30260. [Google Scholar] [CrossRef] [PubMed]
- Wang, L.; Wang, Z.; Bakhtiyari, A.N.; Zheng, H. A Comparative study of laser-induced graphene by CO2 infrared laser and 355 nm ultraviolet (UV) laser. Micromachines 2020, 11, 1094. [Google Scholar] [CrossRef] [PubMed]
- Wang, S.; Yu, Y.; Li, R.; Feng, G.; Wu, Z.; Compagnini, G.; Gulino, A.; Feng, Z.; Hu, A. High-performance stacked in-plane supercapacitors and supercapacitor array fabricated by femtosecond laser 3D direct writing on polyimide sheets. Electrochim. Acta 2017, 241, 153–161. [Google Scholar] [CrossRef]
- Peng, Z.; Lin, J.; Ye, R.; Samuel, E.L.G.; Tour, J.M. Flexible and stackable laser-induced graphene supercapacitors. ACS Appl. Mater. Interfaces 2015, 7, 3414–3419. [Google Scholar] [CrossRef]
- Barber, R.; Cameron, S.; Devine, A.; McCombe, A.; Pourshahidi, L.K.; Cundell, J.; Roy, S.; Mathur, A.; Casimero, C.; Papakonstantinou, P.; et al. Laser induced graphene sensors for assessing pH: Application to wound management. Electrochem. Commun. 2021, 123, 106914. [Google Scholar] [CrossRef]
- Ahmad, M.; Cantarella, G.; Angeli, M.A.C.; Madagalam, M.; Ebner, C.; Ciocca, M.; Riaz, R.; Ibba, P.; Petrelli, M.; Merino, I.; et al. 2.4 GHz microstrip patch antenna fabricated by means of laser induced graphitization of a cellulose-based paper substrate. In Proceedings of the 2021 IEEE International Flexible Electronics Technology Conference (IFETC), Columbus, OH, USA, 8–11 August 2021; pp. 44–46. [Google Scholar] [CrossRef]
- Wang, H.; Zhao, Z.; Liu, P.; Guo, X. A soft and stretchable electronics using laser-induced graphene on polyimide/PDMS composite substrate. Npj Flex. Electron. 2022, 6, 26. [Google Scholar] [CrossRef]
- Celiešiūtė, R.; Venckus, T.; Vaitekonis, Š.; Pauliukaite, R. Electrosynthesis and characterisation of poly(folic acid) films. Electrochim. Acta 2014, 138, 62–68. [Google Scholar] [CrossRef]
- Younis, I.R.; Stamatakis, M.K.; Callery, P.S.; Meyer-Stout, P.J. Influence of pH on the dissolution of folic acid supplements. Int. J. Pharm. 2009, 367, 97–102. [Google Scholar] [CrossRef]
- Venckus, T.; Celiešiūtė, R.; Radzevič, A.; Rakickas, T.; Vaitekonis, Š.; Ruelė, Ž.; Pauliukaite, R. Application of polyfolates in the development of electrochemical glucose biosensors. Electroanalysis 2014, 26, 2273–2282. [Google Scholar] [CrossRef]
- He, M.; Zheng, X. A highly sensitive and selective method for dopamine detection based on poly(folic acid) film modified electrode. J. Mol. Liq. 2012, 173, 29–34. [Google Scholar] [CrossRef]
- Žutautas, V.; Jelinskas, T.; Pauliukaite, R. A novel sensor for electrochemical pH monitoring based on polyfolate. J. Electroanal. Chem. 2022, 921, 116668. [Google Scholar] [CrossRef]
- Miao, Y.; Chen, J.; Fang, K. New technology for the detection of pH. J. Biochem. Biophys. Methods 2005, 63, 1–9. [Google Scholar] [CrossRef]
- Khan, M.I.; Khan, A.M.; Nouman, A.; Azhar, M.I.; Saleem, M.K. pH sensing materials for MEMS sensors and detection techniques. In Proceedings of the International Conference on Solid-State and Integrated Circuit, Singapore, 17–18 March 2012; IACSIT Press: Singapore, 2012; Volume 32, pp. 18–22. [Google Scholar]
- Chinnam, K.C. Capacitive pH-Sensors Using pH Sensitive Polymer. Master’s Thesis, Linköping University, Linköping, Sweden, 2009. [Google Scholar]
- Abu-Thabit, N.; Hakeem, A.S.; Mezghani, K.; Ratemi, E.; Elzagheid, M.; Umar, Y.; Primartomo, A.; Al Batty, S.; Azad, A.K.; Al Anazi, S.; et al. Preparation of pH-Indicative and flame-retardant nanocomposite films for smart packaging applications. Sensors 2020, 20, 5462. [Google Scholar] [CrossRef] [PubMed]
- Kumar, S.; Bansod, B.S.; Thakur, R.; Jharval, M. Soil pH sensing techniques and technologies—A review. Int. J. Adv. Res. Electric. Electron. Instrument. Eng. 2015, 4, 4452–4456. [Google Scholar]
- Abu-Thabit, N.; Umar, Y.; Ratemi, E.; Ahmad, A.; Abuilaiwi, F.A. A flexible optical pH sensor based on polysulfone membranes coated with pH-responsive polyaniline nanofibers. Sensors 2016, 16, 986. [Google Scholar] [CrossRef] [PubMed] [Green Version]
- Scholz, F. From the Leiden jar to the discovery of the glass electrode by Max Cremer. J. Solid State Electrochem. 2011, 15, 5–14. [Google Scholar] [CrossRef]
- Lange, U.; Roznyatovskaya, N.V.; Mirsky, V.M. Conducting polymers in chemical sensors and arrays. Anal. Chim. Acta 2008, 614, 1–26. [Google Scholar] [CrossRef]
- Brownson, D.A.C.; Kampouris, D.K.; Banks, C.E. Graphene electrochemistry: Fundamental concepts through to prominent applications. Chem. Soc. Rev. 2012, 41, 6944–6976. [Google Scholar] [CrossRef]
- Eng, A.Y.S.; Chua, C.K.; Pumera, M. Intrinsic electrochemical performance and precise control of surface porosity of graphene-modified electrodes using the drop-casting technique. Electrochem. Commun. 2015, 59, 86–90. [Google Scholar] [CrossRef]
- Huang, Q.; Loveridge, M.J.; Genieser, R.; Lain, M.J.; Bhagat, R. Electrochemical evaluation and phase-related impedance studies on silicon–few layer graphene (FLG) composite electrode systems. Sci. Rep. 2018, 8, 1386. [Google Scholar] [CrossRef] [Green Version]
- Pauliukaite, R.; Ghica, M.E.; Fatibello-Filho, O.; Brett, C.M.A. Electrochemical impedance studies of chitosan-modified electrodes for application in electrochemical sensors and biosensors. Electrochim. Acta 2010, 55, 6239–6247. [Google Scholar] [CrossRef]
- Lasia, A. Impedance of porous electrodes. ECS Trans. 2008, 13, 1–18. [Google Scholar] [CrossRef]
- Huang, J.; Gao, Y.; Luo, J.; Wang, S.; Li, C.; Chen, S.; Zhang, J. Editors’ Choice—Review—Impedance response of porous electrodes: Theoretical framework, physical models and applications. J. Electrochem. Soc. 2020, 167, 166503. [Google Scholar] [CrossRef]
- Nguyen, T.Q.; Breitkopf, C. Determination of diffusion coefficients using impedance spectroscopy data. J. Electrochem. Soc. 2018, 165, 826–831. [Google Scholar] [CrossRef]
- Žemaitis, A.; Mimidis, A.; Papadopoulos, A.; Gečys, P.; Račiukaitis, G.; Stratakis, E.; Gedvilas, M. Controlling the wettability of stainless steel from highly-hydrophilic to super-hydrophobic by femtosecond laser-induced ripples and nanospikes. RSC Adv. 2020, 62, 37956–37961. [Google Scholar] [CrossRef]
- Agrawal, G.; Negi, Y.S.; Pradhan, S.; Dash, M.; Samal, S.K. Wettability and contact angle of polymeric biomaterials. In Characterization of Polymeric Biomaterials; Woodhead Publishing: Sawston, UK, 2017; pp. 57–81. [Google Scholar] [CrossRef]
- Hubbe, M.A. Why, after all, are chitosan films hydrophobic? BioResources 2019, 14, 7630–7631. [Google Scholar] [CrossRef]
- Rahimi, R.; Ochoa, M.; Tamayol, A.; Khalili, S.; Khademhosseini, A.; Ziaie, B. Highly stretchable potentiometric pH sensor fabricated via laser carbonization and machining of carbon- polyaniline composite. ACS Appl. Mater. Interfaces 2017, 9, 9015–9023. [Google Scholar] [CrossRef]
- Zhang, L.; Wang, L.; Li, J.; Cui, C.; Zhou, Z.; Wen, L. Surface engineering of laser-induced graphene enables long-term monitoring of on-body uric acid and pH simultaneously. Nano Lett. 2022, 22, 5451–5458. [Google Scholar] [CrossRef]
- Lampinen, A.; See, E.; Emelianov, A.; Myllyperkiö, P.; Johansson, A.; Pettersson, M. Laser-induced tuning of graphene field-effect transistors for pH sensing. Phys. Chem. Chem. Phys. 2023, 25, 10778–10784. [Google Scholar] [CrossRef]


| Sample | LIG355 | LIG532 |
|---|---|---|
| Wavelength, nm | 355 | 532 |
| Irradiation power, mW | 200 | 500 |
| Scanning speed, mm/s | 10 | 50 |
| Repeat times | 5 | 5 |
| Hatch, μm | 10 | 10 |
| Position regarding beam focus | 4 mm above the focus | At the focus |
| Sample | LIG355 | LIG532 |
|---|---|---|
| FWHM (D), cm−1 | 88.2 | 79.7 |
| FWHM (G), cm−1 | 77.6 | 71.5 |
| FWHM (2D), cm−1 | 131 | 106.4 |
| Electrode | Sensitivity, mV/pH |
|---|---|
| PFA/LIG355 | 28.41 ± 1.01 |
| PFA/LIG532 | 34.27 ± 2.09 |
| PFA/Chit/LIG355 | 27.86 ± 0.97 |
| PFA/Chit/LIG532 | 30.32 ± 0.06 |
Disclaimer/Publisher’s Note: The statements, opinions and data contained in all publications are solely those of the individual author(s) and contributor(s) and not of MDPI and/or the editor(s). MDPI and/or the editor(s) disclaim responsibility for any injury to people or property resulting from any ideas, methods, instructions or products referred to in the content. |
© 2023 by the authors. Licensee MDPI, Basel, Switzerland. This article is an open access article distributed under the terms and conditions of the Creative Commons Attribution (CC BY) license (https://creativecommons.org/licenses/by/4.0/).
Share and Cite
Žutautas, V.; Trusovas, R.; Sartanavičius, A.; Ratautas, K.; Selskis, A.; Pauliukaite, R. A Sensor for Electrochemical pH Monitoring Based on Laser-Induced Graphene Modified with Polyfolate. Chemosensors 2023, 11, 329. https://doi.org/10.3390/chemosensors11060329
Žutautas V, Trusovas R, Sartanavičius A, Ratautas K, Selskis A, Pauliukaite R. A Sensor for Electrochemical pH Monitoring Based on Laser-Induced Graphene Modified with Polyfolate. Chemosensors. 2023; 11(6):329. https://doi.org/10.3390/chemosensors11060329
Chicago/Turabian StyleŽutautas, Vytautas, Romualdas Trusovas, Aivaras Sartanavičius, Karolis Ratautas, Algirdas Selskis, and Rasa Pauliukaite. 2023. "A Sensor for Electrochemical pH Monitoring Based on Laser-Induced Graphene Modified with Polyfolate" Chemosensors 11, no. 6: 329. https://doi.org/10.3390/chemosensors11060329