Article

Enhanced Fluorescence in a Lens-Less Fiber-Optic Sensor for C-Reactive Protein Detection

1
National Institute of Optics (CNR-INO), c/o LENS, Via Nello Carrara 1, 50019 Sesto Fiorentino, Italy
2
European Laboratory for Non-Linear Spectroscopy (LENS), Via Nello Carrara 1, 50019 Sesto Fiorentino, Italy
3
Institute of Applied Physics “Nello Carrara” (IFAC), National Research Council of Italy (CNR), Via Madonna del Piano 10, 50019 Sesto Fiorentino, Italy
4
GeSiM Gesellschaft fuer Silizium-Mikrosysteme mbH, Bautzner Landstraße 45, 01454 Radeberg, Germany
5
Cecchi S.R.L., Viadotto del Ponte all’Indiano 20, 50142 Firenze, Italy
*
Author to whom correspondence should be addressed.
These authors contributed equally to this work.
A.G. and C.T. are to be considered both as last authors.
Chemosensors 2023, 11(8), 448; https://doi.org/10.3390/chemosensors11080448
Submission received: 30 June 2023 / Revised: 1 August 2023 / Accepted: 7 August 2023 / Published: 11 August 2023

Abstract

:
In today’s medicine, the celerity of the bio-assays analysis is crucial for the timely selection of the appropriate therapy and hence its effectiveness, especially in case of diseases characterized by the late onset of symptoms. In this paper, a lens-less fiber optics-based fluorescence sensor designed for the measurement of labeled bio-assays is presented and its potential for the early diagnosis of sepsis via C-reactive protein (CRP) detection is demonstrated. The sensor performance results from the combination of two key elements: a planar antenna that redirects fluorescence the marker emission and an automated fiber-based optical system for multi-spot analysis. First, the working principle of the device is demonstrated with a well-established antibody–antigen format (immunoglobulin IgG/anti-IgG assay), reporting more than one order of magnitude enhanced limit of detection (LOD) and limit of quantification (LOQ) for the planar antenna with respect to a standard glass substrate. The prototype is then tested against a sample mimicking a realistic case, prepared with commercially available human serum, showing a LOD and LOQ in the clinical range of interest (0.0015 μg/mL and 0.005 μg/mL, respectively) for the investigation of the sepsis biomarker CRP. These results validate the developed prototype as a simple and easy-to-operate device, compatible with standardized micro-well arrays, and potentially suitable for POC applications.

1. Introduction

Early stage diagnosis of diseases, especially when characterized by the late onset of symptoms, is crucial for the timely selection of the appropriate therapy and its effectiveness on the patient’s evolution. However, the celerity of the bio-tests analysis is typically restrained by time-consuming procedures, complex data processing, and interpretation, which need the presence of specialists, and, above all, the requirement for expensive instrumentation only accessible in centralized laboratories. In this context, the development of alternative techniques and devices for an easy, fast, and efficient detection of biomolecules has become a growing field involving multidisciplinary expertise [1,2,3,4,5,6,7,8], with the limit of detection and limit of quantification becoming an essential parameter in the early stage diagnosis of diseases.
In particular, optical biosensors allow for the detection of biomolecules upon their interaction with light via label-based or label-free techniques, and they have become well-established solutions for a wide variety of analytes such as, among others, proteins, viruses, antibodies, or toxins [9]. Indeed, the high specificity and sensitivity to the target, reproducibility, robustness, low required sample volumes, and the potential to be integrated into compact, portable, and multiplexed platforms for points-of-care (POC) testing [10,11], make them reliable and convenient devices for early diagnosis. Additionally, optical sensors can leverage several widespread photonic and plasmonic techniques to improve collection efficiency and signal sensitivity. Significant examples of such scenarios are biosensors based on surface plasmon resonances (SPR) [12,13], localized surface plasmon resonances (LSPR) [14,15], lossy mode resonance (LMR) [16,17], nanogap antennas [18], evanescent wave fluorescence and optical waveguide interferometry [19,20], surface-enhanced Raman spectroscopy (SERS) [21,22], and optofluidic Fabry–Pérot cavities [23,24].
While label-based methods offer more flexibility and, potentially, single-molecule sensitivity, the collection of light from fluorescent markers is a challenging task, owing to their characteristic dipolar radiation pattern. Thus, complex microscope systems are required to achieve a high collection efficiency. A promising strategy to overcome such technical limitations relies on the integration of the emitters in a planar optical antenna [25,26] or nanoapertures surrounded by periodic corrugations (known as corrugated “bull’s eye” apertures) [27], for enhancing the directionality of the emission toward the interrogation direction. As recently demonstrated, both solutions allow beaming the dipole fluorescence emission into a narrow cone, but the former also involves a very simple and cost-effective fabrication, avoiding the demand for nanofabrication capabilities and precise positioning of the emitters [25]. Moreover, a simplified version of the device is readily obtained by introducing a reflective mirror layer buried in the glass slide where the assay is prepared, hence leaving complete optical access from the upper side. Upon the optimization of the geometrical parameters, even in such a simple configuration, the one-side planar antenna successfully funnels the dipolar radiation pattern into a single lobe around the vertical direction, resulting in high collection efficiency with limited numerical apertures, while also allowing direct coupling to optical fibers [28]. Figure 1 shows the expected radiation patterns for fluorophores deposited on a simple glass (a) and on the modified antenna-like substrate (b). The curves are original simulations performed for this work with a semi-analytic method presented in detail in ref. [25]. The effectiveness of the structure is evident, with an expected gain factor of around 4 in case of N.A. limited to 0.5. Moreover, the modification of the radiation pattern leads to an enhancement of the pumping efficacy, with a consequent reduction in the required illumination intensity, beneficial for the signal-to-noise ratio. Besides fundamental advantages for single-photon sources and nanoparticles detection, this photonic configuration has also been investigated in a scanning configuration [29] and applied to fluorescence-based biosensing, for instance in the detection of short DNA molecules labelled with the fluorescence dye ATTO-647N [30].
In this work, the planar-antenna design in combination with a home-built, fiber-coupled, and portable epi-fluorescence microscope system was exploited. By integrating the optical setup with a high-precision motorized stage for positioning the fiber facet over the assay, a low-cost, compact, automated, and alignment-free device for fluorescence detection was developed. In particular, the prototype performance was firstly tested against a gold standard for the performance assessment of optical biosensors. We have chosen the IgG/anti-IgG assay because of the high affinity of the biomolecules and the high reproducibility of the results [31,32,33]. Afterwards, the effect on the limit of detection (LOD) of introducing the antenna-like configuration was investigated for the specific immunoassay. Finally, the prototype was employed for the detection of the well-established sepsis biomarker C-reactive protein (CRP). In both cases, the performance of the prototype was validated upon comparison with a more expensive commercial fluorescence microscope system based on Zeiss Axio Observer Fluorescence Microscopy System with 5×, 0.12 N.A. objective lens, and Colibri source system (LED at 625 nm) (Zeiss, Oberkochen, Germany). As a result, comparing the employed antenna-like substrate with standard glass, a significant improvement in the LOD and LOQ value (of the order of 50×) was achieved for the IgG/anti-IgG assay. In addition, for the sepsis biomarker CRP and employing a complex matrix mimicking real sample conditions, our prototype presents an improved LOD and LOQ value compared to a commercial microscope, being relevant for the early diagnosis of sepsis.

2. Materials and Methods

2.1. Chemical and Biological Reagents

2.1.1. Reagents

Bovine serum albumin (BSA) and all the reagents for buffer preparation (phosphate-buffered saline (PBS), 40 mM, pH 7.4) were purchased from Sigma-Aldrich (Milan, Italy). 1-Ethyl-3-[3-dimethylaminopropyl] carbodiimide hydrochloride (EDC) and N-hydroxy succinimide (NHS) were purchased from Pierce (Rockford, IL, USA). Human serum (C-Reactive Protein Free Serum) was purchased by HyTest Ltd. (Turku, Finland).

2.1.2. IgG/Anti-IgG Assay

The immunoglobulins, Mouse IgG, and goat anti-mouse-IgG were purchased from Zymed Laboratories, Invitrogen Immunodetection (Milan, Italy), with second fluorescently labeled with ATTO-647N (excitation peak at 646 nm and emission peak at 664 nm). For simplicity, the labeled antibody will be named as anti-mouse-IgG*.

2.1.3. CRP Assay

C-reactive protein (CRP) (purified antigen) was purchased from Biodesign (Saco, ME, USA). The mouse monoclonal antibody anti-CRP, clone C5, used as capture antibody and was purchased from Meridian Life Science (Memphis, TN, USA). The mouse monoclonal antibody anti-CRP, clone C7, used as detection antibody and was labeled with AlexaFluor 647 dye (excitation peak at 651 nm and emission peak at 667 nm), it was purchased from Biotechne s.r.l. (Milan, Italy). For simplicity, the labeled antibody will be named as C7*.

2.2. Fabrication of the Chips

2.2.1. The Chip

Two different chips were used, a standard glass slide and a gold-coated glass slide, for the antenna-like configuration. The gold deposition was performed after a cleaning step of microscope slides (25 × 75 × 1 mm3), according to the following procedure: (1) wet acid cleaning in hydrogen peroxide/sulfuric acid 2:1, rinsing with ultrapure water, drying with N2 gas blow; (2) magnetron sputter coating with 10 nm Ti + 120 nm Au in 5 runs. The two types of chips were delivered to PolyAn GmbH, Berlin, Germany, for chemical functionalization. PolyAn’s microarray slides are functionalized with three-dimensional (3D)-surface chemistry consisting of a long-chain polymer containing a defined number of carboxylic groups used for the covalent immobilization of the antibodies and as dielectric spacer. The actual thickness of the whole organic ensemble (PolyAn’s functionalization and marked assay) was expected to be around 100 nm but not known with precision. In order to check if the distance between the fluorophores and the gold mirror is within the useful range (50 to 200 nm), we have also tested a modified version of the gold-coated substrate, in which an additional Silica layer of 70 nm was deposited by e-bream evaporation technique before PolyAn’s functionalization. Our findings reveal similar behavior for the two configurations, implying that the organic ensemble holds a total thickness between 50 and 120 nm.

2.2.2. Assay Protocol

The optimized protocol for the assay implementation, which is substantially the same for both assay formats, is performed with manual spotting of 1 μL of all the involved solutions:
  • functional groups (-COOH) activation by cross-linking chemistry (200 mM EDC and 50 mM NHS) for 30 min;
  • covalent immobilization of the capture antibody (IgG or clone C5 as anti-CRP antibody) (0.5 g/mL in PBS) for 60 min;
  • washing step with PBS repeated 3 times;
  • surface passivation with BSA (0.1% in PBS) for 30 min to prevent nonspecific adsorption onto the surface;
  • washing step with PBS repeated 3 times;
  • antigen interaction:
    (a)
    anti-mouse-IgG* (concentration range 0–0.1 mg/mL) in PBS for 30 min;
    (b)
    CRP in serum (concentration range 0–0.1 mg/mL) in human serum diluted 1:10 v/v in PBS for 30 min.
  • washing step with PBS repeated 3 times;
  • detection antibody interaction: Clone C7* (0.01 mg/mL) in PBS for 30 min;
  • washing step with PBS repeated 3 times.
It should be underlined that steps 8. and 9. are performed only for CRP assays. The resulting configuration of the sample chip consists in a macro-array of heterogeneous droplets corresponding to different concentrations of the analyte, with each droplet spot a few mm in size and separated by around 5–10 mm. In Figure 2a, as an example, the CRP sandwich is depicted, showing the three molecules (from bottom to top): C5 (orange), CRP (colorful), and C7* (gray), being the last one labeled with AlexaFluor 647 dye (blue star) that emits fluorescence above 650 nm.

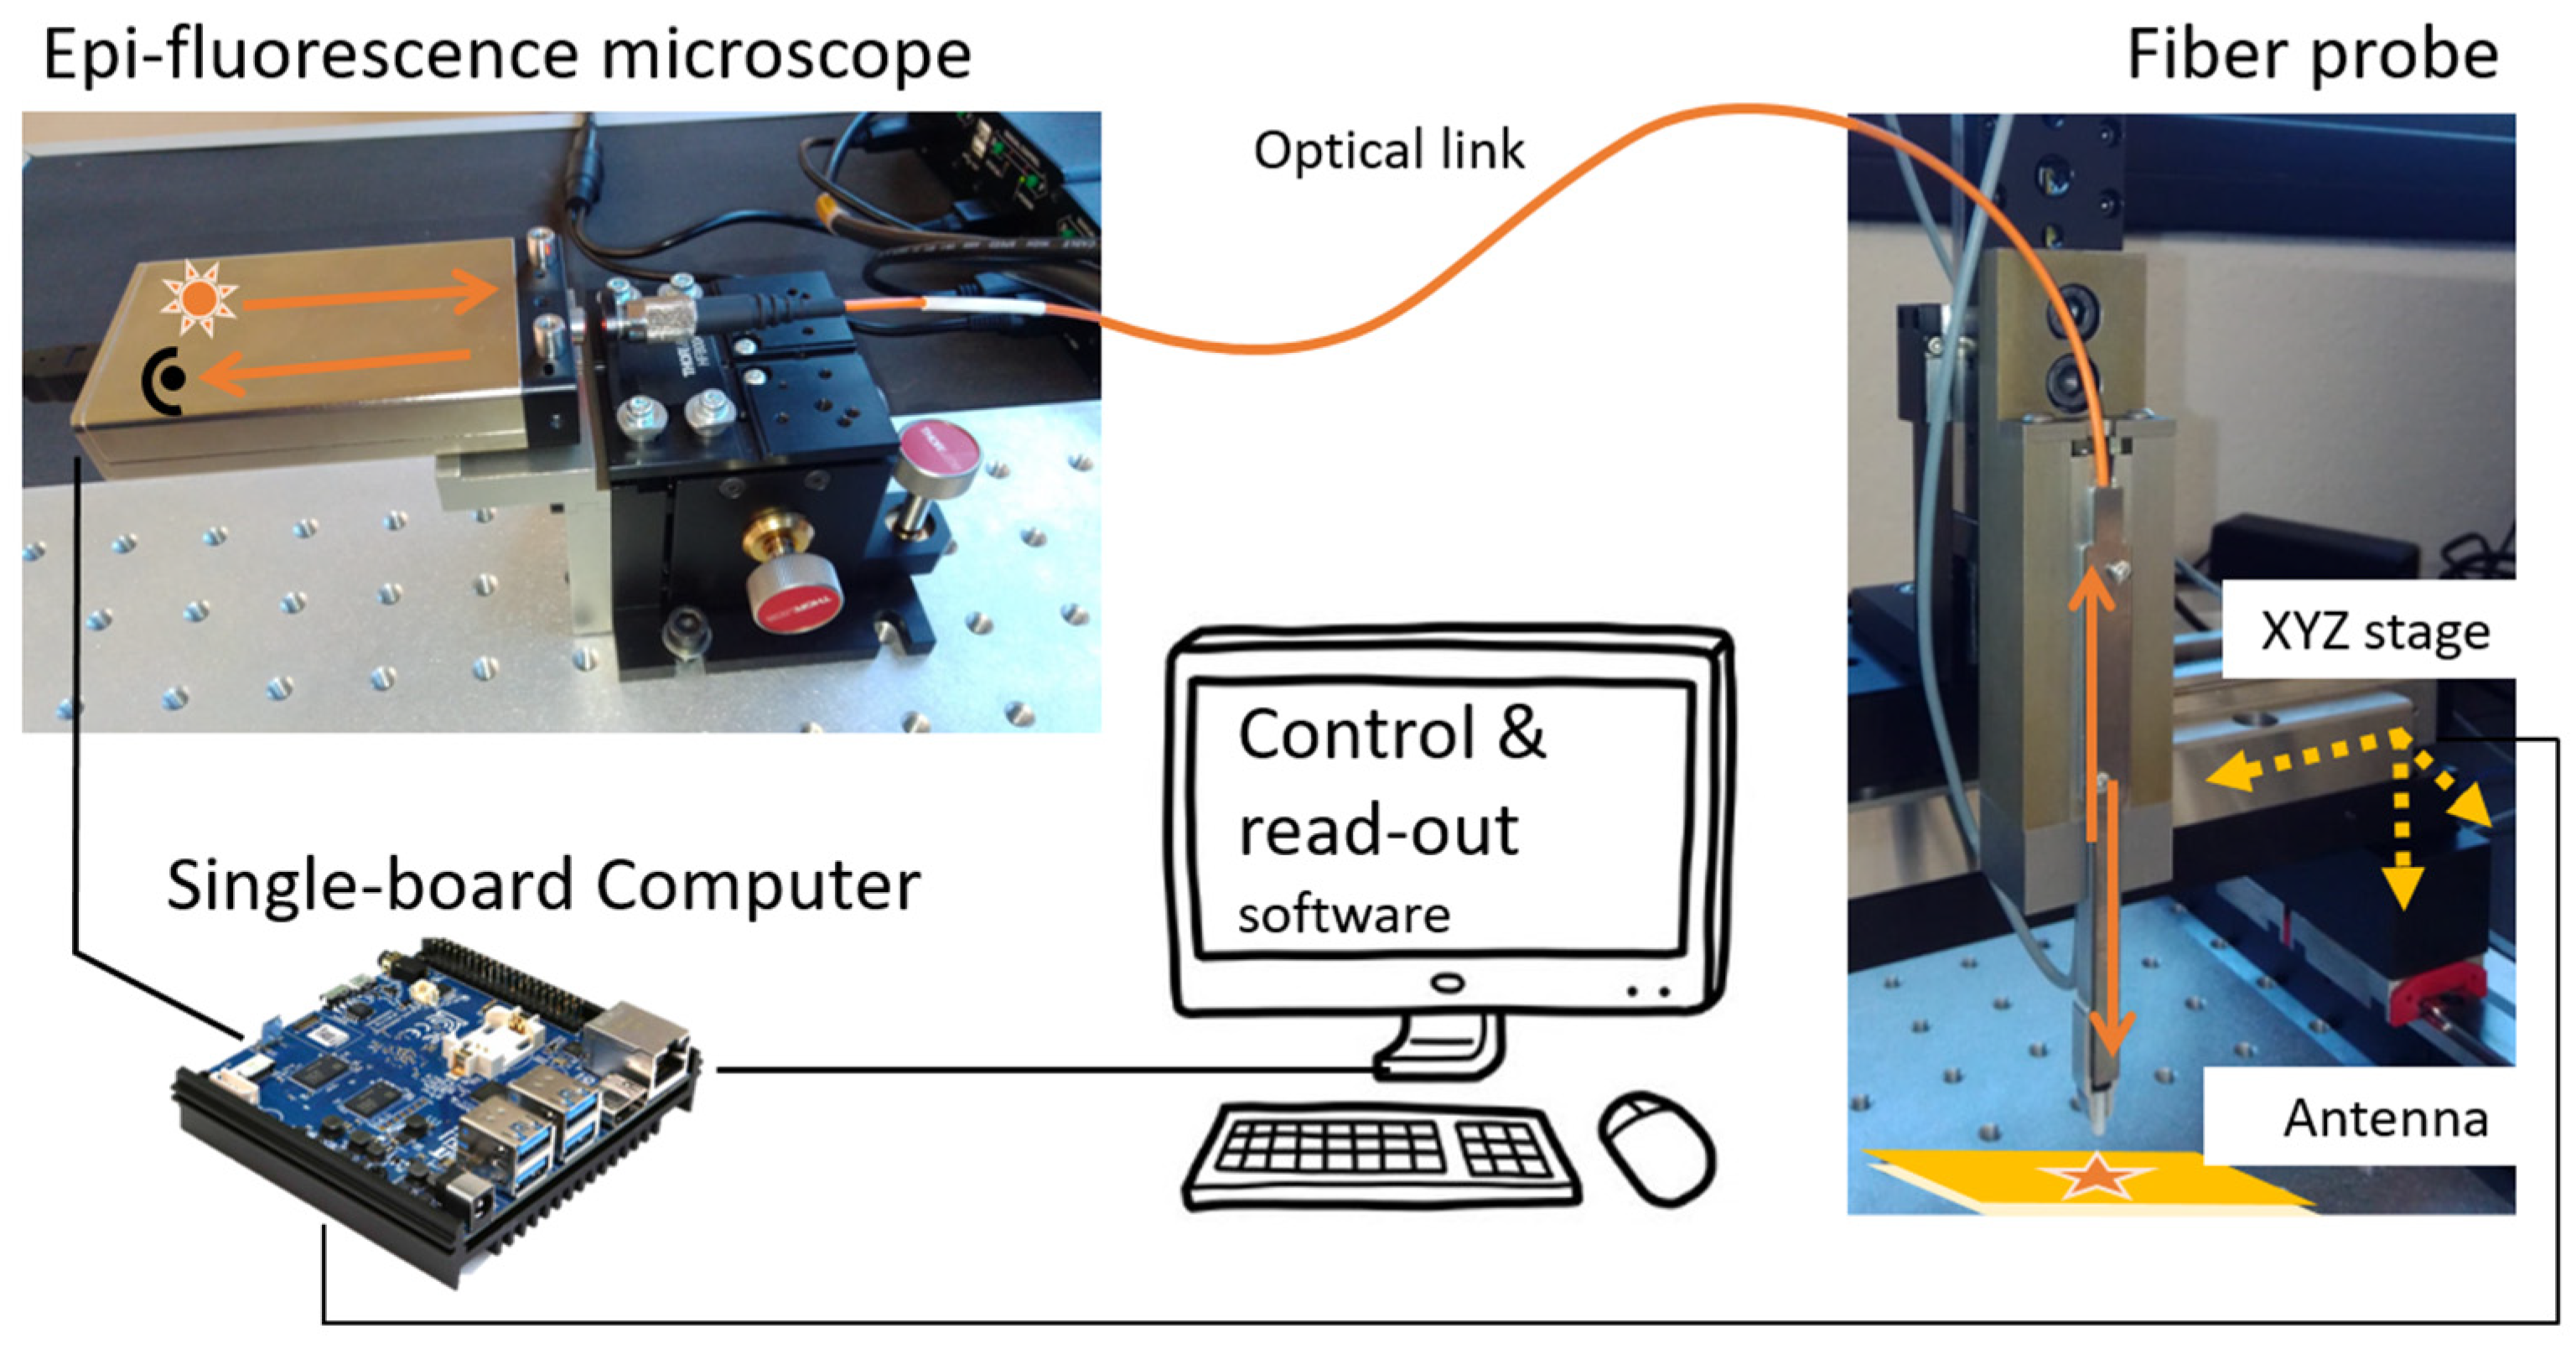
2.3. Sensor Prototype

The homemade prototype (see Figure 2b) was designed as a combination of commercially available elements to directly evaluate the accessible capabilities and costs on a routine production scale. It consists of the following components, properly selected as an optimal compromise among cost-effectiveness, capabilities, and ease of operation:
  • a compact epi-fluorescence microscope system (Qiagen Eselog), whose optical scheme is sketched in Figure 2b, which comprises a LED source emitting at 640 nm as excitation source, lenses, and optical filters for the selective collection of fluorescence emitted around 670 nm, and a photodetector for the evaluation of the signal intensity;
  • a 3D motorized translation stage with few micrometer repeatability and more than 10 cm scan range in the three directions (Standa 8-0048);
  • a multimode optical fiber (400 μm core-size, 0.5 N.A.), terminated on one side with a ceramic ferrule (operating as assay probe), and coupled on the other side to the detection system in free space, through a simple fiber launcher system (see Figure S1 in Supplementary Materials for measurements with 200 μm core-size);
  • a single-board mini-computer (Odroid N2+) equipped with a homemade software for the management of the measurement sequences and data storage.
A schematic drawing of the machine is presented in Figure 3.
The ferrule-terminated side of the fiber is steadily held by the translation stage in a vertical position, facing the assay housing, thanks to a custom mechanical support. The latter is equipped with a buttonhole and a contact probe, both operating in the vertical direction. In this way, the fiber facet can easily go in contact with the specimen in a reproducible way by setting the software in contact mode. Moreover, a 50 μm-thick Kapton tape ring is attached to the ferrule facet, in order to avoid direct contact of the fiber with the assay without blocking its aperture.
The homemade software, written in Python 3 for Linux operating systems, allows the integrated and automated control of both the mechanical and the optical elements of the prototype (see Movie S1, a video of the homemade prototype operation, in Supplementary Materials). The standard measurement sequence consists in moving the fiber to a preselected position and performing fluorescence intensity measurements. The procedure can be extended to a matrix of points around a set of positions. A simple user interface makes it possible to conveniently select all the operation parameters to configure automatic sets of measurements, such as the number of repetitions for each measurement, the LED intensity, the mapping size, and the separation among the measurements around each spot. The results are stored in a common-use file format in the hard disk.
Finally, the whole setup is protected by a home-built plexiglass box with size 35 × 40 × 55 cm and results in an overall compact device, which is the preliminary result for an ideal POC testing unit. In practice, the prototype allows for an automatically preconfigured series of background-corrected fluorescence measurements over printed micro- and macro-arrays and with continuous scanning of areas of up to several cm2 (see Figure S2 in Supplementary Materials for a panoramic view of the complete installation).

2.4. Measurement Protocol and Data Processing

In this work, owing to the handmade localization of the assay spots during the adopted preparation protocol, the operator manually positions the fiber probe over each droplet.
In the case of the prototype, the vertical approach of the optical fiber is guaranteed by means of a pressure sensor for standardized contact measurements, which stops the displacement of the probe once it rests with its weight on the glass. Firstly, the background fluorescence signal is evaluated averaging on 20 repeated measurements on the substrate outside of any drop: this value is used as zero in the following. Then, a predefined routine drives the machine in an automated probing of the area around the selected point, performing a series of measurements in a matrix of locations separated by 0.5 mm and with an integration time 0.5 s for each location. In particular, the matrix size is 3 × 3 pixels (1.5 mm × 1.5 mm) for the IgG/anti-IgG assay, which presents a high spatial homogeneity, and 15 × 15 pixels (7.5 mm × 7.5 mm) for the CRP assay, which shows larger variations of the fluorescence signal. Each measurement is repeated at least twice (i.e., at least in two different drops with the same nominal concentration) for statistical purposes (see Figure S3 in Supplementary Materials for the reproducibility of the measurements performed with the prototype). In the case of the heterogeneous CRP assays, from each scanned region, a central area of 6 × 6 pixels is selected to avoid edge effects such as the so-called coffee ring shape of the droplet accumulations, typical of dry assay (see Figure S4 in Supplementary Materials for the comparison between two procedures of selection of the 6 × 6 pixels central area). In this way, a background-corrected fluorescence intensity map is associated with each assay spot. The possibility offered by the prototype to map the fluorescence intensity opens up a wide range of potential applications in chip characterization and manufacturing quality control, for example to check the degree of homogeneity for the distribution of the labeled antibody molecules within the spot, or to identify possible systematic nonspecific binding that could lead to an unwanted systematic background (see Figure S5 in Supplementary Materials for examples of representative fluorescence intensity maps of inhomogeneous assays).
In the case of the commercial equipment, measurements are carried out on the same drops tested by the prototype. As with the prototype, the average value of the fluorescence signal is manually selected by taking only the central area of the droplet, so that fluorescence from the coffee ring shape is not considered. Hence, for each drop the average value of fluorescence intensity is measured with two different microscopes, and the fluorescence intensity corresponding to a given concentration for each microscope is obtained as the mean value among the drops with the same concentration, considering a deviation given by the maximum difference among the measured average values.
The calibration curves were obtained best fit to the data of the logistic function [34]
y = A 1     A 2 1   +     ( x / x 0 ) p   +   A 2
where A1 and A2 are the asymptotes of the resulting sigmoidal curve and their difference is the fluorescence dynamic change, x0 is the value of the analyte concentration for which the fluorescence signal is equal to 50% of the dynamic range (generally denoted with IC50), and p is a coefficient that is related to the slope of the sigmoidal curve for x = IC50.
The LOD and LOQ, which are the main features to assess the performance of a biosensing platform, are hence estimated as the concentration corresponding to the mean fluorescence signal exceeding the zero-concentration signal by three and ten times its standard deviation, respectively [35,36].

3. Results and Discussion

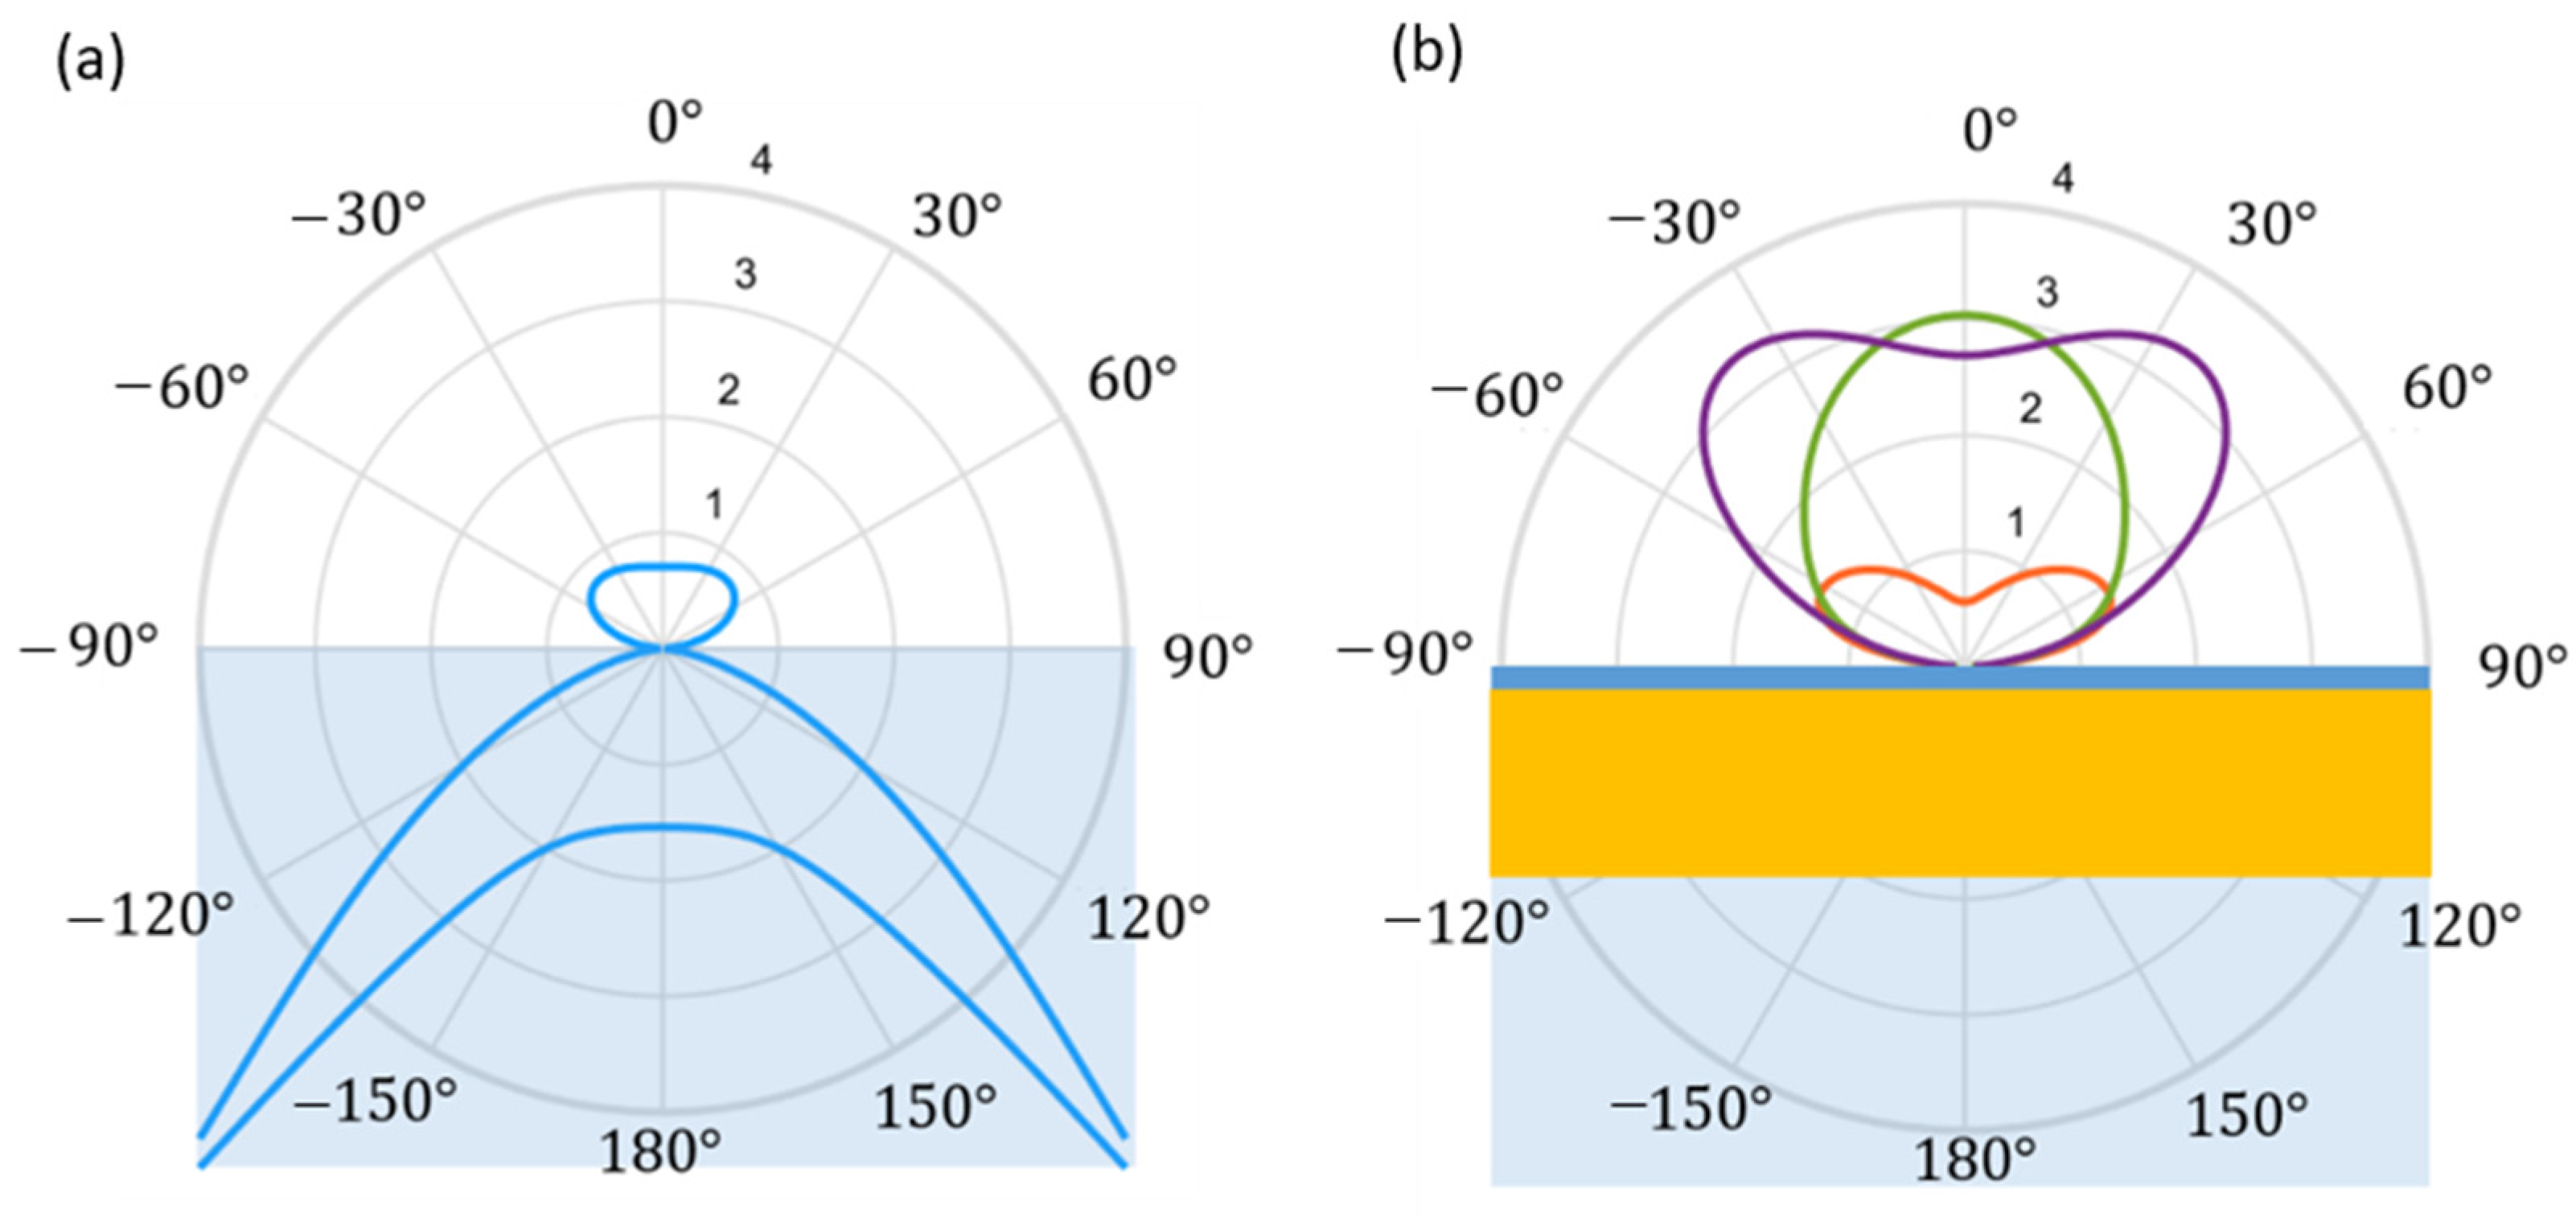
3.1. Prototype Working Principle

A sketch of the components forming the prototype is displayed in Figure 2a showing the typical scheme of the sandwich immunoassay, which consists of a chip where, in each isolated drop, the immunoassay is prepared in a heterogeneous configuration.
The chip is placed below the optical fiber probe (see Figure 2b), which scans the surface of the chip driven by the automated 3D translation stage. During the scan, the optical fiber connected to the epi-fluorescence microscope illuminates the sample with LED light, and it collects the fluorescence emitted by the sample at wavelengths around the emission peak of the dye, whose intensity is measured by the detector in the microscope. Therefore, the larger the intensity of the fluorescence signal, the higher the antigen concentration in the explored sample.
Measurements on an array of dried droplets with an increasing concentration of the target molecules provide the calibration curve for the specific immunoassay, from where information about the LOD and LOQ associated with the prototype is extracted. To improve the LOD and LOQ values of the system, the prototype is intended to be used with the specifically designed substrate presented above, which enhances the collection efficiency thanks to the antenna-like configuration that redirects fluorescence emission into a narrow cone around the polar axis.
In what follows, the results on the calibration curves are shown for two immunoassays prepared on chips in the simple antenna-like geometry, taking advantage of the enhanced collection efficiency provided by this configuration.

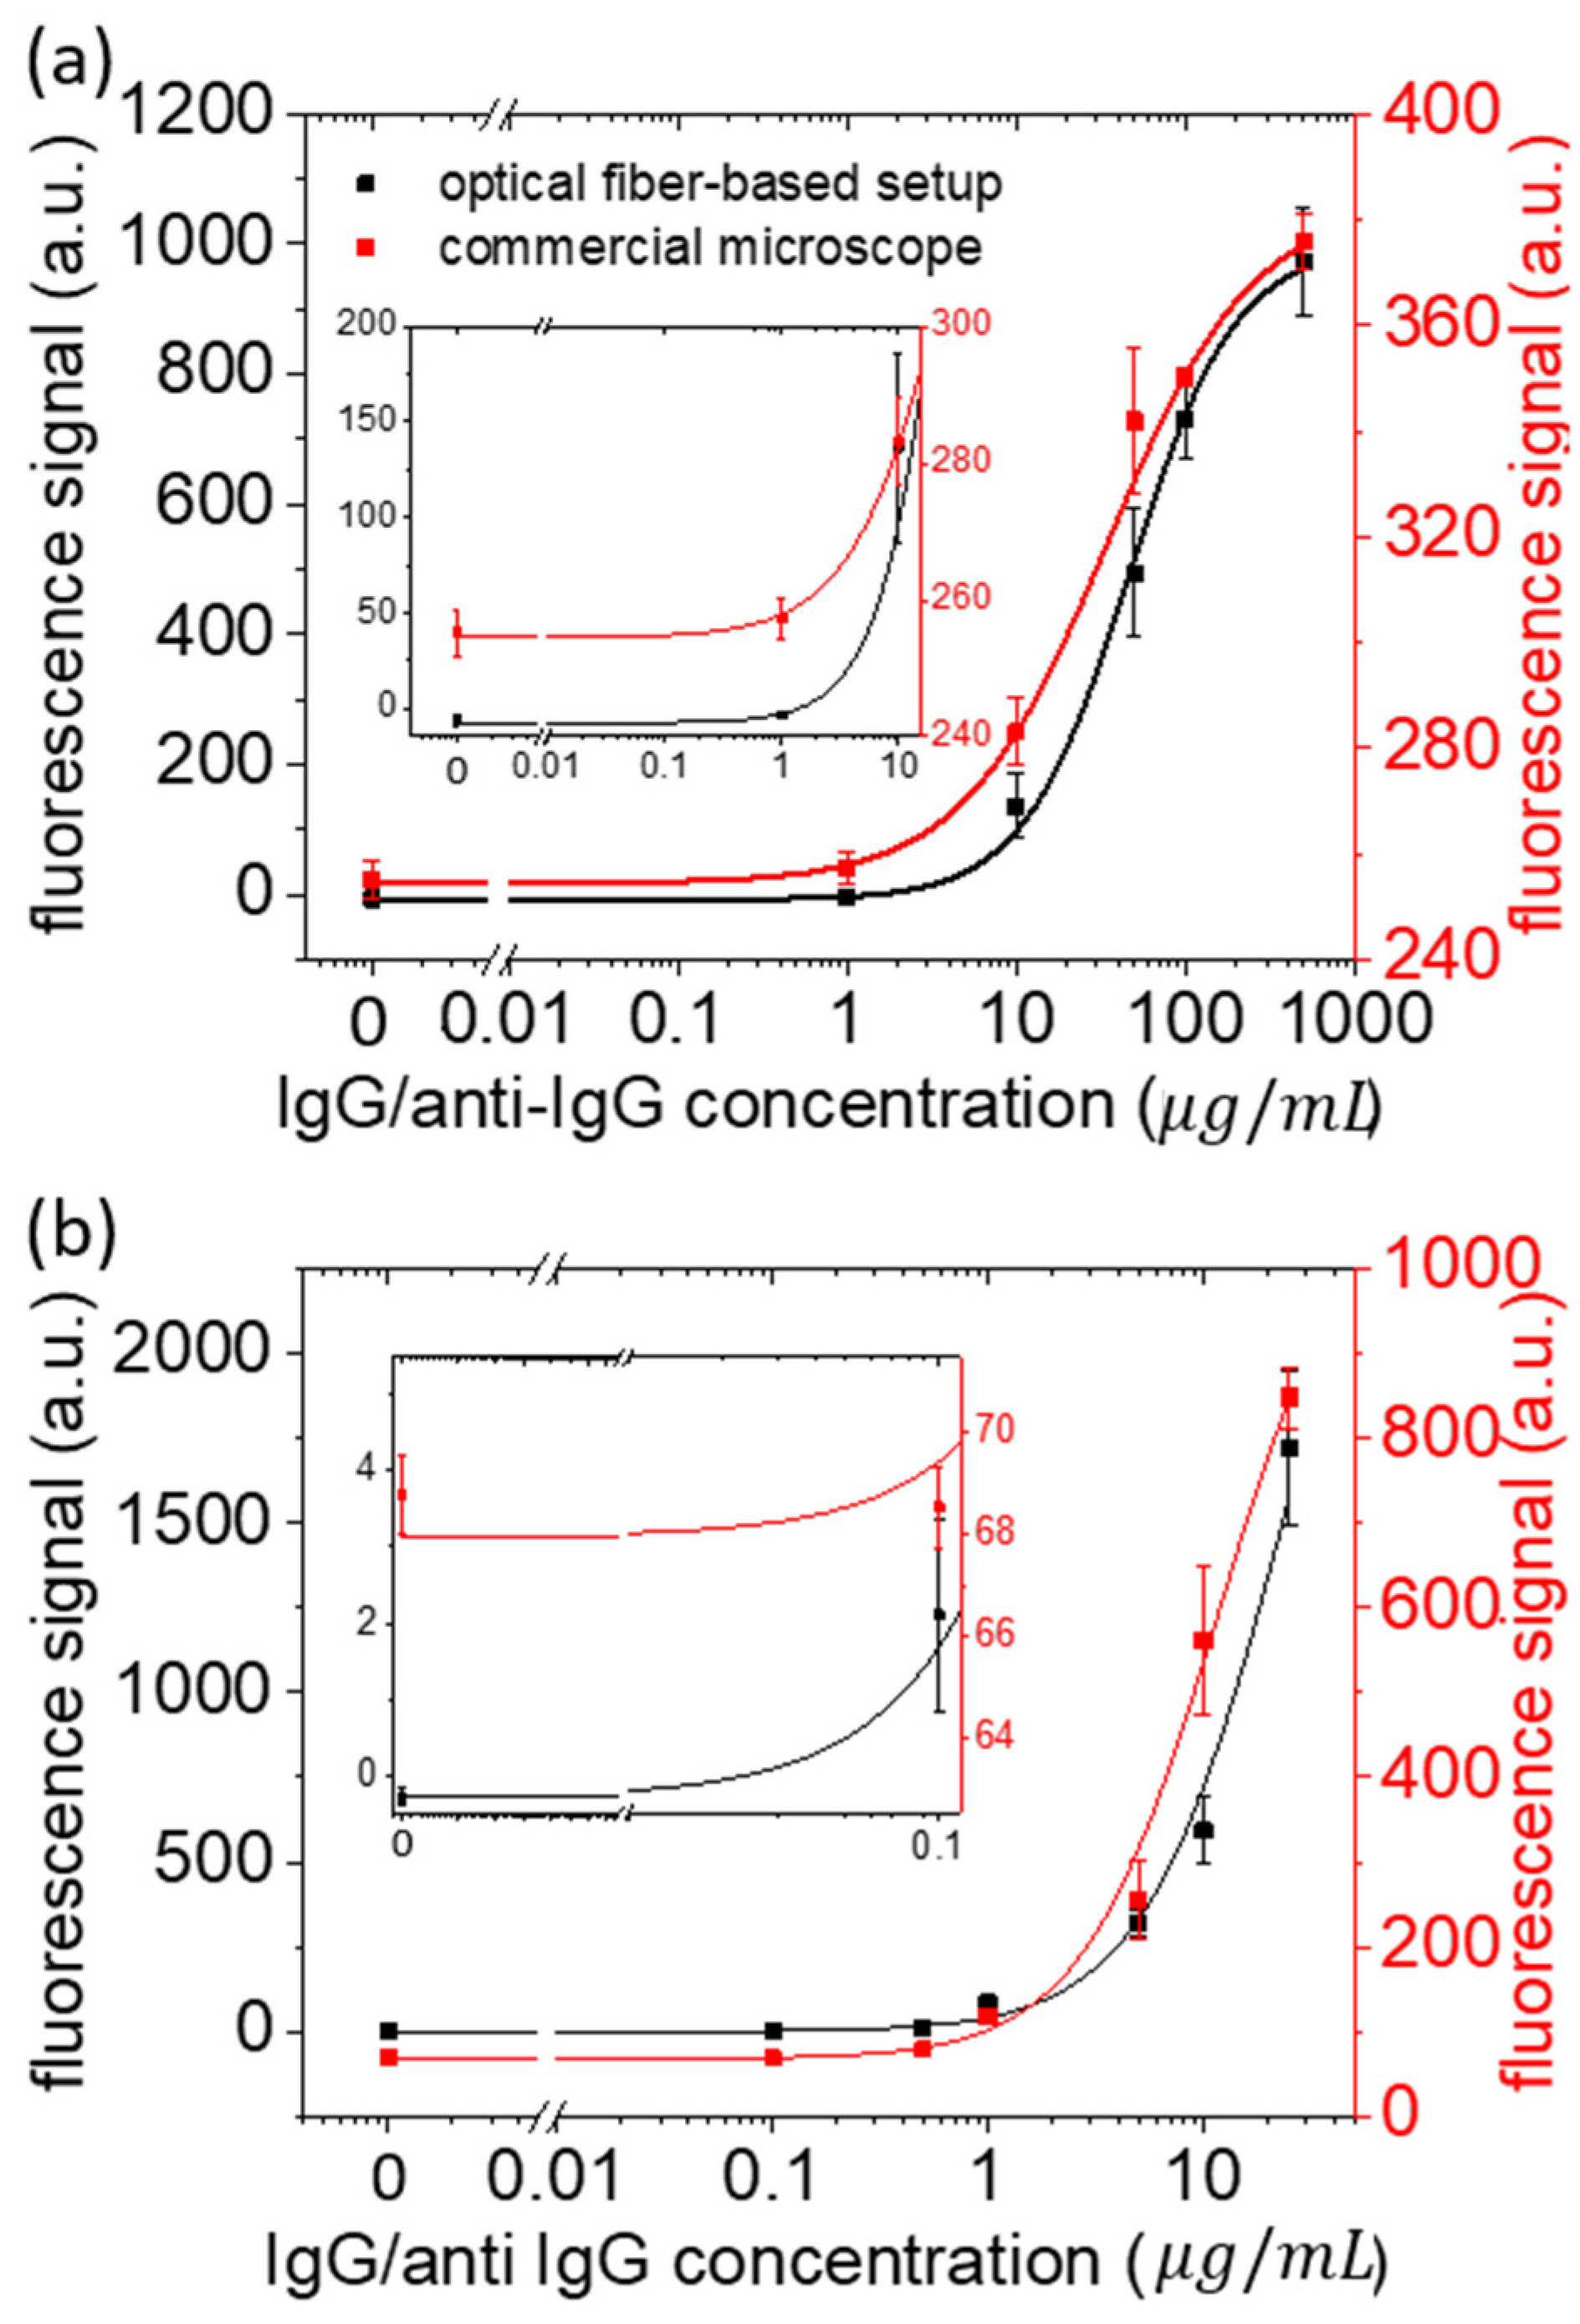
3.2. IgG/Anti-IgG Calibration Curve

Figure 4 displays the calibration curves of the fluorescence-based biosensing platform as a function of the analyte concentration (anti-IgG), in which the concentration of the immobilized antibody (IgG) is fixed and the anti-IgG one, expressed in μg/mL, is varied. Panel (a) shows results obtained on a glass substrate, whereas panel (b) presents results for the planar antenna. The measurements on each type of substrate have been performed on three independent spots for each concentration value of anti-IgG. Moreover, the measurements were carried out by the lens-less optical fiber-based configuration proposed here (black color) and the commercial fluorescence microscope, mentioned above (red color), as explained in Section 2.4. This comparison gives us a confirmation of the extraordinarily good performance of the setup for standardized biomolecule detection.
The LOD values obtained for the IgG/anti-IgG on the glass substrate are 3.1 μg/mL and 1.4 ug/mL for the commercial fluorescence microscope and our lens-less optical fiber-based device, respectively. On the other hand, with the planar antenna the measured LOD values are 0.14 μg/mL and 0.03 μg/mL (and LOQ values of 0.46 μg/mL and 0.1 μg/mL), for the commercial fluorescence microscope and our lens-less optical fiber-based device, respectively. These results clearly demonstrate that the proposed planar antenna substantially improves the LOD by more than one order of magnitude for both detection systems. This is obtained thanks to the combination of efficient pumping and efficient collection even with low numerical aperture. Remarkably, the LOD values attained with the proposed setup are even lower than those obtained with the commercial microscope (see values gathered in Table 1). At this point, it is important to remark, as already mentioned in the introduction, that the limit of detection (or the limit of quantification) is an essential parameter in the early stage diagnosis of diseases; clearly, it does not lie in the linear part of the calibration curve, which has a sigmoidal shape, but between the lower asymptote and the linear part, and this is the reason why we concentrated our attention on this part of the curve instead of the linear part.

3.3. CRP Calibration Curve

To show the capabilities of the proposed lens-less optical fiber-based fluorescence detector in the context of a more realistic clinical scenario, the test was performed also on chips for CRP in human serum, as sepsis biomarker analyte.
Figure 5 shows the calibration curve for CRP biomarker, spiked in commercially available human serum, prepared on the planar-antenna chip, considering a clinical range of concentrations relevant for sepsis diagnosis. Scattered points represent experimental measurements and solid curves the corresponding fit. The same comparison as in the previous section among the developed prototype (black color) and the commercial microscope (red color) was carried out.
The resulting LOD values for the CRP measured with the commercial microscope and the lens-less optical fiber-based setup are 0.005 μg/mL and 0.0015 μg/mL (and LOQ values of 0.013 μg/mL and 0.005 μg/mL), respectively (see values in Table 1). Although both values are within the range of clinically relevant concentrations, there is a significant improvement in the LOD value using the prototype compared to the commercial microscope. Typical levels of CRP in blood plasma of healthy individuals are below 10 μg/mL, while patients presenting a severe infection may present concentrations around 300 μg/mL [37]. In fact, the CRP concentration levels in the range between 40 and 200 μg/mL are considered to be related to sepsis infection [38,39].
It is important to notice that, since it is common to dilute the serum (usually 1:10) before measuring the biomarker of interest to decrease the nonspecificity effects, CRP values for a sepsis patient can reach, after dilution, a concentration comprised between 4 and 20 μg/mL, which fits quite well with the working interval of the calibration curve of Figure 5 related to the lens-less optical fiber-based setup in combination with the dry assay presented here. A lower working range was reached by Christodoulides et al. [40], who obtained a 10 fg/mL–10 pg/mL working range and a LOD of 5 fg/mL in saliva. However, the assay involves the use of agarose microbeads, which need a careful sieving process to obtain size homogeneity, from which the precision of the assay is highly dependent. Interestingly, the working range presented in Figure 5 not only is comparable with other fluorescent-based setups presented in the literature, 0.03–5 μg/mL reached in plasma [41], 0.1–50 μg/mL reached in HEPES buffer [42], and 0.5–10 μg/mL reached in serum [43], but covers a wider range of CRP concentrations with a single technique, which might allow the implementation of CRP detection for diverse goals and applications in the same device. Moreover, we can state that the LOD reported in the paper is dominated by the reproducibility of the assay rather than the intrinsic capabilities of the sensing device.

4. Conclusions

A new push-button prototype for early detection of diseases was presented and proved promising for sepsis diagnosis through the CRP detection in human serum in clinically relevant concentration ranges. The proposed prototype is based on the fluorescence detection of labeled antibodies through a lens-less alignment-free fiber-optic easy-to-operate and low-cost setup. The specific design of the chip here proposed in a planar-antenna-like configuration allows a more efficient collection of the fluorescence signal, leading to low LOD values in a high-throughput low-cost machine. Notably, the effect is obtained with a simple geometry that avoids challenging nanofabrication stages. Firstly, our prototype was tested with the gold standard assay IgG/anti-IgG sandwich showing 50 times lower LOD values for antenna-like chips compared to standard glass ones. Secondly, the LOD for the sepsis biomarker CRP was estimated for our prototype, achieving a value of 1.5 ng/mL (and LOQ of 5 ng/mL), which lies within the clinically relevant range of CRP concentration. Moreover, our results were validated by a direct comparison with measurements obtained using a more expensive commercial fluorescence microscope.
These results confirm that the performance of the prototype, which is compatible with standardized micro-well arrays, does not need particularly small volume localization as in other techniques and is easily extendable to a wide range of other biomarkers, simply introducing the suitable selective bioreceptors.

Supplementary Materials

The following supporting information can be downloaded at https://www.mdpi.com/article/10.3390/chemosensors11080448/s1: Figure S1: Fluorescence detection with different core-size collecting optical fibers; Figure S2: photograph of the prototype (whole installation); Figure S3: Reproducibility of the measurements performed with the prototype; Figure S4: Selection of the area for analysis: comparison between procedures; Figure S5: Illustrative fluorescence intensity maps of inhomogeneous assays; Video S1: Video of the prototype operation.

Author Contributions

V.E. and P.L. equally contributed to this work. The prototype project has been implemented by P.C., S.H. and P.L., based on the design and original idea by C.T. and P.L. All the assays were developed and first characterized by A.G. with the help of F.C. The measurements on the IgG/anti-IgG assays were performed by P.M., F.C. and P.L., those on CRP by V.E., under the supervision of P.L., A.G. and C.T. conceived the experiments and coordinated the work. Writing—original draft preparation: V.E. Writing—review and editing: P.L., F.C., P.M., M.C., F.B., A.G. and C.T. All authors have read and agreed to the published version of the manuscript.

Funding

This research was funded by the Horizon 2020 program with the project ERA-NET COFUND, through the “Photonic based sensing” call of Regione Toscana (GA n. 688735) and Bundesministerium für Bildung und Forschung (13N14746).

Institutional Review Board Statement

Not applicable.

Informed Consent Statement

Not applicable.

Data Availability Statement

The data presented in this study are available on request from the corresponding author.

Acknowledgments

We wish to acknowledge M. Agio for useful discussions and critical manuscript reading and N. Soltani for the artistic rendering in Figure 2b.

Conflicts of Interest

The authors declare no conflict of interest. The funders had no role in the design of the study; in the collection, analyses, or interpretation of data; in the writing of the manuscript; or in the decision to publish the results.

References

  1. Qureshi, A.; Gurbuz, Y.; Niazi, J.H. Biosensors for cardiac biomarkers detection: A review. Sens. Actuators B Chem. 2012, 171, 62–76. [Google Scholar]
  2. Bellagambi, F.G.; Lomonaco, T.; Salvo, P.; Vivaldi, F.; Hangouët, M.; Ghimenti, S.; Biagini, D.; Di Francesco, F.; Fuoco, R.; Errachid, A. Saliva sampling: Methods and devices. An overview. Trends Anal. Chem. 2020, 124, 115781. [Google Scholar]
  3. Sonker, M.; Sahore, V.; Woolley, A.T. Recent advances in microfluidic sample preparation and separation techniques for molecular biomarker analysis: A critical review. Anal. Chim. Acta 2017, 986, 1–11. [Google Scholar] [PubMed]
  4. Chandra, P.; Segal, E. Nanobiosensors for Personalized and Onsite Biomedical Diagnosis; eBook; The Institution of Engineering and Technology: Hong Kong, China, 2016. [Google Scholar]
  5. Stern, E.; Vacic, A.; Rajan, N.K.; Criscione, J.M.; Park, J.; Ilic, B.R.; Mooney, D.J.; Reed, M.A.; Fahmy, T.M. Label-free biomarker detection from whole blood. Nat. Nanotechnol. 2010, 5, 138–142. [Google Scholar] [CrossRef] [Green Version]
  6. Zhang, J.; Zhang, X.; Wei, X.; Xue, Y.; Wan, H.; Wang, P. Recent advances in acoustic wave biosensors for the detection of disease-related biomarkers: A review. Anal. Chim. Acta 2021, 1164, 338321. [Google Scholar]
  7. Campuzano, S.; Pedrero, M.; Yáñez-Sedeño, P.; Pingarrón, J.M. New challenges in point of care electrochemical detection of clinical biomarkers. Sens. Actuators B Chem. 2021, 345, 130349. [Google Scholar] [CrossRef]
  8. Singh, P. SPR biosensors: Historical perspectives and current challenges. Sens. Actuators B Chem. 2016, 229, 110–130. [Google Scholar]
  9. Damborsky, P.; Švitel, J.; Katrlík, J. Optical biosensors. Essays Biochem. 2016, 60, 91–100. [Google Scholar]
  10. Chen, C.; Wang, J. Optical biosensors: An exhaustive and comprehensive review. Analyst 2020, 145, 1605–1628. [Google Scholar]
  11. Leung, A.; Shankar, P.M.; Mutharasan, R. A review of fiber-optic biosensors. Sens. Actuators B Chem. 2017, 125, 688–703. [Google Scholar] [CrossRef]
  12. Nguyen, H.H.; Park, J.; Kang, S.; Kim, M. Surface plasmon resonance: A versatile technique for biosensor applications. Sensors 2015, 15, 10481–10510. [Google Scholar]
  13. Hoa, X.; Kirk, A.; Tabrizian, M. Towards integrated and sensitive surface plasmon resonance biosensors: A review of recent progress. Biosens. Bioelectron. 2007, 23, 151–160. [Google Scholar]
  14. Sepúlveda, B.; Angelomé, P.C.; Lechuga, L.M.; Liz-Marzán, L.M. LSPR-based nanobiosensors. Nano Today 2009, 4, 244–251. [Google Scholar] [CrossRef]
  15. Hammond, J.L.; Bhalla, N.; Rafiee, S.D.; Estrela, P. Localized surface plasmon resonance as a biosensing platform for developing countries. Biosensors 2014, 4, 172–188. [Google Scholar] [CrossRef] [PubMed] [Green Version]
  16. Chiavaioli, F.; Santano Rivero, D.; Del Villar, I.; Socorro-Leránoz, A.B.; Zhang, X.; Li, K.; Santamaría, E.; Fernández-Irigoyen, J.; Baldini, F.; van den Hove, D.L.A.; et al. Ultrahigh sensitive detection of Tau protein as Alzheimer’s biomarker via microfluidics and nanofunctionalized optical fiber sensors. Adv. Photonics Res. 2022, 3, 2200044. [Google Scholar]
  17. Chiavaioli, F.; Janner, D. Fiber optic sensing with lossy mode resonances: Applications and perspectives. J. Light. Technol. 2021, 39, 3855–3870. [Google Scholar]
  18. Altug, H.; Oh, S.-H.; Maier, S.A.; Homola, J. Advances and applications of nanophotonic biosensors. Nat. Nanotechnol. 2022, 17, 5–16. [Google Scholar]
  19. Taitt, C.R.; Anderson, G.P.; Ligler, F.S. Evanescent wave fluorescence biosensors. Biosens. Bioelectron. 2005, 20, 2470–2487. [Google Scholar] [CrossRef] [PubMed]
  20. Mukundan, H.; Anderson, A.S.; Grace, W.K.; Grace, K.M.; Hartman, N.; Martinez, J.S.; Swanson, B.I. Waveguide-based biosensors for pathogen detection. Sensors 2009, 9, 5783–5809. [Google Scholar] [CrossRef] [PubMed] [Green Version]
  21. Laing, S.; Jamieson, L.E.; Faulds, K.; Graham, D. Surface-enhanced Raman spectroscopy for in vivo biosensing. Nat. Rev. Chem. 2017, 1, 0060. [Google Scholar]
  22. Li, P.; Long, F.; Chen, W.; Chen, J.; Chu, P.K.; Wang, H. Fundamentals and applications of surface-enhanced Raman spectroscopy–based biosensors. Curr. Opin. Biomed. Eng. 2020, 13, 51–59. [Google Scholar] [CrossRef]
  23. Guo, Y.; Li, H.; Reddy, K.; Shelar, H.S.; Nittoor, V.R.; Fan, X. Optofluidic Fabry–Pérot cavity biosensor with integrated flow-through micro-/nanochannels. Appl. Phys. Lett. 2011, 98, 041104. [Google Scholar]
  24. Wu, H.; Huang, H.; Bai, M.; Liu, P.; Chao, M.; Hu, J.; Hao, J.; Cao, T. An ultra-low detection-limit optofluidic biosensor based on all glass Fabry-Perot cavity. Opt. Express 2014, 22, 31977–31983. [Google Scholar] [PubMed]
  25. Checcucci, S.; Lombardi, P.; Rizvi, S.; Sgrignuoli, F.; Gruhler, N.; Dieleman, F.B.; Cataliotti, F.S.; Pernice, W.H.; Agio, M.; Toninelli, C. Beaming light from a quantum emitter with a planar optical antenna. Light Sci. Appl. 2017, 6, e16245. [Google Scholar]
  26. Li, J.; Salandrino, A.; Engheta, N. Shaping light beams in the nanometer scale: A Yagi-Uda nanoantenna in the optical domain. Phys. Rev. B 2007, 76, 245403. [Google Scholar]
  27. Heykel, A.; Mahboub, O.; Bonod, N.; Devaux, E.; Popov, E.; Rigneault, H.; Ebbesen, T.W.; Wenger, J. Bright unidirectional fluorescence emission of molecules in a nanoaperture with plasmonic corrugations. Nano Lett. 2011, 11, 637–644. [Google Scholar]
  28. Soltani, N.; Agio, M. Planar antenna designs for efficient coupling between a single emitter and an optical fiber. Opt. Express 2019, 27, 30830–30841. [Google Scholar]
  29. Soltani, N.; Rabbany Esfahany, E.; Druzhinin, S.; Schulte, G.; Müller, J.; Sledz, F.; Flatae, A.M.; Butz, B.; Schönherr, H.; Markešević, N.; et al. Scanning planar Yagi-Uda antenna for fluorescence detection. J. Opt. Soc. Am. B 2021, 38, 2528. [Google Scholar]
  30. Soltani, N.; Esfahany, E.R.; Druzhinin, S.I.; Schulte, G.; Müller, J.; Butz, B.; Schönherr, H.; Agio, M.; Markešević, N. Biosensing with a scanning planar Yagi-Uda antenna. Biomed. Opt. Express 2022, 13, 539–548. [Google Scholar]
  31. Chiavaioli, F.; Zubiate, P.; Del Villar, I.; Zamarreño, C.R.; Giannetti, A.; Tombelli, S.; Trono, C.; Arregui, F.J.; Matias, I.R.; Baldini, F. Femtomolar detection by nanocoated fiber label-free biosensors. ACS Sens. 2018, 3, 936–943. [Google Scholar] [CrossRef]
  32. Kumari, S.; Moirangthem, R.S. Development of cost-effective plasmonic biosensor using partially embedded gold nanoparticles for detection of immunoglobulin proteins. Mater. Res. Express 2018, 5, 025031. [Google Scholar]
  33. Yu, C.; Irudayaraj, J. Quantitative evaluation of sensitivity and selectivity of multiplex nanoSPR biosensor assays. Biophys. J. 2007, 93, 3684–3692. [Google Scholar] [CrossRef] [Green Version]
  34. Baldini, F.; Bolzoni, L.; Giannetti, A.; Kess, M.; Krämer, P.M.; Kremmer, E.; Porro, G.; Senesi, F.; Trono, C. A new procalcitonin optical immunosensor for POCT applications. Anal. Bioanal. Chem. 2009, 393, 1183–1190. [Google Scholar] [PubMed]
  35. Chiavaioli, F.; Gouveia, C.A.J.; Jorge, P.A.S.; Baldini, F. Towards a uniform metrological assessment of grating-based optical fiber sensors: From refractometers to biosensors. Biosensors 2017, 7, 23. [Google Scholar] [PubMed] [Green Version]
  36. Mocak, J.; Bond, A.M.; Mitchell, S.; Scollary, G. A Statistical Overview of Standard (IUPAC and ACS) and New Procedures for Determining the Limits of Detection and Quantification: Application to Voltammetric and Stripping Techniques. Pure Appl. Chem. 1997, 69, 297–328. [Google Scholar]
  37. Buchegger, P.; Preininger, C. Four assay designs and on-chip calibration: Gadgets for a sepsis protein array. Anal. Chem. 2014, 86, 3174–3180. [Google Scholar] [PubMed]
  38. Clyne, B.; Olshaker, J.S. The C-reactive protein. J. Emerg. Med. 1999, 17, 1019–1025. [Google Scholar] [PubMed]
  39. Faix, J.D. Biomarkers of sepsis. Crit. Rev. Clin. Lab. Sci. 2013, 50, 23–36. [Google Scholar] [CrossRef] [PubMed] [Green Version]
  40. Christodoulides, N.; Mohanty, S.; Miller, C.S.; Langub, M.C.; Floriano, P.N.; Dharshan, P.; Ali, M.F.; Bernard, B.; Romanovicz, D.; Anslyn, E.; et al. Application of microchip assay system for the measurement of C-reactive protein in human saliva. Lab Chip 2005, 5, 261–269. [Google Scholar]
  41. Wolf, M.; Juncker, D.; Michel, B.; Hunziker, P.; Delamarche, E. Simultaneous detection of C-reactive protein and other cardiac markers in human plasma using micromosaic immunoassays and self-regulating microfluidic networks. Biosens. Bioelectron. 2004, 19, 1193–1202. [Google Scholar]
  42. Baldini, F.; Carloni, A.; Giannetti, A.; Porro, G.; Trono, C. An optical PMMA biochip based on fluorescence anisotropy: Application to C-reactive protein assay. Sens. Actuators B Chem. 2009, 139, 64–68. [Google Scholar] [CrossRef]
  43. Algarra, M.; Campos, B.B.; Gomes, D.; Alonso, B.; Casado, C.M.; Arrebola, M.M.; Diez de los Rios, M.J.; Herrera-Gutiérrez, M.E.; Seller-Pérez, G.; Esteces da Silva, J.C.G. Thiolated DAB dendrimer/ZnSe nanoparticles for C-reactive protein recognition in human serum. Talanta 2012, 99, 574–579. [Google Scholar] [CrossRef] [PubMed]
Figure 1. Simulated collective radiation pattern for dipoles with random orientation with respect to the substrate interface, observed from a transversal section of the chip. Radial labels stand for power spectrum, normalized by the value of the same quantity for dipoles in a homogeneous medium with refractive index n = 1. Panel (a) shows the standard case of assay prepared on a glass substrate (dipoles positioned 20 nm above the interface): it is evident that most of the emitted light is lost in the substrate. Panel (b) shows what happens in the presence of a planar-antenna configuration, for different dipole-mirror distances: 20 nm, 100 nm, and 250 nm dielectric spacer thicknesses (solid orange, green and purple curves, respectively). Panel (b) demonstrates the importance of the correct spacer thickness to funnel the radiation in a narrow cone around the vertical direction and toward the collecting optical fiber. Despite the 250 nm thick spacer, the emission is significantly stronger than in the other cases. It is focused into lobes at large angles, and it corresponds to a lower collected power with respect to the 100 nm thick case for limited numerical apertures (e.g., N.A. = 0.5). Further details about the chip fabrication can be found in Section 2.2.
Chemosensors 11 00448 g001
Figure 2. Scheme of the setup configuration. (a) Sandwich immunoassay consisting of antibodies (orange and gray molecules) binding the target antigen (here, as an example, CRP protein—colorful molecule) on the chip. The detection antibody is marked with the dye AlexaFluor 647 (blue star). (b) Scheme of the configuration of the optical components in the low-cost setup. An optical fiber illuminates and collects the fluorescence signal from the chip placed at its bottom. The optical fiber is mounted on an automated 3D translation stage, making it possible to explore several cm2 areas with a resolution of hundreds of nanometers and a repeatability of a few micrometers. The fluorescence signal is measured by a photodiode detector, with the long-pass filter preventing the source’s scattered light from reaching the detector.
Chemosensors 11 00448 g002
Figure 3. Schematic drawing of the installation. The Python-based, homemade software installed in the single-board computer manages the three active elements composing the prototype (detection system, translation stage, interface terminal). The custom mechanical support for the fiber, equipped with the buttonhole and the contact probe, is shown on the right together with a part of the translation stage and a cartoon representing a standard sample.
Chemosensors 11 00448 g003
Figure 4. Calibration curve of fluorescence as a function of concentration of anti-IgG in a sandwich immunoassay with IgG on (a) a glass substrate and (b) a designed planar antenna. Black color stands for the optical fiber-based setup, while red color represents results for the Zeiss Axio Observer Fluorescence Microscopy System. The experimental measurements and the fitting curves are denoted by scattered points and solid curves, respectively. The error bars are estimated as the maximum difference among the measured average fluorescence signal on different drops with the same assay concentration.
Chemosensors 11 00448 g004
Figure 5. Calibration curve of fluorescence intensity (expressed in independent arbitrary units for each setup) as a function of concentration for CRP sandwich immunoassay in human serum on a planar-antenna configuration. Black color stands for the optical fiber-based setup, while red color represents results for the commercial microscope. The experimental measurements and the fitting curves are denoted by scattered points and solid lines, respectively. The error bars are estimated as the maximum difference among the measured average fluorescence signal on different drops with the same assay concentration.
Chemosensors 11 00448 g005
Table 1. Limit of detection (LOD) values obtained with either the commercial equipment and the lens-less prototype presented in this work for the IgG/anti-IgG and the CRP immunoassays.
InstrumentLOD (μg/mL)
IgG/Anti-IgG
LOD (μg/mL)
CRP in Serum
LOQ (μg/mL)
IgG/Anti-IgG
LOQ (μg/mL)
CRP in Serum
Commercial equipment0.140.0050.460.013
Lens-less prototype0.030.00150.10.005
Disclaimer/Publisher’s Note: The statements, opinions and data contained in all publications are solely those of the individual author(s) and contributor(s) and not of MDPI and/or the editor(s). MDPI and/or the editor(s) disclaim responsibility for any injury to people or property resulting from any ideas, methods, instructions or products referred to in the content.

