Article

Visual Measurement of Fumonisin B1 with Bipolar Electrodes Array-Based Electrochemiluminescence Biosensor

Department of Chemistry, College of Sciences, Nanjing Agricultural University, 1 Weigang, Nanjing 210095, China
*
Author to whom correspondence should be addressed.
Chemosensors 2023, 11(8), 451; https://doi.org/10.3390/chemosensors11080451
Submission received: 10 July 2023 / Revised: 6 August 2023 / Accepted: 10 August 2023 / Published: 12 August 2023

Abstract

:
Fumonisin B1 (FB1) is a toxin produced by the metabolism of Fusarium oxysporum, which can cause serious effects on the nervous, respiratory, digestive, and reproductive systems of humans or animals; it is known as one of the highly toxic epidemic contaminants. Herein, we report the visual inspection of FB1 using bipolar electrodes (BPEs) with an array-based electrochemiluminescence (ECL) platform. The sensor consists of a PDMS cover and a glass substrate containing an array of 10 ITO electrodes. A specific sensing interface was constructed on the cathode of the BPE, which could modulate the ECL reactions that occurred at the anode of BPEs. To amplify the ECL signal, methylene blue (MB)-encapsulated Zr-MOFs (MB@Zr-MOFs) were synthesized and immobilized on the cathode of the BPE, which could amplify the ECL signal at the anode. By coupling the cyclic amplification effect of the DNA walker and nicking endonuclease (Nb.BbvCI), the biosensor can realize the visual measurement of FB1 in the range of 5 × 10⁻⁵~0.5 ng/mL. In addition, the developed biosensor was used to monitor the concentration of FB1 in maize and peanut samples. The recoveries were in the range of 99.2%~110.6%, which demonstrated the good accuracy of the designed BPE-ECL biosensor for FB1 assay in food samples.

1. Introduction

There has been growing attention to the contamination of foodstuffs caused by mycotoxins with the rapid development of agriculture and animal husbandry [1]. Mycotoxins are widely found in moldy agricultural products and their processed products, which can enter human and animal bodies through the food chain and thus cause a variety of diseases [2,3]. It is estimated by the Food and Agriculture Organization of the United Nations that 25% of global agricultural crops are contaminated by mycotoxins [2]. Among various mycotoxins, fumonisin B1 (FB1) has been identified as one of the most toxic mycotoxins, capable of disrupting sphingolipid metabolism, destroying the immune system, and increasing the risks of cancer. It is produced by Fusarium species and contaminates different grains such as maize, wheat, rice, and sorghum [4]. In addition, a considerable proportion of FB1 contamination is attributed to inappropriate storage conditions. The tolerable level established by the European Union for cereals and maize is 2 μg/kg and 5 μg/kg, respectively [5]. A survey performed by González-Arias on 43 rice samples and 25 maize samples revealed that FB1 wasn’t detected in polished rice samples; however, both field maize and market maize samples were contaminated with FB1 [6]. Therefore, the development of sensitive analytical devices for the measurement of FB1 in agricultural products is crucial for point-of-care diagnosis [7].
Up to now, versatile sensitive biosensors have been explored for accurate detection of mycotoxins using electrochemical [8,9] and optical transduction mechanisms [10,11,12]. Among them, electrochemiluminescence (ECL) as a sensitive optical analytical technique that combines the properties of electrochemical and luminescence has attracted great attention due to its unique advantages, such as high sensitivity and spatial controllability [13,14,15,16]. Additionally, the intensive ECL signal could easily be observed by the naked eye, which enabled visual readouts of targets. ECL biosensors, especially sensors based on bipolar electrode (BPE) arrays, have been quickly developed in recent years. By transducing the faradic current into an optical signal, the BPE-ECL platform based on an electrode array can realize the simultaneous screening of multiple targets in a single device using simple optical equipment (e.g., smartphone and digital camera) and then analyzed with appropriate software [17,18,19,20].
To achieve sensitive detection, various powerful signal amplification methods such as nucleic acid-assisted amplification [21], enzyme catalysis amplification strategies [22,23], nanomaterial-assisted methods [24,25], and electroactive species-based technologies [26,27] have been integrated into the BPE-ECL device to realize sensitive measurement. For example, the introduction of electroactive substance (thionine)-covalent organic frameworks at the cathode of the BPE could reduce the external voltage for driving the ECL reactions at the anode of the BPE and greatly amplify the ECL intensity [28]. Furthermore, some researchers reported the integration of multiple amplification strategies in order to achieve remarkable enhancement of ECL sensitivity [25,29]. Ge et al. reported a paper-based BPE-ECL device using the synergistic effects of the excellent catalytic activity of AuPd NPs and the hybridization chain reaction to realize the detection of miRNA-155 with a low detection limit of 0.67 pM [25].
Herein, a novel ECL device based on a 10 BPE array was prepared for the simultaneous measurement of mycotoxin. The ECL signal emitted from the anodes of the BPE could be simultaneously recorded by a CCD camera. To improve the sensitivity of the biosensor, methylene blue (MB) was embedded in zirconium-based metal–organic frameworks (Zr-MOFs). Zr-MOFs are an ideal carrier for the immobilization of electroactive dyes and biomolecules due to their unique properties, such as water stability, good stability, large surface area, and tunable surface chemistry, making them an excellent candidate in the construction of biosensors [30]. When the cathode of the BPE was exposed to MB@Zr-MOFs, the reduction current could be greatly improved due to the accumulation of a large number of MB molecules, leading to a significant enhancement of the ECL signal due to the charge neutrality of the BPE. In the presence of the target, the DNA walker was activated, which led to the continuous release of MB from the electrode surface with the assistance of nicking endonuclease. As a result, the BPE array-based ECL biosensor with dual-signal amplification strategies exhibited a good detection performance for screening of FB1 measurement. Additionally, the biosensor successfully evaluated FB1 contamination in corn and peanut samples with satisfactory stability and recovery. The portable BPE sensors array based on ECL imaging opens up a new avenue toward simultaneous screening of multiple mycotoxins in a sample.

2. Materials and Methods

2.1. Reagents

Multi-wall carbon nanotubes (MWCNTs) with a diameter of 10–20 nm (10–30 μm in length, purity 95%) were supplied by Nanjing XFNANO Materials Tech Co., Ltd. Polydimethylsiloxane (PDMS), Nanjing, China; the monomer and curing reagent (Sylgard 184) were provided by Dow Corning (Midland, MI, USA). The screen stencil (hole diameter of 0.5 mm) was acquired from a nearby shop. Dibutylaminoethanol (DBAE) was purchased from Shanghai Energy Chemical Co., Ltd. (Shanghai, China). ZrCl4, HAuCl4, dodecanoic acid, and 6-mercapto-1-hexanol (MCH) were purchased from Aladdin. N, N-dimethylformamide (DMF) was purchased from Guangzhou Jinhua Chemical Reagent Co., Ltd. (Guangzhou, China). 2-aminoterephthalic acid (H2N-BDC) was purchased from Shanghai Maclin Biochemical Technology Co., Ltd. (Shanghai, China). Screen printable etching paste (TP-005-4HC) was acquired from ShenZhen LaiYuan Technology Developing Co., Ltd. (Shenzhen, China). Tris (2-carboxyethyl) phosphine hydrochloride (TCEP), Tris(2,2′-bipyridyl)ruthenium-(II) dichloride hexahydrate (Ru(bpy)3Cl2·6H2O), fumonisin B1 (FB1), ochratoxin A (OTA), aflatoxin G1 (AFG1), aflatoxin B1 (AFB1), and zearalenone (ZEA) were provided by Sigma-Aldrich, St. Louis, MO, USA. An amount of 10 mM PBS (phosphate buffer solution, pH 7.4) was supplied by Jiangsu Kaiji Biotechnology Co., Ltd. (Nanjing, China). All of the DNA oligonucleotides were purchased from Shanghai Shenggong Biological Co., Ltd. (Shanghai, China); they are listed below.
DNA walker: 5′-SH-(CH2)6-TTTTTTTTTTTTTTTTTTTTTTTTTTTTTTTTTTTTTTTTTTTGAATAAGCTGGTATCCTCAG C-3′
Aptamer: 5′–TGAGGATACCAGCTTATTCAATTAATCGCATTACCTTATACCAGCTTATTCAATTACGTCTGCACATACCAGCTTATTCAATTAGATAGTAAGTGCAATCT-3′
Capture DNA (cDNA): 5′-SH-(CH2)6-TTTTTTGC*TGAGGTT-(CH2)6-NH2-3′

2.2. Instruments

An MS23 CCD camera (Guangzhou Mingmei Technology Co., Ltd. Guangzhou, China) was used to capture ECL images. The UV–vis spectra were measured using an Ensight multi-mode plate reader (Perkin Elmer, Waltham, MA, USA). Transmission electron microscopy (TEM) was acquired using an FEI Tecnai G2 F20 apparatus. Two MWCNTs/PDMS fibers (diameter 1 mm) were used as driving electrodes and connected to a power supply.

2.3. Synthesis of Zr-MOFs and MB@Zr-MOFs

Zr-MOFs were synthesized according to the literature with minor modifications [31,32]. Briefly, 0.048 g zirconium chloride and 1.44 g dodecanoic acid were dissolved in 12 mL of DMF and ultrasonicated for 25 min to obtain a clarified solution, then 0.0186 g 2-aminoterephthalic acid (H2N-BDC) was added and ultrasonicated again for 5 min. After that, the mixture was transferred to a hydrothermal reactor and the reaction was continued for 48 h in an oven at 120 °C. The obtained product was centrifuged at 8000 r/min for 5 min, washed 3 times with DMF and ethanol, and then dried at 60 °C to obtain Zr-MOFs (yellow powder).
For the preparation of MB@Zr-MOFs, 15 mg Zr-MOFs was mixed with 5 mL of methylene blue (1 mM) solution and shaken for 24 h, after which the product was centrifuged for 5 min at 8000 r/min. Finally, the sediment was washed with PBS several times to remove the excess MB and re-dispersed in 5 mL of PBS.

2.4. Preparation of ITO Array Electrodes

An array of bipolar electrodes was prepared using the screen-printed method according to our previous study [33]. Firstly, the pattern of the electrode array (10 electrodes, 0.15 cm × 1 cm) was designed using Adobe Illustrator and then sent to a local printing shop to fabricate a template with 200-mesh screens. Then, the screen printable etching paste was patterned on the ITO substrate (10 cm × 8 cm) with the help of the template. The patterned ITO substrate was heated to 120 °C and kept for 2 h to etch the ITO layer underneath the etching glue. After washing with water, the electrode was sonicated in isopropanol solution and ultrapure water for 15 min to remove the etching glue and other impurities from the electrode surface. The cleaned ITO was dried at 60 °C and stored in a clean environment before use.

2.5. Preparation of Au/ITO Array Electrodes

Au NPs were deposited on one pole of the ITO array electrode using a bipolar electrodeposition method [34]. An open BPE electrochemical cell was prepared as follows. A PDMS slice was prepared by mixing the monomer and curing agent in a ratio of 10:1. After degassing, the mixture was poured into a flat glass substrate and heated at 80 °C for 1 h. The PDMS slice was peeled off from the glass substrate and a rectangular reservoir (9 cm × 2 cm) was fabricated on the PDMS slice using a knife. Then, the PDMS slice was attached to the ITO electrode array surface. Two Pt wires were placed at the two ends of the reservoirs to serve as driving electrodes and connected to the external power supply. An amount of 3 mL of HAuCl4 solution was introduced and a constant voltage was applied for 1 min to trigger the simultaneous deposition of Au NPs on the cathode pole of the BPE. The Au/ITO electrode array was then washed with ultrapure water and dried at 60 °C.

2.6. Preparation of DNA Mix

The DNA mix contains MB@Zr-MOFs/cDNA and double-stranded DNA (dsDNA). MB@Zr-MOFs/cDNA was prepared by using glutaraldehyde as a linker molecule. An amount of 5 mL of MB@Zr-MOFs was treated with 2.5% glutaraldehyde under continuous shaking for 4 h. The glutaralized MB@Zr-MOFs were washed with PBS three times and dispersed in 5 mL of PBS. An amount of 75 μL of cDNA (20 μM) was pretreated with 75 μL TCEP (10 mM) at 37 °C for 1 h to cleave the disulfide bonds and then conjugated on glutaraldehyde-chemical MB@Zr-MOFs (150 μL) by incubating at 37 °C for 4 h. The obtained MB@Zr-MOFs/cDNA was stored at 4 °C before use.
A total of 15 μL of DNA walker (20 μM) was reacted with 15 μL of TCEP (10 mM) at 37 °C for 1 h. Afterward, 15 μL of aptamer (20 μM) and 55 μL of PBS solution were introduced. The mixture was heated to 95 °C for 5 min, cooled naturally to room temperature, and then stored at 4 °C for 30 min to obtain dsDNA.
The DNA mix was prepared by introducing 300 μL of the above-prepared MB@Zr-MOFs/cDNA solution, 50 μL of TCEP (10 mM), and 50 μL of PBS solution to the dsDNA solution.

2.7. Fabrication of ECL Biosensor

Ten holes with a diameter of 2 mm were punched on a PDMS slice to act as reservoirs. Then, the PDMS slice was covered on the Au/ITO electrode array surface to construct a specific biosensing interface for FB1. The distance between each hole was specially designed so that each electrode was located in one reservoir.
A total of 20 μL of DNAmix solution was added into the reservoirs and incubated at 37 °C for 3 h. The obtained DNAmix/Au/ITO electrode was carefully washed with PBS. Then, the unreacted sites of the Au/ITO electrode were blocked by 20 μL of MCH (0.1 mM) at 37 °C for 1 h. After rinsing with PBS, the modified electrode was incubated with 20 μL of mixture solution containing Nb.BbvCI (10 U/20 μL), different concentrations of FB1, and 1× Cutsmart buffer solution at 37 °C for 3 h, followed by washing with PBS. The PDMS slice was removed, and the electrode was stored at 4 °C before ECL measurement.

2.8. ECL Imaging

A PDMS with two reservoirs (9 cm × 1.75 cm) was attached to the ITO BPE array to fabricate a closed BPE-ECL device for ECL imaging (Figure S1). The distance between these two reservoirs was 5 mm. MWCNTs-PDMS fibers with a diameter of 1 mm were glued on the PDMS slice to serve as driving electrodes. They were prepared according to our previous work [35] and connected to a CHI660E electrochemical workstation.
The reservoir containing the anode of the BPE array was filled with 2 mL of Ru(bpy)32+ (5 mM)/DBAE (50 mM) solution, and the cathode of the BPE was immersed in PBS. ECL images were captured using a microscope equipped with a CCD in a dark environment with an exposure time of 10 s. ECL intensity was analyzed using Image-Pro Plus 6.0. ECL–potential curves were obtained using an MPI-E electrochemiluminescence analyzer (Xi’An Remax Electronic Science &Technology Co. Ltd., Xi’an, China).

2.9. Real Sample Detection

Corn and peanuts were purchased from local markets and pretreated following the reported literature [36]. Samples were grounded into powder, filtered through a 20-mesh sieve, and then dispersed into methanol. Different concentrations of FB1 standard solutions were spiked into 1 mL of sample (1 g)/methanol solution. After the complete evaporation of solvent at room temperature, the sample was extracted with methanol/water (2:8, v/v) solution by ultrasonication for 15 min. The suspension was collected by centrifugation and diluted into 50 mL with PBS. The concentration of FB1 was then measured with the fabricated biosensor.

3. Results and Discussion

3.1. Principle of the BPE- ECL Biosensors Array for FB1 Detection

Scheme 1 illustrates the fabrication process and detection mechanism of the BPE-ECL biosensor array. cDNA was labeled with MB@Zr-MOFs (Scheme 1A). Aptamer was hybridized with a DNA walker to form double-stranded DNA (dsDNA), which was then mixed with cDNA/MB@Zr-MOFs to form a DNA mix solution (Scheme 1B). The cathodes of the ITO BPE were modified with Au NPs (Scheme 1C) through bipolar electrodeposition. The large surface area of Au NPs allows more DNA to be immobilized on the electrode surface; meanwhile, the excellent conductivity of Au NPs could amplify the ECL signal at the anode of the BPE. Then, the specific sensing interface detection of FB1 was constructed on the Au NPs’ surface. A DNA mix solution containing an aptamer–DNA walker duplex and MB@Zr-MOFs-labeled cDNA was immobilized on Au NPs. Owing to the accumulation of plenty of MB molecules on the cathode of the BPE, the reduction of MB can cause the enhancement of the ECL signal of Ru(bpy)32+/DBAE at the anode. In the presence of FB1, the competitive binding to aptamer between FB1 and the DNA walker forced the release of aptamer from the electrode surface, which initiated the walking process of the DNA walker. The hybridization of DNA walker with neighboring cDNA produced specific recognition sites for Nb. BbvCI nicking endonuclease cleaved cDNA into two short DNA fragments, causing the liberation of MB@Zr-MOFs-labeled DNA fragment from the cathode. As a result, the cyclic walking of the DNA walker and the continuous cleavage of cDNA could greatly improve the sensitivity of the biosensor.

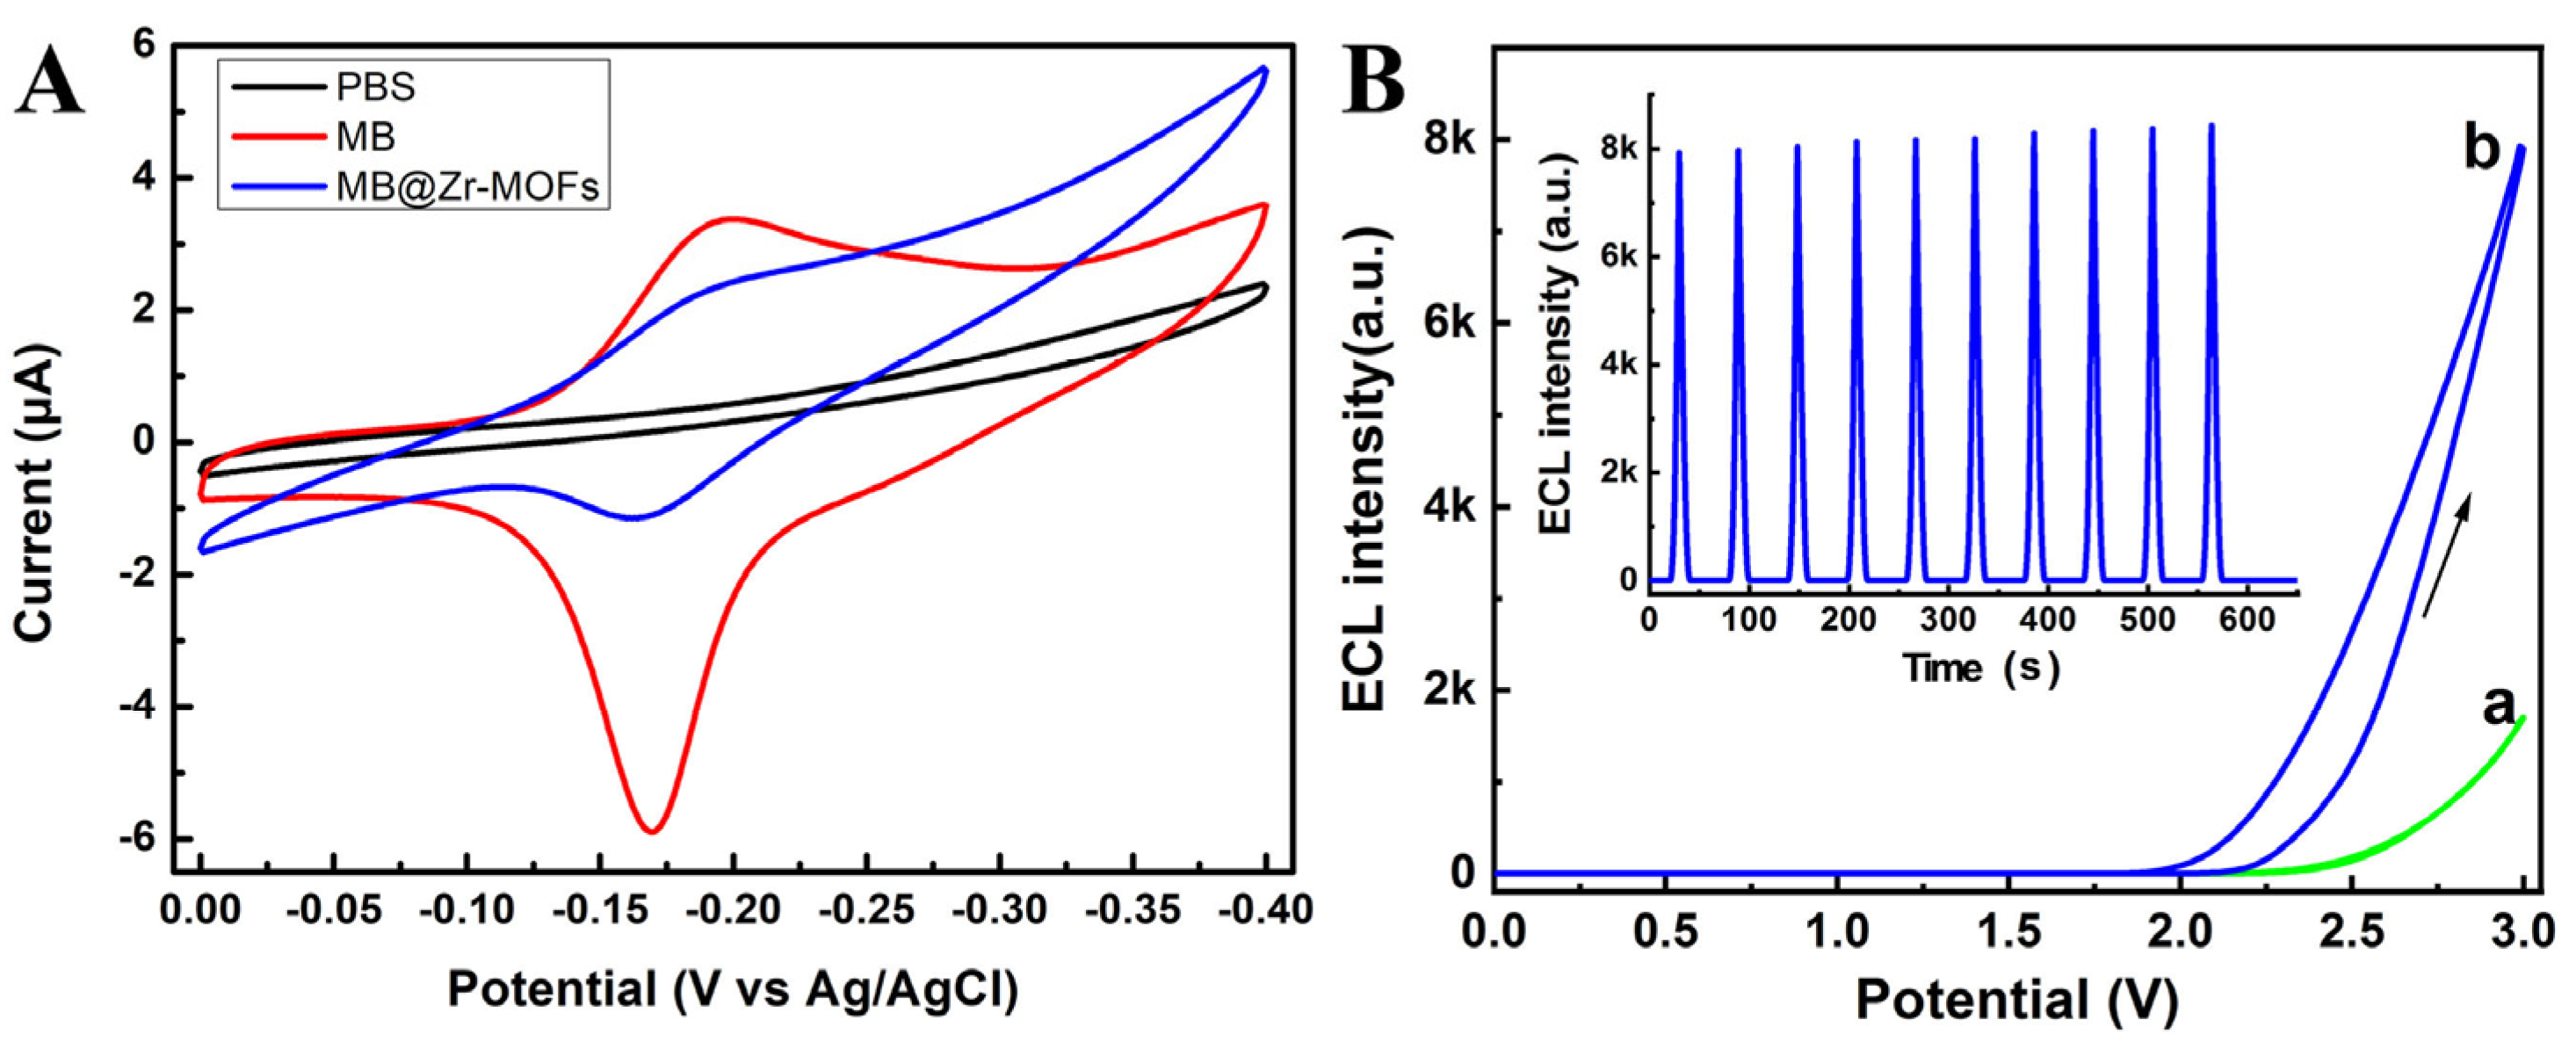
3.2. Characterization of MB@Zr-MOFs

The morphology of MB@Zr-MOFs was studied using transmission electron microscopy (TEM). Figure 1A showed that the diameter of Zr-MOFs was about 70–80 nm, which is in agreement with the literature [26]. After the loading of MB (Figure 1B), the structure of the nanoparticles was not significantly changed. Meanwhile, the color of the MOFs turned from light yellow to blue (inset of Figure 1C), indicating the successful encapsulation of MB molecules in the Zr-MOFs. The UV-vis absorption spectra of Zr-MOFs and MB@Zr-MOFs were displaced in Figure 1C. Zr-MOFs have no obvious peak in the range from 400 to 800 nm (curve A). The MB solution exhibited a strong absorption peak at around 661 nm. The MB@Zr-MOFs (curve C) also displayed an obvious peak at the same position as the MB molecules (curve B).
FT-IR analysis was then conducted to obtain the characteristic functional groups in MB@Zr-MOFs (Figure 1D). MB exhibited characteristic peaks at 3308 cm−1 and 1606 cm−1, corresponding to the N-H stretching vibration and phenyl ring vibration. For Zr-MOFs, the peaks at 3328 cm−1 and 1578 cm−1 were related to the N-H stretching vibration and Zr-C=N MOF’s stretching vibration [37], respectively. When MB molecules were embedded into the Zr-MOFs (MB@Zr-MOFs), the characteristic peaks at 3447 cm−1 corresponding to the N-H stretching vibration could be observed. Additionally, the peak caused by the Zr-C=N MOF’s stretching vibration also appeared at 1564 cm−1.
The chemical composition of Zr-MOF and MB@Zr-MOF was analyzed using X-ray photoelectron spectroscopy (XPS). As can be seen from the full survey spectra in Figure 1E that both Zr-MOF and MB@Zr-MOF have C1s, O1s, N1s, and Zr3d peaks. Because of the combination of MB on Zr-MOF, a new peak corresponding to Cl2p appeared in the spectrum of MB@Zr-MOF. We could see from the high-resolution Zr3d spectrum of MB@Zr-MOF in Figure S2 that the Zr 3d peak could be divided into two peaks at 182.4 and 184.8 eV, corresponding to Zr 3d5/2 and Zr 3d3/2.
To further detect the specific surface area and porosity of Zr-MOFs and MB@Zr-MOFs, nitrogen adsorption–desorption isotherm analysis was carried out. The Brunauer–Emmett–Teller (BET) surface area and the pore volume of Zr-MOFs were 230.04 m2/g and 0.5568 m3/g, respectively. After the combination of MB molecules, the surface area and pore volume reduced to 138.09 m2/g and 0.4012 m3/g, respectively.

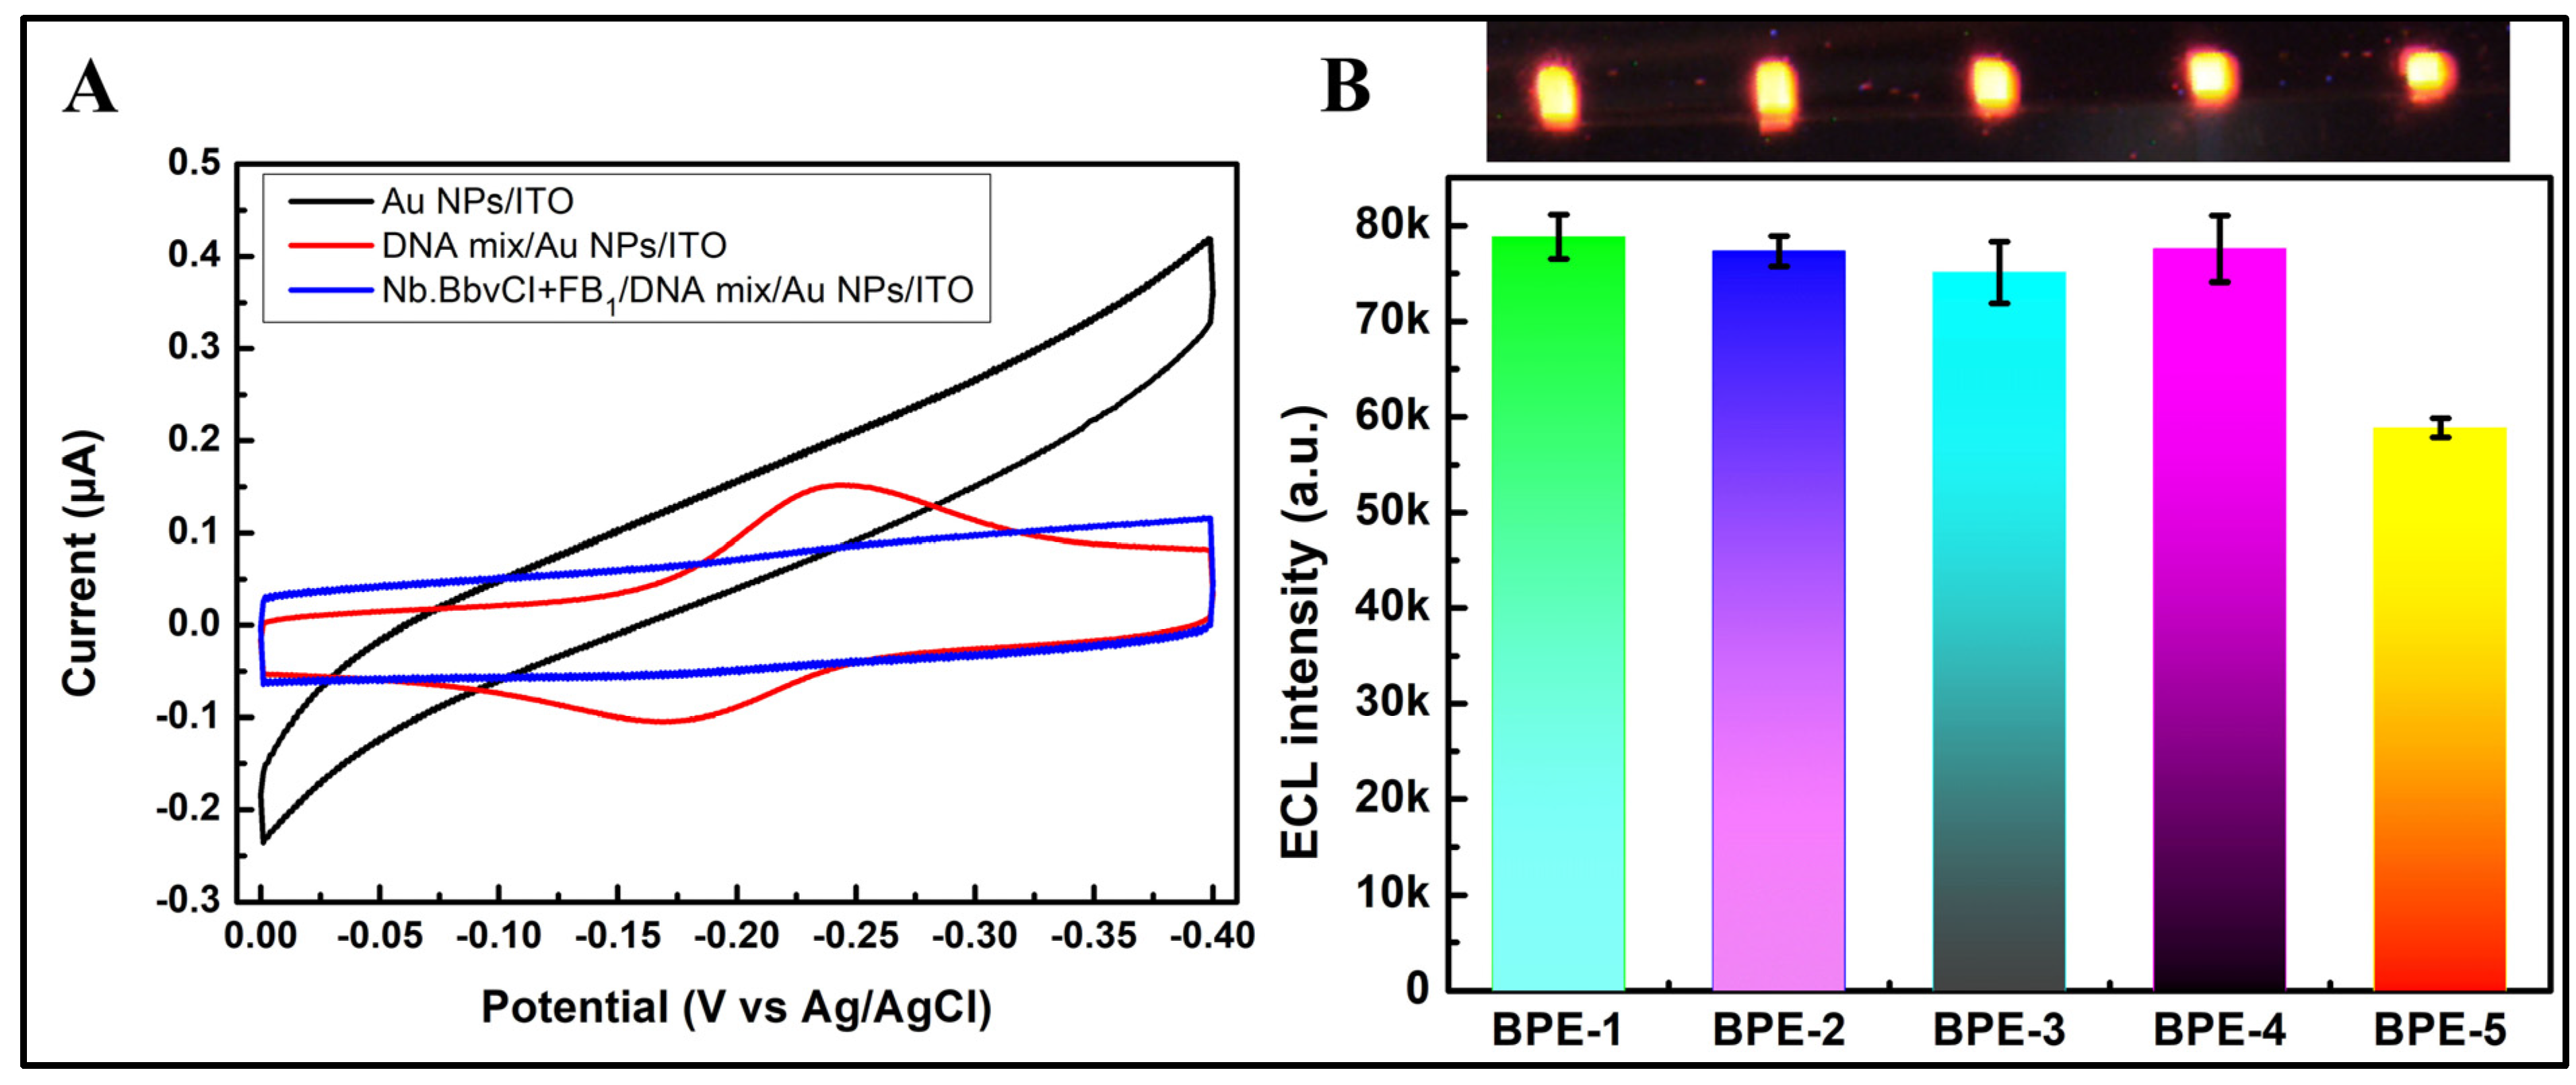
3.3. Feasibility of the BPE-ECL Device for FB1 Assay

The electrochemical performance of MB@Zr-MOFs and the feasibility of MB@Zr-MOFs-mediated ECL enhancement in the BPE system were then investigated using cyclic voltammetry (CV) and ECL. Figure 2A shows the cyclic voltammograms obtained in a three-electrode system using the prepared Au NPs/ITO electrode as the working electrode. As can be seen, both MB and MB@Zr-MOFs displayed a pair of reversible redox peaks at ca. 0.169 and –0.196 V. It indicated that MB@Zr-MOFs underwent similar two-electron redox reaction as MB [38]. The electrochemical reduction of MB@Zr-MOFs inducing an ECL amplification effect in the BPE system was also studied. Curve a in Figure 2B shows the ECL–voltage curve obtained by introducing Zr-MOFs solution into the cathodic reservoir of the BPE. As can be seen, the ECL intensity was improved when the voltage exceeded 2.5 V. When MB@Zr-MOFs were added (curve b), the onset voltage for driving the ECL reaction reduced to 2.15 V; meanwhile, the ECL intensity was improved by 3.7-fold. It confirmed that the reduction of MB@Zr-MOFs on the cathode of the BPE could mediate the ECL signal emitted from the anode of the BPEs array. The corresponding ECL–time curve is displayed in the inset of Figure 2B. The relative standard deviation (RSD) of the ECL intensity under continuous 10 cycles of CV sweep was 2.04%, suggesting good ECL stability of the prepared ITO electrode array.
The immobilization of MB@Zr-MOFs/cDNA on Au NPs/ITO BPE was then assessed by CV (Figure 3A). there was no noticeable peak when the Au NPs/ITO electrode was immersed in PBS (black line). After treating the Au NPs/ITO electrode with DNA mix, a pair of peaks appeared at –0.239 V and –0.175 V, ascribing to the oxidation and reduction of MB. It confirmed that MB@Zr-MOFs/cDNA was successfully assembled on the Au NPs/ITO electrode. The peaks vanished after subsequent incubation with FB1 and Nb.BbvCI, demonstrating the recognition of the modified electrode toward FB1 and the cleavage of cDNA by Nb.BbvCI.
The feasibility of the developed BPE-ECL biosensor for visual analysis of FB1 is displayed in Figure 3B. A strong ECL signal could be observed on the anode of Au NPs/ITO BPE (BPE-1). When the DNA mix was immobilized on the electrode surface, no significant ECL signal could be observed. This is because although the reduction of MB@Zr-MOFs on Au NPs/ITO BPE could amplify the ECL signal, the increased resistance of the electrode caused by the immobilization of DNA would inhibit the ECL signal. When FB1 (0.5 ng/mL) was added, the ECL signal changed slightly (BPE-3). When the DNA mix/Au NPs/ITO BPE was treated with Nb.BbvCI in the absence of FB1 (BPE-4), the ECL signal also exhibited no obvious change, suggesting that Nb.BbvCI cannot digest cDNA without FB1. When FB1/DNA mix/Au NPs/ITO BPE was incubated with Nb.BbvCI (BPE-5), the ECL intensity demonstrated a sharp decrement, confirming that the cleavage of MB@Zr-MOFs-labeled cDNA by Nb.BbvCI was activated by FB1 and the feasibility of the developed biosensor for FB1 measurement.

3.4. Optimization of Experimental Conditions

To achieve sensitive measurement of FB1, the experimental conditions, such as the deposition time of Au NPs and the incubation time of FB1 and Nb.BbvCI, were optimized. Figure S3 shows the optical images of the ITO electrode array captured during the deposition of Au NPs under different voltages and times. As can be seen, when the external voltage was 6 V, the color of the ITO electrode changed apparently due to the reduction of HAuCl4 on the cathode of the BPE. As the deposition time increased, the color of the electrode turned darker. With the increase in external voltage from 6 to 9 V, the coverage area of the ITO electrode by Au NPs increased from 15.24% to 36.30%. Therefore, we chose 9 V for the preparation of Au/ITO BPE.
Figure 4 shows the effect of HAuCl4 concentration on the ECL behavior of the BPE array. The ECL images were obtained by applying different voltages to trigger the ECL reactions on the BPE array. The ECL intensity increased significantly with increasing HAuCl4 concentration (1 mM to 8 mM). However, when the concentration of HAuCl4 reached 8 mM, the thick coating layer of gold can easily fall off from the ITO surface, resulting in poor reproducibility of the biosensor. Therefore, to improve the performance of the biosensor, 5 mM HAuCl4 was selected for the construction of Au/ITO BPE.
Figure 4 also reveals that the ECL intensity exhibited a sharp enhancement with the increase in voltage. Figure S4A shows the ECL stability of the developed Au/BPE array in 200 s, and that the voltage for triggering the ECL reactions was 2.9 V. Stable and intensive ECL signals could be observed on each electrode. Figure S4B demonstrates that the average ECL intensity at different electrodes on one array reached a plateau in 60 s. Additionally, the RSD of the ECL intensities in one array was below 9.2%. These results suggest the good stability and reproducibility of the BPE array.
Then, we optimized the reaction time of the DNA mix/Au/ITO electrode and the mixture of FB1 and Nb.BbvCI. Figure 5 shows that the ECL signal intensity decreased with increasing incubation time (0 to 2.5 h), which is caused by the cleavage of cDNA/MB@Zr-MOFs on the electrode surface by Nb.BbvCI. After 2.5 h, the ECL intensity reached a stable value, indicating that the cleavage reaction was completed. Therefore, 2.5 h was chosen for the subsequent experiments.

3.5. Calibration Curve for FB1 Measurement

Under optimized conditions, the designed biosensor was then used for a quantitative assay of FB1. Figure 6A shows that the brightness of the ECL signal decreased as the concentration of FB1 increased. The ECL signal intensity was linear in the range of 5 × 10⁻⁵~0.5 ng/mL with the logarithm of the FB1 concentration (R2 = 0.9995). The linear equation was I = 45,894–17,409 logC(ng/mL), indicating that the prepared biosensor can be applied in the quantitative detection of FB1.
The specificity of the prepared sensor for FB1 detection was conducted by measuring the ECL signal of the biosensor in the presence of interference mycotoxins. As shown in Figure 6B, the presence of AFG1, AFB1, OTA, ZEN, and the mixture could not cause a significant change in ECL intensity compared to that of the blank sample. When the mixture containing all these interfering toxins and FB1 was introduced, the ECL intensity of the biosensor decreased sharply. Additionally, the ECL intensity was very close to that obtained in the presence of FB1. All of these results suggested the superior selectivity of the proposed biosensor for FB1 analysis.

3.6. Application of the BPE Array Biosensor in Real Samples

To testify the applicability of the developed biosensor for FB1 measurement in real samples, maize and peanut samples were grounded and different concentrations of FB1 standard solution were spiked. After extracting by solvent, the suspension was collected using sonication and analyzed using the BPE array. As shown in Table 1, the recoveries were in the range of 99.2%~110.6%, and the RSD was from 1.8% to 9.5%, indicating the acceptable accuracy of the as-prepared biosensor for mycotoxin measurement in real samples.

4. Conclusions

In the present work, a novel ECL biosensor based on an ITO BPEs array was constructed for visual analysis of FB1 in food samples. By introducing MB molecules-decorated Zr-MOFs at the cathode of the BPE, the ECL signal produced at the anode of the BPE could be significantly amplified due to the neutrality of the BPE. Meanwhile, in the presence of the target, a DNA walker was activated, which triggered the continuous release of MB@Zr-MOFs from the electrode surface, causing the significant quenching effect of the ECL signal. As a result, the developed biosensor demonstrated a broad linear range and a low detection limit for FB1 measurement. Additionally, this work provides a new concept for screening multiple targets. Owing to the high sensitivity of the portable BPE-ECL device, the biosensor might be commercialized by merging smartphone photography and analysis technologies, as well as better manufacturing procedures for larger-scale production.

Supplementary Materials

The following supporting information can be downloaded at: https://www.mdpi.com/article/10.3390/chemosensors11080451/s1, Figure S1: BPEs array-ECL device; Figure S2: high-resolution Zr 3d XPS spectra of MB@Zr-MOFs; Figure S3: optical images of ITO electrode array during the deposition of Au NPs; Figure S4: ECL images captured on ITO BPEs array under different time and the average ECL intensity–time curve.

Author Contributions

Conceptualization, L.J., H.Y. (Huihui Yu), W.L., Z.X., H.Y. (Haijian Yang) and B.J.; data curation, L.J. and H.Y. (Huihui Yu); formal analysis, L.J., H.Y. (Huihui Yu), W.L., Z.X., H.Y. (Haijian Yang) and B.J.; methodology, L.J., H.Y. (Huihui Yu), W.L., Z.X., H.Y. (Haijian Yang), B.J. and M.W.; resources, L.J. and H.Y. (Huihui Yu); software, L.J.; validation, L.J. and H.Y. (Huihui Yu); visualization, L.J., investigation, W.L., Z.X., H.Y. (Haijian Yang) and B.J.; writing—original draft preparation, L.J. and H.Y. (Huihui Yu); writing—review and editing, L.J., W.L., Z.X., H.Y. (Haijian Yang), B.J. and M.W.; funding acquisition, M.W.; project administration, M.W.; supervision, M.W. All authors have read and agreed to the published version of the manuscript.

Funding

This research was funded by the Qinglan Project of Jiangsu Province of China and the National Natural Science Foundation of China (No. 21675087).

Institutional Review Board Statement

Not applicable.

Informed Consent Statement

Not applicable.

Data Availability Statement

Not applicable.

Conflicts of Interest

The authors declare no conflict of interest.

References

  1. Yang, C.; Song, G.; Lim, W. Effects of mycotoxin-contaminated feed on farm animals. J. Hazard. Mater. 2020, 389, 122087. [Google Scholar] [CrossRef] [PubMed]
  2. Gao, Z.C.; Luo, K.X.; Zhu, Q.X.; Peng, J.H.; Liu, C.; Wang, X.Y.; Li, S.J.; Zhang, H.Y. The natural occurrence, toxicity mechanisms and management strategies of Fumonisin B1: A review. Environ. Pollut. 2023, 320, 121065. [Google Scholar] [CrossRef]
  3. Lumsangkul, C.; Chiang, H.I.; Lo, N.W.; Fan, Y.K.; Ju, J.C. Developmental Toxicity of Mycotoxin Fumonisin B-1 in Animal Embryogenesis: An Overview. Toxins 2019, 11, 114. [Google Scholar] [CrossRef] [Green Version]
  4. Hao, K.; Suryoprabowo, S.; Hong, T.; Song, S.; Liu, L.; Zheng, Q.; Kuang, H. Immunochromatographic strip for ultrasensitive detection of fumonisin B-1. Food Agric. Immunol. 2018, 29, 699–710. [Google Scholar] [CrossRef] [Green Version]
  5. He, D.; Wu, Z.; Cui, B.; Xu, E. Aptamer and gold nanorod-based fumonisin B1 assay using both fluorometry and SERS. Microchim. Acta 2020, 187, 215. [Google Scholar] [CrossRef]
  6. Molina-Pintor, I.B.; Ruiz-Arias, M.A.; Guerrero-Flores, M.C.; Rojas-Garcia, A.E.; Barron-Vivanco, B.S.; Medina-Diaz, I.M.; Bernal-Hernandez, Y.Y.; Ortega-Cervantes, L.; Rodriguez-Cervantes, C.H.; Ramos, A.J.; et al. Preliminary survey of the occurrence of mycotoxins in cereals and estimated exposure in a northwestern region of Mexico. Int. J. Environ. Health Res. 2022, 32, 2271–2285. [Google Scholar] [CrossRef] [PubMed]
  7. Arumugam, T.; Ghazi, T.; Chuturgoon, A.A. Molecular and epigenetic modes of Fumonisin B-1 mediated toxicity and carcinogenesis and detoxification strategies. Crit. Rev. Toxicol. 2021, 51, 76–94. [Google Scholar] [CrossRef] [PubMed]
  8. Han, Z.; Tang, Z.; Jiang, K.; Huang, Q.; Meng, J.; Nie, D.; Zhao, Z. Dual-target electrochemical aptasensor based on co-reduced molybdenum disulfide and Au NPs (rMoS2-Au) for multiplex detection of mycotoxins. Biosens. Bioelectron. 2020, 150, 111894. [Google Scholar] [CrossRef]
  9. De Rycke, E.; Foubert, A.; Dubruel, P.; Bol’hakov, O.I.; De Saeger, S.; Beloglazova, N. Recent advances in electrochemical monitoring of zearalenone in diverse matrices. Food Chem. 2021, 353, 129342. [Google Scholar] [CrossRef]
  10. Jiang, F.; Li, P.; Zong, C.; Yang, H. Surface-plasmon-coupled chemiluminescence amplification of silver nanoparticles modified immunosensor for high-throughput ultrasensitive detection of multiple mycotoxins. Anal. Chim. Acta 2020, 1114, 58–65. [Google Scholar] [CrossRef]
  11. Zong, C.; Jiang, F.; Wang, X.; Li, P.; Xu, L.; Yang, H. Imaging sensor array coupled with dual-signal amplification strategy for ultrasensitive chemiluminescence immunoassay of multiple mycotoxins. Biosens. Bioelectron. 2021, 177, 112998. [Google Scholar] [CrossRef]
  12. Jiang, P.; Luo, L.; Liu, X.; Zhao, W.; Bi, X.; Luo, L.; Li, L.; You, T. A potential-resolved ratiometric electrochemiluminescence aptasensor for Pb2+: Gold nanoclusters and amino-terminated perylene derivative as both emitters and resonance energy transfer donor-acceptor pair. Sens. Actuators B Chem. 2023, 386, 133758. [Google Scholar] [CrossRef]
  13. Luo, L.; Liu, X.; Bi, X.; Li, L.; You, T. Dual-quenching effects of methylene blue on the luminophore and co-reactant: Application for electrochemiluminescent-electrochemical ratiometric zearalenone detection. Biosens. Bioelectron. 2023, 222, 114991. [Google Scholar] [CrossRef] [PubMed]
  14. Wang, Q.; Xiong, C.; Li, J.; Deng, Q.; Zhang, X.; Wang, S.; Chen, M.-M. High-performance electrochemiluminescence sensors based on ultra-stable perovskite quantum dots@ZIF-8 composites for aflatoxin B1 monitoring in corn samples. Food Chem. 2023, 410, 135325. [Google Scholar] [CrossRef] [PubMed]
  15. Wei, M.; Wang, C.; Xu, E.; Chen, J.; Xu, X.; Wei, W.; Liu, S. A simple and sensitive electrochemiluminescence aptasensor for determination of ochratoxin A based on a nicking endonuclease-powered DNA walking machine. Food Chem. 2019, 282, 141–146. [Google Scholar] [CrossRef]
  16. Xi, M.; Wu, Z.; Luo, Z.; Ling, L.; Xu, W.; Xiao, R.; Wang, H.; Fang, Q.; Hu, L.; Gu, W.; et al. Water Activation for Boosting Electrochemiluminescence. Angew. Chem. Int. Ed. Engl. 2023, 62, e202302166. [Google Scholar] [CrossRef]
  17. Qin, X.; Gao, J.; Jin, H.-J.; Li, Z.-Q.; Xia, X.-H. Closed Bipolar Electrode Array for Optical Reporting Reaction-Coupled Electrochemical Sensing and Imaging. Chem. A Eur. J. 2022, 29, e202202687. [Google Scholar]
  18. Liu, Y.; Cheng, Q.-Y.; Gao, H.; Chen, H.-Y.; Xu, J.-J. Microfluidic Gradient Culture Arrays for Cell Pro-oxidation Analysis Using Bipolar Electrochemiluminescence. Anal. Chem. 2023, 95, 8376–8383. [Google Scholar] [CrossRef]
  19. Anderson, T.J.; Defnet, P.A.; Zhang, B. Electrochemiluminescence (ECL)-Based Electrochemical Imaging Using a Massive Array of Bipolar Ultramicroelectrodes. Anal. Chem. 2020, 92, 6748–6755. [Google Scholar] [CrossRef]
  20. Liu, Y.; Zhang, N.; Pan, J.-B.; Song, J.; Zhao, W.; Chen, H.-Y.; Xu, J.-J. Bipolar Electrode Array for Multiplexed Detection of Prostate Cancer Biomarkers. Anal. Chem. 2022, 94, 3005–3012. [Google Scholar] [CrossRef]
  21. Zhang, R.; Liang, Y.; Su, Y.; Lai, W.; Zhang, C. Cloth-based closed bipolar electrochemiluminescence DNA sensors (CCBEDSs): A new class of electrochemiluminescence gene sensors. J. Lumin. 2021, 238, 118209. [Google Scholar] [CrossRef]
  22. Li, X.; Du, Y.; Wang, H.; Ma, H.; Wu, D.; Ren, X.; Wei, Q.; Xu, J.-J. Self-Supply of H2O2 and O2 by Hydrolyzing CaO2 to Enhance the Electrochemiluminescence of Luminol Based on a Closed Bipolar Electrode. Anal. Chem. 2020, 92, 12693–12699. [Google Scholar] [CrossRef] [PubMed]
  23. Yang, X.; Wang, Y.; Wang, L.; Zhu, J.; Zhao, J.; Zong, H.; Chen, C. Bipolar electrode ratiometric electrochemiluminescence biosensing analysis based on boron nitride quantum dots and biological release system. Biosens. Bioelectron. 2021, 191, 113393. [Google Scholar] [CrossRef] [PubMed]
  24. Khoshfetrat, S.M.; Bagheri, H.; Mehrgardi, M.A. Visual electrochemiluminescence biosensing of aflatoxin M1 based on luminol-functionalized, silver nanoparticle-decorated graphene oxide. Biosens. Bioelectron. 2018, 100, 382–388. [Google Scholar] [CrossRef]
  25. Wang, F.; Fu, C.; Huang, C.; Li, N.; Wang, Y.; Ge, S.; Yu, J. Paper-based closed Au-Bipolar electrode electrochemiluminescence sensing platform for the detection of miRNA-155. Biosens. Bioelectron. 2020, 150, 111917. [Google Scholar] [CrossRef] [PubMed]
  26. Chen, B.; Tao, Q.; OuYang, S.; Wang, M.; Liu, Y.; Xiong, X.; Liu, S. Biocathodes reducing oxygen in BPE-ECL system for rapid screening of E. coli O157:H7. Biosens. Bioelectron. 2023, 221, 114940. [Google Scholar] [CrossRef]
  27. Che, Z.-Y.; Wang, X.-Y.; Ma, X.; Ding, S.-N. Bipolar electrochemiluminescence sensors: From signal amplification strategies to sensing formats. Coord. Chem. Rev. 2021, 446, 214116. [Google Scholar] [CrossRef]
  28. Jia, Y.-L.; Xu, C.-H.; Li, X.-Q.; Chen, H.-Y.; Xu, J.-J. Visual analysis of Alzheimer disease biomarker via low-potential driven bipolar electrode. Anal. Chim. Acta 2023, 1251, 340980. [Google Scholar] [CrossRef]
  29. Ge, S.; Zhao, J.; Wang, S.; Lan, F.; Yan, M.; Yu, J. Ultrasensitive electrochemiluminescence assay of tumor cells and evaluation of H2O2 on a paper-based closed-bipolar electrode by in-situ hybridization chain reaction amplification. Biosens. Bioelectron. 2018, 102, 411–417. [Google Scholar] [CrossRef]
  30. Zhang, S.; Rong, F.; Guo, C.; Duan, F.; He, L.; Wang, M.; Zhang, Z.; Kang, M.; Du, M. Metal–organic frameworks (MOFs) based electrochemical biosensors for early cancer diagnosis in vitro. Coord. Chem. Rev. 2021, 439, 213948. [Google Scholar] [CrossRef]
  31. He, B.S.; Dong, X.Z. Nb. BbvCI powered DNA walking machine-based Zr-MOFs-labeled electrochemical aptasensor using Pt@AuNRs/Fe-MOFs/PEI-rGO as electrode modification material for patulin detection. Chem. Eng. J. 2021, 405, 126642. [Google Scholar] [CrossRef]
  32. He, B.; Dong, X. Hierarchically porous Zr-MOFs labelled methylene blue as signal tags for electrochemical patulin aptasensor based on ZnO nano flower. Sens. Actuators B Chem. 2019, 294, 192–198. [Google Scholar] [CrossRef]
  33. Chen, J.; Zhang, J.; Qiao, J.; Wu, M. Closed bipolar electrochemical biosensor based on ohmic loss mechanism for noncontact measurements. J. Electroanal. Chem. 2020, 860, 113873. [Google Scholar] [CrossRef]
  34. Yu, H.H.; Yang, H.J.; Liu, W.S.; Jin, L.S.; Jin, B.; Wu, M.S. Novel electrochemiluminescence biosensor of fumonisin B1 detection using MWCNTs-PDMS flexible bipolar electrode. Talanta 2023, 257, 124379. [Google Scholar] [CrossRef]
  35. Li, Y.C.; Zheng, C.R.; Liu, S.; Huang, L.; Fang, T.S.; Li, J.X.Z.; Xu, F.; Li, F. Smart Glove Integrated with Tunable MWNTs/PDMS Fibers Made of a One-Step Extrusion Method for Finger Dexterity, Gesture, and Temperature Recognition. ACS Appl. Mater. Interfaces 2020, 12, 23764–23773. [Google Scholar] [CrossRef]
  36. Ren, C.C.; Li, H.M.; Lu, X.T.; Qian, J.; Zhu, M.Y.; Chen, W.; Liu, Q.; Hao, N.; Li, H.N.; Wang, K. A disposable aptasensing device for label-free detection of fumonisin B1 by integrating PDMS film-based micro-cell and screen-printed carbon electrode. Sens. Actuators B Chem. 2017, 251, 192–199. [Google Scholar] [CrossRef]
  37. Al-Hazmi, G.A.A.; El-Zahhar, A.A.; El-Desouky, M.G.; El-Bindary, M.A.; El-Bindary, A.A. Adsorption of industrial dye onto a zirconium metal-organic framework: Synthesis, characterization, kinetics, thermodynamics, and DFT calculations. J. Coord. Chem. 2022, 75, 1203–1229. [Google Scholar] [CrossRef]
  38. Mollarasouli, F.; Asadpour-Zeynali, K.; Campuzano, S.; Yáñez-Sedeño, P.; Pingarrón, J.M. Non-enzymatic hydrogen peroxide sensor based on graphene quantum dots-chitosan/methylene blue hybrid nanostructures. Electrochimica Acta 2017, 246, 303–314. [Google Scholar] [CrossRef]
Scheme 1. Schematic diagram of (A) the preparation process of cDNA-Zr MOFs, (B) synthesis process of DNA mix, and (C) visual bipolar electrode-ECL array electrode for FB1 detection.
Chemosensors 11 00451 sch001
Figure 1. TEM images of Zr-MOFs (A) and MB@Zr-MOFs (B). (C) UV-vis absorption spectra of Zr-MOFs (a), MB (b), and MB@Zr-MOFs (c). Inset were the optical images of Zr-MOFs and MB@Zr-MOFs solution. (D) FT-IR spectra of Zr-MOFs, MB and MB@Zr-MOFs. (E) XPS spectra of Zr-MOF and MB@Zr-MOFs. (F) nitrogen adsorption−desorption isotherm of Zr-MOFs and MB@Zr-MOFs.
Chemosensors 11 00451 g001
Figure 2. (A) Cyclic voltammograms obtained on Au NPs/ITO electrodes in the presence of PBS, MB, and MB@Zr-MOFs. (B) ECL–voltage curves were obtained by introducing Ru(bpy)32+/DBAE into the anodic cell. The cathodic cell was filled with Zr-MOFs (a) and MB@Zr-MOFs (b), respectively. Inset was the ECL–time curve recorded by filling the cathodic cell with MB@Zr-MOFs.
Chemosensors 11 00451 g002
Figure 3. (A) Cyclic voltammograms obtained on different electrodes in PBS. (B) ECL images and the corresponding ECL intensity obtained on Au NPs/ITO BPE (BPE-1), DNA mix/Au NPs/ITO BPE (BPE-2), FB1/DNA mix/Au NPs/ITO BPE (BPE-3), Nb.BbvCI/DNA mix/Au NPs/ITO BPE (BPE-4), and Nb.BbvCI/FB1/DNA mix/Au NPs/ITO BPE (BPE-5), respectively.
Chemosensors 11 00451 g003
Figure 4. The effect of HAuCl4 concentration on the ECL behavior of BPE array.
Chemosensors 11 00451 g004
Figure 5. Optimization of the incubation time of FB1.
Chemosensors 11 00451 g005
Figure 6. (A) ECL response and the calibration curve of the BPE biosensor for sensing FB1. (B) Selectivity evaluation of the BPE biosensor on different mycotoxins.
Chemosensors 11 00451 g006
Table 1. Detection of FB1 in actual samples (n = 3).
SamplesAdded (pg/mL)Founded (ng/mL)RSD (%)Recovery (%)
Corn0Not detected -
0.5000.5207 ± 0.01042.0104.1
2.5002.490 ± 0.0853.499.6
5.0005.184 ± 0.4548.7103.7
Peanut0Not detected -
0.5000.4958 ± 0.00911.899.2
2.5002.646 ± 0.2519.5105.9
5.0005.530 ± 0.8067.3110.6
Disclaimer/Publisher’s Note: The statements, opinions and data contained in all publications are solely those of the individual author(s) and contributor(s) and not of MDPI and/or the editor(s). MDPI and/or the editor(s) disclaim responsibility for any injury to people or property resulting from any ideas, methods, instructions or products referred to in the content.

