Communication

Methods for Calibrating the Electrochemical Quartz Crystal Microbalance: Frequency to Mass and Compensation for Viscous Load

by
Claes-Olof A. Olsson
,
Anna Neus Igual-Muñoz
* and
Stefano Mischler
Tribology and Interfacial Chemistry Group, Materials Institute, Ecole Polytechnique Fédérale de Lausanne, EPFL, CH-1015 Lausanne, Switzerland
*
Author to whom correspondence should be addressed.
Chemosensors 2023, 11(8), 456; https://doi.org/10.3390/chemosensors11080456
Submission received: 8 June 2023 / Revised: 3 August 2023 / Accepted: 8 August 2023 / Published: 14 August 2023

Abstract

:
The main output from an Electrochemical Quartz Crystal Microbalance is a frequency shift. This note describes how to separate the mass- and viscous load contributions to this shift by a calibration procedure. The mass calibration is made by electroplating from a copper sulfate solution in ethanol/water with 100% current efficiency. An estimate of viscous load is obtained by measuring the energy dissipation and is related to frequency change using the Kanazawa–Gordon equation. Two approaches are discussed: either by performing calibration experiments in a series of water–glycerol mixtures or by following oscillations in frequency and dissipation by collecting data during the stabilization phase of the experiment.

1. Introduction

The Quartz Crystal Microbalance (QCM) was originally developed as a thickness sensor in PVD systems but is today used for studying minute changes in surface chemistry in a wide variety of applications and environments, from supercapacitors and energy to biological systems [1,2,3]. With the addition of a potentiostat, the Electrochemical Quartz Crystal Microbalance (EQCM) allows for the combining of already sensitive electrochemical techniques with the additional information of the microbalance [4,5]. Thus, the EQCM constitutes a powerful technique for an enhanced understanding of electrochemical processes at interfaces, including film modification, mass transport phenomena and adsorption kinetics at the interface of thin films. Olsson and Landolt have reviewed the applications of the EQCM for different types of corrosion processes [6].
It combines sub-monolayer sensitivity with the possibility of tracking changes in the low millisecond range. For small changes in frequency, there is a linear relation between mass and frequency [7]. With the additional recording of energy dissipation in the system, as well as the analysis of harmonics, it is a tool that provides vast information on reactions at solid/liquid interfaces [8,9]. To compare the results from the microbalance with other techniques, it is useful to have a calibration, relating the frequency and dissipation changes to mass and solution viscosity in the near-surface region. The use of water–glycerol mixtures for this purpose has been elaborated further by Itoh and Ichihashi, who showed how it is possible to separate mass and viscous load by admittance analysis [10,11].
This short communication presents two practical ways for obtaining frequency to mass conversion compensated for viscous load using the Electrochemical Quartz Crystal Microbalance (EQCM) with additional measurement of energy dissipation. As opposed to most literature where the crystal is used at 25 °C, it was chosen to make this calibration at 37 °C to allow for studies in relevant biological environments, where it is of interest to study the interaction of proteins with metal surfaces, as exemplified by Olsson et al. [12].

2. Materials and Methods

2.1. Theory

The main contributors to the frequency shift in a quartz crystal microbalance experiment are changes in mass and viscous load on the sample. These entities are described in the Kanazawa–Gordon equation [13]:
Δ f t o t = 2 N f 0 2 ρ q μ q Δ m A N f 0 3 / 2 π ρ q μ q ρ l η l
where the first term is related to mass, Δfm, and the second to viscous loading, which can be estimated from the energy dissipation in each cycle. The remaining variables are described in Table 1. For small changes in mass, the relation between frequency shift and mass can be considered linear, as suggested by Sauerbrey [7]:
Δ m = Δ f m ρ q μ q 2 f 0 2 A o s c = C s Δ f m
For a 5 MHz crystal, the nominal Cs value at 25 °C is 4.6 ng Hz−1, which is valid for an infinite oscillating surface. By using a plating solution with close to 100% yield, the Sauerbrey coefficient can be obtained using Faraday’s law (Equation (3)). The frequency shift should be the one compensated for viscosity Δfm:
C s = M C u t 1 t 2 I d t n F A o s c A c u r r
To estimate the influence of viscosity on the frequency change, frequency shifts were recorded in a series of electrolytes (water/glycerol mixtures), with changing viscosity but with negligible contribution from a mass shift. The advantage of this method is that it is not necessary to know the absolute viscosity shift, only the relative frequency shift for a set of solutions. Taking the difference for electrolytes with different viscosities in Equation (1), one obtains:
Δ f t o t i Δ f t o t i i = N f 0 3 / 2 π ρ q μ q ρ l i i η l i i ρ l i η l i
For a series of different electrolytes with small differences in viscous load, Equation (4) could be linearized and applied to correct the total frequency shift. The frequency shift related to a mass change can thus be calculated as:
Δ f m = Δ f t o t Δ f v i s c = Δ f t o t k Δ D
where the proportionality constant k is the slope from the water–glycerol experiments, as discussed below. These solutions are chemically inert and do not lead to absorption on the metal surface and therefore Δfm can be neglected as already reported by Galliano et al. [14]. The change in frequency is therefore only related to the viscous load.

2.2. Material

The quartz crystals were gold coated using PVD and supplied by Advanced Wave Sensors S.L. in Paterna, Spain (AWS). The AWS quartz crystals had a mirror finish gold coating and a base frequency just below 5 MHz. All experiments were performed on the same crystal with electrochemical removal of the plated layer before the next experiment. Before each experiment, the sample, as well as the cell, including the O-ring, were cleaned and dried. The working electrode area, Acur, was 1.14 cm2 and the oscillating area, Aosc, used for mass sensing was 0.26 cm2.
For the plating experiment, an electrolyte with close to 100% yield was used [15]: 0.5 M CuSO4 + 0.5 M H2SO4 + 1.1 M EtOH at 37.0 °C. To obtain a response to changes in viscous load, glycerol was added to concentrations of 1, 3 and 5 wt%.

2.3. Electrochemical Quartz Crystal Microbalance

The Electrochemical Quartz Crystal Microbalance was an X1 system from AWS, Spain. It has an operating range from 4 to 160 MHz with a maximum frequency resolution of 0.1 Hz. The specified mass resolution in liquid is 0.6 ng cm−2, and the normal dissipation sensitivity in the liquid is 3.5 × 10⁻⁸. For all experiments, the temperature control unit X1-TCU was set to 37.0 °C. All solutions were preheated before the experiment started. The electrochemical cell used was of the quick lock type, either in the form of a flow cell with a smaller volume or a slightly larger-volume electrochemical cell, both designed for the AWS A20 system. The quick lock design is a patent of AW-Sensors. Data acquisition was performed using the AWS Suite Mirage 4.0.7.3. All evaluations were performed using Python scripts.

2.4. Potentiostat

The potentiostat used for the experiments was a Biologic SP200, connected in the working electrode to ground mode. It was controlled through the software of the microbalance. The reference electrode was an Ag/AgCl, which has a standard potential of 0.222 VSHE at 25 °C. All potentials below are referenced to Ag/AgCl.

3. Results and Discussion

3.1. Calibration in a Water–Glycerol Mixture

Viscous load calibration was performed without connecting the potentiostat using four aqueous solutions with [0 0.95 1.50 3.35] wt% glycerol. The frequency and dissipation shifts of the QCM sensor were acquired as a one-minute average for the four solutions kept at 37 °C. The slope in Figure 1 is directly related to the coefficient of viscosity in the Kanazawa–Gordon Equation (1) [13]. The advantage of this method is that the slope can be acquired over a wide range of frequency and dissipation values.
Another approach is to evaluate time-resolved data in the same experiments. In this case, the correlation between frequency and dissipation is monitored during the experiment. This method is valid if there are no significant adsorption/desorption processes at the surface and the temperature has already been stabilized. Such curves are shown in Figure 2. The slopes are comparable to the one displayed in Figure 1. A significant advantage of this method is that it is specific to the electrolyte and quartz crystal used for the experiment and that it requires no additional experimental effort. Still, it is important to remember that the scale is considerably narrower than the one used in Figure 1, hence the deviations from the linear behavior in Figure 2. Using the initial data will inherently restrain the calibration to a narrow region, but by combining data from several experiments, it is possible to somewhat circumvent the problem, as illustrated in the plating experiments below.

3.2. Calibration of Mass Coefficient and Viscous Load Using Galvanostatic Plating

To obtain a calibration of the Sauerbrey coefficient, see Equation (3), a copper sulfate solution was used at 37.0 °C. Figure 3 shows the current density and potential development during the experiment. After an initial stabilization period of 30 s, the sample is plated in galvanostatic mode at −1 mA for 300 s; the deposit is then removed by applying a potential of 600 mVAg/AgCl for 60 s. The quartz is then cleaned, and the measurement can be reproduced.
Figure 4 shows the current and dissipation responses during the plating experiment. At open circuit, there is noise at a low level. During the plating experiment, there is a linear decrease in frequency, corresponding to a mass uptake from the deposit. There is also an increase in the dissipation signal.
Assuming a current efficiency of 100%, it is possible to calculate the relation between the frequency change and mass, or the Sauerbrey coefficient, see Equation (2). To obtain the pure mass shift, the frequency was corrected for dissipation using the slope from Figure 1. Overall, this shift was only minor. Figure 5 shows the Sauerbrey coefficients for solutions with glycerol concentrations from 0 to 5 wt%. It appears to increase slightly with glycerol content. The best value for the Sauerbrey coefficient is thus found for the solution with no addition of glycerol. Three measurements were performed on the same crystal giving [6.35, 6.85, 6.92] with an average of 6.7 ng Hz−1. The theoretical value is 4.6 ng Hz−1 for 25 °C, but the constant is heavily dependent on temperature; it is not possible to make a direct comparison with the value at 37 °C.
As for the water–glycerol measurements, it is possible to use the small variations in frequency and dissipation during the stabilization phase at open circuit potential to obtain an estimate of the relation between dissipation and frequency. Linear slopes for experiments in four different electrolytes with increasing glycerol content are shown in Figure 6. If the experiment is well stabilized at the beginning, the amplitude in ΔD and Δf will be small and the uncertainty in the slope will be higher. This can be seen in Figure 6: for the 1 wt% electrolyte, there were larger oscillations at the start of the experiment, and consequently, the calibration slope was more certain. Calibration slopes were determined for 18 experiments, collecting data from the initial 30 s of stabilization. Glycerol concentrations were set in the range of 0 to 5 wt%, resulting in an average slope value of −2.8 ± 2.1 Hz. This compares well with the value deduced from Figure 1 (−2.6 Hz ppm−1).
The former experiment has the advantage of spanning a larger range of viscosities and should be more precise, hence the need for a larger number of experiments to verify the method of using initial variations in data for the frequency-dissipation correlation. These slopes may be directly inserted into the Kanazawa–Gordon Equation (1).

4. Conclusions

In this paper, two methods for quantifying the contribution of viscous load on the total frequency response are proposed. In both cases, the energy dissipation is measured from the admittance of the oscillating circuit:
(1)
The crystal is exposed to a series of water–glycerol mixtures where no adsorption is occurring. This makes it possible to determine the frequency contribution from the viscous load for a comparatively wide range of viscosities.
(2)
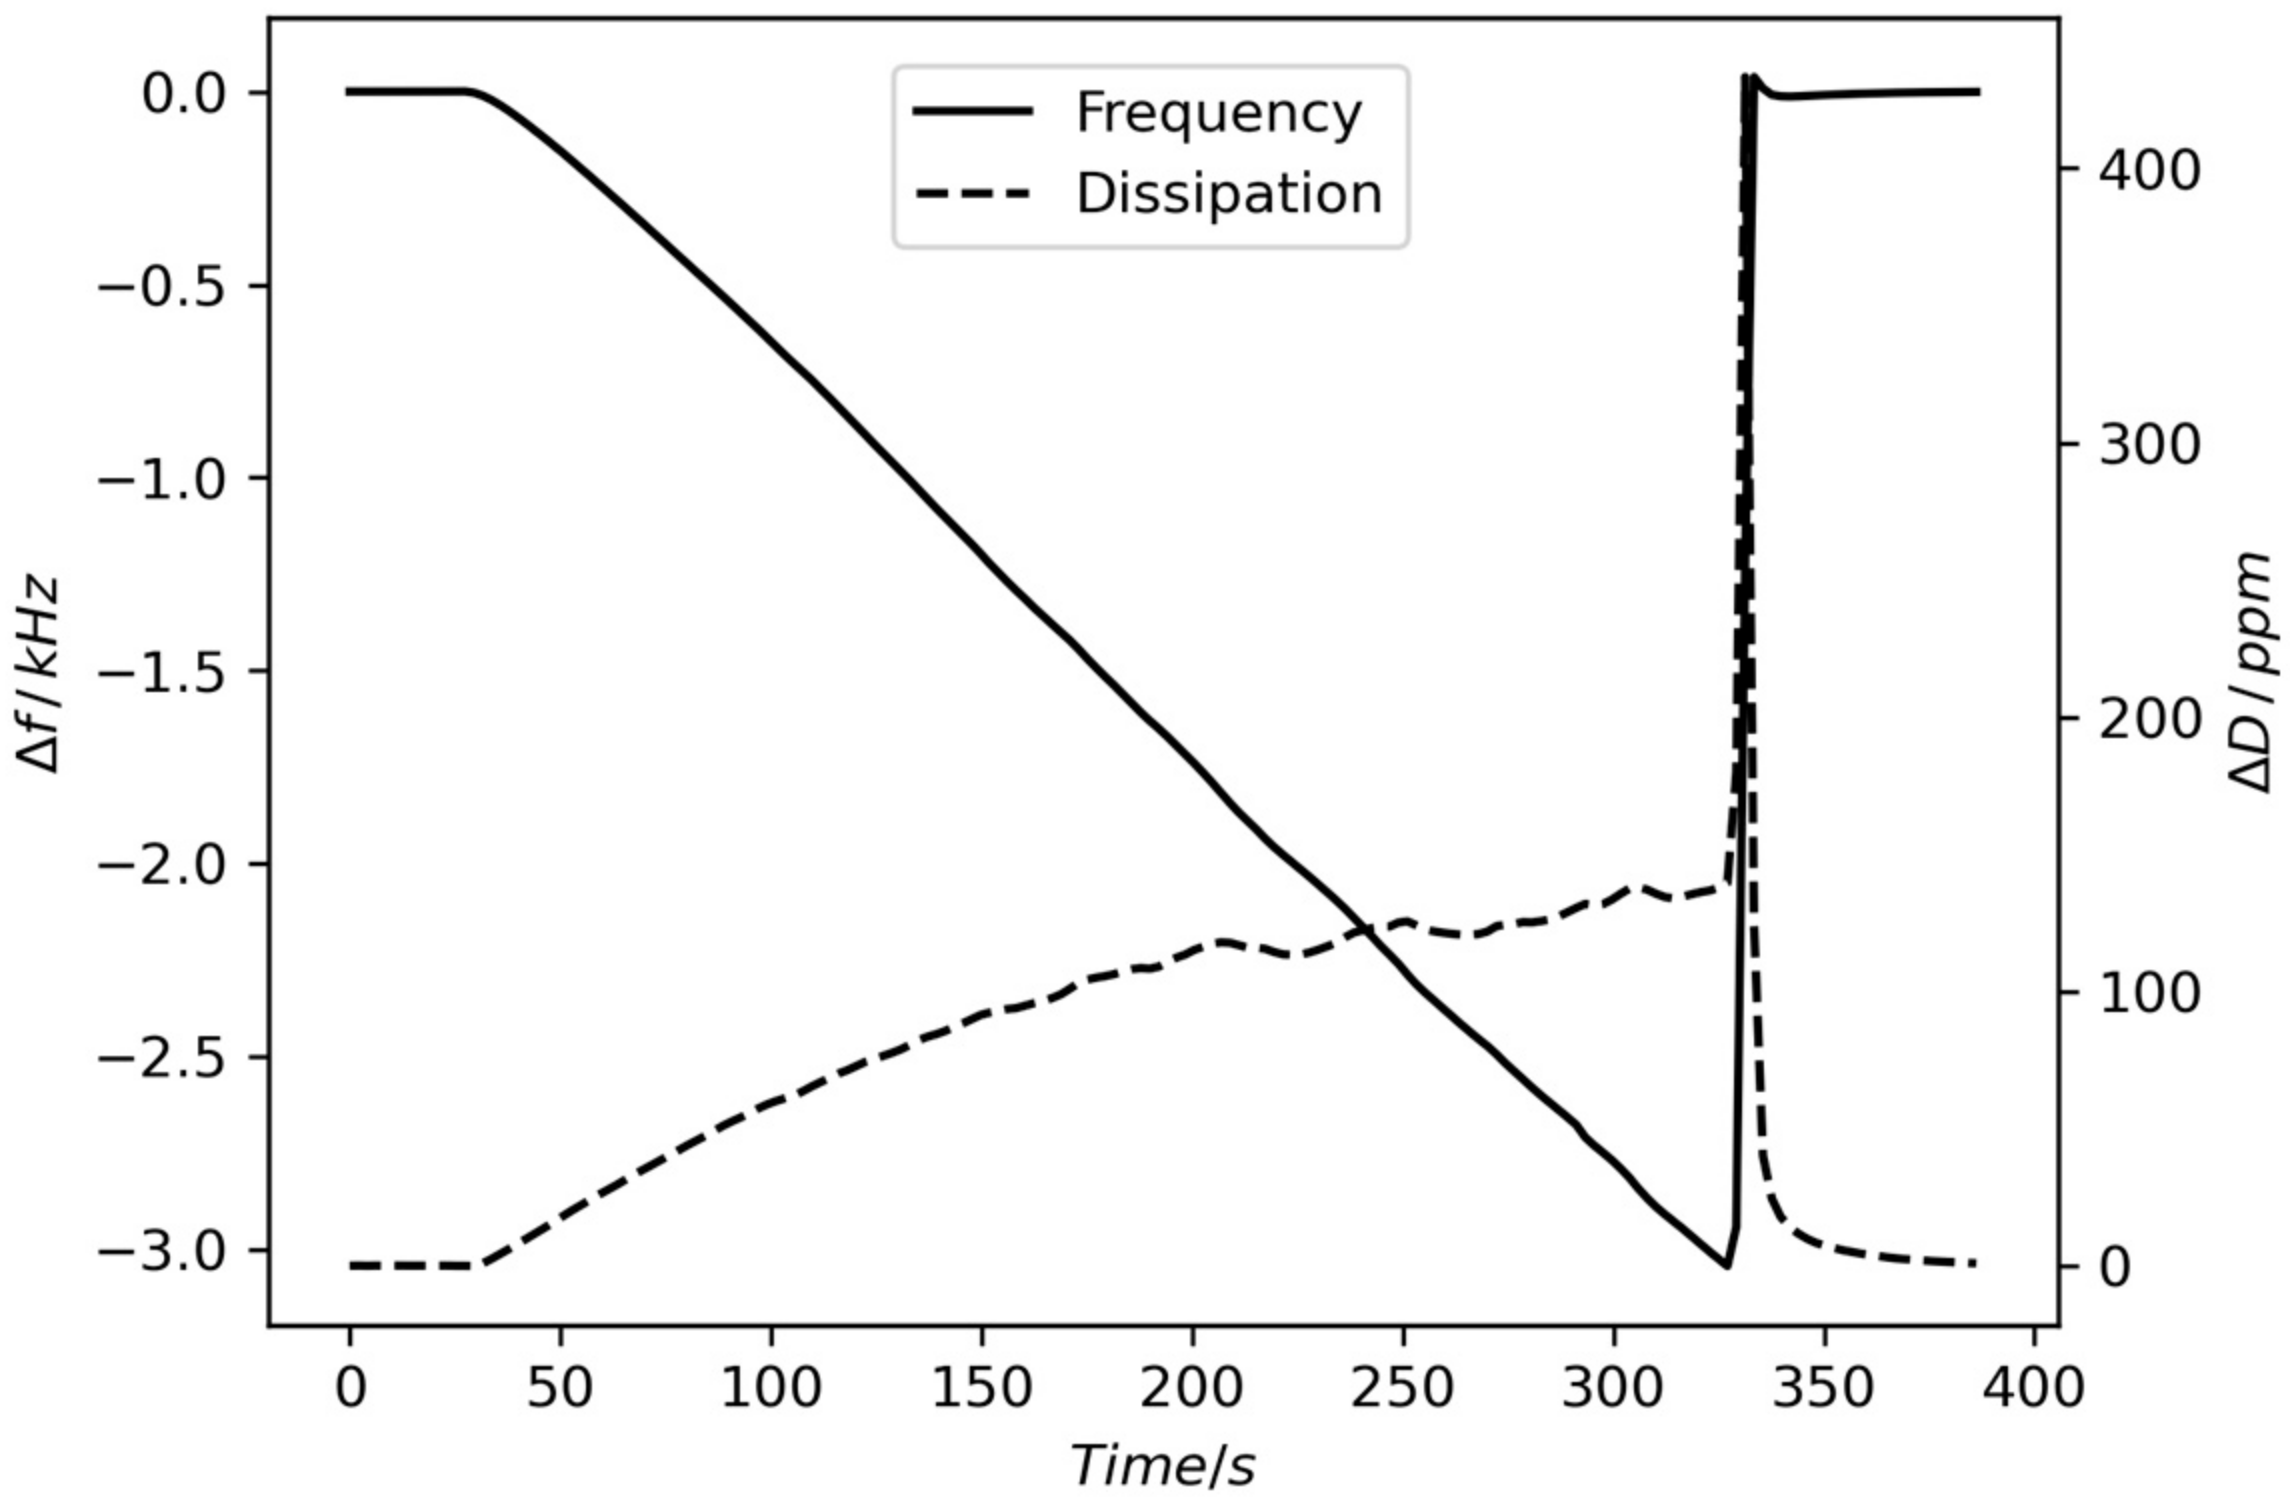
It is also possible to obtain the influence of viscous load on the frequency shift by following initial oscillations during a stabilization phase of the experiment where no adsorption is occurring. This allows us to determine the viscous load for a specific quartz/solution couple, i.e., to use a calibration specific to each experiment. This approach is, however, limited to a narrow range in dissipation and frequency.
Both approaches gave similar calibration constants, −2.8 and −2.6 Hz ppm−1, respectively.
In addition, the Sauerbrey constant was determined for a 5 MHz crystal immersed in a 37 °C plating solution to 6.7 ng Hz−1. The plating solution was a water–ethanol-based copper sulfate electrolyte with very close to 100% yield for macro deposits.

Author Contributions

C.-O.A.O. and A.N.I.-M. collaborated in the design and performance of experiments. C.-O.A.O. wrote the paper. A.N.I.-M. assisted with the proofing of the script. S.M. supervised and administered the project as well as acquired the necessary funding. All authors have read and agreed to the published version of the manuscript.

Funding

This research was funded by the Swiss National Science Foundation, grant number 200021-184851/1 “Mesynic”.

Institutional Review Board Statement

Not applicable.

Informed Consent Statement

Not applicable.

Data Availability Statement

Data, as well as the python evaluation scripts, can be obtained upon reasonable request to the main author (C.-O.A.O.).

Conflicts of Interest

The authors declare no conflict of interest.

References

  1. Levi, M.D.; Daikhin, L.; Aurbach, D.; Presser, V. Quartz Crystal Microbalance with Dissipation Monitoring (EQCM-D) for in-situ studies of electrodes for supercapacitors and batteries: A mini-review. Electrochem. Commun. 2016, 67, 16–21. [Google Scholar] [CrossRef]
  2. Levi, M.D.; Shpigel, N.; Sigalov, S.; Dargel, V.; Daikhin, L.; Aurbach, D. In Situ Porous Structure Characterization of Electrodes for Energy Storage and Conversion by EQCM-D: A Review. Electrochim. Acta 2017, 232, 271–284. [Google Scholar] [CrossRef]
  3. Leimbach, M.; Tschaar, C.; Schmidt, U.; Bund, A. Electrochemical characterization of chromium deposition from trivalent solutions for decorative applications by EQCM and near-surface pH measurements. Electrochim. Acta 2018, 270, 104–109. [Google Scholar] [CrossRef]
  4. Valero-Vidal, C.; Igual-Muñoz, A.; Olsson, C.-O.A.; Mischler, S. Adsorption of BSA on Passivated CoCrMo PVD Alloy: An EQCM and XPS Investigation. J. Electrochem. Soc. 2012, 159, C233. [Google Scholar] [CrossRef]
  5. Buttry, D.A.; Ward, M.D. Measurement of interfacial processes at electrode surfaces with the electrochemical quartz crystal microbalance. Chem. Rev. 1992, 92, 1355. [Google Scholar] [CrossRef]
  6. Olsson, C.-O.A.; Landolt, D.C. Analytical Methods in Corrosion Science and Engineering; Marcus, P., Mansfeld, F., Eds.; CRC Press: Boca Raton, FL, USA, 2006. [Google Scholar]
  7. Sauerbrey, G. Verwendung von Schwingquarzen zur Wägung danner Schichten und zur Mikrowägung. Z. Phys. 1959, 155, 206–222. [Google Scholar] [CrossRef]
  8. Voinova, M.V.; Rodahl, M.; Jonson, M.; Kasemo, B. Viscoelastic Acoustic Response of Layered Polymer Films at Fluid-Solid Interfaces: Continuum Mechanics Approach. Phys. Scr. 1999, 59, 391–396. [Google Scholar] [CrossRef] [Green Version]
  9. Fernandez, R.; Calero, M.; Reiviakine, I.; Garcia, J.V.; Rocha-Gaso, M.I.; Arnau, A.; Jimenez, Y. High Fundamental Frequency (HFF) Monolithic Resonator Arrays for Biosensing Applications: Design, Simulations, Experimental Characterization. IEEE Sens. J. 2020, 21, 284–295. [Google Scholar] [CrossRef]
  10. Itoh, A.; Ichihashi, M. A frequency of the quartz crystal microbalance (QCM) that is not affected by the viscosity of a liquid. Meas. Sci. Technol. 2008, 19, 075205. [Google Scholar] [CrossRef]
  11. Itoh, A.; Ichihashi, M. Separate measurement of the density and viscosity of a liquid using a quartz crystal microbalance based on admittance analysis (QCM-A). Meas. Sci. Technol. 2010, 22, 015402. [Google Scholar] [CrossRef]
  12. Olsson, C.-O.A.; Igual-Muñoz, A.N.; Mischler, S. Adsorption of organic matter on titanium surfaces with nano- and micro-scale roughness studied with the electrochemical quartz crystal microbalance dissipation technique. Biointerphases 2021, 16, 051001. [Google Scholar] [CrossRef]
  13. Kanazawa, K.K.; Gordon, J.G. Frequency of a quartz microbalance in contact with liquid. Anal. Chem. 1985, 57, 1770–1771. [Google Scholar] [CrossRef]
  14. Galliano, F.; Olsson, C.-O.A.; Landolt, D. Flow Cell for EQCM Adsorption Studies. J. Electrochem. Soc. 2003, 150, B504–B511. [Google Scholar] [CrossRef]
  15. Kelly, J.J.; Rahman, K.M.A.; Durning, C.J.; West, A.C. Effect of Current Distribution on Quartz Crystal Microbalance Measurements. J. Electrochem. Soc. 1998, 145, 492–497. [Google Scholar] [CrossRef]
Figure 1. Frequency–Dissipation plot of four different water glycerol mixtures indicating a linear relation between frequency and dissipation (dotted line).
Chemosensors 11 00456 g001
Figure 2. Relation between dissipation and frequency during immersion in four water–glycerol mixtures. The slope is the proportionality between frequency and dissipation as expressed in the Kanazawa–Gordon Equation (1).
Chemosensors 11 00456 g002
Figure 3. Current and potential response in the galvanostatic plating experiment.
Chemosensors 11 00456 g003
Figure 4. Frequency and dissipation response for the galvanostatic plating experiment.
Chemosensors 11 00456 g004
Figure 5. Sauerbrey coefficients obtained in a copper-sulfate solution containing 0 wt% to 5 wt% glycerol, calculated from 40 to 270 s within the plating experiment outlined in Figure 3 and Figure 4. The temperature was 37 °C.
Chemosensors 11 00456 g005
Figure 6. Dissipation vs. Frequency curves for the initial stabilization period of the galvanostatic plating experiments. The slopes can be used directly in the Kanazawa–Gordon Equation (1).
Chemosensors 11 00456 g006
Table 1. List of variables.
Latin
AcurrWorking Electrode sensing area1.14 cm2
AoscOscillating area, mass- and dissipation sensing0.26 cm2
CsSauerbrey constantg s or g Hz−1
ΔDDissipation change, energy loss per osc. Cycleppm
fmFrequency change related to massHz
f0Base frequency≈5 MHz
FFaraday Constant96,485 C mol−1
kProportionality constantMHz or Hz ppm−1
IPlating currentA
iPlating current densityA cm−2
MCuMolar mass of copper63.54 g mol−1
ΔmMass changeng
nValence number2
tTimes
Greek
ρqQuartz density2.65 g cm−3
ρlWater density at 37 °C0.99327 g cm−3
μqQuartz shear modulus2.956 × 1011 g cm−1 s−2
ηlDynamic viscosity of water at 37 °C8.92 N s cm−2
Disclaimer/Publisher’s Note: The statements, opinions and data contained in all publications are solely those of the individual author(s) and contributor(s) and not of MDPI and/or the editor(s). MDPI and/or the editor(s) disclaim responsibility for any injury to people or property resulting from any ideas, methods, instructions or products referred to in the content.

