
Smartphone-Based Portable Bio-Chemical Sensors: Exploring Recent Advancements
by
 , ,
, ,
The Huy Bui
1,
Balamurugan Thangavel
1,
Mirkomil Sharipov
2,
Kuangcai Chen
3 and
Joong Ho Shin
1,* 1
Major of Biomedical Engineering, Division of Smart Healthcare, College of Information Technology and Convergence, Pukyong National University, Busan 48513, Republic of Korea
2
School of Mechanical Engineering, Yonsei University, Seoul 03722, Republic of Korea
3
Imaging Core Facility and Department of Chemistry, Georgia State University, Atlanta, GA 30303, USA
*
Author to whom correspondence should be addressed.
Chemosensors 2023, 11(9), 468; https://doi.org/10.3390/chemosensors11090468
Submission received: 22 July 2023
/
Revised: 16 August 2023
/
Accepted: 19 August 2023
/
Published: 22 August 2023
(This article belongs to the Special Issue Application and Advance of Optical Immunosensors)
Abstract
:Traditionally, analytical chemistry and diagnosis relied on wet laboratories and skilled professionals utilizing sophisticated instruments for sample handling and analysis. However, with the development of novel materials and sensing techniques, there has been a significant shift towards the use of standalone sensors, allowing tests to be conducted on-site or even in real time, leading to cost- and time-efficiency. With their widespread adoption globally, smartphones have emerged as an ideal platform for such sensors, boasting extensive sensor capabilities, advanced processing power, and communication functionalities. Smartphone-based assays make use of optical and electrochemical sensors, utilizing built-in cameras, ambient light sensors, and other features for optical sensing, while the micro-USB port, Bluetooth, and wireless connection facilitate data transmission and analog voltage application for electrochemical sensing. Previous overview papers have explored smartphone-based sensing in specific domains; this review provides a comprehensive examination of recent advancements in smartphone-based sensors, encompassing both optical and electrochemical sensing methods. The review provides the fundamental principles of these sensors and their implementation using smartphones, showcases recent applications, and presents innovative designs that take advantage of the inherent functionalities and sensor capabilities of smartphones. The review concludes by offering an outlook on the prospects of smartphone-based sensing and includes a reflective section emphasizing the potential impact of sensors in chemical and biological analyses. This comprehensive resource aims to provide information to researchers and practitioners interested in using smartphones for cutting-edge analytical methodologies.
1. Introduction
Traditionally, chemical and biological analyses have been conducted in wet laboratories by skilled professionals who perform a variety of sample-handling procedures using various analytical instruments. Analytical instruments in a wet laboratory can perform both optical and electrochemical sensing. Optical sensing is commonly carried out using a spectrophotometer, while electrochemical sensing is conducted using electrodes such as pH, ion-selective, conductivity, or impedance analyzers. Although these analyses are very accurate, they use expensive and bulky instruments that are not available in every region. In the last decades, these laboratory-based analytic methods have been superseded by standalone sensors. This shift has resulted in significant reductions in the cost and time required for such analyses and has enabled them to be performed at the point of care or even in the comfort of the patient’s own home.
Sensors typically employ a receptor and a transducer to detect and measure analytes. The receptor specifically binds or reacts with the target analytes, after which it is necessary to quantify the extent of this reaction. Transducers play a crucial role in this quantification process and are an essential component of all sensors. Although there are various types of transducers available, optical and electrochemical transducers are most commonly used.
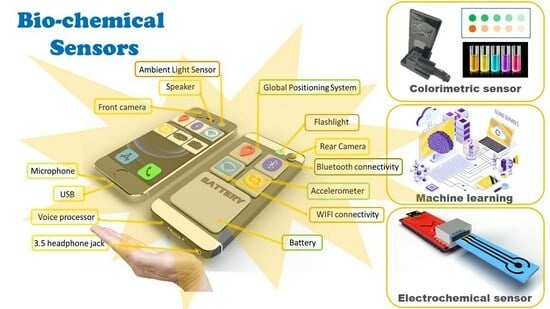
Wireless phones have a long history that stretches back to the early years of the 20th century. Smartphones are now one of the most in-demand mobile devices on the market, with a staggering 7.3 billion people utilizing them worldwide. Smartphones are packed with a diverse array of sensors, integrated software features, and top-of-the-line processors that transform them into portable computers that can be held in the palm of your hand. Modern smartphones also have superior processing abilities, huge data storage capacities, and the ability to communicate both raw and processed results to cloud storage or other mobile devices. A smartphone is more than just one of means of communication, as it incorporates multiple functions. Many smartphones come equipped with a range of optical sensors, such as front and rear cameras, ambient light sensors (ALSs), proximity sensors, IR sensors, and white light-emitting diode (LED) flashes, which can be used for optical sensing purposes. Moreover, the micro-USB port found on these devices has a dual functionality. It can serve as a means to charge the device’s battery using an AC/DC converter, as well as transmit digital data and analog voltage to and from the device. These capabilities are particularly important for electrochemical sensing, which necessitates the application of analog voltage to the sensor and the gathering of voltage, current, and resistance signals.
So far, various overview papers have covered the utilization of smartphones in biochemical sensing; however, they tend to focus on specific domains [1,2,3], or does not explain the sensors’ mechanism in detail [4,5]. Thus, this review aims to provide a comprehensive overview of recent advancements in smartphone-based sensors, covering both optical and electrochemical sensing methods. The basic principles of these sensors and how they can be applied using a smartphone will be discussed in the second and third section. The following sections will highlight recent applications of both types of sensors. As a result, this review aims to present fresh concepts and innovative designs that leverage the smartphone’s existing functionalities and sensor capabilities to create new analytical devices. Finally, the paper will conclude with an outlook and a section for reflection.
2. Fundamental Concepts Underlying Optical Sensing Using a Smartphone
An optical transducer commonly serves as a light sensor. The key principles of this sensing technique involve detecting light with the smartphone’s camera or ambient light sensor. Light can come from either the smartphone’s flash or an external source, and the captured image is then processed using software algorithms to extract relevant information about the measured sample [6,7,8,9].
2.1. White LED Flash
The majority of digital cameras are equipped with a flash, allowing pictures to be taken in low-light or dark conditions. Today, the smartphones’ flash lights are mainly composed of white light-emitting diodes (LEDs). White LEDs are designed to mimic daylight, with a light spectrum similar to that of sunlight. To create LEDs and photodiodes, p-type and n-type semiconductors are combined. In contrast to photodiodes, which use a reverse-bias voltage to detect light, a forward-bias voltage is applied. When additional electrons and holes flow into the LED, they combine and generate photons. The peak emission of the LED depends on the type of semiconductor material [10]. White LEDs consist of two or three different LEDs, one emitting blue light and the other emitting yellow and red light, which combine to produce all three colors (red-R, green-G, and blue-B) in the visible spectrum [11]. Although the spectrum of white LEDs is not flat like that of sunlight or Xenon lamps, the human eye cannot distinguish the difference [12,13].
2.2. Built-In Smartphone Digital Camera
Smartphones are all equipped with digital cameras that contain an array of photodiodes. These photodiodes are composed of two distinct semiconductors, namely, p-type and n-type, which are joined together. In the p-layer and n-layer, holes and electrons are generated, respectively. As they move away from each other, a small depletion region is formed at the p–n junction, making it less conductive. When a reverse-bias voltage is applied to the system, the holes are drawn towards the negative voltage, and the free electrons are attracted to the positive voltage. This movement of charges enhances the depletion region, making it more pronounced and widening the separation between the areas of positive and negative charge within the semiconductor material. When light passes through the built-in windows and, subsequently strikes the p-type semiconductor, it strips electrons from the molecules, creating extra holes and free electrons. These additional charged species are then neutralized by incoming holes and electrons from the voltage source, producing a current. In the absence of light, no current flows due to the presence of the depletion region [10].
Light can stimulate electrons to a higher energy level when it strikes the semiconductor material in a photodiode. As a result, electrons move around and leave holes in their path. Moving toward the photodiode’s cathode terminal are electrons, while moving toward the anode terminal are holes. A voltage is produced between the two terminals as a result. Even when there is no visible light, this still occurs. Dark current is the small amount of current generated in the absence of visible light. Zero-bias or photovoltaic mode are the two names for it. When a photodiode is operating in photoconductive mode, the light that strikes it produces pairs of electrons and holes in the semiconductor material. The applied bias voltage causes these to move in the opposite directions. A small current, consequently, passes through the photodiode. Compared to the photovoltaic mode, the photoconductive mode provides a quick response. This is because the applied reverse-bias voltage caused the depletion layer to be wider and the capacitance to decrease. Photodiodes can be used in both photoconductive and photovoltaic modes, with the former being more prevalent and offering better sensitivity [14].
One individual photodiode has the capability to produce just a singular signal, whereas a two-dimensional array of photodiodes has the capacity to capture an entire image. In the past, charge-coupled device (CCD) arrays were employed for this purpose. However, in modern times, complementary metal oxide semiconductor (CMOS) arrays have gained greater prevalence. The signal must be amplified because each photodiode has a very small quantity of charge. The CMOS array includes an amplifier built into each photodiode, resulting in a higher sensitivity and sharper images than CCD arrays, which amplify the signal after it is transferred from serial photodiodes to the collector register [15]. To generate RGB (red, green, and blue) in a CMOS sensor, color filters are used. A color filter is placed on each photodiode, which only allows a specific wavelength of light to pass through. These filters are positioned in a Bayer pattern, consisting of a 2 × 2 grid of color filters that comprise one red, one blue, and two green filters. As light enters the 2D photodiode array, it gets filtered by these color filters, and each photodiode records the intensity of the filtered light. These intensity values for RGB are then combined to create a complete color image [16].
2.3. Ambient Light Sensor of Smartphone
Ambient light sensors, also known as color or spectral sensors are inexpensive components that have a significant impact on the performance of high-end smartphones. These sensors consist of a small number of photodiodes with optical coatings, each transmitting a different wavelength of light. A photodiode/coating pair is called a “channel”. For instance, a basic ambient light sensor may have two channels: one for visible light and another for near-infrared (NIR). The visible channel detects ambient light levels, while the NIR channel facilitates proximity sensing, such as turning off the display when the phone is brought close to the user’s ear during a call. More advanced sensors have multiple color channels (e.g., red, green, and blue) to provide more information about ambient lighting conditions. These sensors are used to control the brightness of the smartphone display according to ambient conditions, directly affecting the user experience and battery life [17].
The smartphone’s operating system utilizes the ambient light sensor (ALS) to optimize display brightness, which is measured within the spectral range of 350 nm to 1050 nm, similar to the human eye’s response. Many smartphones now come with built-in ALS technology to adjust the brightness of the screen according to the surrounding light, reducing battery consumption. It is worth noting that the ALS’s dynamic response may vary across different smartphone models. In smartphones, the front panel integrates a sensor module that combines the ALS and proximity sensors. This module includes two distinct photodiodes and a low-power infrared LED. One photodiode is sensitive to both visible and infrared light for ambient light sensing, while the other photodiode primarily detects infrared light for proximity-related detection. By integrating these sensors, the smartphone achieves proximity detection and ambient light detection, and maximizes battery performance [18].
2.4. Utilizing Mobile Phone’s Optical System for Colorimetry and Spectrophotometry
Optical biochemical sensing can be performed using either colorimetry or spectrometry for detection. In colorimetry, the concentration of the target can be determined by measuring the light intensity at a specific wavelength. The target molecules selectively absorb certain wavelength ranges, causing a decrease in light intensity. By detecting this change, which is also known as colorimetry, the concentration of the target can be detected. In spectrometry, light intensity is measured across a range of wavelengths, creating a spectrum that can indicate the presence of certain chemical groups [19]. Optical analytical equipment often comprises a light source, monochromator, holder, and photodetector. Smartphones can be utilized to create a simple colorimetry and spectrophotometry system. The smartphone’s flashes, camera, or ambient light sensor can serve as the light excitation source and photodetector, respectively. While smartphone flashes emit polychromatic light, attaching optical filters or a diffraction grating can separate monochromatic light. Similarly, attaching a diffraction grating to the smartphone camera enables the detection of specific wavelengths.
While some target molecules may have a distinctive color that separates them from other molecules in a sample, distinguishing them based on absorption measurements at a specific wavelength can be challenging. This is especially true when using the smartphone’s camera as a photodetector, as the recorded image comprises a matrix of the red (R), green (G), and blue (B) components.
3. Fundamental Concepts Underlying Electrochemical Sensing Using a Smartphone
As mentioned above, the micro-USB port of smartphones can transmit digital data and analog voltage to and from the device. This is especially important for electrochemical sensing, which requires applying an analog voltage to the sensor and gathering voltage, current, and resistance signals. Electrochemical sensors are divided into three types: conductometric, potentiometric, and amperometric sensors [20]. These sensors measure conductance, current, and voltage, respectively, and are based on the principles of Ohm’s law (V = IR). Ohm’s law relates electric voltage (in volts, V), electric current (in amperes, A), and electric resistance (in ohms, Ω). An electrochemical sensor’s basic electric circuit comprises two resistors linked in series: one is the resistance of the bio-chemical sensor (RS), while the other is a known resistor. The electric circuit is connected with a constant bias.
3.1. Conductive Sensor
A conductive sensor, also known as a conductometry sensor, is used to directly record alterations in the RS. Conductive sensors are a type of electrochemical sensor that determines the concentration of ions or charged species in a sample solution by measuring its electrical conductivity. Typically, these sensors comprise two electrodes submerged in the sample solution with a potential difference applied across them. The concentration of ions or charged species present in the solution is proportional to its conductivity. Conductivity changes caused by the introduction of a particular analyte or variations in ion concentration in the sample are measured by a conductometry sensor [21].
3.2. Potentiometric Sensor
If the target variable being tested causes a change in RS, the voltage output will also vary. The voltage output, Vout, is then measured, and the sensor is called a potentiometric sensor. The most commonly used potentiometric sensor is the ion-selective electrode (ISE), which measures the potential difference between two electrodes under no current flow. The measured potential is correlated to the concentration of the analyte of interest as given by Nernst equation (E = E° − (RT/nF) × ln(Q)). The most common type of potentiometric sensor is membrane-based ion-selective electrodes (ISEs), which are mainly employed in biosensing applications. These ISEs are made out of a glass tube containing a reference electrolyte solution and an ion-selective membrane at one end. The ion-specific membrane solely permits the desired ions to pass through, resulting in a small change in the target ion concentration and an associated change in the potential difference [22].
3.3. Amperometric Sensor
The current flowing through the circuit is varied while keeping RS constant, and the resulting electric current is read out; the sensor used for this purpose is known as an amperometric sensor. In the amperometric sensor, the constant potential is applied to the sensor electrodes and measures the concentration of a target analyte in a sample by detecting the electrical current produced by an oxidation or reduction reaction. These sensors typically consist of a working electrode, a reference electrode, a counter electrode, and an electrolyte solution. The working electrode is made of a material that facilitates the desired electrochemical reaction with the target analyte. As the target analyte is oxidized or reduced at the working electrode, an electrical current is generated that is proportional to the concentration of the analyte. The reference electrode is used to maintain a constant potential at the working electrode, and the counter electrode is used to complete the current flowing, while the electrolyte solution facilitates the flow of ions between the electrodes [23].
3.4. Micro-USB Port, Bluetooth, and NFC
Voltage, current, and conductance signals produced by electrochemical detection methods are transformed into analog voltage signals. The voltage drop across a known resistor can be measured to obtain a voltage signal from a current signal, while a Wheat-stone bridge can be used to convert a conductance signal into voltage. However, these analog voltage signals need to be converted into digital signals using an analog-to-digital converter (A/D converter) before they can be further processed. Microcontrollers are compact computers that can receive and process both analog and digital signals through multiple channels. The Arduino is one of the most commonly used customizable microcontrollers, equipped with multiple pins that can receive both analog and digital signals [24]. The Arduino board has an integrated A/D converter, which allows the processing of analog signals. Additionally, the Arduino has a microprocessor and a small memory, allowing for the uploading of compiled code through its USB port for the digital processing of input data. Finally, the processed results can be sent back to other devices such as mobile phones through the USB port.
Nowadays, micro-USB ports are frequently incorporated into smartphones, providing a reduced version of the standard USB port. These ports are designed to enable swift digital data transfer between a phone and a computer, as well as data transfer from a computer to a phone. Smartphone applications can use processed digital signals to present assay outcomes to users. The micro-USB port can also serve as a means of charging a phone’s battery through an AC-to-DC adapter, and it can provide power to external devices by drawing from the phone’s battery. This is particularly advantageous when using adapters and microcontrollers that can derive energy from the phone’s battery [25].
Bluetooth is an option for short-range wireless data transmission on smartphones. A circuit board adaptor can also send digital signals wirelessly to smartphones. Near-field communication (NFC) is a newer wireless data transmission technology that transfers both data and power, making it suitable for electrochemical and biochemical sensing adaptors. However, NFC has a short transmission range of only a few centimeters, while Bluetooth can transmit over approximately 10 m [26,27].
4. Applications of Bio-Chemical Optical Sensors Using a Smartphone
Using a smartphone to capture images and then analyze their color is the simplest application for analyzing data from a colorimetric assay. Integrating smartphones with supporting components offers a convenient solution to create portable, homemade sensor devices. By harnessing the power of three-dimensional (3D) printing, which has experienced substantial advancements in recent years, we may design and create customized parts or components with a 3D printer to incorporate into their homemade devices. A 3D printer is a computer-controlled machine that can build 3D objects out of layers of materials like resin, metal, or plastic. It functions by precisely depositing the material layer to construct the desired product. Such features give more freedom and creativity to develop original solutions for certain problems or applications. For the creation of specialized objects, parts, and prototypes, 3D printers are widely employed across a variety of industries, including manufacturing, prototyping, design, and healthcare [28,29,30,31,32]. The combination of the power of smartphones and 3D-printing devices has also led to the development of portable and real-time sensors, which will be described in the following section.
4.1. Smartphone-Camera-Based Biochemical Sensors
4.1.1. Healthcare/Biomedical Sensors
Near-field communication (NFC) technology facilitates a wide range of applications, including contactless payments, access control, data transfer, and device pairing. A versatile and soft microfluidic device in coupling with an NFC device has been developed by Ahyeon Koh et al. [33] to collect sweat directly and consistently from the skin surface. The device comprises multiple channels and reservoirs for sensing various targets. The microfluidic design includes four channels for detecting lactate, glucose, chloride, and creatinine. The authors induced a color alteration in a chromogenic reagent by employing enzymatic interactions involving lactate, with NAD+ (nicotinamide adenine dinucleotide) as a cofactor, along with lactate dehydrogenase and diaphorase enzymes. Glucose concentration is determined through an enzymatic reaction between glucose and glucose oxidase that liberates hydrogen peroxide and oxidizes iodide to iodine, resulting in a change in the color of iodide from yellow to brown. Chloride sensing is based on the competition between Hg2+ and Fe2+ with 2,4,6-tris(2-pyridyl)-s-triazine (TPTZ). In the presence of chloride ions, iron ions (Fe2+) form a bond with TPTZ, while Hg2+ acts as HgCl2, causing a color shift from clear to blue. Creatinine is detected through the reaction of creatinine with a mixture of enzymes (creatininase, creatinase, and peroxidase) resulting in a color change of 4-aminophenazone dye. The microfluidic device has an integrated NFC electronic system on top, which records and converts color changes into quantitative data. This system is controlled by a smartphone, allowing images to be captured and information to be transferred to an analysis application (app) on the phone. The devices can be attached to the body in various locations without causing chemical or physical irritation. Figure 1i depicts a microfluidic-based wearable sweat sensor utilizing an NFC interface with a smartphone.
Until 2017, smartphone spectrometers could only detect a single channel at a time, making it challenging to analyze multiple samples simultaneously, especially in on-site biomedical diagnostics. However, most biomedical immunoassays or diagnostic tests use microplates for high-throughput testing, and using single-channel smartphone spectrometers directly on these assays is difficult. To overcome this challenge, Wang’s group [34] developed a highly sensitive multichannel smartphone spectrometer (MSS) as an optical biosensor. They resolved two challenges in achieving accurate multichannel optical sensing using a smartphone camera. The first challenge involved addressing the field-of-view (FOV) mismatch between the camera and the samples, which could result in optical aberrations and inaccurate analytical results. The second challenge was to prevent unwanted spectral interference between adjacent channels. Wang’s team designed an economical solution by creating a micro prism array that expanded the FOV to align with that of a microplate. Additionally, they employed a backlight panel and a micro-aperture array to ensure consistent and isolated illumination for each channel of the multichannel spectrometer, effectively eliminating spectral interference. Consequently, they successfully created an eight-channel spectrometer, utilizing a commercial 96-well microplate design as their foundation. The smartphone camera’s detecting sensor is controlled by the smartphone’s camera application (app), which automatically adjusts the optical parameters for different circumstances. As evidence, this system was validated on the quantification of protein and human interleukin-6 (a biomarker of lung cancer). Figure 1ii shows the 3D model and assembly setup of the multichannel smartphone spectrometer. With the 3D-printed multichannel spectrometer, it resolved the FOV and interference problems.
Spermine is a naturally occurring polyamine compound that is found in all living organisms, including plants, animals, and bacteria. It is a biogenic amine that plays essential roles in various biological processes. Nghia et al. [35] proposed a new paper-strip-based method for sensing spermine that is both simple and highly efficient. This method relies on the fluorescence quenching of the ciprofloxacin–Tb3+ complex by spermine. The detection areas on the paper strip test are demarcated by wax ink and filled with ciprofloxacin-Tb3+ solution. The color strength is recorded and analyzed with the use of a smartphone to determine the quantity of spermine by monitoring the change in color strength, which begins with the fluorescence quenching of the ciprofloxacin–Tb3+ complex. The suggested system is validated compared to the results from the UV-Vis spectrometric method.
Tannic acid, also referred to as tannin, is a polyphenolic compound that occurs naturally in different plants. It is derived from plant sources and has been identified for its potential antioxidant and anti-cancer characteristics. Nghia et al. [36] introduced a novel and expedient technique to quantify tannic acid (TA) using a fluorescent polymer (FP) derived from polyethyleneimine through a Schiff base reaction with formaldehyde under ambient conditions. The introduction of TA alongside Eu3+ ions resulted in the reduction of the fluorescence (FL) intensity of the FP. This occurrence is ascribed to the strong co-ordination interplay between FP-Eu3+ and the hydroxyl group of TA, coupled with the likeness in energy levels between FP and the energy difference of TA. This interplay enables the creation of a complex and eases the transmission of excited electrons from the FP–Eu3+ complex to TA. To create a simple and user-friendly TA sensor for on-site application, the authors employed a compact homemade device that uses a smartphone camera. The changes in the FL intensity of the FP sensor are recorded and converted into RGB values by the smartphone to determine the TA concentration.
Folic acid, also known as folate or vitamin B9, is an essential nutrient that plays a crucial role in several bodily functions. A simple visual folic acid (FA) sensor has been introduced by Nghia et al. [37]. The sensor relies on the alteration in color produced by a complex of rhodamine B-derivative (RhB-HS) and Cu2+ ions in the presence of FA. The Cu2+ ions are attached to RhB via salicylaldehyde and function as an FA tracer. The interaction between RhB-HS and FA is responsible for the significant improvement in the spirolactam ring-opening reaction of RhB-HS. The resulting color change due to FA can be detected either by UV-vis spectroscopy or through visual observation. To create a portable device, RhB-HS is deposited on filter paper to create a paper-based colorimetric sensor for FA. The resulting color changes due to FA are captured using the built-in camera of a Galaxy Note 8 smartphone, and the RGB values of the images are analyzed using a custom-built color analysis app to quantify the FA concentration.
Wang et al. [38] have developed a glucose-sensing technique that combines dual-mode ratiometric fluorescence and colorimetric detection using a smartphone. Their approach is based on mimicking the activity of FeCo by using Fe,Co-doped carbon nanoparticles (Fe,Co-CQD) to demonstrate peroxidase-like activity toward the substrate o-phenylenediamine (OPD)—a non-fluorescence reagent—under alkaline conditions. Glucose oxidase (GOx) catalyzes glucose oxidation to produce H2O2, which triggers a reaction with OPD to form 2,3-diaminophenazine (DAP). This transformation leads to a shift in the solution’s color from colorless to yellow. The produced DAP demonstrates a distinctive UV absorption peak at 420 nm and concurrently emits fluorescence at 555 nm, effectively suppressing the intrinsic fluorescence peak of Fe,Co-CQD (439 nm) through the inner filter effect (IFE). These fundamental principles have been harnessed to establish a blood-glucose-sensing technique that combines dual-mode ratiometric fluorescence and colorimetric detection under physiological pH conditions.
The authors developed a colorimetric sensing setup with smartphone integration, comprising a compact visual detection kit and a 3D-printing apparatus. Within the detection kit, a colorimetric reaction transpires on a spherical hydrogel, while the 3D-printing device secures both the smartphone and the hydrogel. The smartphone’s “Color Grab” application captures and assesses the color attributes (RGB values) of the hydrogel sphere. Notably, the study revealed a linear correlation between the logarithm of the blue channel value and glucose concentrations, enabling the accurate determination of the glucose concentration.
Duan et al. [39] introduced a photochemical biosensor that operates on smartphones, enabling the simultaneous detection of glucose, UA, and total cholesterol (TC) from a small amount of blood collected from the fingertip. The system consists of disposable test strips, a portable photochemical dongle, and a smartphone connected to the cloud. With just a few droplets of blood samples applied to the disposable test strip, the microcontroller unit (MCU)-controlled dongle can quickly read and calculate the concentrations of glucose, UA, and TC within 2 min. To ensure versatility for field applications, the system includes a temperature controller module. The smartphone connects to the dongle via both a Type-C port and Bluetooth, serving both power supply and data transmission purposes. The obtained test outcomes are exhibited on the smartphone screen and, subsequently, shared with designated healthcare networks via an internet connection. This setup can encourage interaction and communication among medical professionals, caregivers, and patients.
The photochemical system operates on the principle of using biosensors to detect the spectrum of light reflected from disposable test strips, which is then converted into optoelectronic signals for measurement. These test strips are designed with three reaction areas that contain different immobilized enzymes for detecting glucose, UA, and TC levels in the blood. The technique employed for detecting all three analytes hinges on Trinder’s reaction, where enzymatic processes generate H2O2, leading to the formation of a blue-colored oxidized compound from the condensation of aniline sodium salt and 4-aminoantipyrine. The concentration of this compound correlates with the depth of the chromogenic layer, resulting in distinct reflection coefficients (RCs). In order to identify the colored sections on the test strip, the biosensor employs LEDs to emit a consistent current and then captures reflected light on silicon photocells. A MCU-controlled optoelectronic circuit reader, coupled with an analog-to-digital converter, transforms the reflected light signals into digital electronic signals. Within the MCU, an embedded core algorithm module calculates the signal intensities, and the determined analyte concentrations are subsequently transmitted to a smartphone via Bluetooth for display. As the color intensity and reflected light intensity are correlated with the analyte concentrations, the system provides an accurate quantification of glucose, UA, and TC concentrations in human blood. The sensor’s limits of detection for glucose, UA, and TC are 1.67 mM, 119 μM, and 2.59 mM, respectively.
Ibuprofen is classified as a nonsteroidal anti-inflammatory drug (NSAID), whereas chloramphenicol and florfenicol belong to the antibiotic class of medications. Tang’s team [40] has developed a novel sensing platform using acid-sensitive fluorescence-imprinted polymers integrated with a smartphone for detecting ibuprofen, chloramphenicol, and florfenicol. The fluorescence-imprinted polymers, including Fe/Zr-MOF@MIP, g-CdTe@ZIF-67@MIP, and r-CdTe@ZIF-67@MIP, are synthesized through sol-gel polymerization. The resulting tri-color ratiometric fluorescence-imprinted sensor is optimized at various pH levels to enable the visual detection of the target compounds. This platform can detect these compounds in water samples, meat, and urine by capturing the fluorescence sensor colors and reading out the RGB values using a smartphone. It provides a promising new approach for multi-target substance detection in real-world environments.
Colorimetric or fluorometric sensors often employ various types of reactors, such as filter papers, plastic tubes, quart cuvettes, or microfluidic devices. Among these options, paper-based sensors are particularly convenient due to their affordability and ease of disposal through incineration. However, a challenge arises when solutions containing the sensor material and target are applied to the reaction areas, which are patterned on regular or filter paper. This application process can lead to the occurrence of the coffee-ring effect, causing an uneven distribution of the sample. Liu et al. [41] introduced a paper-based colorimetric protease biomarker assay that utilizes proteolysis-responsive transcription and AuNP-based spherical nucleic acids (SNAs). When a target protease triggers proteolysis, it initiates RNA synthesis through in vitro transcription. This, in turn, leads to the aggregation of SNAs, resulting in a noticeable shift towards longer wavelengths in the absorption of surface plasmon resonance. Consequently, the color of the paper-based test strip changes from red to blue. The researchers captured images of the test strip using a smartphone and conducted subsequent analyses. They discovered that SNAs immobilized on the glass fiber membrane exhibited the most favorable distribution, yielding the highest intensity. The results demonstrated a linear correlation between the ΔR/R value (where Δ = 255 − R, and R represents the red value from the analyzed image in RGB) and matrix metalloprotease-2 (MMP-2) concentrations within the range of 0.01–1.0 nM. The calculated limit of detection (LOD) was 5.7 pM. This assay exhibited a high sensitivity and specificity in detecting MMP-2. Furthermore, the suggested assay has potential applications for other protease biomarkers such as thrombin and hepatitis C virus NS3/4A.
The presence of water content in organic solvents can give rise to several challenges and complexities, including diminished solvent performance, phase separation, potential product degradation, and the risk of lowered flash points and increased volatility. Hong et al. [42] utilized the benzothiazole group, which is commonly used in fluorescence-based chemosensors, to create a new fluorescence probe for detecting water content. They presented a dithiophene-bearing benzothiazole derivative (DTBz) that is responsive to moisture, with the addition of a hydroxyl group to facilitate the establishment of hydrogen bonds with water molecules. This modification resulted in a significant ratiometric emission change by the presence of water in the organic solvent. From this observation, the authors designed a portable device for detecting the trace of water with the assistance of the smartphone application. They designed a smartphone adapter for fluorescence imaging, which utilized a 405 nm miniature laser diode as the excitation source and band-pass and long-pass filters to select appropriate wavelengths. The Android application was used to calculate (G + B)/R for determining water concentration. Hong’s group demonstrated the suitability of their new probe as a water sensor that can be used with smartphones, and a schematic of the water content measurement process using the custom smartphone-based device is shown in Figure 2i. By using a 3D-printed adapter, the assay can be performed on-site.
Lactoferrin is a glycoprotein that plays a significant role in the innate immune system and has various biological functions. Based on the complexation reaction between lactoferrin and Tb3+, Shi et al. [43] have proposed three portable platforms for detecting lactoferrin. After the complexation reaction occurs, fluorescence is observed due to the excited electron within the metal-ligand emitting green light. The fluorescent lactoferrin sensor is characterized under various conditions, including buffer solution and artificial tear fluid. The sensor is incorporated into nitrocellulose membranes, capillary tubes, and contact lenses, demonstrating its reliable functionality within neutral and alkaline environments.
To enable personalized detection, the sensor is paired with a custom smartphone application that has an intuitive user interface for self-measurement. The developed smartphone app possesses the capability to autonomously detect specific areas of interest, analyze fluorescent signals, and provide precise quantitative assessments of lactoferrin concentrations. To ensure accurate measurements, a readout optical device is designed to fix the distance, angle of image capture, and external light. The combination of these three sensing platforms and the smartphone readout device shows promise as a point-of-care diagnostic tool for detecting ocular disorders and dry eye diseases. Figure 2ii displays three portable optical platforms for detecting lactoferrin in tears.
Hemoglobin (Hgb) is a protein found in red blood cells that plays a crucial role in transporting oxygen throughout the body. Biswas’s group [44] has developed a paper-based sensor for Hgb that employs a smartphone app to analyze images of the test areas. The app is designed for three essential functions: image acquisition, processing and analysis, and display of the test results. Additionally, it interacts with a microsensor to fine-tune the light intensity on the reaction pad to the desired lux level. The app optimizes and encodes camera settings—such as mode, ISO, white balance, exposure time, and shutter speed—within a distinct algorithmic function. Moreover, a timer function is integrated into the app to prompt the mobile camera to capture images at predetermined intervals.
The images captured by the app are processed in four sequential stages, including pre-processing, ROI segmentation, image feature extraction, and analysis of the extracted features. The app invokes a calibration curve to estimate the Hgb value. Image characteristics are transmitted for machine-learning evaluation, aiming to appraise and reduce disparities between the extracted outcomes and reference data points in the calibration set. This process involves the dynamic adjustment of the calibration curve in real time. The segmentation process combines threshold, region, and color-based segmentation techniques to identify the crucial area of the colored region. The colorimetric assay captures rapid and substantial shifts within the R and B values within the RGB color space. These attributes are meticulously considered during the analysis and are accorded meaningful significance in the mathematical calculations. The authors employed a data analysis approach based on machine learning for the ongoing and adaptive refinement of the calibration curve. Figure 3i depicts the representation of the Hgb sensing device with a simple design.
Respiratory syncytial virus (RSV) is a prevalent respiratory virus responsible for a wide range of respiratory tract infections, spanning from mild cold-like symptoms to more severe respiratory illnesses. Liu et al. [45] developed a low-cost smartphone-based spectrometer for the colorimetric detection of viruses, specifically RSV, by using gold nano-urchins (AuNUs) in a plasmonic coupling assay, as shown in Figure 3ii. The smartphone spectrometer is fabricated by 3D printing a custom-designed cradle that includes a diffraction grating holder, a cuvette holder, and two plastic capillaries, all made of acrylonitrile–butadiene–styrene polymer. The rear-face camera of the smartphone is used as an array detector, and light transmission is carried out using two plastic fibers. One fiber transmits the phone’s back flash light to the cuvette holder, while the other collects the transmitted light and directs it to the linear diffraction grating slide. The incoming light hit the diffraction grating at an angle of approximately 42° to the normal. To establish the pixel index and wavelength calibration, the researchers utilized three lasers with distinct wavelengths (405 nm, 532 nm, and 641 nm). The spectrophotogram is captured in the RAW image format and subsequently handled using a customized MATLAB script. The RGB data extracted from the RAW images are transformed into the hue–saturation–value (HSV) color model, where the value (V) signifies the light transmission through the solution. The results from clinical specimens spiked with RSV demonstrated that the colorimetric detection of RSV is significantly enhanced by this single-step detection using AuNUs in the plasmonic coupling assay.
4.1.2. Cell Analysis
The technique of analyzing single cells or particles is a fundamental and crucial aspect of medical diagnosis and healthcare. To achieve accurate clinical results, it is necessary to conduct rapid biological assays in complex systems with a large number of cells. With the advancement of cameras and CMOS imaging sensors, imaging tools integrated into smartphones are now capable of producing images with high contrast and sensitivity and can compete with traditional benchtop microscopes. The spatial resolution of smartphone microscopy has also improved significantly, reaching up to 1–3 μm. As a result, utilizing a smartphone camera as a sensor for conducting single-cell analysis on a mobile device has become a feasible option [46].
Wang et al. [47] demonstrated a new microfluidic biosensor that allows for the rapid, sensitive detection of Salmonella typhimurium using a combination of immunomagnetic separation, fluorescence labeling, and smartphone video processing. At the outset, magnetic nanoparticles (MNPs) undergo modification to facilitate the isolation of target bacteria from the sample background, leading to the creation of MNP–bacteria complexes. Subsequently, these complexes engage with fluorescent microspheres (FMSs) that have been adapted with polyclonal antibodies against Salmonella typhimurium, resulting in the formation of MNP–bacteria–FMS complexes. These fluorescent bacteria are subsequently isolated through magnetic separation to eliminate unbound FMSs, effectively concentrated within a small volume of PBS, and then continuously introduced into the microfluidic chip. The biosensor is monitored using a smartphone-based fluorescent microscopy system equipped with an LED source for fluorescent excitation. A fabricated fluorescent microscope is constructed using specific optical components. It included an flat-field coated eyepiece lens, two narrow-band filter, and a flat-field achromatic objective lens. The resulting fluorescent image or video is captured by the smartphone’s CMOS sensor. This system allowed for real-time video processing to monitor the flow of fluorescent spots and calculate the amount of fluorescent bacteria present. In the ideal conditions, the biosensor described in this study demonstrated the quantitative detection of Salmonella typhimurium within a range of 1.4 × 10² to 1.4 × 10⁶ CFU/mL, with a lower limit of detection of 58 CFU/mL.
Ulep et al. [48] have developed a dual-layer paper microfluidic chip that is pre-loaded with fluorescent microparticles conjugated with antibodies for detecting tyrosine-like orphan receptor one (ROR1+) cancer cells. The microfluidic chip consists of two layers, the first of which is a circular piece of G041 glass fiber substrate with a 6 mm diameter, designed for the efficient filtration of buffy coat samples. This layer preloads antibody-conjugated particles and captures whole cancer cells. The second layer is a patterned paper that is wax-printed on grade 1 chromatography paper, facilitating wicking and capillary flow measurements along four channels.
The quantification of particle binding to cancer cells, which are captured on the top layer, is achieved through smartphone-based on-chip microscopic imaging. The microscopic imaging system is prepared by modifying commercially available smartphone microscopy, and then attaching it to a movable platform. The flow velocity is used to measure the antigen concentration in the buffy coat sample. The particles are still aggregated by cell fragments and antigens in the bottom flow layer, causing changes in capillary flow that are also monitored in real-time via smartphone-based imaging. This dual detection method allows for the evaluation of the cancer cell concentration in undiluted buffy coat samples from healthy donors that were dosed with a known concentration of cancer cells. With this assay, a limit of detection of 0.1 cell/µL is achieved from a 10 µL sample without any dilution, concentration, or incubation. This approach presents promising alternatives in point-of-care blood cell analysis.
Need et al. [49] employed microliter capillary arrays (MCAs) that utilized the capillary effect for cell quantification with the assistance of a smartphone. The MCA is a fluorinated ethylene propylene microcapillary film. The microcapillary film (MCF) is manufactured through a melt-extrusion technique using FEP-Teflon®. The fluoropolymer MCF ribbon contains a collection of ten capillaries. The MCF is put through an incubation process in polyvinyl alcohol to give it an interior hydrophilic coating. Each test strip has ten microcapillaries and a total sampling volume of either 10 or 20 μL. Bacterial samples prepared with resazurin within the range of 106–10 CFU/mL are added to 96-well plates, and the MCA is dipped into them. Resazurin dye, which is commonly used to detect cellular metabolism and growth, including that of bacteria, can be monitored either by the colorimetric or fluorescence method. The determination of endpoint growth using resazurin can be tracked through a colorimetric or fluorescent approach by observing a shift from blue to a pink color or a transition from weak to strong red fluorescence. The red fluorescence results from the conversion of non-fluorescence resazurin to fluorescent resorufin when it is excited by a green light source. After incubation, the MCA images are captured using a smartphone camera. Fluorescence images are analyzed for RGB values, and the R channel is used to quantify the bacteria.
Kim et al. [50] proposed a new technique for analyzing urinary C-telopeptide fragments of type II collagen (uCTX-II) using a horseradish peroxidase (HRP)-based enzymatic reaction and a homemade readout device. The analyst system comprises a paper-based signal guide and a biosensing channel, as shown in Figure 4i. The signal guide features diverse red patterns of varying brightness against a black background, with each pattern representing the red color using a combination of cyan, magenta, yellow, and black. The biosensing channels, fabricated using polydimethylsiloxane and polyethylene terephthalate, include a bio-reaction region covered with an amine-terminated PEG4-EKGPDP peptide. The detection mechanism relies on the competitive reaction of uCTX-II and PEG4-EKGPDP with HRP-conjugated anti-CTX-II antibodies. The oxidation reaction between HRP and 3,3′,5,5′-tetramethylbenzidine (TMB) results in the appearance of a blue color. The biosensing channels selectively absorb the red color from the signal guide, and the strength of the absorbed color corresponds to the intensity of the blue color generated. The system utilizing this technique can detect uCTX-II within the clinical range of 0–10 ng/mL. Although the method is intriguing, achieving successful fabrication of the signal guide heavily depends on accurately adjusting the red color and ensuring the smartphone camera’s resolution is adequate.
Reflectance confocal microscopy (RCM) has proven valuable in the noninvasive imaging of various skin diseases in vivo. RCM relies on capturing scattering signals produced by intrinsic cellular structures within the tissue. By enabling the examination of cellular changes associated with the disease status without requiring the removal of suspicious lesions, RCM holds significant potential for facilitating the accurate and prompt diagnosis of skin diseases, particularly in resource-limited settings [51,52,53]. Freeman et al. [51] proposed a smartphone confocal microscope that utilized a combination of a slit aperture and a diffraction grating for two-dimensional confocal imaging, as shown in Figure 4ii. An affordable LED is employed as the light source. The light emitted by the LED underwent filtration through an illumination slit and is then collimated using a collimation lens. The collimated light is diffracted into multiple beams by a transmission grating and, subsequently, focused by an objective lens. Each wavelength is focused into a precise line at a distinct location within the tissue.
As the tissue reflects light back, the objective lens collects it, and the grating diffracts the light once again into a single-line beam. A focusing lens directs the detection beam onto a detection slit, achieving confocal optical sectioning. The approach uses a divided pupil configuration, where the illumination and detection beams traverse opposite sides of the objective lens pupil. By separating the illumination and detection paths, as opposed to the conventional full-pupil approach, where they are coaxial, the divided pupil approach offers an improved image contrast and a better rejection of specular back-reflections from optical components.
4.1.3. Chemical Sensors
Several biosensing systems based on smartphones have been created to address the need for biomedical testing in resource-constrained environments. However, the application of these smartphone-based biosensing systems has been limited due to the difference in performances between these systems and commercial plate readers. Commercial plate readers offer various advantages over smartphone-based systems, such as controllable illumination, which is lacking in the latter. To overcome this limitation, Wang et al. [54] have developed a smart-tablet-phone-based colorimetric plate reader (STPCPR) with intelligent and dynamic light modulation for a wide range of colorimetric assays for sensing food additives, namely, tartrazine, amaranth, and phenol red. The illustration of the sensing device is displayed in Figure 5i. The STPCPR comprises a tablet, a dark box, and a smartphone. The tablet, positioned at the bottom of the dark box, is capable of generating three types of excitation light: blue (peak at 450 nm), green (peak at 540 nm), and red (peak at 610 nm). The smartphone, situated at the top of the dark box, sends commands to the tablet to regulate the type, intensity, pattern, and duration of the emitted light. The STPCPR enables the precise modulation of the excitation light in three different color channels. Through the optimized modulation of the excitation light, the STPCPR demonstrated superior sensitivity, lower detection limits, and broader detection ranges in tests involving pigments, proteins, and cells, in comparison to conventional plate readers and smartphone-based systems. Although the illumination problem has been resolved, the device would be more convenient if the focus of the lens on the smartphone could be operated through the developed app.
Picric acid, also known as 2,4,6-trinitrophenol, has a history of use as an explosive material and a laboratory reagent. Shafizadeh et al. [55] utilized the fluorescence quenching effect of chlorophyll to develop an all-in-one smartphone-based analytical device (ASAD) for sensing picric acid. The ASAD is designed to extract picric acid from soil samples on-site and coupled with a smartphone to assemble a picric acid assay using chlorophyll as a fluorophore. It can perform most of the analytical procedures, including separating, centrifuging, mixing, analyzing, and microscopic steps. Chlorophyll is extracted from spinach leaves through a simple procedure and applied to cotton threads, which exhibit a red color at 670 nm under excitation at the wavelength of 420 nm. The fluorescence intensities of chlorophyll in the cotton threads decrease with an increase in the picric acid concentration. A smartphone app records and analyzes the fluorescence intensities to determine the picric acid concentration. The app includes many functions, such as analyzing multiple channels, an image crop window, colored data results, and equations.
Malachite green (MG) is a vibrant green synthetic dye and cationic stain. Traditionally employed as a fabric dye, MG has also served purposes as a pH indicator and a fungicide in certain agricultural applications. Duan’s team [56] has developed a method for detecting MG using a paper-based fluorescence sensor and a smartphone. They created a green fluorescence terbium MOF-76 carrier that is conjugated with an MG-specific aptamer, which is then used to generate a molecularly imprinting polymer (MIP) layer on the surface by using MG as a template. The resulting MOF-Apt@MIP probe is affixed onto a circular pattern paper, and the smartphone captures the fluorescence intensity emitted by the MOF-Apt@MIP probe. The green fluorescence of the MOF-Apt@MIP within the test area diminishes with the rising MG concentration, attributed to a collaborative binding interaction between the aptamer and MIP, leading to a photo-induced electron transfer (PET) effect. The smartphone app uses color recognition software to read the acquired images and calculates the MG concentration from the relative G values obtained.
Aflatoxin B1 is a highly toxic and carcinogenic mycotoxin produced by certain molds. It is commonly found in various food commodities, especially in crops such as peanuts, maize (corn), cottonseed, and tree nuts. Ma et al. [57] proposed a method for detecting aflatoxin B1 (AFB1) using a smartphone-assisted assay. The setup employs a chemiluminescence detection procedure that relies on the competitive interaction between the immobilized AFB1 aptamer and its reverse complement sequence. The detection signal is enabled through the interaction of dual biotin and streptavidin. To anchor the 5’-biotinylated AFB1 aptamer (bAP) onto a streptavidin-coated microplate, a robust noncovalent bond between biotin and streptavidin is employed. Similarly, the 5’-biotinylated reverse complement sequence of the AFB1 aptamer (bRCAP) is linked with the sHRP enzyme to create a bRCAP–sHRP complex.
When AFB1 is not present, the bAP binds with the bRCAP within the bRCAP–sHRP complex, creating a double-helix structure. Yet, when both AFB1 and the bRCAP–sHRP complex are present, the bAP predominantly assumes a hairpin structure, as it exhibits a greater binding affinity with AFB1. The unfettered portion of the bRCAP–sHRP complex is removed during subsequent washing steps. The concentration of AFB1 is quantified by measuring the luminescence intensity generated from the chemiluminescent reaction, which is inversely proportional to the amount of bound bRCAP–sHRP. Luminol serves as the substrate and H2O2 acts as the oxidant in this reaction. The chemiluminescent reaction is captured by a smartphone camera, which can take, load, and position images of the wells of a 96-hole microplate. The resulting chemiluminescent color is blue, so the greyscale of the blue channel is used to determine the AFB1 concentration.
Figure 5.
(i) Illustration of STPCPR with controlling light illumination and recording image by a smartphone: (a) STPCPR configuration; (b) microtiter plate; (c) light pattern emitted from the smart tablet; (d) light modulation and image recording by the system; and (e) spectral characterization of red, green, and blue light performed by a spectrometer. Reprinted with permission from Ref. [54]. Copyright 2023, Elsevier. (ii) Scheme of the simultaneous detection of the metals: (A) detailed information about the box adapter; (B) the internal optical path beam light; and (C) photograph of the box adapter mounted on a Note 6 smartphone. Reprinted with permission from Ref. [58]. Copyright 2020 American Chemical Society.

Xiao et al. [58] devised a portable system that enables the rapid and simultaneous determination of metal ions by utilizing the fluorescent-quenching effect of carbon dots. The paper-based microarray is adorned with fluorescent carbon dots, and their intensities are measured upon exposure to Hg2+, Pb2+, and Cu2+ ions. To ensure the uniform illumination of the patterned microarray and to capture reproducible, high-quality images, the authors designed a dark-box-adapter equipped with two LEDs and a microarray positioning tray. The LEDs emit excitation light, which is homogenized by plastic diffusers and then dispersed through a concave lens to achieve a divergent light source. The use of two LEDs guarantees even irradiation across the entire microarray. The illustration of the device is displayed in Figure 5ii. The images of the microarray are processed to extract RGB values, which are then converted into grayscale values for quantification. A smartphone application, developed in Java, utilizes these values to calculate the concentrations of the target analytes. The system demonstrates outstanding sensing capabilities, with a wide dynamic range observed for different analytes, namely, Hg2+ (20–320 nM), Pb2+ (0.2–6.4 μM), and Cu2+ (0.125–2 μM). Additionally, it achieves impressively low detection limits for Hg2+ (5.8 nM), Pb2+ (0.12 μM), and Cu2+ (0.076 μM).
High concentrations of formaldehyde emit a strong odor that can irritate the eyes, nose, and throat. The inhalation of phosgene gas can lead to respiratory distress, coughing, chest tightness, and breathing difficulties. Ye et al. [59] developed a fluorescence-sensing platform called Nap-NH2 for sensing formaldehyde (FA)- and phosgene (COCl2)-volatile compounds. This platform is prepared by reacting 4-chloro-1,8-napthalic anhydride with hydrazine, resulting in the formation of hydrazine groups. The hydrazine group serves as a recognition site through two distinct reaction pathways. The fluorescence of the Nap-NH2 sensor can be detected by observing their colors under a UV lamp at 365 nm. When Nap-NH2 reacts with FA, it undergoes a condensation reaction to form a new compound with a fluorescence emission wavelength of 551 nm. On the other hand, when Nap-NH2 reacts with phosgene, it generates an electron-withdrawing amide group via an amidation reaction, leading to a new compound with a fluorescence emission wavelength of 487 nm. These compounds exhibit different fluorescence wavelengths due to the photo-induced electron transfer and/or intramolecular charge transfer. A smartphone with a remote mode is used to capture and analyze colors to RGB values to determine the concentration of target compounds.
Liu et al. [60] proposed a mobile-phone-based platform for detecting fluoride ions using a fluorescence ratiometric method. They used a combination of carbon dots (AA-CDs) and [Ru(bpy)3]2+ to achieve this. In the presence of Al3+, the fluorescence of AA-CDs increases through induced enhanced emission, which involves aggregation and leads to stronger van der Waals forces, hydrogen bonds, restricted intramolecular vibrations, and reduced non-radiative transitions. However, the fluorescence intensity and Blue/Red ratio fluorescence images of AA-CDs have narrow variation ranges. To address this, the authors used the red fluorescent ruthenium bipyridine [Ru(bpy)3]2+ as the reference signal. Upon the addition of the F− solution, the fluorescence intensity of AA-CDs decreases significantly, while that of [Ru(bpy)3]2+ remains unchanged. This decrease in the fluorescence intensity of AA-CDs is due to the high affinity of F− ions for Al3+, which forms a stable co-ordination complex AlF3 or AlF63−. The authors utilized the fluorescence intensity ratio F500/F607 of AA-CDs@[Ru(bpy)3]2+ to determine Al3+ and F−. For the fluoride probe, the fluorescence of the ratiometric probe changes from red to cyan in response to varying concentrations of F−, and the RGB values of the fluorescence image are determined using a smartphone color recognition application. The fluoride concentration is determined through the B/R ratio response.
Mercury (Hg) is a highly toxic metal that can cause poisoning when ingested, inhaled, or absorbed through the skin. Shan et al. [61] have developed a portable device to detect Hg2+ ions using thymine-Hg2+-thymine co-ordination chemistry with a high specificity and sensitivity. The device employs a smartphone fluorescence microscope to collect fluorescence signals from fluorescently labeled targets, and a self-developed smartphone application is used to analyze the collected fluorescence signals, allowing for the determination of Hg2+ concentrations. The microscope incorporates key components including excitation illumination, a micro-objective lens, and an image recorder. Notably, the microscope is assembled using a 3-D printing model. It offers impressive imaging capabilities, boasting a high resolution of 2.2 µm, a signal-to-noise ratio of 22 dB, and a remarkably small size of only 170 mm × 113 mm × 168 mm.
The main components of the probe consist of carboxyl-coated polystyrene fluorescent microspheres (PFMs) as a signal probe, and streptavidin-coated Fe3O4 magnetic beads (MBs). The oligonucleotide strands containing Ts are affixed to the streptavidin-coated Fe3O4 magnetic beads through a biotin-streptavidin connection. Meanwhile, the signal oligonucleotide strands containing Ts are tagged using PFMs. MBs are employed to isolate the resulting products for Hg2+ detection. With the prepared device, the assay exhibits a good linear range (1–1000 nM) and a low limit of detection for Hg2+ (1 nM).
4.1.4. Sensors with the Assistance of Deep Learning
An important branch within the field of artificial intelligence is deep learning, which has garnered considerable interest among researchers. Deep machine-learning methods enable classification and prediction tasks [62,63,64,65,66]. Lu et al. [64] developed an assay for Cu2+ and thiram using ratiometric fluorescence combined with a deep-learning-assisted smartphone. The assay employs a fluorescent probe consisting of carbon dots emitting blue light and CdTe quantum dots emitting green and red light. Analytes induce changes in the fluorescence intensity of the probe due to electron transfer, complexing, and inner filter effects. To capture and quantify the color changes, a smartphone camera is utilized, and the YOLO v3-assisted deep-learning algorithm is employed to extract RGB values from the photographs. By incorporating the residual network structure, YOLO v3 minimized gradient dispersion and improved target detection capabilities. The program utilizes the intelligent recognition of test tubes in the images, extracting HSV and RGB values through picture-processing algorithms. The program was trained using 111 fluorescence pictures of 927 test tubes exhibiting various fluorescence colors. The YOLO v3 network demonstrated a satisfactory performance in parameters such as the false positive rate, false negative rate, and recall rate. The proposed assay exhibits a wide linear range and low limits of detection for thiram (1.5–63 µM and 1.84 µM) and Cu2+ (0.41–10.5 µM and 0.34 µM). Similarly, Lu et al. [65] presented a ratiometric fluorescence probe designed for detecting tetracycline antibiotics, which utilized three colors: blue emitted by carbon dots, red emitted by bovine serum albumin-protected copper nanoclusters, and green resulting from the reaction between the probe and tetracycline. To facilitate the detection process, the researchers developed a portable device that employed a smartphone camera, and they employed the YOLO v3 algorithm to process fluorescence images. For the analysis of the detection objects, six linear fitting methods are employed, namely, least squares, ridge regression, least absolute shrinkage, Lasso Lars, Bayesian linear regression, and support vector machine. Through the algorithm, it is determined that the G channel exhibited the best linearity with tetracycline, chlortetracycline hydrochloride, and doxycycline hydrochloride concentrations, while G/B shows the best correlation for oxytetracycline.
Similarly, Liu et al. [67] employed the YOLO v3 deep-learning algorithm to design a fluorescence-probe-based assay for detecting glutathione and azodicarbonamide. The probe utilized carbon dots with blue emission (442 nm) and 2,3-diaminophenazine (OxOPD) with yellow emission (562 nm). The detection mechanism involves the oxidation of o-phenylenediamine (OPD) by Ag+ to produce OxOPD, leading to changes in the peak intensity at 442 nm and 562 nm due to fluorescence resonance energy transfer (FRET). Glutathione inhibits the production of OxOPD by binding with Ag+, while azodicarbonamide oxidizes glutathione, releasing Ag+. The fluorescent intensities of the probe are recorded using a homemade reader with a smartphone camera as a detector. The YOLO v3 algorithm is used to detect and classify tube images, extracting RGB and HSV values with an ordinary image-processing algorithm. The YOLO v3 network demonstrated satisfactory performance in essential parameters. The proposed assay exhibits a wide linear range (0.1–200 µM for glutathione and 0.5–160 µM for azodicarbonamide) and low limits of detection (0.07 µM for glutathione and 0.09 µM for azodicarbonamide).
4.2. Ambient Light Sensor of Smartphone-Based Biosensors
Colorimetry- and intensity-based optical sensors predominantly utilize smartphone cameras for image capture or direct photon collection from samples. Nevertheless, the optimization of smartphone cameras for high ambient light conditions poses a challenge in achieving consistent lighting control. Cameras exhibit reliable performance solely at high analyte concentrations, whereas low concentrations can introduce undesired noise from thermal and scattered light signals, thereby reducing the signal-to-noise ratio of the captured sample images. Additionally, colorimetric-based sensors often focus on imaging liquid assays or samples. However, when employing a smartphone camera to record the images, significant errors may arise in color-dependent analytical and bioanalytical assays. These issues can be effectively addressed by utilizing the smartphone’s ALS or illumination sensor [68,69,70,71]. An illuminance sensor is a device that measures the level of illumination or brightness in its surrounding environment. It detects the intensity of light falling on its surface and converts it into an electrical signal. A chromophore generated through biochemical reactions can introduce light interference, leading to a decrease in the passage of light through the illumination sensor.
Based on this concept, Park et al. [69] have introduced a new sensing system for osteoarthritis that combines an immunoblotting assay with a simple optical sensing system. The system utilizes components integrated into a smartphone, including a white light-emitting diode and an illumination sensor, to function as the light source and optical receiver, respectively. The illumination sensor demonstrates high sensitivity to variations in external light intensity. A microfluidic channel, constructed from PDMS and PET, is positioned between the smartphone’s flash light and the illumination sensor. The microfluidic channel is coated with polydopamine and serves as the sensing channel, offering transparency, ease of fabrication, and biomolecule immobilization. Once PEG4-EKGPDP, an analog of uCTXII, is immobilized within the microfluidic channel, the uCTX-II sample is mixed with the HRP-conjugated anti-uCTX-II antibody and injected into the sensing channel. Then, TMB is introduced into the microfluidic sensing channel. As the concentration of uCTX-II increases, the binding between the HRP-conjugated anti-CTX-II antibody and the immobilized PEG4-EKGPDP within the channel diminishes. Consequently, the production of oxidized TMBM, catalyzed by HRP, decreases, resulting in the reduced formation of an insoluble blue precipitate. This insoluble precipitate acts as a light-interfering agent, reducing the penetration of LED light and, subsequently, decreasing the amount of light reaching the sensor. Thus, the quantity of light decreases inversely proportionally to the amount of insoluble precipitate. The mobile application promptly analyzes the amount of light passing through the biosensing channel using a lux meter. The results demonstrate a significant change in the lux value corresponding to the uCTX-II concentration, ranging from 0 to 10 ng/mL. The scheme of the system, the mechanism of the probe, and the performance of the assay are displayed in Figure 6i. Using a 3D printer, the adapter for the ALS of smartphone-based biosensors is small and easy to prepare.
In this system, the authors used a darkroom and a white light-emitting diode source on the smartphone. These factors required a specific design for collecting and transferring light from the LED to the front side of the smartphone; therefore, the authors continued to develop a urinary CTX-II sensing device that did not require the LED of the smartphone [73]. In their work, an Android-based app is developed for standardizing different light sources. The dopamine-coated biosensing channel containing the PBS buffer is employed as a reference channel to create the benchmark for the intensity related to each light source. The lux value emitted by each light source is recorded as the reference value. Subsequently, the variation in light intensity produced by each tested uCTX-II set is analyzed by calculating the disparities between the reference values and the results of each test. Furthermore, the transmittance is determined by dividing each result value by the corresponding reference value. The uCTX-II assay is performed using the AjouLuxMeter software, employing fluorescent light as the initial light source, while maintaining consistent testing conditions as the previous experiment.
Zhao et al. [74] introduced a transparent lateral-flow test strip, coupled with a smartphone-based ALS, for butyrylcholinesterase (BChE) and active BChE sensing. The method’s principle involves simultaneously measuring the total enzyme quantity and enzyme activity to serve as a biomonitoring tool for exposure to organophosphorus (OP) pesticides. In the test strip, BChE mAb-conjugated PtPd particles are immobilized as a recognition reagent on the test line, enabling the binding of BChE and OP-BChE. The PtPd particles act as a colorimetric probe, displaying remarkable catalytic activity for phenols. As the colorimetric signal on the test lines increases, the intensity of the transmitted light decreases. The ALS captures the light intensity, which is subsequently analyzed using a dedicated smartphone app developed for this purpose. To prevent interferences from ambient light, an ALS module is developed. The module features an LED as the light source, a button cell, a resistor to control the intensity of the excitation light, and a secure slot for the precise placement of the test strip. The sensor exhibited a reasonably linear response when measuring the total amount of BChE in the range of 0.05–6.4 nM, with a LOD of 0.025 nM. Similarly, for BChE activity, the sensor demonstrated a linear response within the range of 0.1–6.4 nM, with an LOD of 0.028 nM.
Hussain et al. [72] demonstrated two smartphone-based salinity sensor modules in which the ALS of the smartphone has been utilized. Two sensor modules are based on direct transmission and evanescent field absorption mechanisms. The direct transmission module operates based on the Beer–Lambert principle, where the intensity of transmitted light is influenced by the absorption of light as it passes through the medium. This attenuation can be analyzed by the smartphone. The second module employs the evanescent field absorption originating from an exposed U-bent sensing area within an optical fiber. Variations in the salinity of the neighboring environment near the fiber-sensing region influence the absorption of the evanescent field, a process detectable using a smartphone. The device exhibits the capability to measure variation accurately and repeatedly in salinity levels as low as 0.01%. The schematic of two salinity sensor modules is shown in Figure 6ii. The adapter for the ALS in the smartphone in the salinity sensor is portable and economical.
Wang et al. [75] developed a label-free colorimetric assay using the ALS of a smartphone to measure glucose levels in urine. This assay utilizes a colored system that consists of HRP, hydrogen peroxide (H2O2), and TMB. To generate the strongest color, precise amounts of H2O2 are added to the urine samples under analysis. When glucose oxidase is present in the urine, it causes the production of H2O2 and the reduction of TMB. Consequently, the urine color diminishes, and the solution transitions from a deep blue to a light blue hue. The illuminance of the light passing through the sample is measured with a smartphone’s ALS to determine the glucose concentration in the urine. The assay exhibited good linearity in the range of 0.039–10.000 mg/mL (R2 = 0.998), with a limit of detection of 0.005 mg/mL.
In summary, the proposed optical sensors for smartphones leverage the device’s camera to capture images of various analysis platforms such as papers, cuvettes, tubes, and microfluidics. Smartphone cameras are commonly used to capture images or collect photons for colorimetric- and intensity-based optical sensors. These images are subsequently analyzed using RGB, HUE, and greyscale methods to determine the desired concentrations. However, there are certain limitations to consider due to the sensors being designed for specific smartphone models, which presents challenges in establishing a calibration curve—a crucial requirement for accurate analysis. Thus, utilizing the camera as a detector poses specific challenges. Firstly, different smartphone brands possess varying camera characteristics, leading to variations in image quality and potentially resulting in inaccurate colorimetric sensing outcomes. Secondly, CMOS image sensors also differ among smartphone models, causing variations in captured images and their respective color channels across different devices. To effectively address these issues, the smartphone’s ALS or illumination sensor can be employed. An illuminance sensor is a device that measures the brightness or level of illumination in its surrounding environment. It detects the intensity of light falling on its surface and converts it into an electrical signal. By utilizing the illuminance sensor in conjunction with the smartphone camera, more accurate target concentrations can be calculated. Table 1 lists the recent applications of the smartphone on an optical-based biosensor device.
5. Applications of Bio-Chemical Electrochemical Sensors Using a Smartphone
Analytical devices revolutionize daily life through biomedical and environmental monitoring. The portability and ease of use of such analytical devices have been prone to changing according to the improvement of sensor applications. Smart and portable sensor devices are being developed in the arena of sensor technology for the point-of-care (POC) test. POC devices for diagnostics and in vitro tests should be user-friendly, efficient tests without laboratory personnel involvement, providing quick, easy-to-understand results for on-site or at-home use. Sensor developments are driven by the demand for smart and portable sensors with high sensitivity, great selectivity, rapid measurement, and reusable platforms. Among the different biosensing platforms, electrochemical (bio) sensors are the most popular for POC-based sensors devices. Significantly, these sensors provide rapid readouts and they can be integrated into portable, wearable, and implantable devices [76]. They are easily size-reduced, batch-manufactured, and coupled with an electrical acquisition module on a single chip, resulting in compact and portable designs. Electrochemical signals such as electrical current and potential could be monitored with simple, low-cost peripheral devices that require relatively little energy. Furthermore, the signal generated by the biorecognition element’s affinity for the target analyte can be amplified via physical, chemical, or biological methods, greatly enhancing detection sensitivity. These features make electrochemical biosensors a feasible choice to advance point-of-care diagnostic technology [77]. Electrochemical biosensors incorporate a recognition element and an electronic transducer (an electrode or field-effect transistor) for the highly sensitive detection of analytes in body fluids. However, the miniaturization of the electronic transducer is required; moreover, in the last five years, electrochemical sensors with smartphones received great attention in POC sensor applications. The smartphone revolutionizes healthcare and environmental monitoring by combining cutting-edge software technology, easy app development, wireless data sharing, and sensor technology. These portable analytical tools deliver sustainability, affordability, immediate analysis, data sharing, and flexibility. The integration of cloud computing, digital technologies, and machine learning into smartphone-centered medical applications is positioned to revolutionize healthcare diagnostics [78,79]. This technology enhances accuracy, efficiency, and accessibility, reducing the need for in-person consultations and making healthcare more convenient for a larger population. This transformation is expected to significantly change the healthcare landscape in the future. A smartphone-based electrochemical device comprises three parts: the electrodes system, an adaptor that includes a microcontroller or miniaturized potentiostat for signal collection, and a smartphone application for analyzing/displaying the result. In this section, we highlighted the recent development in smartphone-based electrochemical biosensors as POC-testing biosensor devices.
Diabetic ketoacidosis (DKA) and diabetic ketosis acid (DK) are frequent acute complications and represent the most prevalent pathological condition associated with ketosis. Failure to promptly diagnose and treat these conditions may result in fatal outcomes. Guo et al. [80] proposed a portable device for monitoring blood beta-ketone using a disposable electrode and dongle as a miniaturized electrochemical sensor that is powered by the smartphone through an OTG port (On-The-Go; a kind of a device communication standard). The working principle of the strip test is based on the β-hydroxybutyrate dehydrogenase reaction, in which the blood ketone concentration linearly correlates with the β-hydroxybutyrate (HB). In this, HB is catalyzed to acetyl acetic acid under the help of β-hydroxybutyrate dehydrogenase, while nicotinamide adenine dinucleotide (NADH) undergoes oxidation into NAD+. The electrochemical one-shot test strip is utilized to characterize blood ketone levels using actual fingerstick blood samples. The limit of detection of the assay can reach 0.001 mM, and the electrochemical current is directly proportional to the blood ketone concentration between 0.001 and 6.1 mM. Despite the difficulty of accurately describing the impact of hematocrit (HCT) on the electrochemical detection of biochemical molecules, the algorithm compensates for the HCT of blood and ensures a measurement accuracy that meets clinical standards. The proposed smartphone-powered dongle is a valuable miniaturized electrochemical analyzer that can measure critical biochemical parameters such as blood ketone levels under various conditions, despite these challenges. Figure 7i displays a practical photo of the proposed device of Guo’s group and its mechanism.
Zhang et al. [81] presented a wearable sensor with dual functions, that is capable of the real-time and non-invasive recording of physiological parameters including pulse beat, respiration, vocal cord vibration, and beta-hydroxybutyrate (HB) levels in sweat, urine, and serum. The sensor device includes a signal processing unit that facilitates signal transduction, processing, and wireless transmission. The collected data are analyzed and displayed on a smartphone. The serpentine electrodes are prepared from reduced graphene oxide (rGO) for increasing pressure sensitivity. The sensor electrodes for HB detection operate on the principle of the nicotinamide adenine dinucleotide (NAD)-dependent dehydrogenase enzymatic reaction. The β-hydroxybutyrate dehydrogenase and its cofactor, NAD+, are confined in a three-dimensional network of glutaraldehyde which is coated with a layer of chitosan. A polythionine film is also employed as a redox mediator to prevent interference from by-products. In real sweat and urine samples, the sensor demonstrated heightened sensitivity compared to artificial sweat and urine samples. This disparity could be attributed to the presence of catalytic components found in these authentic samples. The current intensity of the system increases with incremental HB concentrations. The calibration plot exhibits two clearly defined linear regions. In the range of 0–0.125 mM, the sensitivity is determined to be 322.01 nA/mM, whereas, within the range of 0.125–3 mM, the sensitivity measures at 42.172 nA/mM.
The resistance of the system changes when an external pressure-related epidermis deformation is applied to the serpentine electrode as a result of the deformation. The response signals of the sensor are wirelessly transmitted to a smartphone by Bluetooth technology, and further analyzed using a dedicated smartphone app. Figure 7ii illustrates the sensor for the physiological pressure signals and HB concentration.
Zhao et al. [82] have developed an integrated wearable sensing patch that can simultaneously detect biomarkers such as cortisol, Mg2+, and pH in sweat, allowing for the evaluation of mental stress levels. The sweat sensor device comprises a microfluidic chip, a sensing platform, an on-site signal processing circuit, and a smartphone-based software interface. The microfluidic chip facilitates sweat sample collection at rest without requiring exercise, thermal, or chemical stimulation. The sensing platform captures electric signals using a ternary composite substrate that includes MXenes, MWCNTs, and AgNPs, enabling the detection of the three relevant biomarkers with exceptional selectivity. The AgNPs and MXenes are intercalated in the MWCNT network, forming a bridged linkage structure that provides a high number of reactive sites and excellent electrochemical activity.
The selectivity towards the target analytes is enhanced through molecular imprinting and specific ion recognition as the sensing mechanisms. The superior electrochemical activity of the ternary composite substrate results in significantly higher sensitivity and lower limits of detection. Notably, the sensors do not include enzymes or other biomacromolecules, which helps prevent signal attenuation due to biomolecular receptor inactivation over time. Additionally, the wearable sensor is equipped with an on-site signal processing circuit that enables the signal transduction, conditioning, processing, and wireless transmission of sweat analytes to a smartphone. This integrated design offers the convenient and continuous monitoring of mental stress levels, making it a valuable tool for assessing stress-related conditions. The device exhibits sensitivities of 2751 nA/decade for cortisol, 47.3 mV/decade for Mg2+, and 63.96 mV/pH for pH.
Programmed death-1 (PD-1) and programmed death-ligand 1 (PD-L1) are key components of the immune system and play a significant role in regulating immune responses. Xing et al. [83] suggested a dual-channel point-of-care system for detecting PD-11 and PD-L1 based on an electrochemical system that can be operated using a smartphone. Two paper-based electrodes in the folding form are fabricated from NH2-SWCNTs/NMB/AuNPs, sPD-1, and sPD-L1 antibodies where NH2-SWCNTs refers to amine-functional single-wall carbon nanotubes, NMB is new methylene blue, AuNPs are gold nanoparticles, and sPD-1 and sPD-L1 are soluble PD-1- and soluble PD-L1-predictive biomarkers, as shown in Figure 8. Their device comprises a smartphone, electrochemical detection module, and microcontroller unit, as depicted in Figure 8. The electrochemical immunosensor has been evaluated and the results indicated that the immunosensor responded well to sPD1 and sPD-L1. The immunosensor exhibited the capability to identify sPD-1 and sPD-L1 within the concentration ranges of 50 pg/mL to 50 ng/mL and 5 pg/mL to 5 ng/mL, respectively. The limits of detection for sPD-1 and sPD-L1 were determined to be 10 pg/mL and 5 pg/mL, respectively.
Prostate-specific antigen (PSA) is a protein synthesized by prostate gland cells. Elevated levels exceeding 10 ng/mL of PSA are indicative of a potential association with prostate cancer. The label-free electrochemical sensors using nanomaterials are still inadequate for detecting PSA. He et al. [84] introduced an immunosensor for detecting prostate-specific antigen (PSA), which utilized a miniaturized electrochemical device and an Au-film-based electrode. By sputtering Au film on the shrink polymer, the number of antigen–antibody binding sites increased fourfold. The structural characteristics of wrinkles have a direct impact on the electrochemically active surface area and sensitivity of PSA. It has been observed that the shrink electrode, which is 200 nm thick and possesses large-wavelength wrinkles, exhibits the highest sensitivity to PSA. Moreover, the sensor’s sensitivity is improved as a result of a plasma treatment process that facilitates the self-assembly of a graphene layer on the electrode. The sensor demonstrated a low limit of detection (0.38 fg/mL) in the linear range of 10 fg/mL–1000 ng/mL. The preparation procedure of the wrinkled electrode and the scheme of the PSA sensor are displayed in Figure 9. The device is powered by an external battery and operated through Bluetooth with a smartphone app.
Liao et al. [85] suggested a water quality assay based on an electrochemical sensor and a smartphone. The novelty of their assay lay on the whole-copper electrochemical electrode (WCES) and the transfer of the output signal to a smartphone via Bluetooth. The WCESs are fabricated using the thermal transfer printing method, which only requires a simple laser printer and thermal transfer machine. The suggested method can detect Pb2+ and chemical oxygen demand in water as low as 45 nM and 9 mg/L, respectively. However, in this system, the smartphone only plays the role of receiving the signal from the electrochemical device through Bluetooth and sending data to the Cloud map website. Moreover, stability and reusability were not discussed.
Most wearable sensor prototypes require bulky cables and rigid battery packs to power their data acquisition and transmission functions. However, to guarantee the continuous and accurate monitoring of physiological signals and real-time data transmission, sustainable power supplies are essential. To tackle these challenges, Yan et al. [86] have developed a self-powered wearable sensing system that uses a hybrid power source of wearable triboelectric nanogenerators (TENGs) and flexible solar cells. This system can continuously monitor physiological parameters, such as electrocardiogram (ECG), blood pressure (BP), temperature, and motion, due to the TENG’s ability to produce electricity from body motion, ensuring a sustainable power supply for the system. The output signals by the sensors are transmitted to the smartphone via Bluetooth for analysis and monitoring. The development of flexible TENGs, GaA thin-film solar cells, power management, and communication transmission does not necessitate a costly infrastructure, presenting an exemplary model for researchers to follow.
Yu et al. [87] introduced a novel photoelectrochemical (PEC) sensing device powered by solar energy. This device detects cardiac troponin I (cTnI) by using screen-printed paper electrodes functionalized with Bi2O2S (BOS) nanosheets. It also has a self-powered photoelectric signal output system. The detection and measurement of cTnI protein is accomplished by monitoring changes in electrical signals caused by the electro-oxidation of H2O2. The hydrogen peroxide molecules are produced on the electrode surface by the standard split immune response. To address the issue of temporal inconsistency caused by varying sunlight conditions, the test electrodes are designed with two distinct working electrodes. One electrode is specifically dedicated to detecting the target cTnI, while the other electrode assesses the light intensity. This design aimed to mitigate the impact of changing light conditions during the testing process. The photoelectrodes exhibit a satisfactory negative response within the dynamic range of 2.0 pg/mL to 10 ng/mL. This is accomplished through the application of an enhanced artificial neural network (ANN) model, which employs a machine-learning algorithm based on a 3 × 64 neuron module layer. The model is trained on a consolidated dataset of target signals influenced by the light source. By employing this approach, the authors successfully analyzed the data and obtained reliable results. Overall, this study offers a unique perspective in the field of low-cost bioassay platforms. Although the system presents an innovative design for developing the PEC sensor without being influenced by external light sources, this design will be a portable device if it is minimized and integrated with a smartphone.
In summary, the smartphone, which resembles a minicomputer with numerous built-in features, opens up new avenues for the development of next-generation portable electrochemical systems. Smartphone-based electrochemical sensors utilize the capabilities of smartphones to enable convenient and portable electrochemical analysis. These sensors utilize the processing power and connectivity of smartphones to perform electrochemical measurements and provide real-time data analysis. By integrating electrochemical components such as electrodes and transducers with the smartphone interface, users can easily interface with the sensor and monitor electrochemical reactions. The smartphone serves as a platform for data collection, processing, and communication, allowing for on-the-spot analysis and remote monitoring. Additionally, smartphone-based electrochemical sensors can benefit from the wide availability of mobile applications that provide user-friendly interfaces and advanced data analysis tools. Table 2 summarizes the recent development of smartphone-based electrochemical sensors dis-cussed in this section.
6. Other Smartphone-Based Sensors for Biometrics
6.1. Acoustic Sensor
The acoustic method is characterized by its simplicity, speed, and sensitivity [88,89,90,91,92]. Acoustic biosensors use differences in acoustic wave velocity, frequency, and amplitude induced by piezoelectric materials to detect the target analyte [93]. The utilization of mobile sensing systems that employ audible signals has garnered significant interest [94,95]. These systems offer enhanced convenience in various aspects of people’s lives and healthcare, steadily gaining popularity.
Nandakumar et al. [96] propose utilizing the built-in active sonar of smartphones to monitor respiration using the frequency-modulated continuous wave (FMCW) technique. Although the scheme demonstrates good performance, its effectiveness hinges on precisely gauging the distance separating the smartphone and the chest. This becomes challenging during sudden body movements, necessitating the system to detect the altered smartphone–chest distance, thereby introducing a notable time complexity. Alternatively, Wang et al. [97] utilized the low-latency acoustic phase (LLAP) system for distance measuring and device-free hand tracking, which utilizes continuous-wave (CW) radar. Nandakumar’s group [98] transformed the phone into a short-range active sonar, employing frequency shifts to detect respiratory depression and apnea. Wang et al. [99] utilized sonar phase data on smartphones to monitor the periodic signal arising from chest movements during respiration, specifically during inhalation and exhalation. They found that the sonar phase information could precisely track the periodic signal of the breathing rate with exceptional accuracy.
6.2. Accelerometer Sensors
The accelerometer has been a foundational and widely integrated component of smartphones since their inception. This sensor enables the measurement of various types of acceleration forces acting upon the device, including constant (gravity), time-varying (vibrations), and quasi-static (tilt) accelerations. These forces impact the smartphone along three axes, namely, x, y, and z, and are quantified in units of meters per second squared (m/s2) [100]. This sensor has been widely employed as a useful and powerful tool for mobile-based-sensor research [101,102,103,104,105]. For instance, by recording the changes in holding smartphones, Kuosmanen et al. [104] utilized accelerometer data to generate periodograms and analyzed signal features in order to compare patients with varying levels of symptoms associated with Parkinson’s disease (PD). The smartphone-acquired accelerometer data are utilized to assess the parameter known as tremor intensity, which quantifies the severity of hand tremors in PD. The researchers observed a noteworthy distinction in the accelerometer signal when comparing data before and after the administration of medication.
7. Perspective and Outlook
Smartphones, with their compact size and a wide array of built-in sensors, offer the effortless capture of diverse physical signals. These devices possess robust capabilities, such as ample memory, high-quality cameras, integrated sensors, and intuitive operating systems, making them portable solutions for real-time and on-site monitoring. With wireless connectivity options, information sharing and analysis can be seamlessly achieved using smartphone apps.
In the field of optical sensors, smartphone cameras are commonly utilized for image capture or direct photon collection in colorimetry- and intensity-based sensors. However, factors such as lighting conditions, camera resolution, lens quality, image stabilization, sensor size, image compression, and post-processing algorithms can influence the quality of the captured images. Ambient light sensors in smartphones can be employed as an alternative solution. The smartphone-based electrochemical sensors typically require external devices for operation. Nonetheless, advancements in components like paper-based sensors and flexible electronics are gradually addressing the limitations associated with external components. Furthermore, the acoustic and accelerometer sensors of smartphones, with the aid of novel algorithms, can be directly utilized in disease diagnosis without the need for any supporting devices.
The combination of smartphones with supporting components offers convenient approaches to creating portable, homemade sensor devices. Recent advancements in 3D printing have revolutionized industries, and, by harnessing the power of 3D printing, the combination of smartphones and 3D-printed devices has led to the development of portable and real-time sensor devices.
Deep-learning methods have gained popularity as potent tools for classification and prediction tasks in machine learning. These methods are exceptional at capturing and quantifying color changes. However, training deep-learning models can demand significant computational resources and require large amounts of labeled data. A prevalent issue in deep learning arises when the model becomes overly specialized to the training data and struggles to generalize effectively.
Biosensor devices that utilize smartphones for operation are designed with portability in mind and commonly rely on batteries or alternate energy sources. Consequently, the application of green chemistry principles in the creation of energy-efficient devices and systems that can lead to a reduction in chemical usage, and cost-effectiveness. Further-more, the incorporation of green chemistry can facilitate the development of materials that exhibit improved biodegradability or enhanced recyclability, thereby mitigating the overall waste produced.
In conclusion, this review endeavors to inspire continued exploration, innovation, and collaboration in the realm of smartphone-based sensing. By combining cutting-edge sensor technologies with the ubiquity of smartphones, researchers and practitioners are expected to unlock new dimensions of analytical insight and impact, transforming the way we perceive and engage with analytical chemistry and diagnostic practices.
Author Contributions
Conceptualization, T.H.B. and J.H.S.; writing—original draft preparation, T.H.B.; writing—review and editing, B.T., M.S. and K.C.; supervision, J.H.S. All authors have read and agreed to the published version of the manuscript.
Funding
This research was funded by the National Research Foundation of Korea (NRF) grant funded by the Korea government (MSIT) (Nos. NRF-2022R1A5A8023404, RS-2023-00237661, and RS-2023-00208049).
Conflicts of Interest
The authors declare no conflict of interest. The funders had no role in the design of the study; in the collection, analyses, or interpretation of data; in the writing of the manuscript; or in the decision to publish the results.
References
- Yadav, P.; Yadav, L.; Laddha, H.; Agarwal, M.; Gupta, R. Upsurgence of smartphone as an economical, portable, and consumer-friendly analytical device/interface platform for digital sensing of hazardous environmental ions. Trends Environ. Anal. Chem. 2022, 36, e00177. [Google Scholar] [CrossRef]
- Sun, B.R.; Zhou, A.G.; Li, X.; Yu, H.-Z. Development and Application of Mobile Apps for Molecular Sensing: A Review. ACS Sens. 2021, 6, 1731–1744. [Google Scholar] [CrossRef] [PubMed]
- Rasitanon, N.; Ittisoponpisan, S.; Kaewpradub, K.; Jeerapan, I. Wearable Electrodes for Lactate: Applications in Enzyme-Based Sensors and Energy Biodevices. Anal. Sens. 2023, 3, e202200066. [Google Scholar] [CrossRef]
- Sempionatto, J.R.; Montiel, V.R.-V.; Vargas, E.; Teymourian, H.; Wang, J. Wearable and Mobile Sensors for Personalized Nutrition. ACS Sens. 2021, 6, 1745–1760. [Google Scholar] [CrossRef] [PubMed]
- Son, M.H.; Park, S.W.; Sagong, H.Y.; Jung, Y.K. Recent Advances in Electrochemical and Optical Biosensors for Cancer Biomarker Detection. BioChip J. 2023, 17, 44–67. [Google Scholar] [CrossRef]
- Zhu, X.; Tang, J.; Ouyang, X.; Liao, Y.; Feng, H.; Yu, J.; Chen, L.; Lu, Y.; Yi, Y.; Tang, L. Hollow NiCo@C Nanozyme-Embedded Paper-Based Colorimetric Aptasensor for Highly Sensitive Antibiotic Detection on a Smartphone Platform. Anal. Chem. 2022, 94, 16768–16777. [Google Scholar] [CrossRef]
- Zhao, J.; Liu, K.; Wang, R.; Liu, T.; Wu, Z.; Ding, L.; Fang, Y. Dual-Mode Optical Sensor Array for Detecting and Identifying Perillaldehyde in Solution Phase and Plant Leaf with Smartphone. ACS Appl. Mater. Interfaces 2022, 14, 53323–53330. [Google Scholar] [CrossRef]
- Chu, S.; Wang, H.; Ling, X.; Yu, S.; Yang, L.; Jiang, C. A Portable Smartphone Platform Using a Ratiometric Fluorescent Paper Strip for Visual Quantitative Sensing. ACS Appl. Mater. Interfaces 2020, 12, 12962–12971. [Google Scholar] [CrossRef]
- Wang, H.; Yang, L.; Chu, S.; Liu, B.; Zhang, Q.; Zou, L.; Yu, S.; Jiang, C. Semiquantitative Visual Detection of Lead Ions with a Smartphone via a Colorimetric Paper-Based Analytical Device. Anal. Chem. 2019, 91, 9292–9299. [Google Scholar] [CrossRef]
- Pearsall, T. Photonics Essentials: An Introduction with Experiments; McGraw-Hill: New York, NY, USA, 2003. [Google Scholar]
- Dutta, P.S.; Liotta, K.M. Full Spectrum White LEDs of Any Color Temperature with Color Rendering Index Higher than 90 Using a Single Broad-Band Phosphor. ECS J. Solid State Sci. Technol. 2018, 7, R3194. [Google Scholar] [CrossRef]
- Spring, K.R.; Davidson, M.W. Sources of Visible Light. 2023. Available online: https://micro.magnet.fsu.edu/primer/lightandcolor/lightsourcesintro.html (accessed on 22 June 2023).
- Spring, K.R.; Fellers, T.J.; Davidson, M.W. Non-Coherent Light Sources for Confocal Microscopy. Available online: https://www.olympus-lifescience.com/ko/microscope-resource/primer/techniques/confocal/noncoherentsources/ (accessed on 22 June 2023).
- Difference between Photovoltaic and Photoconductive Mode Photodiode. 2023. Available online: https://www.rfwireless-world.com/Terminology/Difference-between-Photovoltaic-mode-and-Photoconductive-mode.html (accessed on 14 August 2023).
- Ted_Pella, I. Background Information on CCD and CMOS Technology. 2023. Available online: https://www.tedpella.com/cameras_html/ccd_cmos.aspx (accessed on 22 June 2023).
- Turchetta, R.; Spring, K.R.; Davidson, M.W. Introduction to CMOS Image Sensors. Available online: https://micro.magnet.fsu.edu/primer/digitalimaging/cmosimagesensors.html (accessed on 22 June 2023).
- Grube, B. Ambient Light Sensor Calibration with Tunable Light Sources. Available online: https://www.energetiq.com/application-note-ambient-light-sensor-calibration-with-tunable-light-sources#:~:text=Ambient%20light%20sensors%20are%20used,impact%20on%20the%20user%20experience. (accessed on 22 June 2023).
- Enlitech. A Complete Introduction to Ambient Light Sensors (ALS)—Starting from the Working Principle, How to Test, Important Performance Parameters, Application Scope, Major Manufacturers and Industrial Structure of ALS. Available online: https://enlitech-sensor.com/blog-ambient-light-sensor-01/ (accessed on 13 June 2023).
- Zhang, R.; Song, B.; Yuan, J. Bioanalytical methods for hypochlorous acid detection: Recent advances and challenges. TrAC Trends Anal. Chem. 2018, 99, 1–33. [Google Scholar] [CrossRef]
- Chaudhary, M.; Kumar, A.; Devi, A.; Singh, B.P.; Malhotra, B.D.; Singhal, K.; Shukla, S.; Ponnada, S.; Sharma, R.K.; Vega-Olivencia, C.A.; et al. Prospects of nanostructure-based electrochemical sensors for drug detection: A review. Mater. Adv. 2023, 4, 432–457. [Google Scholar] [CrossRef]
- Di Francia, G.; Alfano, B.; Massera, E.; Miglietta, M.L.; Polichetti, T. Chemical Sensors: Conductometric Gas Sensors. In Encyclopedia of Sensors and Biosensors, 1st ed.; Narayan, R., Ed.; Elsevier: Oxford, UK, 2023; pp. 189–208. [Google Scholar]
- Yin, T.; Qin, W. Applications of nanomaterials in potentiometric sensors. TrAC Trends Anal. Chem. 2013, 51, 79–86. [Google Scholar] [CrossRef]
- Imanzadeh, H.; Sefid-Sefidehkhan, Y.; Afshary, H.; Afruz, A.; Amiri, M. Nanomaterial-based electrochemical sensors for detection of amino acids. J. Pharm. Biomed. Anal. 2023, 230, 115390. [Google Scholar] [CrossRef] [PubMed]
- Arduino Home. 2023. Available online: https://www.arduino.cc/ (accessed on 22 June 2023).
- USB Hardware. 2023. Available online: https://en.wikipedia.org/wiki/USB_hardware (accessed on 22 June 2023).
- Bluetooth. 2023. Available online: https://en.wikipedia.org/wiki/Bluetooth (accessed on 22 June 2023).
- Near Field Communication. 2023. Available online: https://en.wikipedia.org/wiki/Near-field_communication (accessed on 22 June 2023).
- Thang, L.T.H.; Han, W.; Shin, J.; Shin, J.H. Disposable, pressure-driven, and self-contained cartridge with pre-stored reagents for automated nucleic acid extraction. Sens. Actuators B 2023, 375, 132948. [Google Scholar] [CrossRef]
- Han, W.; Shin, J.; Ho Shin, J. Low-cost, open-source contact angle analyzer using a mobile phone, commercial tripods and 3D printed parts. HardwareX 2022, 12, e00327. [Google Scholar] [CrossRef]
- Park, S.B.; Shin, J.H. Pressed Lateral Flow Assay Strips for Flow Delay-Induced Signal Enhancement in Lateral Flow Assay Strips. BioChip J. 2022, 16, 480–489. [Google Scholar] [CrossRef]
- Erdem, A.; Yildiz, E.; Senturk, H.; Maral, M. Implementation of 3D printing technologies to electrochemical and optical biosensors developed for biomedical and pharmaceutical analysis. J. Pharm. Biomed. Anal. 2023, 230, 115385. [Google Scholar] [CrossRef]
- Bhandari, S.; Krishnanand; Singh, A.; Taufik, M. 3D printing methods and materials for sensor fabrication. Mater. Today Proc. 2023. [Google Scholar] [CrossRef]
- Koh, A.; Kang, D.; Xue, Y.; Lee, S.; Pielak, R.M.; Kim, J.; Hwang, T.; Min, S.; Banks, A.; Bastien, P.; et al. A soft, wearable microfluidic device for the capture, storage, and colorimetric sensing of sweat. Sci. Transl. Med. 2016, 8, 366ra165. [Google Scholar] [CrossRef]
- Wang, L.-J.; Chang, Y.-C.; Sun, R.; Li, L. A multichannel smartphone optical biosensor for high-throughput point-of-care diagnostics. Biosens. Bioelectron. 2017, 87, 686–692. [Google Scholar] [CrossRef] [PubMed]
- Ngoc Nghia, N.; The Huy, B.; Thanh Phong, P.; Han, J.S.; Kwon, D.H.; Lee, Y.-I. Simple fluorescence optosensing probe for spermine based on ciprofloxacin-Tb3+ complexation. PLoS ONE 2021, 16, e0251306. [Google Scholar] [CrossRef] [PubMed]
- Nghia, N.N.; Huy, B.T.; Khanh, D.N.N.; Van Cuong, N.; Li, H.; Lee, Y.-I. Straightforward smartphone assay for quantifying tannic acid in beverages based on colour change of Eu3+/polyethyleneimine complex. Food Chem. 2023, 410, 135466. [Google Scholar] [CrossRef] [PubMed]
- Nghia, N.N.; The Huy, B.; Lee, Y.-I. Paper-based colorimetric probe for highly sensitive detection of folic acid based on open-ring form amplification of rhodamine B derivative. J. Ind. Eng. Chem. 2020, 81, 352–359. [Google Scholar] [CrossRef]
- Wang, L.; Zheng, S.; Lu, L.; Li, C.; Wang, F. A dual-mode ratiometric fluorescence and smartphone-assisted colorimetric sensing platform based on bifunctional Fe,Co-CQD for glucose analysis at physiological pH. Anal. Chim. Acta 2023, 1239, 340701. [Google Scholar] [CrossRef]
- Duan, W.; Cheng, J.; Guo, J. Smartphone-based photochemical sensor for multiplex determination of glucose, uric acid, and total cholesterol in fingertip blood. Analyst 2022, 147, 3285–3290. [Google Scholar] [CrossRef]
- Tang, K.; Chen, Y.; Wang, X.; Zhou, Q.; Lei, H.; Yang, Z.; Zhang, Z. Smartphone-integrated tri-color fluorescence sensing platform based on acid-sensitive fluorescence imprinted polymers for dual-mode visual intelligent detection of ibuprofen, chloramphenicol and florfenicol. Anal. Chim. Acta 2023, 1260, 341174. [Google Scholar] [CrossRef]
- Liu, F.; Chen, R.; Song, W.; Li, L.; Lei, C.; Nie, Z. Modular Combination of Proteolysis-Responsive Transcription and Spherical Nucleic Acids for Smartphone-Based Colorimetric Detection of Protease Biomarkers. Anal. Chem. 2021, 93, 3517–3525. [Google Scholar] [CrossRef]
- Hong, K.-I.; Yang, A.H.; Kim, Y.; Ranathunga, M.; Kim, U.; Joo, C.; Jang, W.-D. Simple and effective detection of water in hygroscopic organic solvents using smartphone-based device with dithiophene-conjugated benzothiazole. Sens. Actuators B 2023, 387, 133756. [Google Scholar] [CrossRef]
- Shi, Y.; Zhang, Y.; Hu, Y.; Moreddu, R.; Fan, Z.; Jiang, N.; Yetisen, A.K. Smartphone-based fluorescent sensing platforms for point-of-care ocular lactoferrin detection. Sens. Actuators B 2023, 378, 133128. [Google Scholar] [CrossRef]
- Biswas, S.K.; Chatterjee, S.; Bandyopadhyay, S.; Kar, S.; Som, N.K.; Saha, S.; Chakraborty, S. Smartphone-Enabled Paper-Based Hemoglobin Sensor for Extreme Point-of-Care Diagnostics. ACS Sens. 2021, 6, 1077–1085. [Google Scholar] [CrossRef] [PubMed]
- Liu, Y.; Ye, H.; Bayram, A.; Zhang, T.; Cai, Q.; Xie, C.; Huynh, H.; Peerzade, S.A.M.A.; Kahn, J.S.; Qin, Z. Gold Nanourchins Improve Virus Targeting and Plasmonic Coupling for Virus Diagnosis on a Smartphone Platform. ACS Sens. 2022, 7, 3741–3752. [Google Scholar] [CrossRef] [PubMed]
- Zhang, S.; Li, Z.; Wei, Q. Smartphone-based cytometric biosensors for point-of-care cellular diagnostics. Nanotechnol. Precis. Eng. 2020, 3, 32–42. [Google Scholar] [CrossRef]
- Wang, S.; Zheng, L.; Cai, G.; Liu, N.; Liao, M.; Li, Y.; Zhang, X.; Lin, J. A microfluidic biosensor for online and sensitive detection of Salmonella typhimurium using fluorescence labeling and smartphone video processing. Biosens. Bioelectron. 2019, 140, 111333. [Google Scholar] [CrossRef]
- Ulep, T.-H.; Zenhausern, R.; Gonzales, A.; Knoff, D.S.; Lengerke Diaz, P.A.; Castro, J.E.; Yoon, J.-Y. Smartphone based on-chip fluorescence imaging and capillary flow velocity measurement for detecting ROR1+ cancer cells from buffy coat blood samples on dual-layer paper microfluidic chip. Biosens. Bioelectron. 2020, 153, 112042. [Google Scholar] [CrossRef]
- Needs, S.H.; Osborn, H.M.I.; Edwards, A.D. Counting bacteria in microfluidic devices: Smartphone compatible ‘dip-and-test’ viable cell quantitation using resazurin amplified detection in microliter capillary arrays. J. Microbiol. Methods 2021, 187, 106199. [Google Scholar] [CrossRef] [PubMed]
- Kim, S.; Chun, H.J.; Lee, K.W.; Yoon, H.C. Smartphone-integrated urinary CTX-II immunosensor based on wavelength filtering from chromogenic reaction. Biosens. Bioelectron. 2020, 150, 111932. [Google Scholar] [CrossRef]
- Freeman, E.E.; Semeere, A.; Osman, H.; Peterson, G.; Rajadhyaksha, M.; González, S.; Martin, J.N.; Anderson, R.R.; Tearney, G.J.; Kang, D. Smartphone confocal microscopy for imaging cellular structures in human skin in vivo. Biomed. Opt. Express 2018, 9, 1906–1915. [Google Scholar] [CrossRef]
- Hong, X.; Nagarajan, V.K.; Mugler, D.H.; Yu, B. Smartphone microendoscopy for high resolution fluorescence imaging. J. Innov. Opt. Health Sci. 2016, 09, 1650046. [Google Scholar] [CrossRef]
- Gong, C.; Kulkarni, N.; Zhu, W.; Nguyen, C.D.; Curiel-Lewandrowski, C.; Kang, D. Low-cost, high-speed near infrared reflectance confocal microscope. Biomed. Opt. Express 2019, 10, 3497–3505. [Google Scholar] [CrossRef]
- Wang, H.; Zou, Q.; Xiang, Y.; Yang, J.; Xu, Z.; Yang, W.; Wu, Y.; Wu, J.; Liu, D.; Hu, N.; et al. A smart tablet-phone-based system using dynamic light modulation for highly sensitive colorimetric biosensing. Talanta 2023, 252, 123862. [Google Scholar] [CrossRef] [PubMed]
- Shafizadeh, M.; Abbasi-Moayed, S.; Hamzei, Z.; Keshavarz, A.; Yousefi, S.; Hormozi-Nezhad, M.R.; Golmohammadi, H. Chlorophyll-based wicking sensing bioplatform coupled with a smartphone-based sample-to-answer analytical device for on-site detection of picric acid. Biosens. Bioelectron. X 2022, 11, 100150. [Google Scholar] [CrossRef]
- Duan, N.; Chen, X.; Lin, X.; Ying, D.; Wang, Z.; Yuan, W.; Wu, S. Paper-based fluorometric sensing of malachite green using synergistic recognition of aptamer-molecularly imprinted polymers and luminescent metal–organic frameworks. Sens. Actuators B 2023, 384, 133665. [Google Scholar] [CrossRef]
- Ma, J.; Guan, Y.; Xing, F.; Wang, Y.; Li, X.; Yu, Q.; Yu, X. Smartphone-based chemiluminescence detection of aflatoxin B1 via labelled and label-free dual sensing systems. Food Chem. 2023, 413, 135654. [Google Scholar] [CrossRef] [PubMed]
- Xiao, M.; Liu, Z.; Xu, N.; Jiang, L.; Yang, M.; Yi, C. A Smartphone-Based Sensing System for On-Site Quantitation of Multiple Heavy Metal Ions Using Fluorescent Carbon Nanodots-Based Microarrays. ACS Sens. 2020, 5, 870–878. [Google Scholar] [CrossRef] [PubMed]
- Ye, H.; Ke, Y.; Yue, C.; Xie, P.; Sheng, R.; Zeng, L. 5G smartphone-adaptable fluorescence sensing platform for simultaneous detection of toxic formaldehyde and phosgene in different emission channels. Dyes Pigm. 2022, 207, 110782. [Google Scholar] [CrossRef]
- Liu, J.; Zhan, Y.; Qiu, B.; Lin, Z.; Guo, L. Portable Smartphone Platform Based on Aggregation-Induced Enhanced Emission Carbon Dots for Ratiometric Quantitative Sensing of Fluoride Ions. ACS Sens. 2023, 8, 884–892. [Google Scholar] [CrossRef]
- Shan, Y.; Wang, B.; Huang, H.; Jian, D.; Wu, X.; Xue, L.; Wang, S.; Liu, F. On-site quantitative Hg2+ measurements based on selective and sensitive fluorescence biosensor and miniaturized smartphone fluorescence microscope. Biosens. Bioelectron. 2019, 132, 238–247. [Google Scholar] [CrossRef]
- Pennacchio, A.; Giampaolo, F.; Piccialli, F.; Cuomo, S.; Notomista, E.; Spinelli, M.; Amoresano, A.; Piscitelli, A.; Giardina, P. A machine learning-enhanced biosensor for mercury detection based on an hydrophobin chimera. Biosens. Bioelectron. 2022, 196, 113696. [Google Scholar] [CrossRef]
- Piccialli, F.; Giampaolo, F.; Di Cola, V.S.; Gatta, F.; Chiaro, D.; Prezioso, E.; Izzo, S.; Cuomo, S. A machine learning-based approach for mercury detection in marine waters. In Proceedings of the IEEE International Conference on Data Mining Workshops, ICDMW, Orlando, FL, USA, 28 November–1 December 2022. [Google Scholar]
- Lu, Z.; Chen, M.; Li, M.; Liu, T.; Sun, M.; Wu, C.; Su, G.; Yin, J.; Wu, M.; Zou, P.; et al. Smartphone-integrated multi-color ratiometric fluorescence portable optical device based on deep learning for visual monitoring of Cu2+ and thiram. Chem. Eng. J. 2022, 439, 135686. [Google Scholar] [CrossRef]
- Lu, Z.; Chen, S.; Chen, M.; Ma, H.; Wang, T.; Liu, T.; Yin, J.; Sun, M.; Wu, C.; Su, G.; et al. Trichromatic ratiometric fluorescent sensor based on machine learning and smartphone for visual and portable monitoring of tetracycline antibiotics. Chem. Eng. J. 2023, 454, 140492. [Google Scholar] [CrossRef]
- Zhu, J.; Cho, M.; Li, Y.; He, T.; Ahn, J.; Park, J.; Ren, T.-L.; Lee, C.; Park, I. Machine learning-enabled textile-based graphene gas sensing with energy harvesting-assisted IoT application. Nano Energy 2021, 86, 106035. [Google Scholar] [CrossRef]
- Liu, T.; Chen, S.; Ruan, K.; Zhang, S.; He, K.; Li, J.; Chen, M.; Yin, J.; Sun, M.; Wang, X.; et al. A handheld multifunctional smartphone platform integrated with 3D printing portable device: On-site evaluation for glutathione and azodicarbonamide with machine learning. J. Hazard. Mater. 2022, 426, 128091. [Google Scholar] [CrossRef]
- Dutta, S. Point of care sensing and biosensing using ambient light sensor of smartphone: Critical review. TrAC Trends Anal. Chem. 2019, 110, 393–400. [Google Scholar] [CrossRef]
- Park, Y.M.; Han, Y.D.; Kim, K.R.; Zhang, C.; Yoon, H.C. An immunoblot-based optical biosensor for screening of osteoarthritis using a smartphone-embedded illuminometer. Anal. Methods 2015, 7, 6437–6442. [Google Scholar] [CrossRef]
- Pol, R.; Diez, L.; Gabriel, D.; Baeza, M. Versatile Three-Dimensional-Printed Platform for Nitrite Ion Analyses Using a Smartphone with Real-Time Location. Anal. Chem. 2019, 91, 13916–13923. [Google Scholar] [CrossRef]
- Gul, I.; Aer, L.; Zhang, M.; Jiang, H.; Khan, A.A.; Bilal, M.; Fang, R.; Feng, J.; Zeng, H.; Tang, L. Multifunctional 3D-printed platform integrated with a smartphone ambient light sensor for halocarbon contaminants monitoring. Environ. Technol. Innov. 2021, 24, 101883. [Google Scholar] [CrossRef]
- Hussain, I.; Das, M.; Ahamad, K.U.; Nath, P. Water salinity detection using a smartphone. Sens. Actuators B 2017, 239, 1042–1050. [Google Scholar] [CrossRef]
- Park, Y.M.; Han, Y.D.; Chun, H.J.; Yoon, H.C. Ambient light-based optical biosensing platform with smartphone-embedded illumination sensor. Biosens. Bioelectron. 2017, 93, 205–211. [Google Scholar] [CrossRef]
- Zhao, Y.; Yang, M.; Fu, Q.; Ouyang, H.; Wen, W.; Song, Y.; Zhu, C.; Lin, Y.; Du, D. A Nanozyme- and Ambient Light-Based Smartphone Platform for Simultaneous Detection of Dual Biomarkers from Exposure to Organophosphorus Pesticides. Anal. Chem. 2018, 90, 7391–7398. [Google Scholar] [CrossRef]
- Wang, T.-T.; Guo, K.; Hu, X.-M.; Liang, J.; Li, X.-D.; Zhang, Z.-F.; Xie, J. Label-Free Colorimetric Detection of Urine Glucose Based on Color Fading Using Smartphone Ambient-Light Sensor. Chemosensors 2020, 8, 10. [Google Scholar] [CrossRef]
- Madrid, R.E.; Ashur Ramallo, F.; Barraza, D.E.; Chaile, R.E. Smartphone-Based Biosensor Devices for Healthcare: Technologies, Trends, and Adoption by End-Users. Bioengineering 2022, 9, 101. [Google Scholar] [CrossRef] [PubMed]
- Celikbas, E.; Celik, E.G.; Timur, S. Paper-Based Analytical Methods for Smartphone Sensing with Functional Nanoparticles: Bridges from Smart Surfaces to Global Health. Anal. Chem. 2018, 90, 12325–12333. [Google Scholar] [CrossRef]
- Wu, J.; Liu, H.; Chen, W.; Ma, B.; Ju, H. Device integration of electrochemical biosensors. Nat. Rev. Bioeng. 2023, 1, 346–360. [Google Scholar] [CrossRef] [PubMed]
- Maduraiveeran, G. Nanomaterials-based portable electrochemical sensing and biosensing systems for clinical and biomedical applications. J. Anal. Sci. Technol. 2022, 13, 35. [Google Scholar] [CrossRef]
- Guo, J. Smartphone-Powered Electrochemical Dongle for Point-of-Care Monitoring of Blood β-Ketone. Anal. Chem. 2017, 89, 8609–8613. [Google Scholar] [CrossRef] [PubMed]
- Zhang, X.; Xia, Y.; Liu, Y.; Mugo, S.M.; Zhang, Q. Integrated Wearable Sensors for Sensing Physiological Pressure Signals and β-Hydroxybutyrate in Physiological Fluids. Anal. Chem. 2022, 94, 993–1002. [Google Scholar] [CrossRef] [PubMed]
- Zhao, H.; Zhang, X.; Qin, Y.; Xia, Y.; Xu, X.; Sun, X.; Yu, D.; Mugo, S.M.; Wang, D.; Zhang, Q. An Integrated Wearable Sweat Sensing Patch for Passive Continuous Analysis of Stress Biomarkers at Rest. Adv. Funct. Mater. 2023, 33, 2212083. [Google Scholar] [CrossRef]
- Xing, Y.; Liu, J.; Luo, J.; Ming, T.; Yang, G.; Sun, S.; Xu, S.; Li, X.; He, E.; Kong, F.; et al. A Dual-Channel Intelligent Point-of-Care Testing System for Soluble Programmed Death-1 and Programmed Death-Ligand 1 Detection Based on Folding Paper-Based Immunosensors. ACS Sens. 2022, 7, 584–592. [Google Scholar] [CrossRef]
- He, W.; Liu, L.; Cao, Z.; Lin, Y.; Tian, Y.; Zhang, Q.; Zhou, C.; Ye, X.; Cui, T. Shrink polymer based electrochemical sensor for point-of-care detection of prostate-specific antigen. Biosens. Bioelectron. 2023, 228, 115193. [Google Scholar] [CrossRef]
- Liao, J.; Chang, F.; Han, X.; Ge, C.; Lin, S. Wireless water quality monitoring and spatial mapping with disposable whole-copper electrochemical sensors and a smartphone. Sens. Actuators B 2020, 306, 127557. [Google Scholar] [CrossRef]
- Yan, W.; Ma, C.; Cai, X.; Sun, Y.; Zhang, G.; Song, W. Self-powered and wireless physiological monitoring system with integrated power supply and sensors. Nano Energy 2023, 108, 108203. [Google Scholar] [CrossRef]
- Yu, Z.; Lin, Q.; Gong, H.; Li, M.; Tang, D. Integrated solar-powered MEMS-based photoelectrochemical immunoassay for point-of-care testing of cTnI protein. Biosens. Bioelectron. 2023, 223, 115028. [Google Scholar] [CrossRef] [PubMed]
- Vernon, J.; Canyelles-Pericas, P.; Torun, H.; Dai, X.; Ng, W.P.; Binns, R.; Busawon, K.; Fu, Y.Q. Acousto-Pi: An Opto-Acoustofluidic System Using Surface Acoustic Waves Controlled with Open-Source Electronics for Integrated In-Field Diagnostics. IEEE Trans. Ultrason. Ferroelectr. Freq. Control 2022, 69, 411–422. [Google Scholar] [CrossRef] [PubMed]
- Zida, S.I.; Lin, Y.-D.; Khung, Y.L. Current Trends on Surface Acoustic Wave Biosensors. Adv. Mater. Technol. 2021, 6, 2001018. [Google Scholar] [CrossRef]
- Handzel, O.; Franck, K. Smartphone based hearing evaluation. Oper. Tech. Otolaryngol. Head Neck Surg. 2021, 32, 87–91. [Google Scholar] [CrossRef]
- Jandas, P.J.; Luo, J.; Quan, A.; Li, C.; Fu, C.; Fu, Y.Q. Graphene oxide-Au nano particle coated quartz crystal microbalance biosensor for the real time analysis of carcinoembryonic antigen. RSC Adv. 2020, 10, 4118–4128. [Google Scholar] [CrossRef]
- Bakhshpour, M.; Piskin, A.K.; Yavuz, H.; Denizli, A. Quartz crystal microbalance biosensor for label-free MDA MB 231 cancer cell detection via notch-4 receptor. Talanta 2019, 204, 840–845. [Google Scholar] [CrossRef]
- Nair, M.P.; Teo, A.J.T.; Li, K.H.H. Acoustic Biosensors and Microfluidic Devices in the Decennium: Principles and Applications. Micromachines 2022, 13, 24. [Google Scholar] [CrossRef]
- Li, F.; Chen, H.; Song, X.; Zhang, Q.; Li, Y.; Wang, Y. CondioSense: High-quality context-aware service for audio sensing system via active sonar. Pers. Ubiquitous Comput. 2017, 21, 17–29. [Google Scholar] [CrossRef]
- Stowell, D.; Giannoulis, D.; Benetos, E.; Lagrange, M.; Plumbley, M.D. Detection and Classification of Acoustic Scenes and Events. IEEE Trans. Multimed. 2015, 17, 1733–1746. [Google Scholar] [CrossRef]
- Nandakumar, R.; Gollakota, S.; Watson, N. Contactless Sleep Apnea Detection on Smartphones. In Proceedings of the 13th Annual International Conference on Mobile Systems, Applications, and Services, Florence, Italy, 18–22 May 2015; Association for Computing Machinery: Florence, Italy; pp. 45–57. [Google Scholar]
- Wang, W.; Liu, A.X.; Sun, K. Device-free gesture tracking using acoustic signals. In Proceedings of the 22nd Annual International Conference on Mobile Computing and Networking, New York, NY, USA, 3–7 October 2016; Association for Computing Machinery: New York, NY, USA; pp. 82–94. [Google Scholar]
- Nandakumar, R.; Gollakota, S.; Sunshine, J.E. Opioid overdose detection using smartphones. Sci. Transl. Med. 2019, 11, eaau8914. [Google Scholar] [CrossRef]
- Wang, X.; Huang, R.; Yang, C.; Mao, S. Smartphone Sonar-Based Contact-Free Respiration Rate Monitoring. ACM Trans. Comput. Healthc. 2021, 2, 15. [Google Scholar] [CrossRef]
- Mohammed, Z.; Elfadel, I.M.; Rasras, M. Monolithic Multi Degree of Freedom (MDoF) Capacitive MEMS Accelerometers. Micromachines 2018, 9, 602. [Google Scholar] [CrossRef] [PubMed]
- Grouios, G.; Ziagkas, E.; Loukovitis, A.; Chatzinikolaou, K.; Koidou, E. Accelerometers in Our Pocket: Does Smartphone Accelerometer Technology Provide Accurate Data? Sensors 2023, 23, 192. [Google Scholar] [CrossRef] [PubMed]
- Barrantes, S.; Sánchez Egea, A.J.; González Rojas, H.A.; Martí, M.J.; Compta, Y.; Valldeoriola, F.; Simo Mezquita, E.; Tolosa, E.; Valls-Solè, J. Differential diagnosis between Parkinson’s disease and essential tremor using the smartphone’s accelerometer. PLoS ONE 2017, 12, e0183843. [Google Scholar] [CrossRef] [PubMed]
- Omberg, L.; Chaibub Neto, E.; Perumal, T.M.; Pratap, A.; Tediarjo, A.; Adams, J.; Bloem, B.R.; Bot, B.M.; Elson, M.; Goldman, S.M.; et al. Remote smartphone monitoring of Parkinson’s disease and individual response to therapy. Nat. Biotechnol. 2022, 40, 480–487. [Google Scholar] [CrossRef]
- Kuosmanen, E.; Wolling, F.; Vega, J.; Kan, V.; Nishiyama, Y.; Harper, S.; Van Laerhoven, K.; Hosio, S.; Ferreira, D. Smartphone-Based Monitoring of Parkinson Disease: Quasi-Experimental Study to Quantify Hand Tremor Severity and Medication Effectiveness. JMIR Mhealth Uhealth 2020, 8, e21543. [Google Scholar] [CrossRef] [PubMed]
- Lipsmeier, F.; Taylor, K.I.; Postuma, R.B.; Volkova-Volkmar, E.; Kilchenmann, T.; Mollenhauer, B.; Bamdadian, A.; Popp, W.L.; Cheng, W.-Y.; Zhang, Y.-P.; et al. Reliability and validity of the Roche PD Mobile Application for remote monitoring of early Parkinson’s disease. Sci. Rep. 2022, 12, 12081. [Google Scholar] [CrossRef]
Figure 1.
(i) Microfluidic-based wearable sweat sensor using NFC interface with a smartphone: (A) demonstration of the steps for using the device; (B) image of microfluidic biosensor before and after injecting artificial sweat; and (C) polar co-ordinate of captured volume sweat. Reprinted with permission from Ref. [33]. Copyright 2016, American Association for the Advancement of Science. (ii) (A) 3D model and (B) assembly setup of multichannel smartphone spectrometer. Reprinted with permission from Ref. [34]. Copyright 2017, Elsevier.

Figure 2.
(i) Illustration of the device for detecting water traces using a smartphone: (A) sample preparation; and (B) display of the screenshots of the sample analysis performed on the smartphone. Reprinted with permission from Ref. [42]. Copyright 2023, Elsevier. (ii) Three platforms for detecting lactoferrin based on the reaction of Tb2+ ion with lactoferrin: (A) nitrocellulose membrane as the lateral flow assay; (B) capillary tube; (C) contact lens system; and (D) a smartphone readout device for all three platforms. Reprinted with permission from Ref. [43]. Copyright 2023, Elsevier.

Figure 3.
(i) Paper-based sensor for Hgb using smartphone-based portable device: (A) detection protocol stepwise; (B) top-view image of the device; and (C) schematic representation of the portable device: (1) sliding bar; (2) a light intensity-measuring microchip; (3) LED source; (4) Arduino board; (5) cable; (6) cartridge; (7); reaction spot; and (8) smartphone. Reprinted with permission from Ref. [44]. Copyright © 2021 American Chemical Society. (ii) Smartphone-based spectrometer colorimetric detection: (A) CAD drawing of the device; (B) (i) spectral images obtained by the plastic fibers from violet (405 nm), green (532 nm), and red (641 nm) lasers; (ii) the output spectrum extracted from the image after calibration; (C–E) images of serial dilutions of AuNU and their absorption spectra; (F) comparison of absorbance; (G) images of RSV detection; (H) corresponding absorbance extracted from (G); and (I) calibration curve. Reprinted with permission from Ref. [45]. Copyright © 2022 American Chemical Society.

Figure 4.
(i) The fundamental principle of count-based analysis is based on the generation of a blue-colored product through the chromogenic reaction in the biosensing channel. The number of observed patterns varies according to the concentration levels of the chromogenic product: (A) low concentration, (B) medium concentration, and (C) high concentration. Reprinted with permission from Ref. [50]. Copyright 2020, Elsevier. (ii) Photo image (left) and illustration scheme (right) of the smartphone confocal microscope. Confocal images of human skin in vivo with MP4 video (A) and DNG file (B). Reprinted with permission from Ref. [51]. © 2018 Optica Publishing Group.

Figure 6.
(i) (A) Schematic illustration of the sensing system based on the illumination sensor and respective real pictures; (B) Setup of the illumination sensor involved connecting an optical fiber to the front of the smartphone, which served as the LED flash; (C) Illustration of the biosensing channel for uCTX-II competitive immunoassay: (I) construction of the biosensing channel, (II) photograph obtained for uCTX-II concentrations ranging from 0 to 10 ng/mL, (III) corresponding spectral intensity of the samples, (IV) relationship between uCTX-II concentrations and light intensity. Reprinted with permission from Ref. [69]. Copyright 2015 Royal Society of Chemistry. (ii) Schematic of smartphone-based direct transmission (A), and evanescent field absorption (B) salinity sensor modules. Reprinted with permission from Ref. [72]. Copyright 2017, Elsevier.

Figure 7.
(i) Guo’s ketone-sensing device based on smartphone: (a) dongle, (b) working mechanism of the test strip, (c) electronic elements in the dongle, and (d) the preparing procedure of the disposable electrode strip test consists of (1) printing carbon ink on PET substrate, (2) PET with carbon electrodes was baked at 65 °C, (3) an insulating stick double layer is pasted on the PET leaving the working area, and (4) immobilization of β-hydroxybutyrate dehydrogenase. Reprinted with permission from Ref. [80]. Copyright © 2017 American Chemical Society. (ii) Dual wearable sensor with Bluetooth connection for sensing hydroxybutyrate and physiological pressure. Reprinted with permission from Ref. [81]. Copyright © 2021 American Chemical Society.

Figure 8.
(i) (A) Fold electrode; (B) preparation of the paper-based sensor; (C) coating materials on the working electrode; and (D) TEMimage of NH2-SWCNTs/NMB/AuNP nanocomposites, (E) SEM image of the working electrode modified with NH2-SWCNTs/NMB/AuNP nanocomposites; (ii) (A) Overview of the device; (B) block diagram of the device; and (C) detection process of the sPD-1 and sPD-L1. Reprinted with the permission of Ref. [83]. Copyright © 2022 American Chemical Society.

Figure 9.
Schematics of prostate cancer diagnostics: (A) The diagnostic process. (B) The three-electrode system. (C) The sensor’s surface modification process. (D) Detecting PSA from the peak currents. (E) The block diagram. (F) The photo of PCB (left) and electrode. Reprinted with permission from Ref. [84]. Copyright 2023, Elsevier.


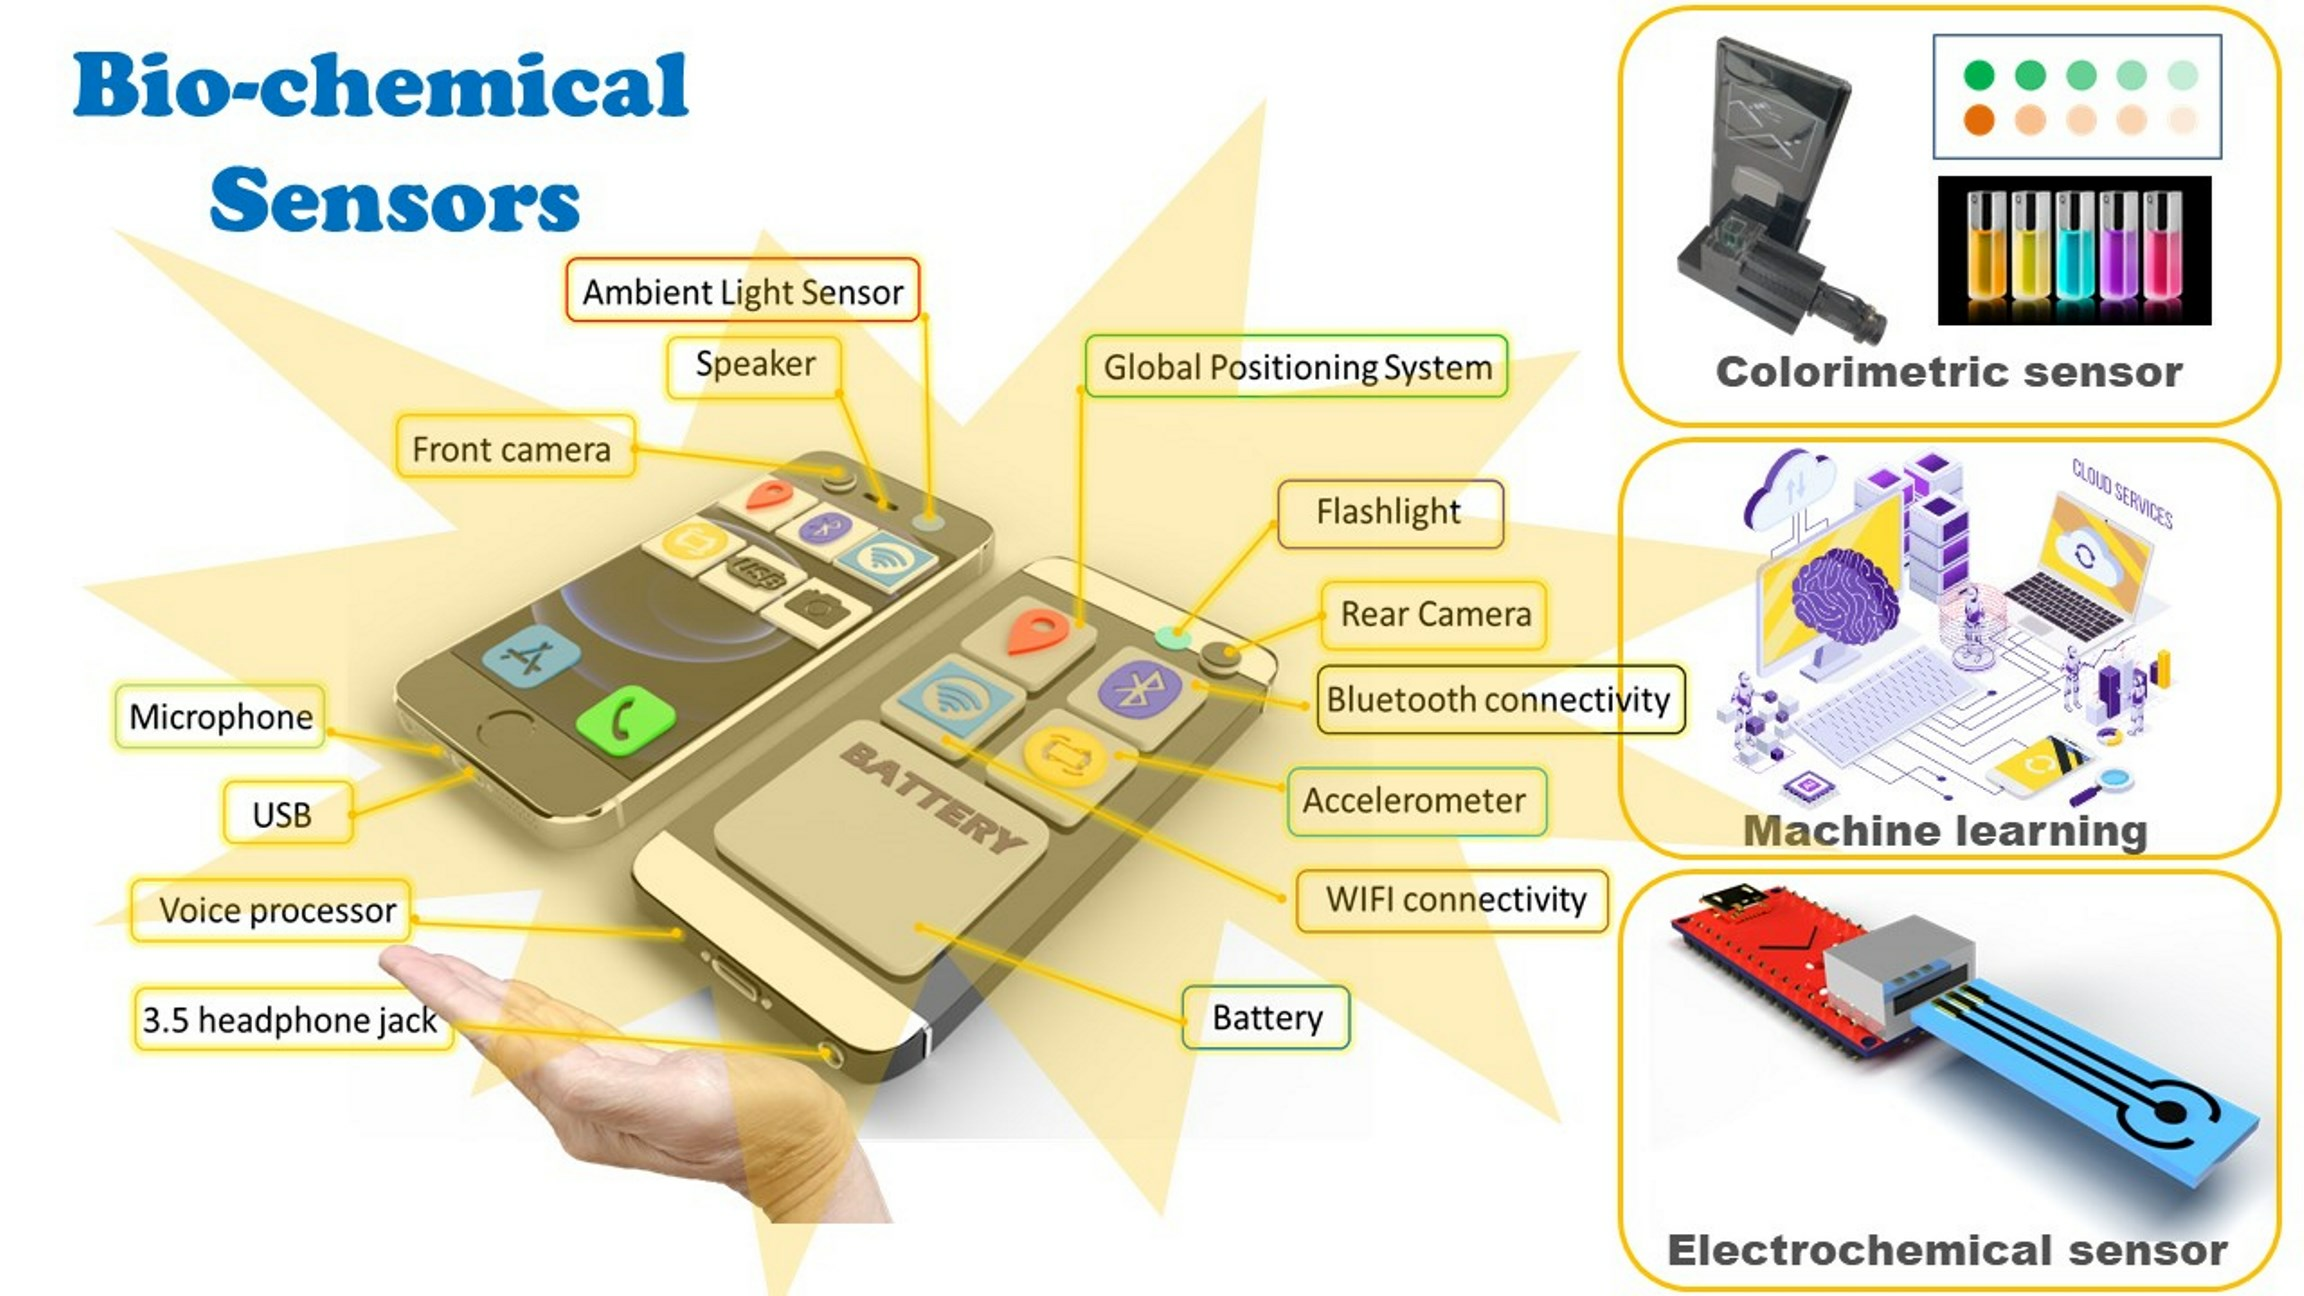
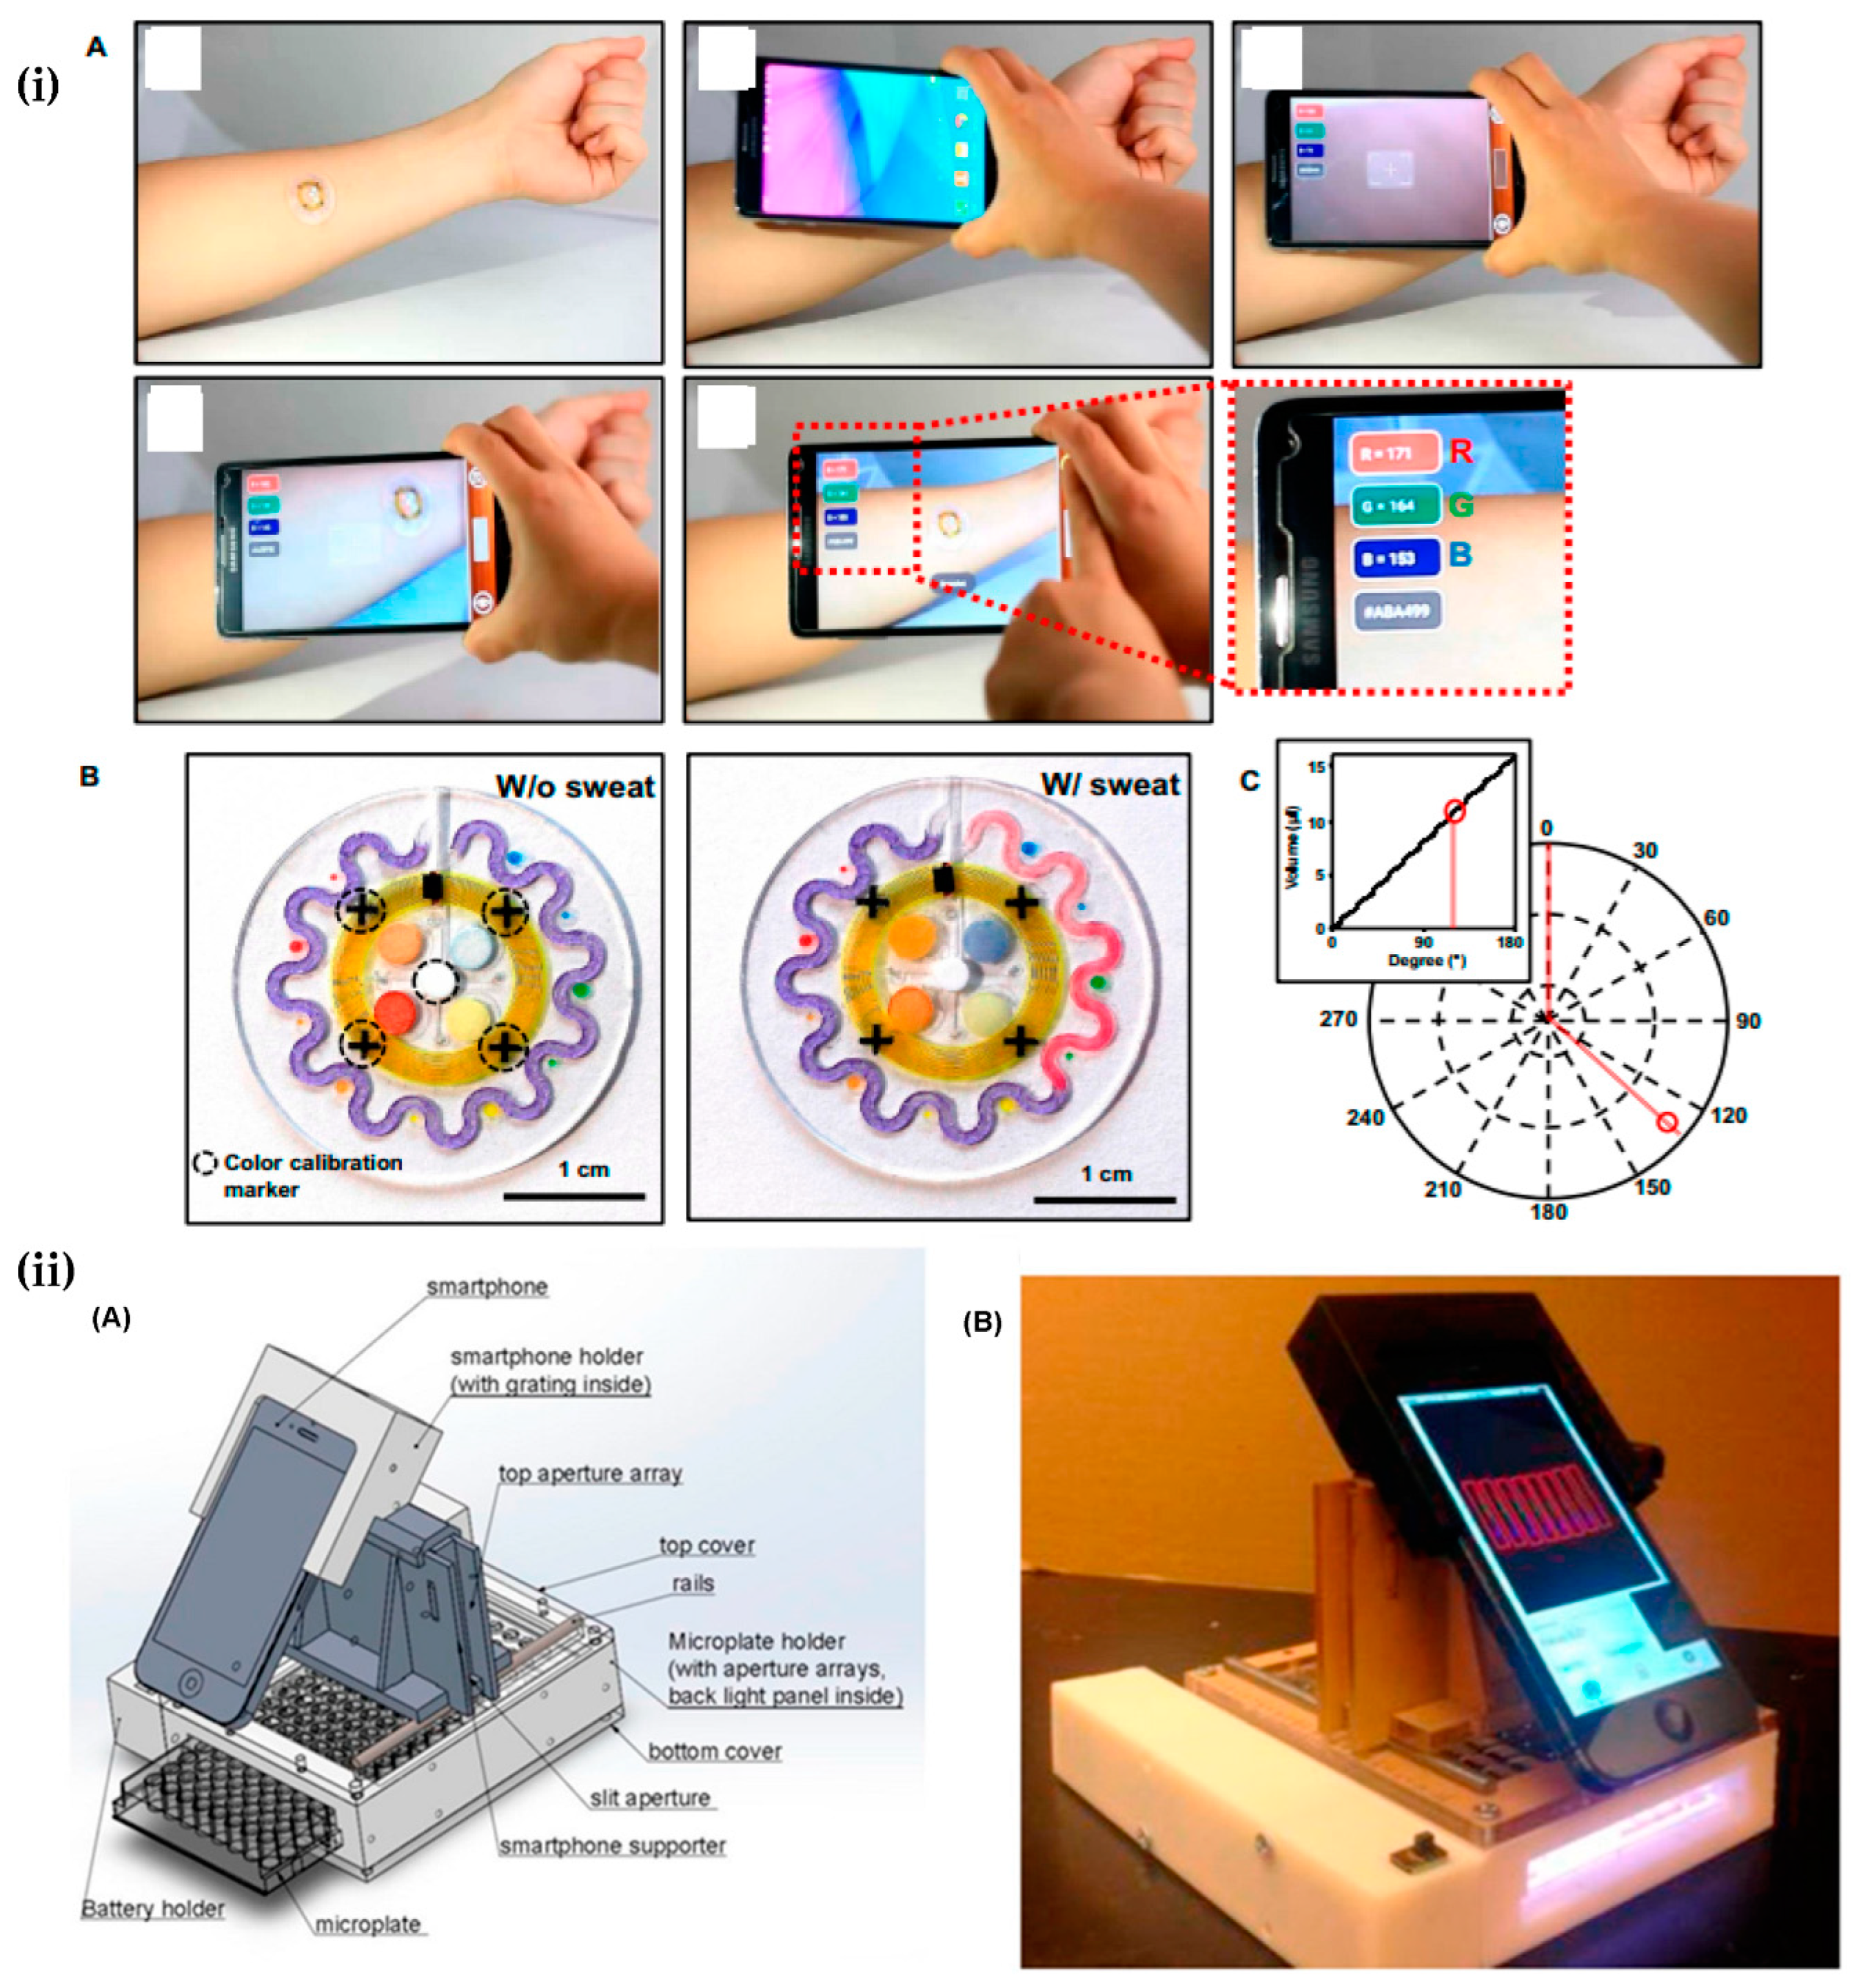
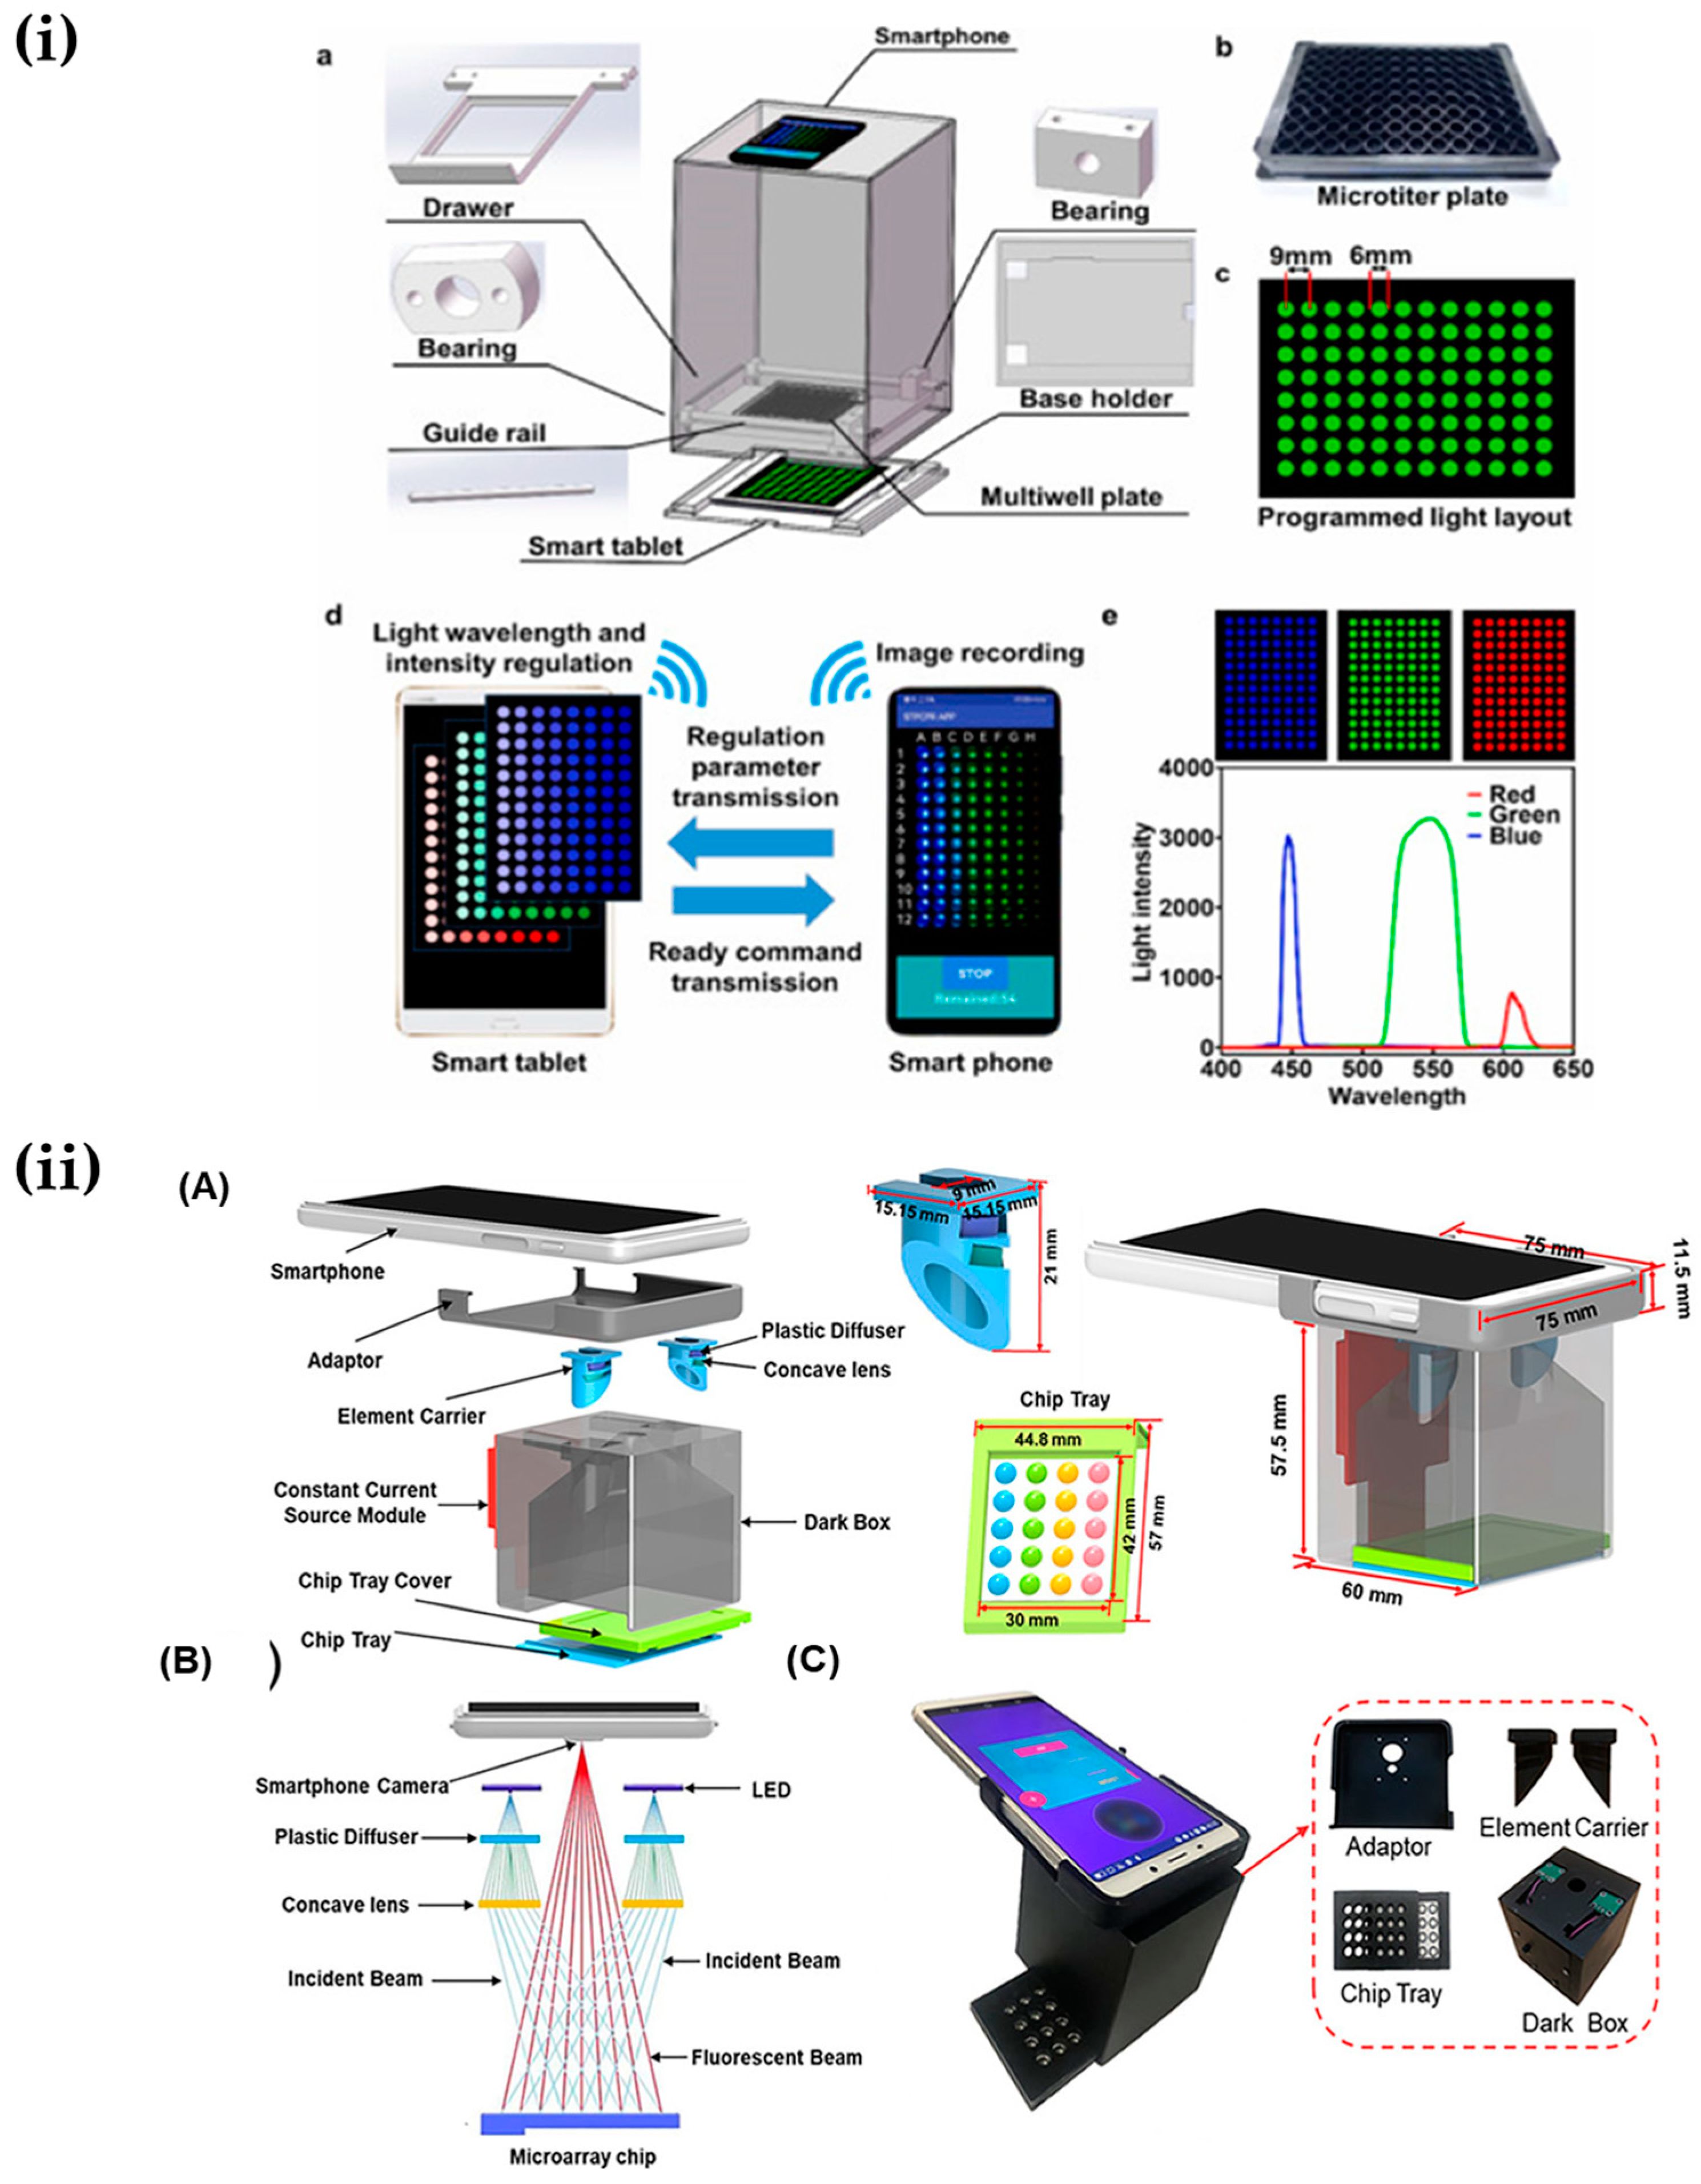
Table 1.
Recent applications of smartphone on an optical-based biosensor device.
| Analyte | Approach | Limit of Detection | Ref |
|---|---|---|---|
| Lactate, chloride, glucose, and pH | Wireless-communication-integrated microfluidic. | 1.6 mM, 39 mM, 200 µM, pH: 5–7 | [33] |
| Protein and human interleukin-6 | Homemade multichannel smartphone spectrometer. | 2 µg/mL, 8.8 pg/mL | [34] |
| Spermine | Paper strip test—smartphone captures and analyze images. | 0.17 µM | [35] |
| Tannic acid | Portable homemade fluorescent reader based on smartphone. | 87 nM | [36] |
| Folic acid | Paper strip test—smartphone captures and analyze fluorescence of strip test. | 22 nM | [37] |
| Glucose | Portable kit—smartphone-assisted fluorescent/colorimetric device. | 0.093 µM/0.437 µM | [38] |
| Glucose, uric acid, and cholesterol | Transform photochemical signal with the assistance of dongle connected to the smartphone. | 1.67 mM, 119 μM, and 2.59 mM | [39] |
| Ibuprofen, chloramphenicol, and florfenicol | Portable device using the smartphone to capture and analyze the fluorescence of the sample. | 10 pM, 8.5 pM, and 5.5 nM | [40] |
| Protease biomarker | Smartphone-based colorimetric paper strip test. | 5.7 pM | [41] |
| Water in organic solvent | Smartphone adapter for fluorescence imaging. | 0.05% | [42] |
| Lactoferrin | Smartphone-based fluorescence portable device with the automation of region of interest. | 0.12 mg/mL | [43] |
| Hemoglobin | Paper strip test—light illumination control by smartphone. | <0.070 mg/mL | [44] |
| Respiratory syncytial virus | Smartphone-based colorimetric spectrometer using flash as an excitation source. | 1400 PFU/mL | [45] |
| Salmonella | Microfluidic integrated with the fabricated fluorescent microscope using smartphone. | 58 CFU/mL | [47] |
| Tyrosine-like orphan receptor one | Smartphone-based on-chip microscopic imaging. | 0.1 cell/µL | [48] |
| Bacteria | Smartphone-based fluorescence imaging. | 10 CFU/mL | [49] |
| Urinary C-telopeptide fragments | Colorimetric with the fabricated specific color filter using smartphone. | 0–10 ng/mL | [50] |
| Tissue imaging | Smartphone confocal microscope for two-dimensional confocal imaging. | Resolution of 1–5 µm | [51] |
| Tartrazine, amaranth, and phenol red | Smartphone-based colorimeter using smart tablet as multi-light excitation sources. | 0.44, 1.04, 47 (µg/mL) | [54] |
| Picric acid, malachite green, aflatoxin, formaldehyde, and phosgene | Smartphone captures and analyzes image-based analytical device. | 10 µM, 0.1 ng/mL, 0.35 ng/mL, 62 nM, and 23 nM | [55,56,57,59] |
| Hg2+, Pb2+, and Cu2+ ions | Smartphone-based portable device with the homogenized LED light sources by plastic diffuser. | 5.8 nM, 0.12 µM, and 76 nM | [58] |
| Fluoride | Smartphone-based fluorescence signal analysis. | 1.53 µM | [60] |
| Hg2+ ions | Smartphone fluorescence microscope. | 1 nM | [61] |
| Cu2+, thiaram, and tetracycline | Deep-learning-assisted smartphone-based colorimetric device. | 1.84 µM, 0.34 µM, 0.42 µM | [64,65] |
| Glutathione, and azodicarbonamide | Deep-learning-assisted smartphone-based fluorescence device. | 0.07 µM, 0.09 µM | [67] |
| Osteoarthritis | Ambient light sensor of smartphone-embedded illuminometer. | 0.3 ng/mL | [69] |
| Water salinity | Integrate an ambient light sensor and flash light of smartphone-based colorimetric device. | 0.04 ppt | [72] |
| Butyrylcholinesterase and glucose | Ambient light sensor of smartphone-based colorimetric device. | 0.028 nM, 5 µg/mL | [74,75] |
Table 2.
List of achievements of smartphone-based electrochemical sensors.
| Analyte | Approach | Performance | Ref |
|---|---|---|---|
| Blood ketone | Dongle-connected OTG port as an electrochemical system. | LOD: 1 µM | [80] |
| β-hydroxybutyrate | Homemade signal-processing-circuitry-integrated wearable amperometric sensor. | 322.01 nA/mM | [81] |
| Cortisol, Mg2+, and pH | Homemade signal-processing-circuitry-based amperometric wearable sensor controlled by a smartphone. | 2751 nA/decade, 47.3 mV/decade, 63.96 mV/pH | [82] |
| Programmed death-1 and programmed death-ligand 1 | Homemade dongle using paper-based three-electrode kit for voltammetry device controlled by a smartphone. | LOD: 10 pg/mL, 5 pg/mL | [83] |
| Prostate-specific antigen | Wrinkled electrode integrated with miniaturized electrochemical electric circuit controlled with a smartphone through Bluetooth. | LOD: 0.38 fg/mL | [84] |
| Water quality (Pb2+ and chemical oxygen demand-COD) | Whole-copper-electrode-connected chronoamperometric/voltammetric detector operated by Bluetooth. | LOD: 45 nM, 9 mg/L | [85] |
| Electrocardiogram and blood pressure | Self-powered wearable triboelectric sensor which transmitted output signal to smartphone via Bluetooth. | NA | [86] |
| Cardiac troponin I | Self-powered photo electrochemical sensor with assistance of artificial neural network model. | LOD: <2 pg/mL | [87] |
Disclaimer/Publisher’s Note: The statements, opinions and data contained in all publications are solely those of the individual author(s) and contributor(s) and not of MDPI and/or the editor(s). MDPI and/or the editor(s) disclaim responsibility for any injury to people or property resulting from any ideas, methods, instructions or products referred to in the content. |
© 2023 by the authors. Licensee MDPI, Basel, Switzerland. This article is an open access article distributed under the terms and conditions of the Creative Commons Attribution (CC BY) license (https://creativecommons.org/licenses/by/4.0/).
Share and Cite
MDPI and ACS Style
Bui, T.H.; Thangavel, B.; Sharipov, M.; Chen, K.; Shin, J.H. Smartphone-Based Portable Bio-Chemical Sensors: Exploring Recent Advancements. Chemosensors 2023, 11, 468. https://doi.org/10.3390/chemosensors11090468
AMA Style
Bui TH, Thangavel B, Sharipov M, Chen K, Shin JH. Smartphone-Based Portable Bio-Chemical Sensors: Exploring Recent Advancements. Chemosensors. 2023; 11(9):468. https://doi.org/10.3390/chemosensors11090468
Chicago/Turabian StyleBui, The Huy, Balamurugan Thangavel, Mirkomil Sharipov, Kuangcai Chen, and Joong Ho Shin. 2023. "Smartphone-Based Portable Bio-Chemical Sensors: Exploring Recent Advancements" Chemosensors 11, no. 9: 468. https://doi.org/10.3390/chemosensors11090468
Note that from the first issue of 2016, this journal uses article numbers instead of page numbers. See further details here.