
Gas Sensing Properties of CuWO4@WO3 n-n Heterojunction Prepared by Direct Hydrolysis of Mesitylcopper (I) on WO3·2H2O Nanoleaves

 , , ,
, , ,  and
and
Abstract
:1. Introduction
2. Experimental Section
2.1. Preparation of Nanomaterials
2.1.1. Preparation of the WO3·2H2O Nanoleaves
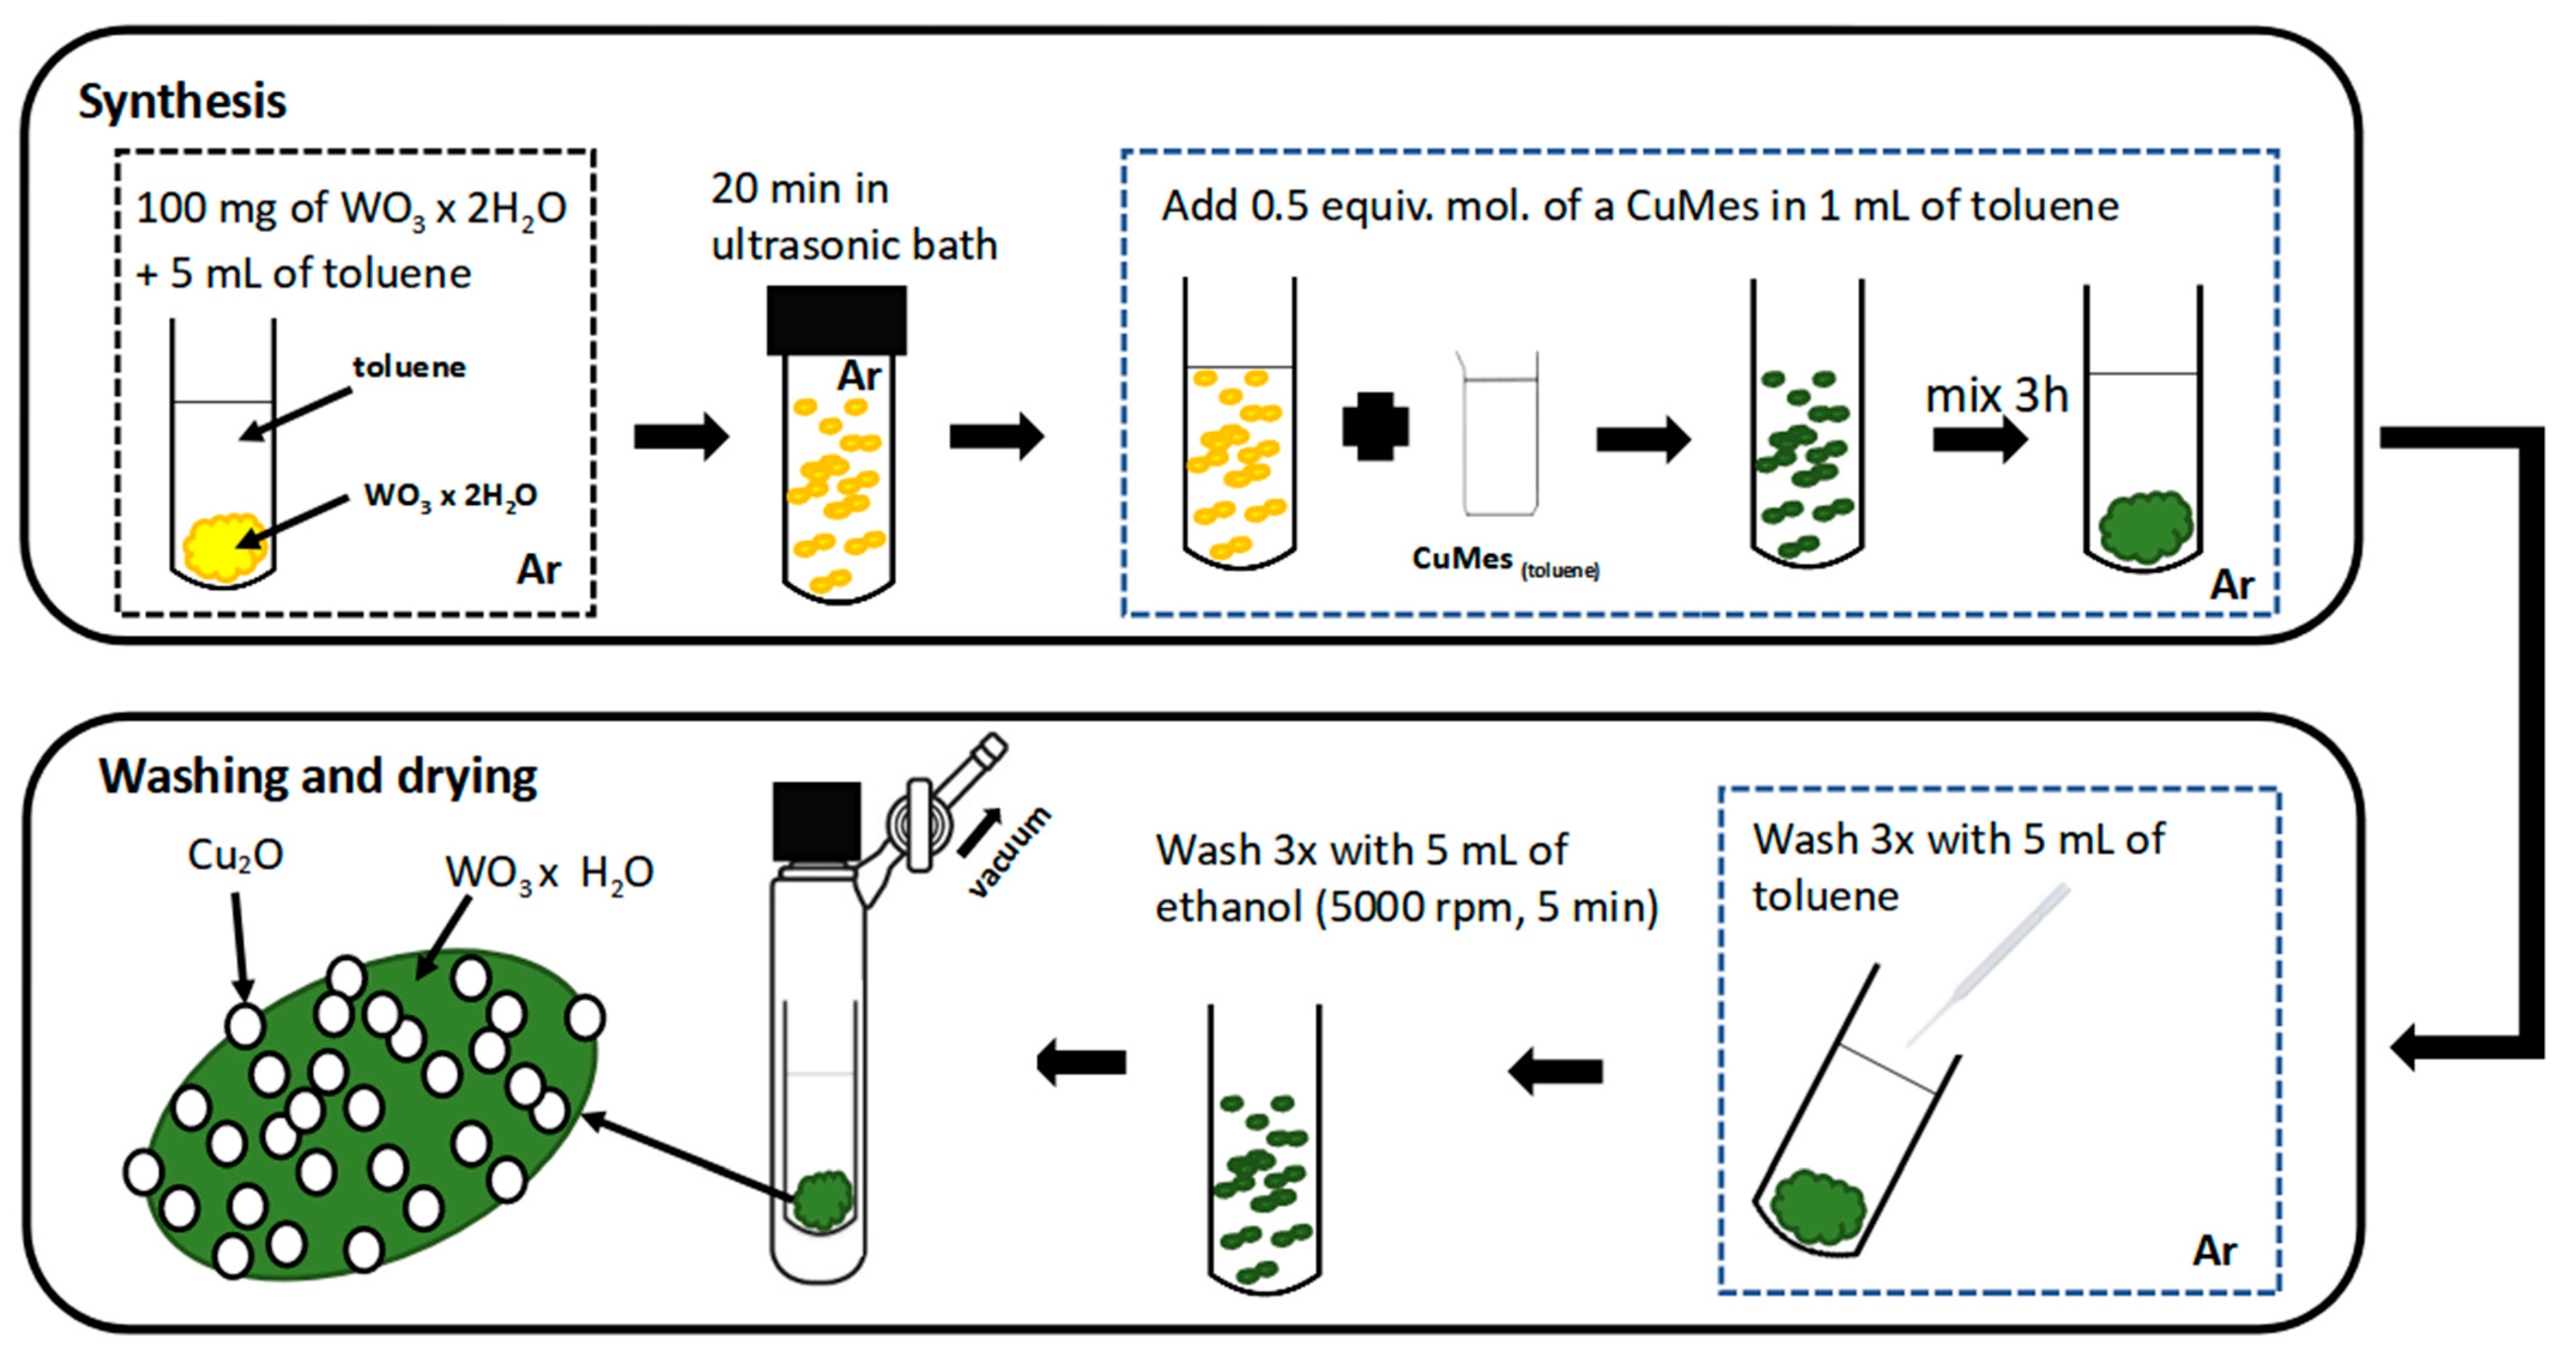
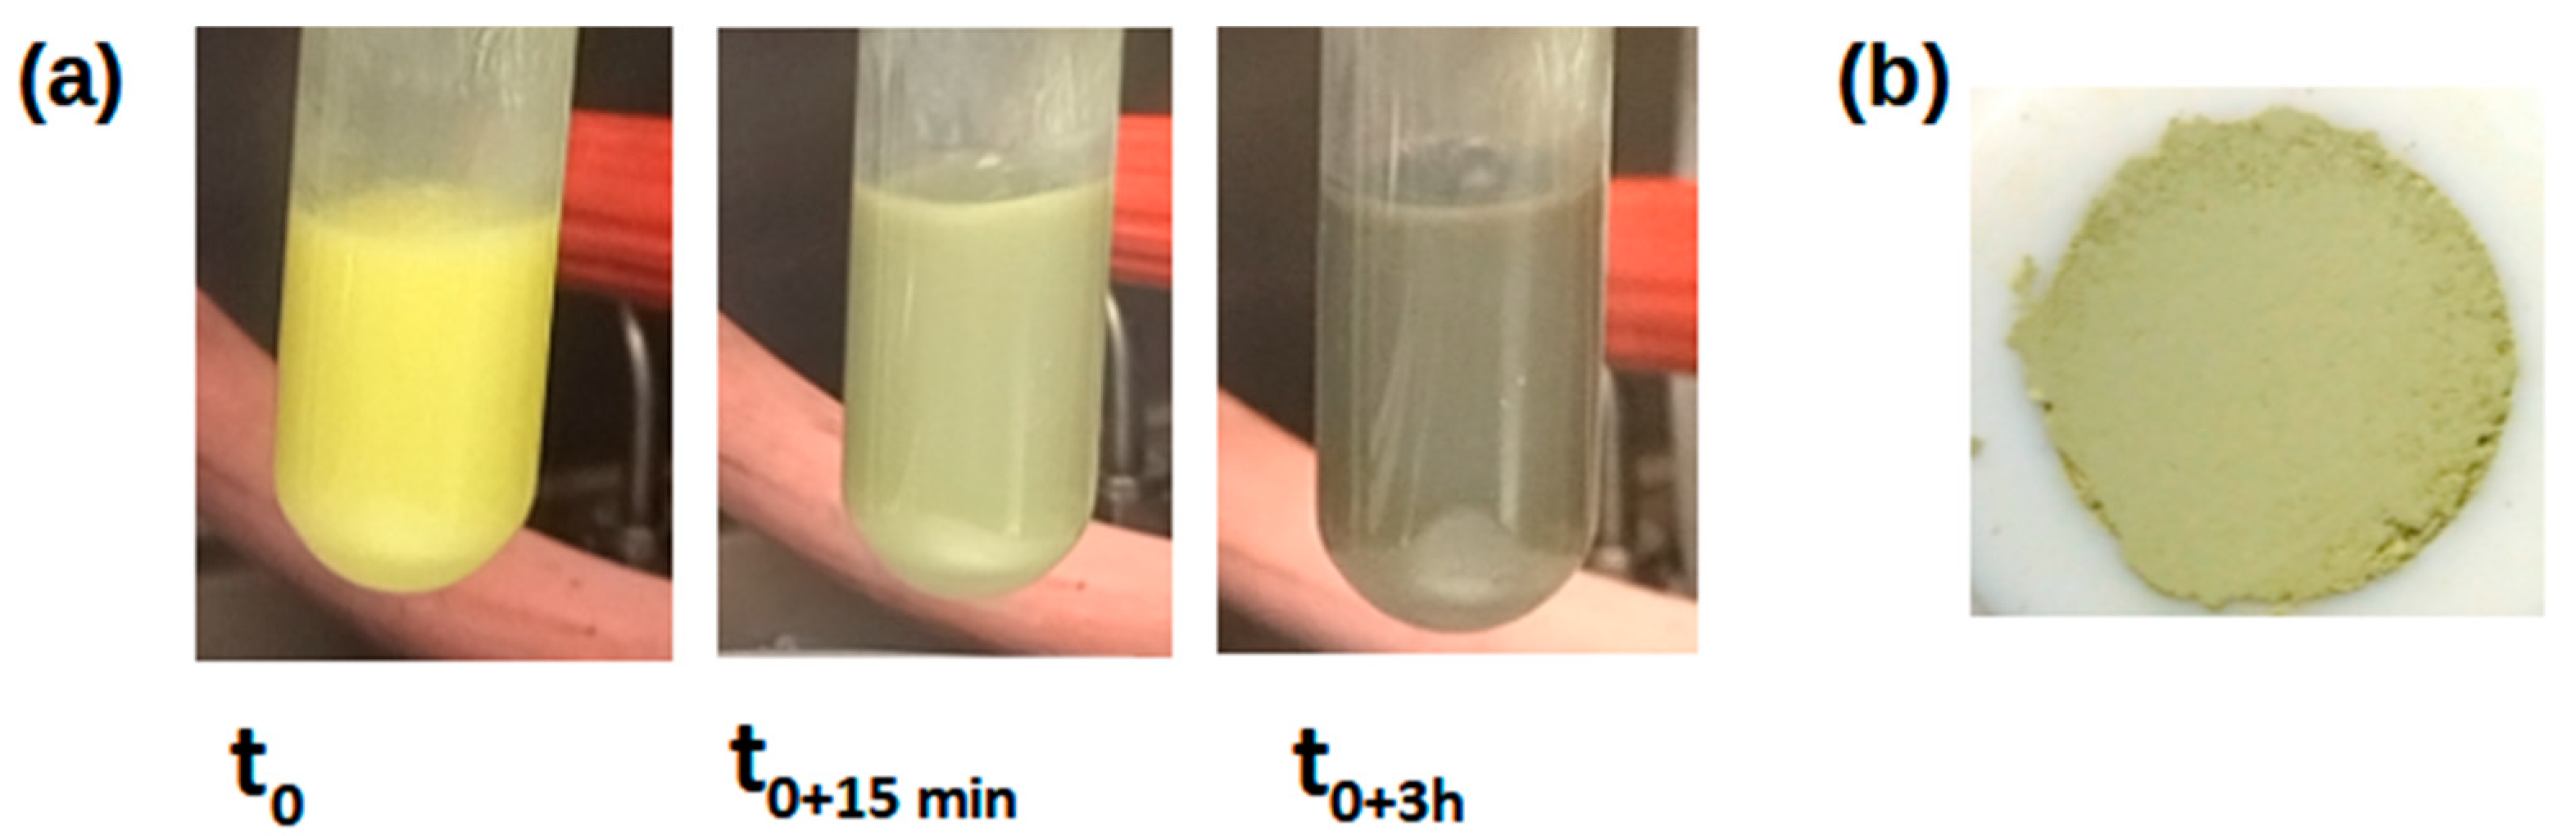
2.1.2. Preparation of the Cu2O@WO3·H2O Nanocomposite
2.1.3. Preparation of the Cu2O nanoparticles
2.2. Calcination of the As-Prepared Cu2O@WO3·H2O Nanomaterials
2.3. Characterization Methods
2.4. Gas Sensors Preparation
- -
- Amounts of 50 mg of the WO3·2H2O NLs were mixed with 35 μL of ESL 401 (Electro-Science Laboratories) binder (provided by the Laplace Laboratory (Toulouse, France)).
- -
- Amounts of 50 mg of the Cu2O@WO3·H2O NCs were mixed with 55 μL of ESL 401 binder.
- -
- Amounts of 25 mg of the Cu2O NPs were mixed with 25 μL of the Milli-Q water and 15 μL of ESL 401 binder.
2.5. Gas Test Set-Up
3. Results and Discussion
3.1. Morphology and Chemical Composition
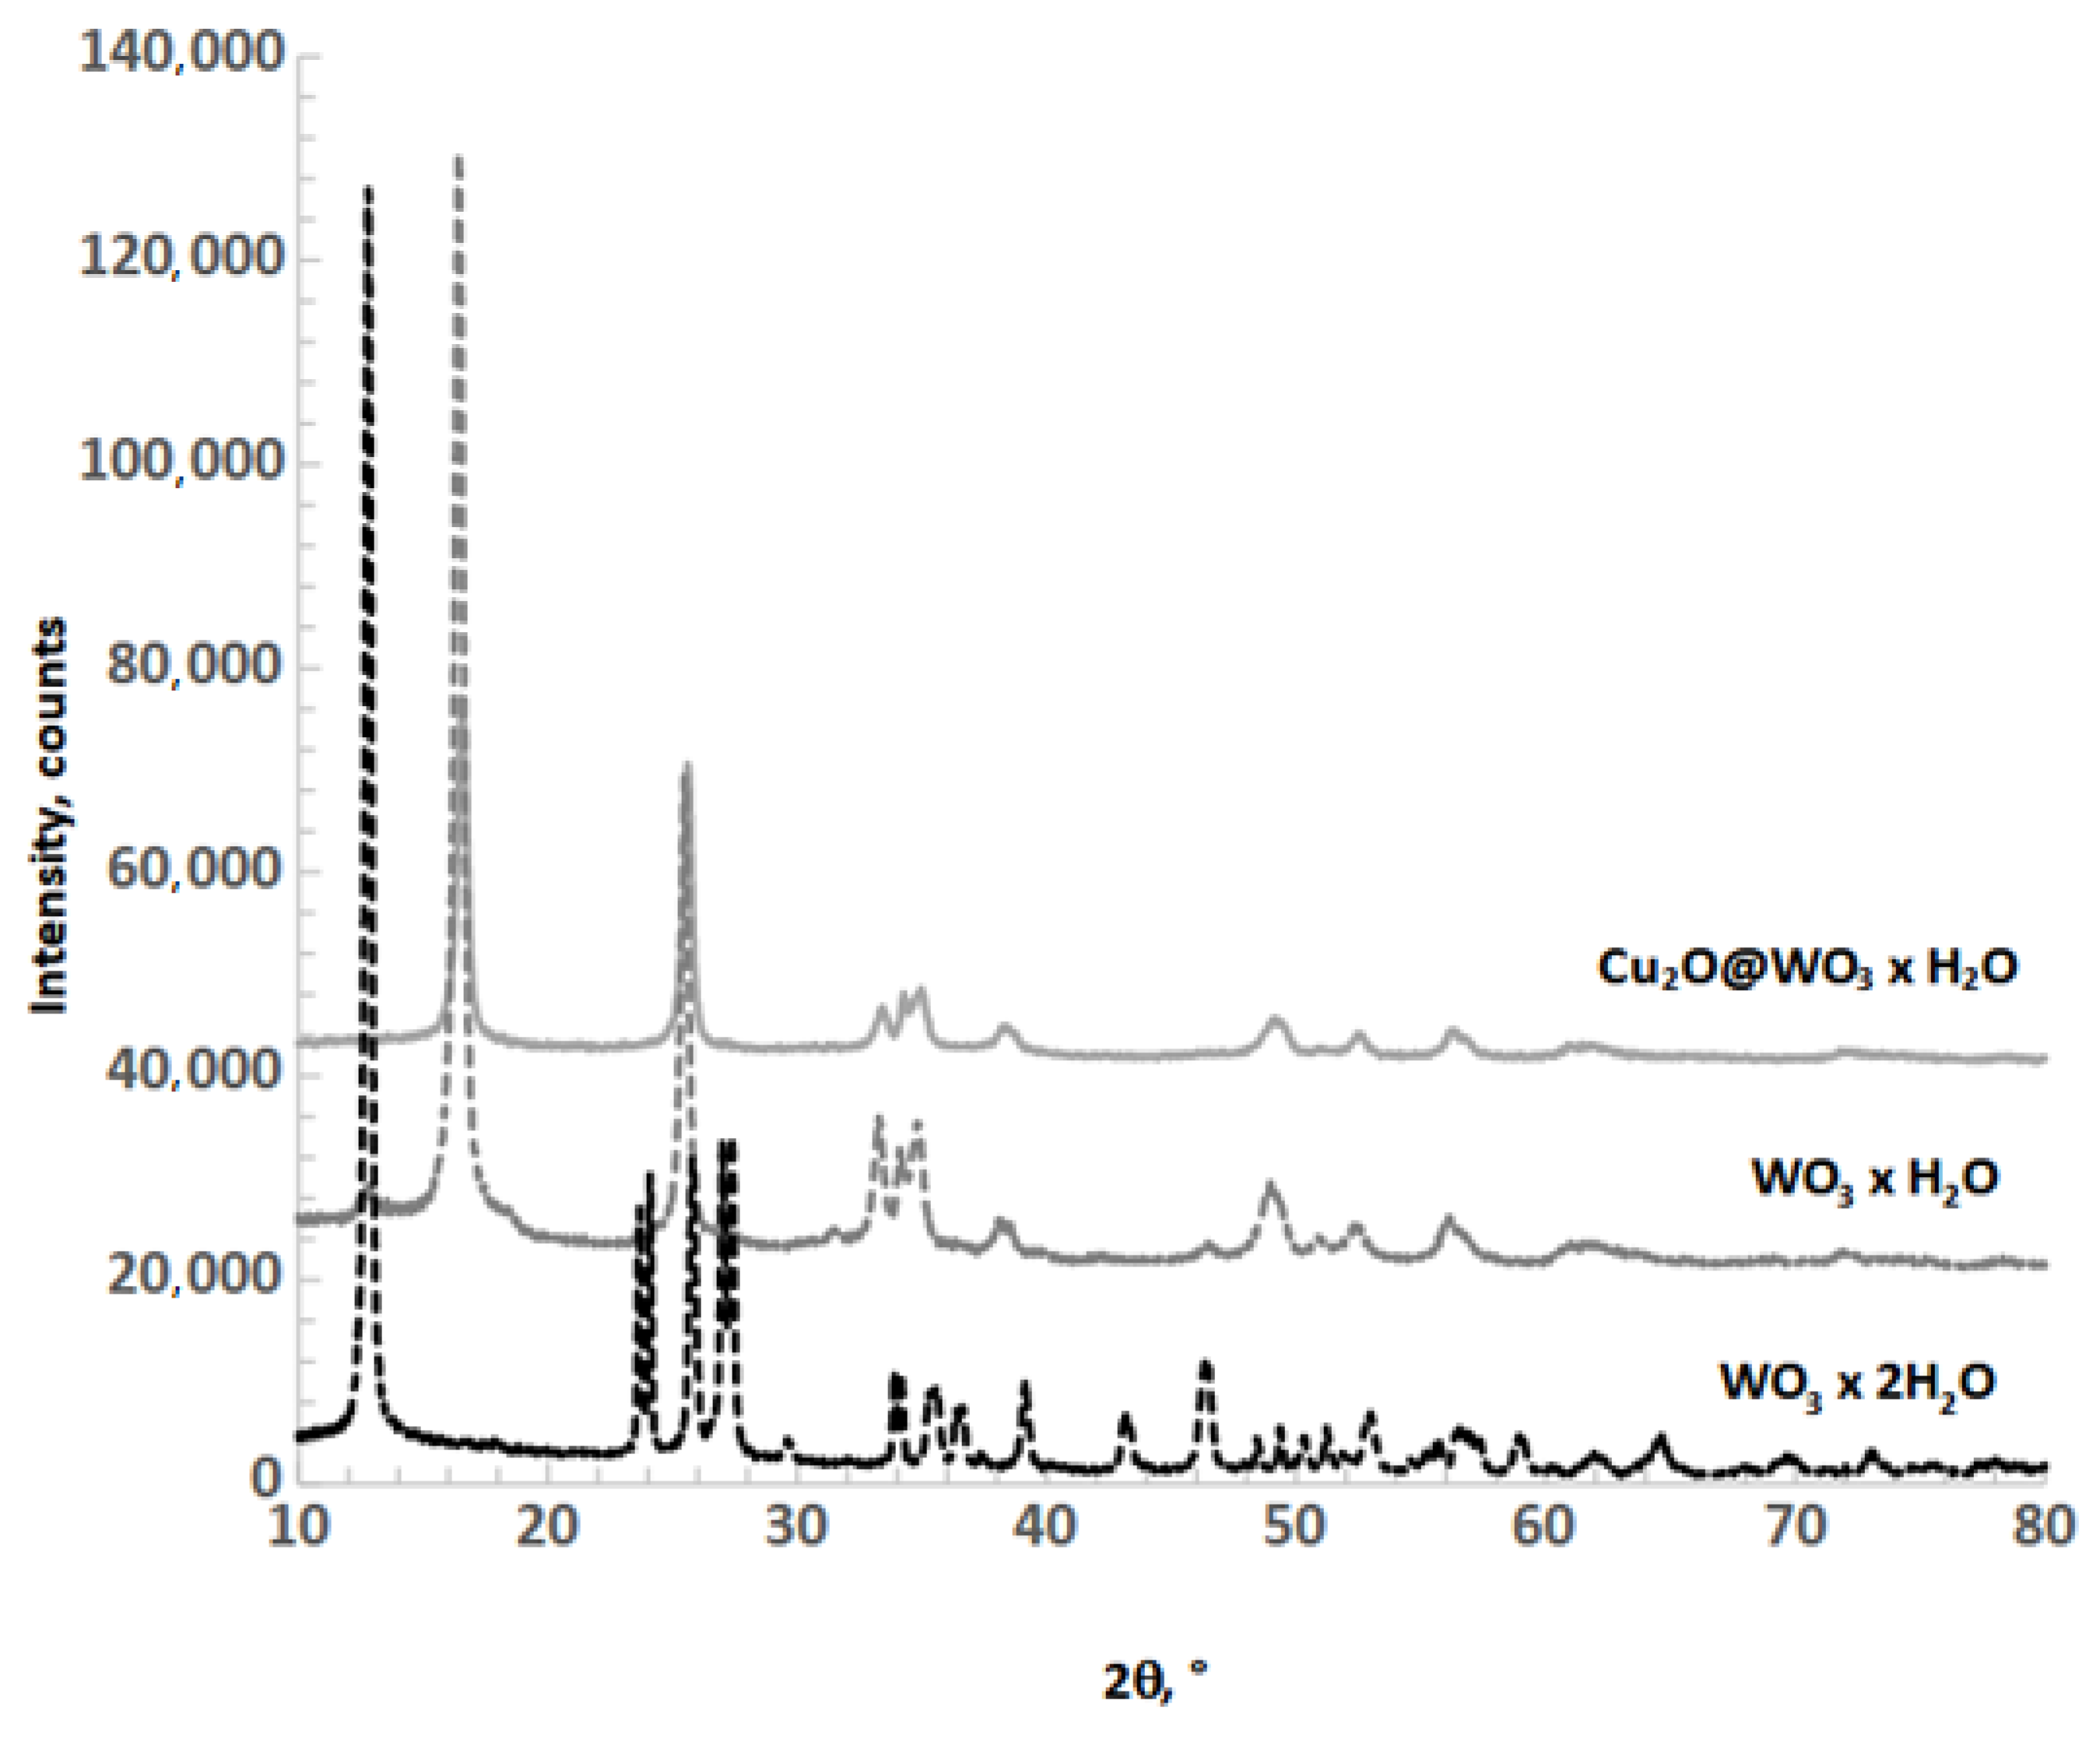
3.1.1. WO3·2H2O NLs
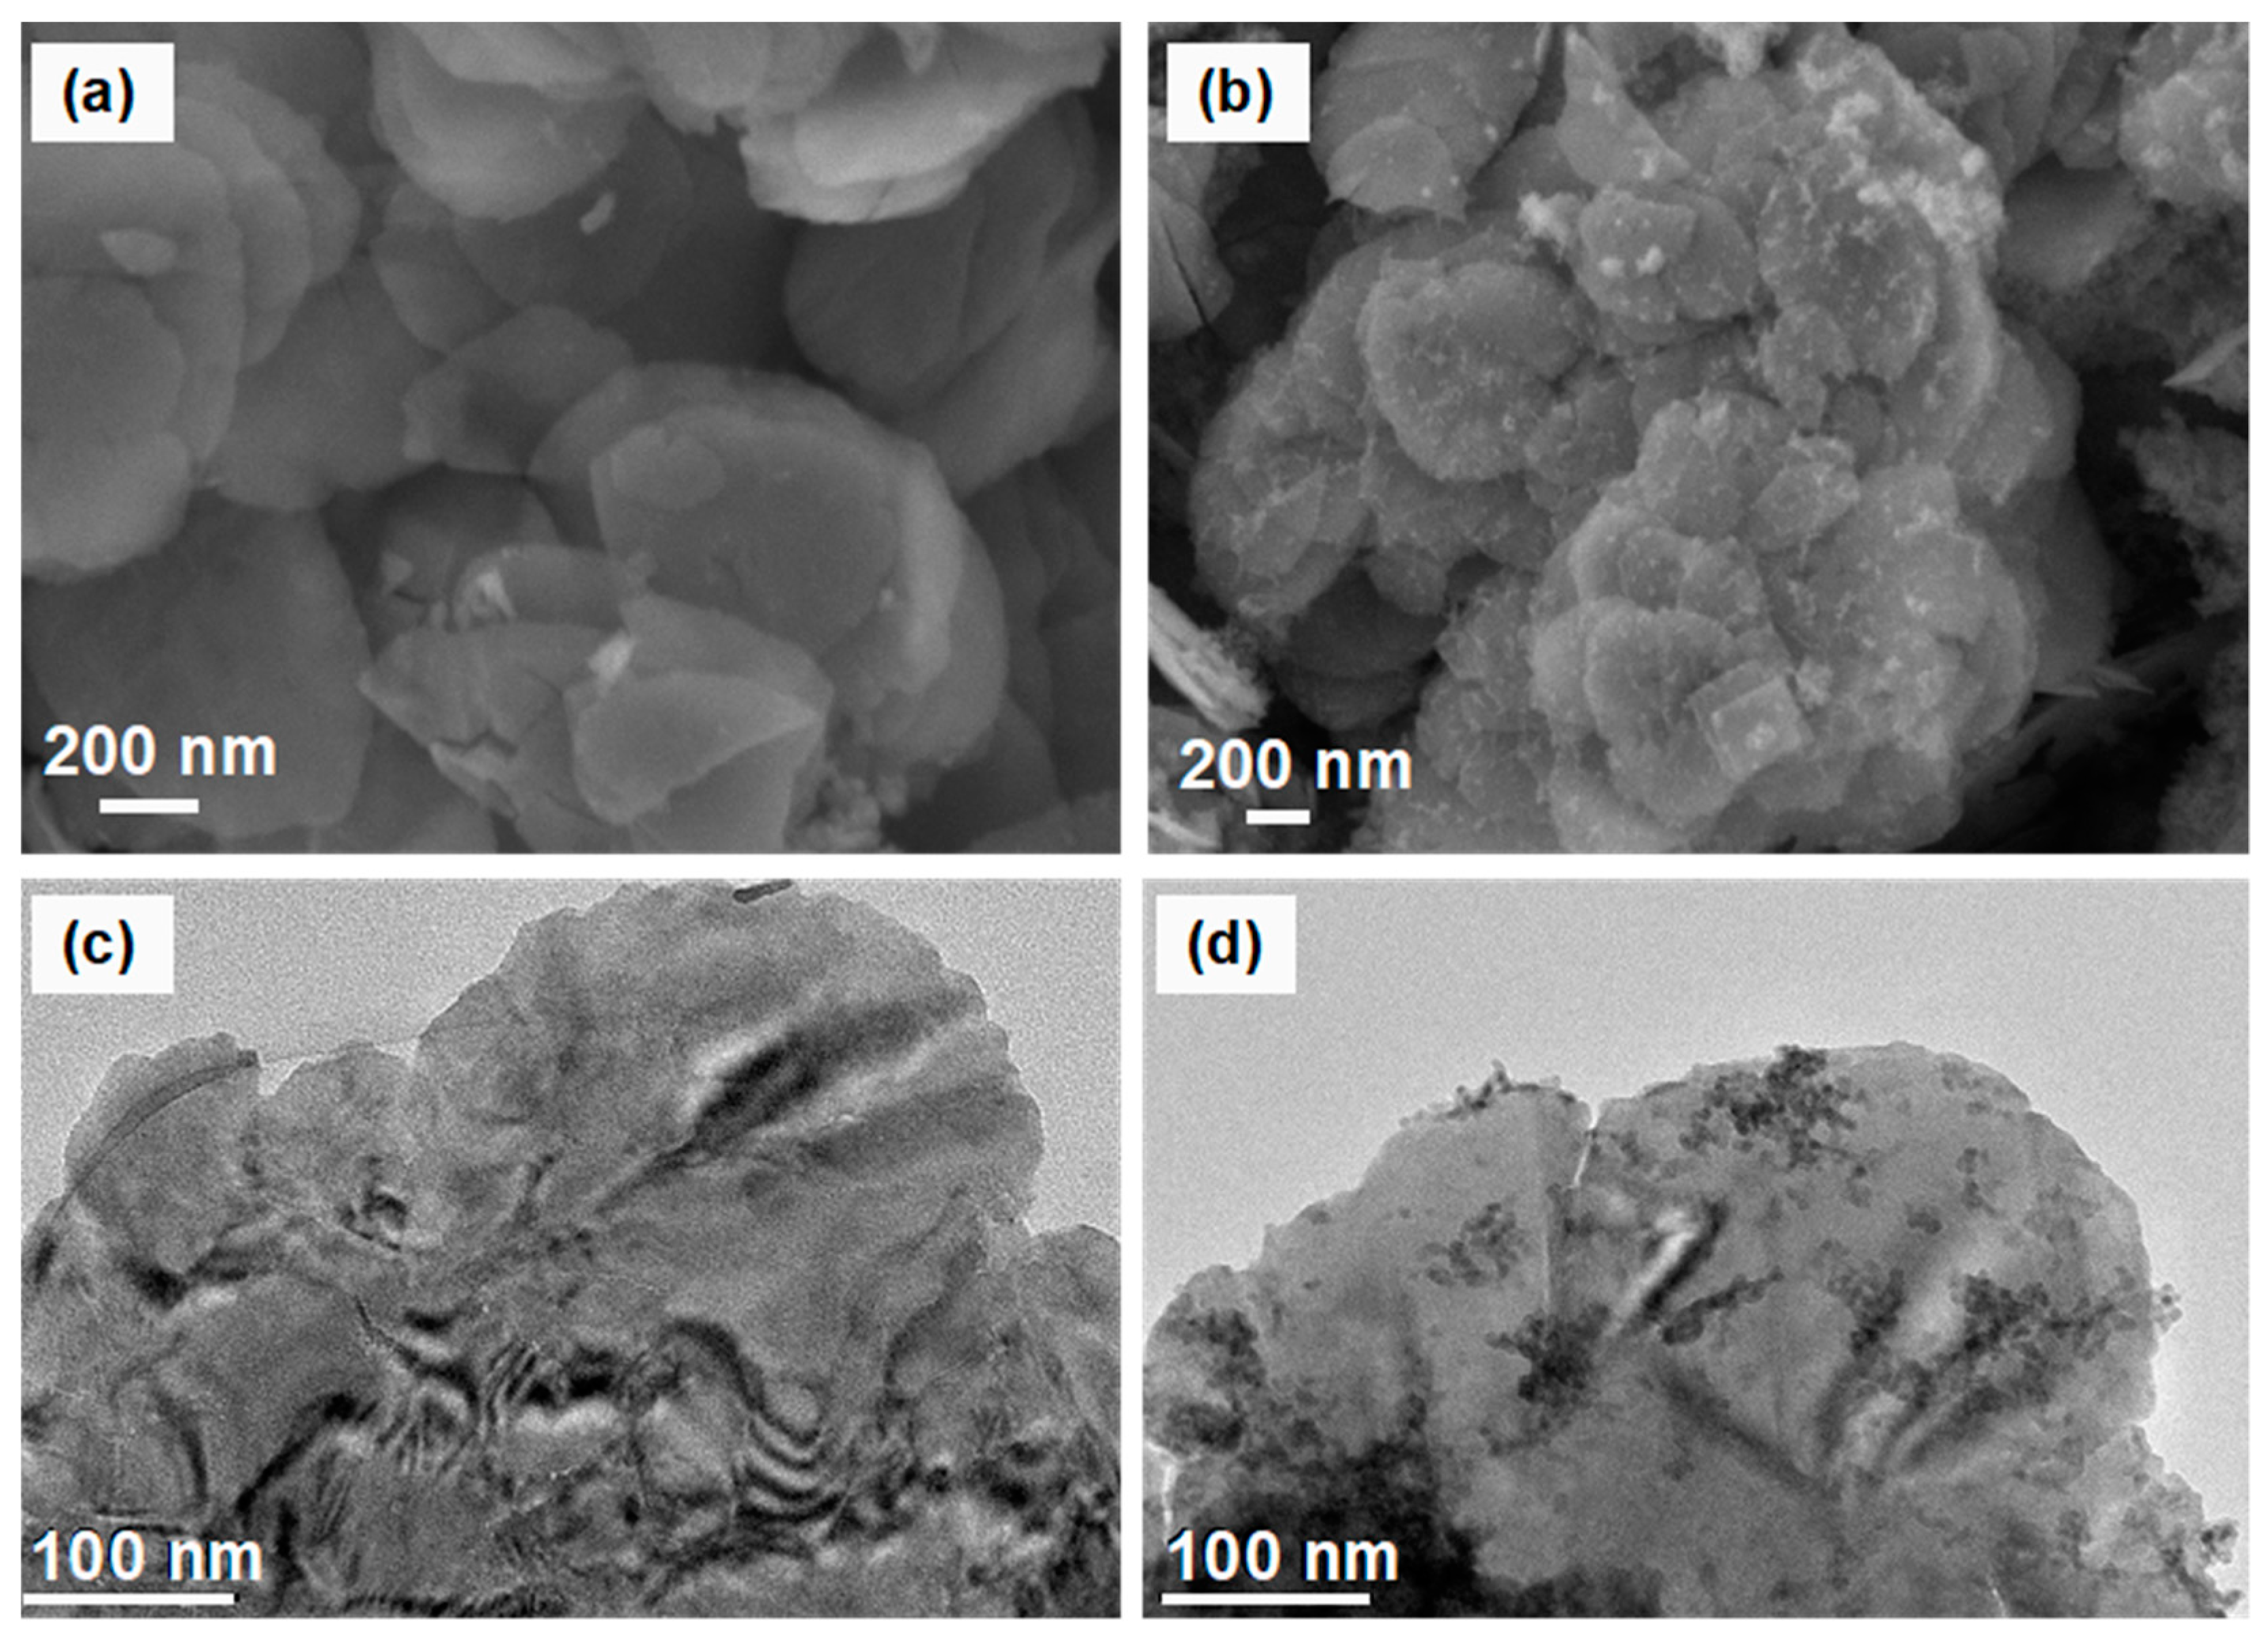
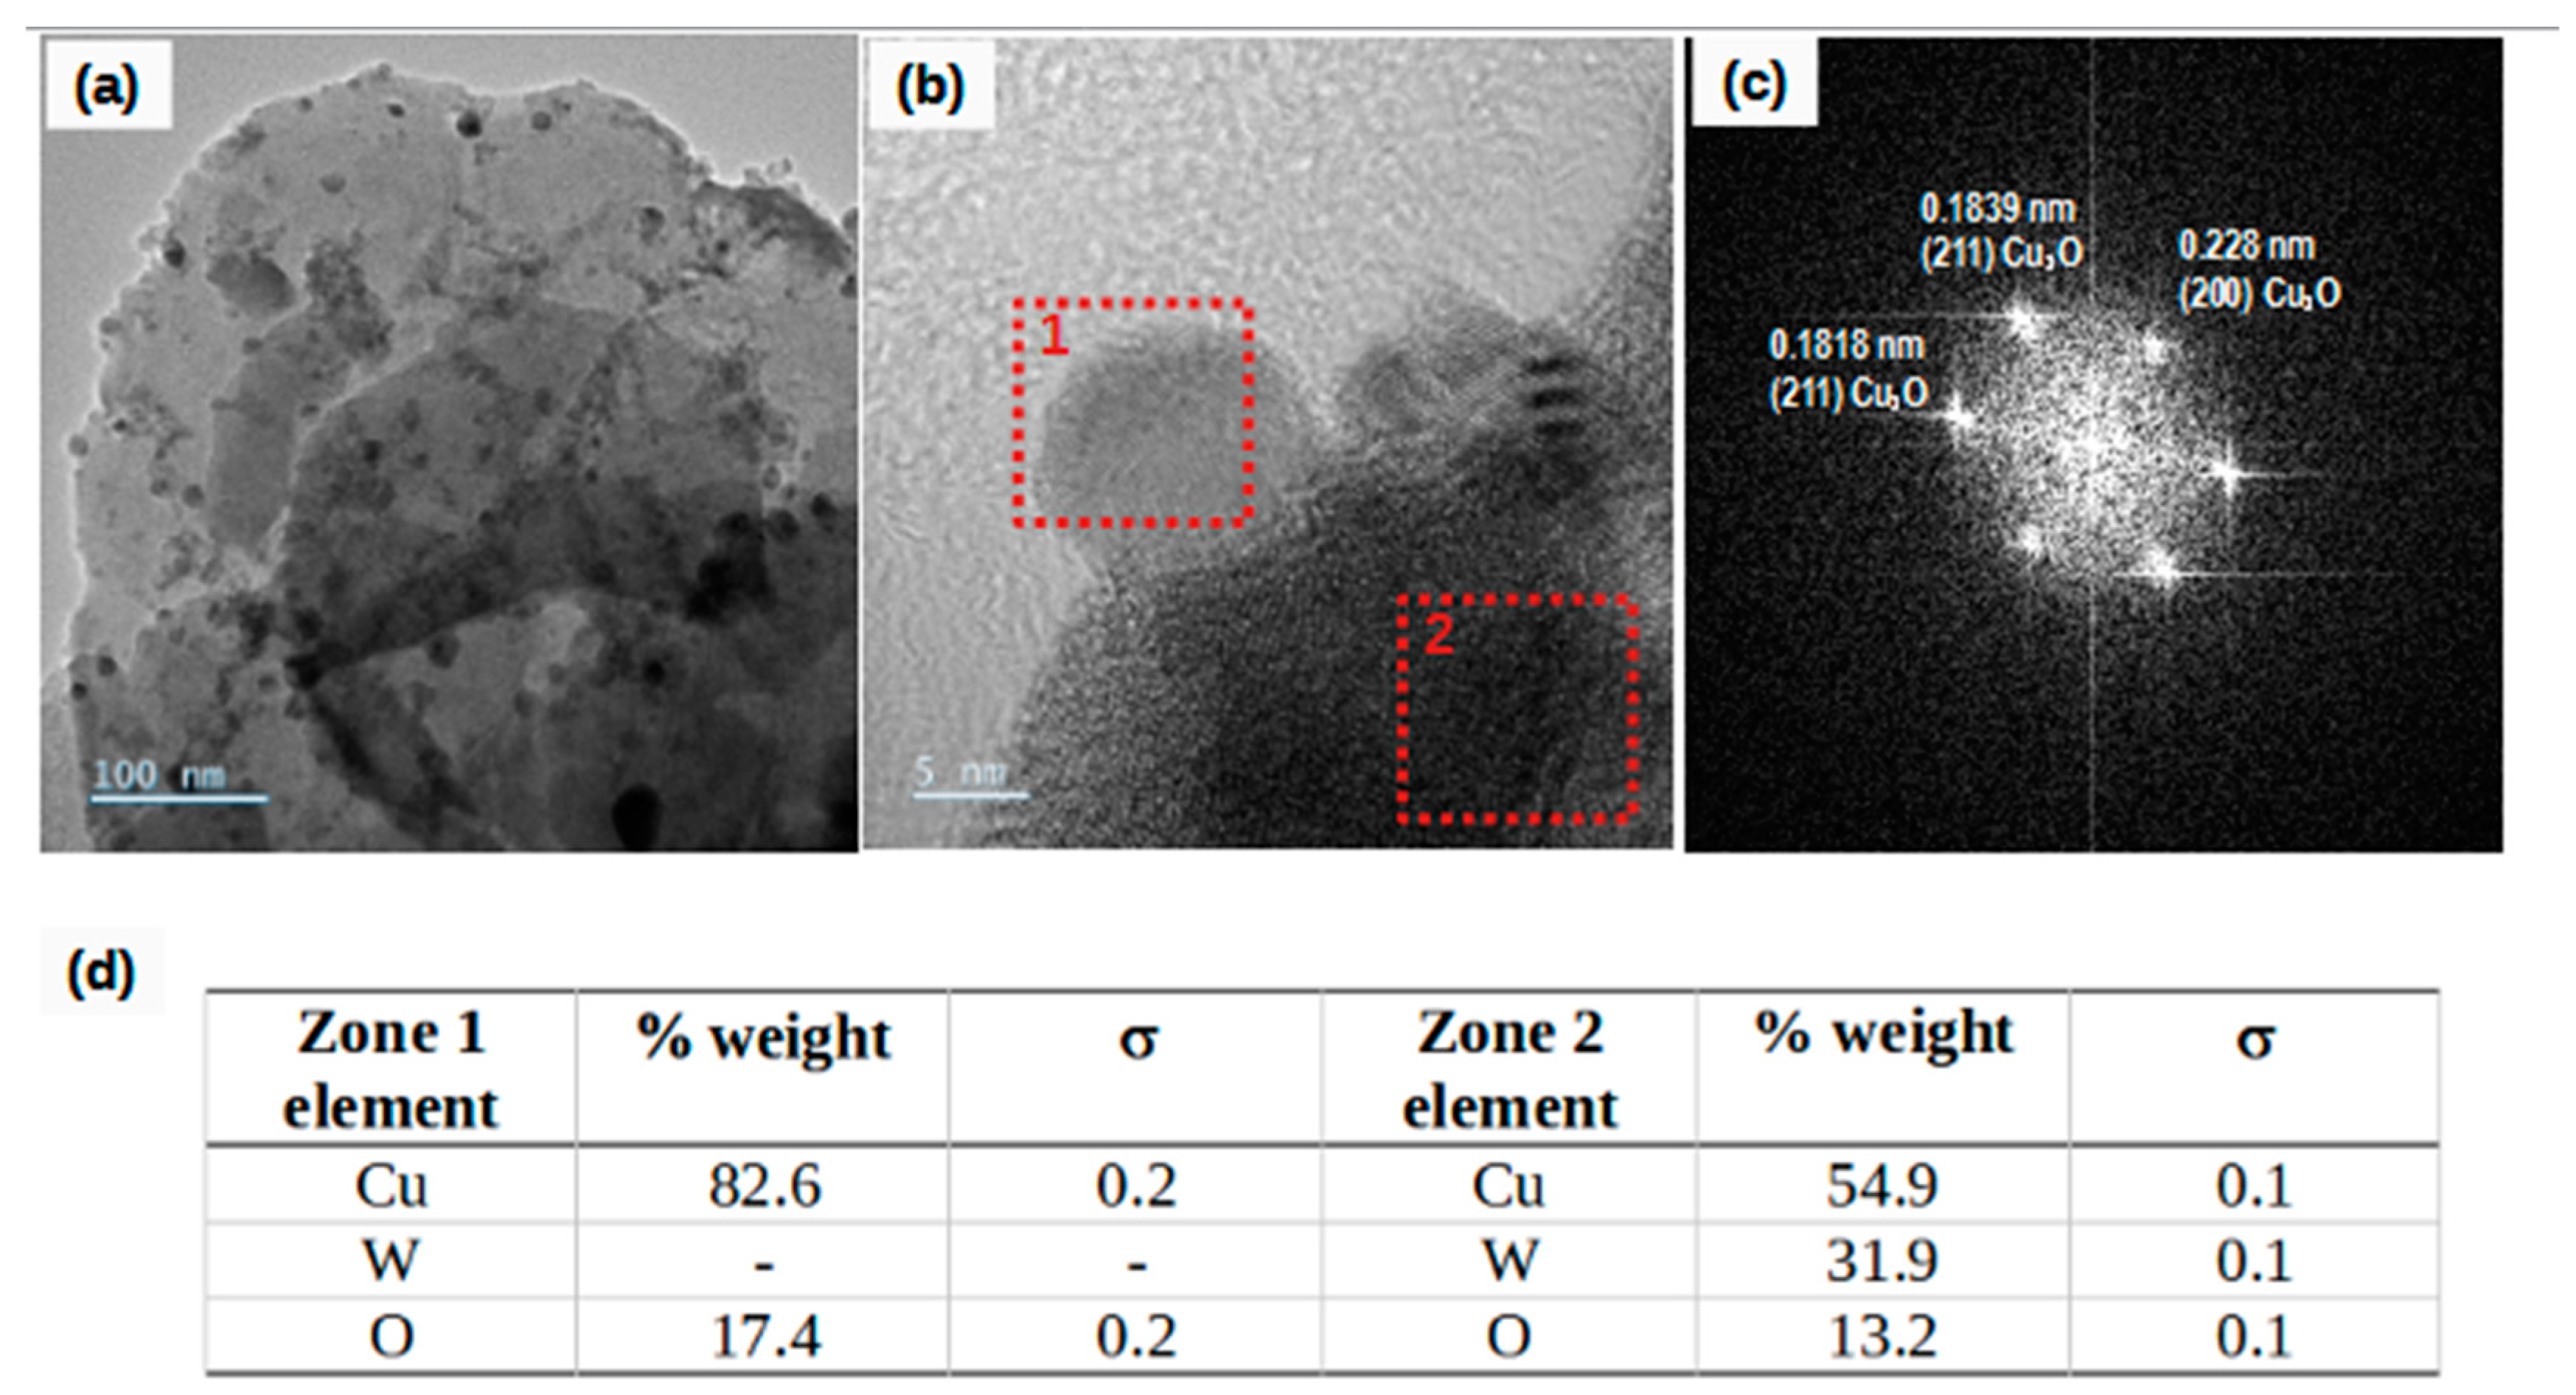
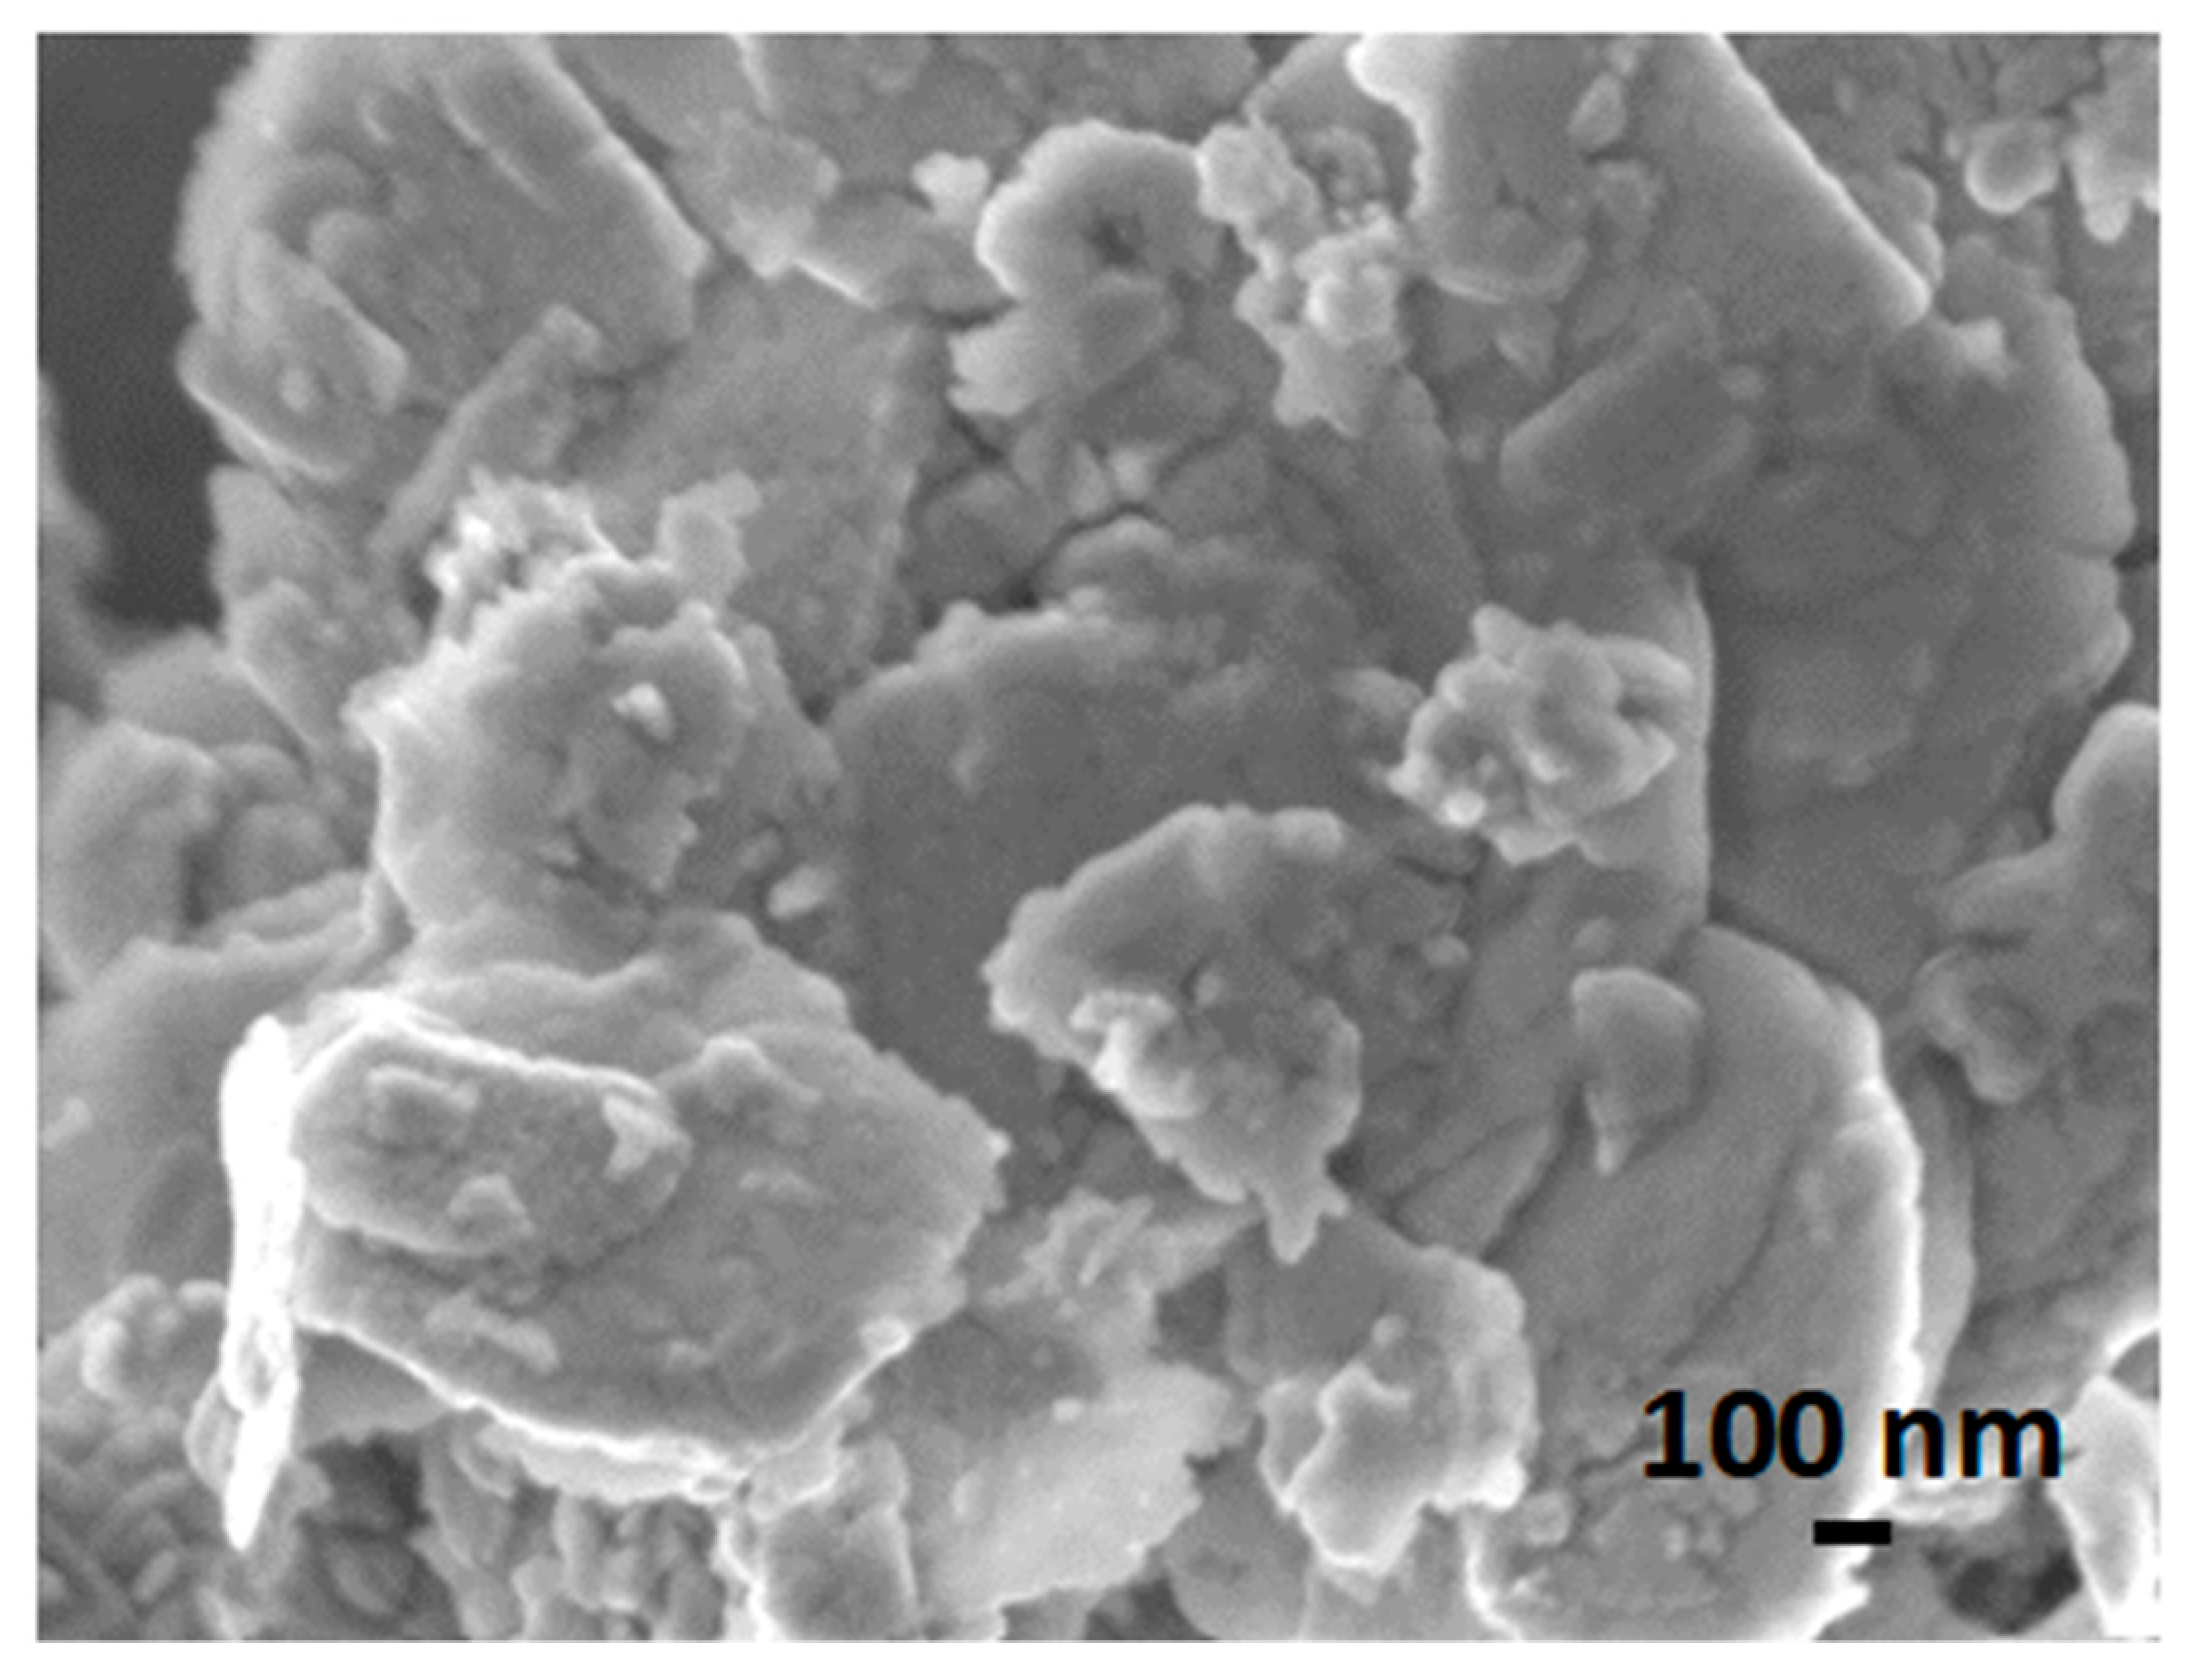
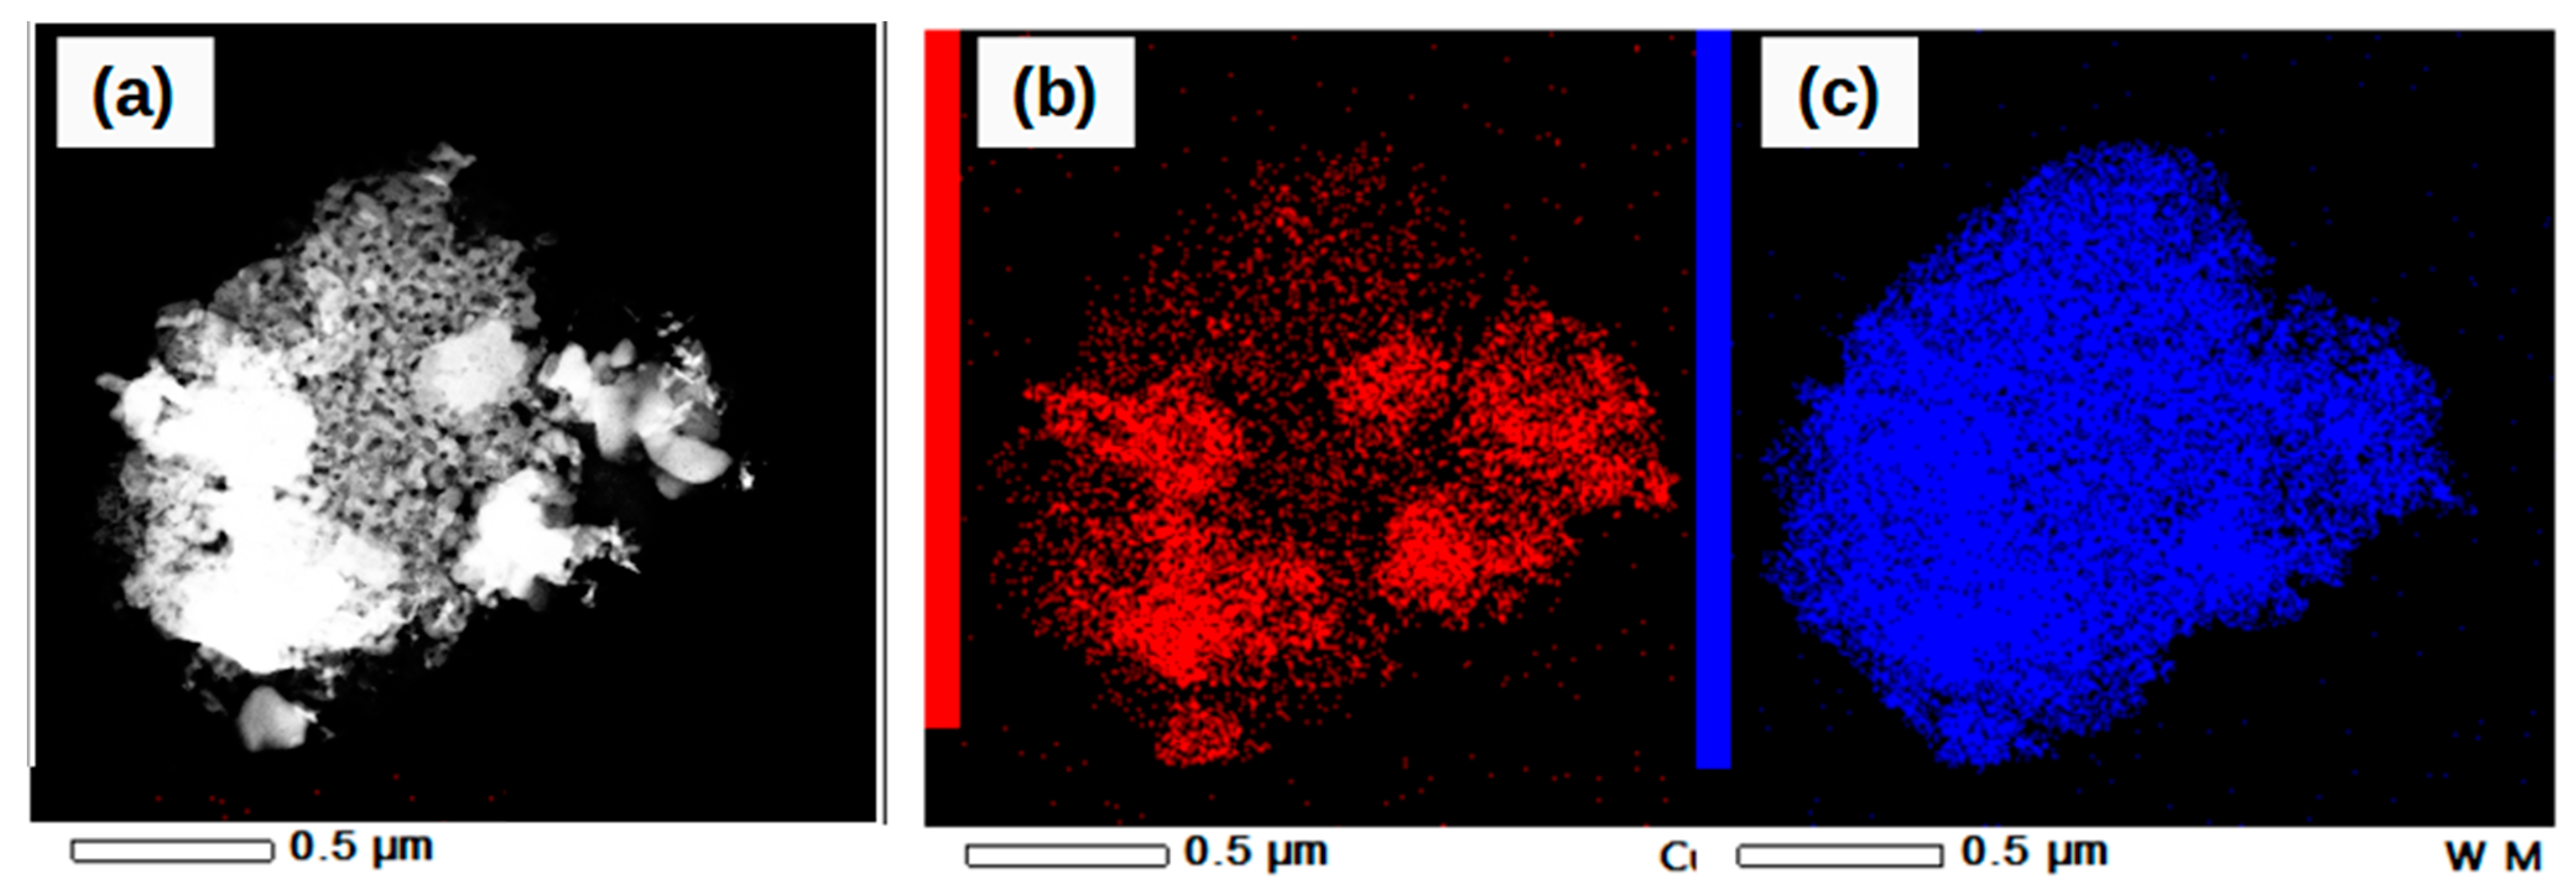
3.1.2. Cu2O@WO3·H2O Nanocomposites (NCs)
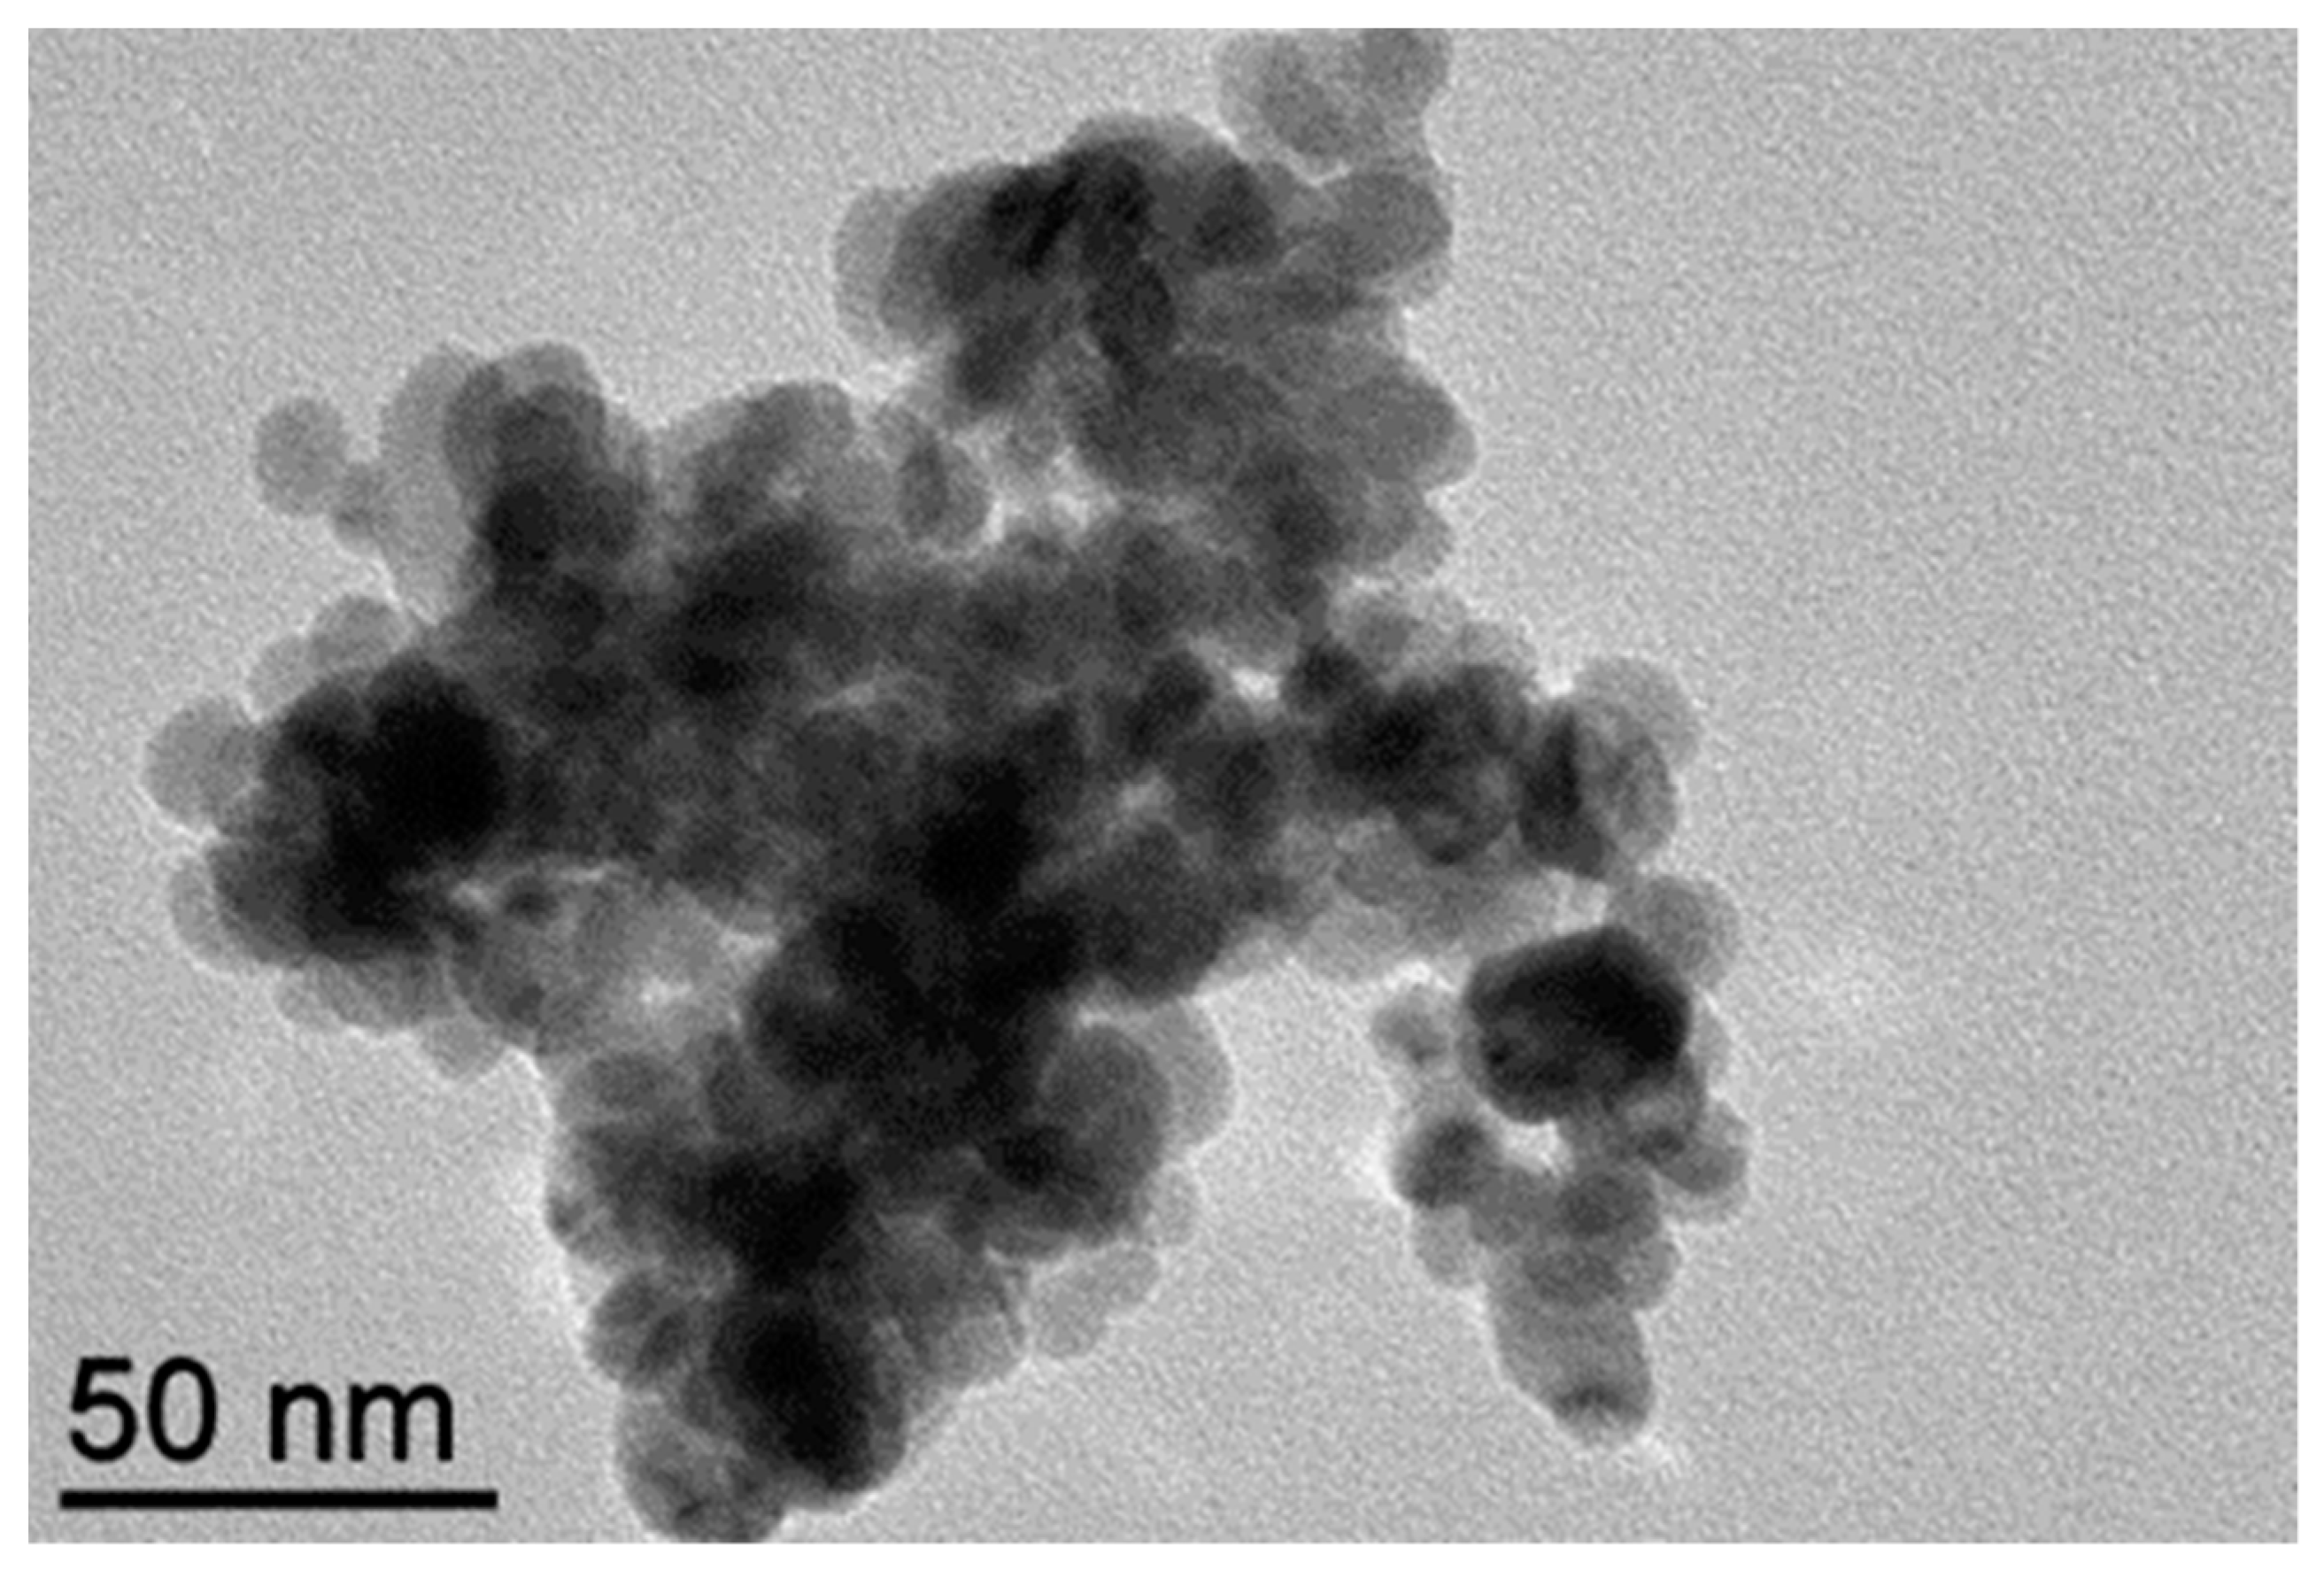
3.1.3. Cu2O NPs
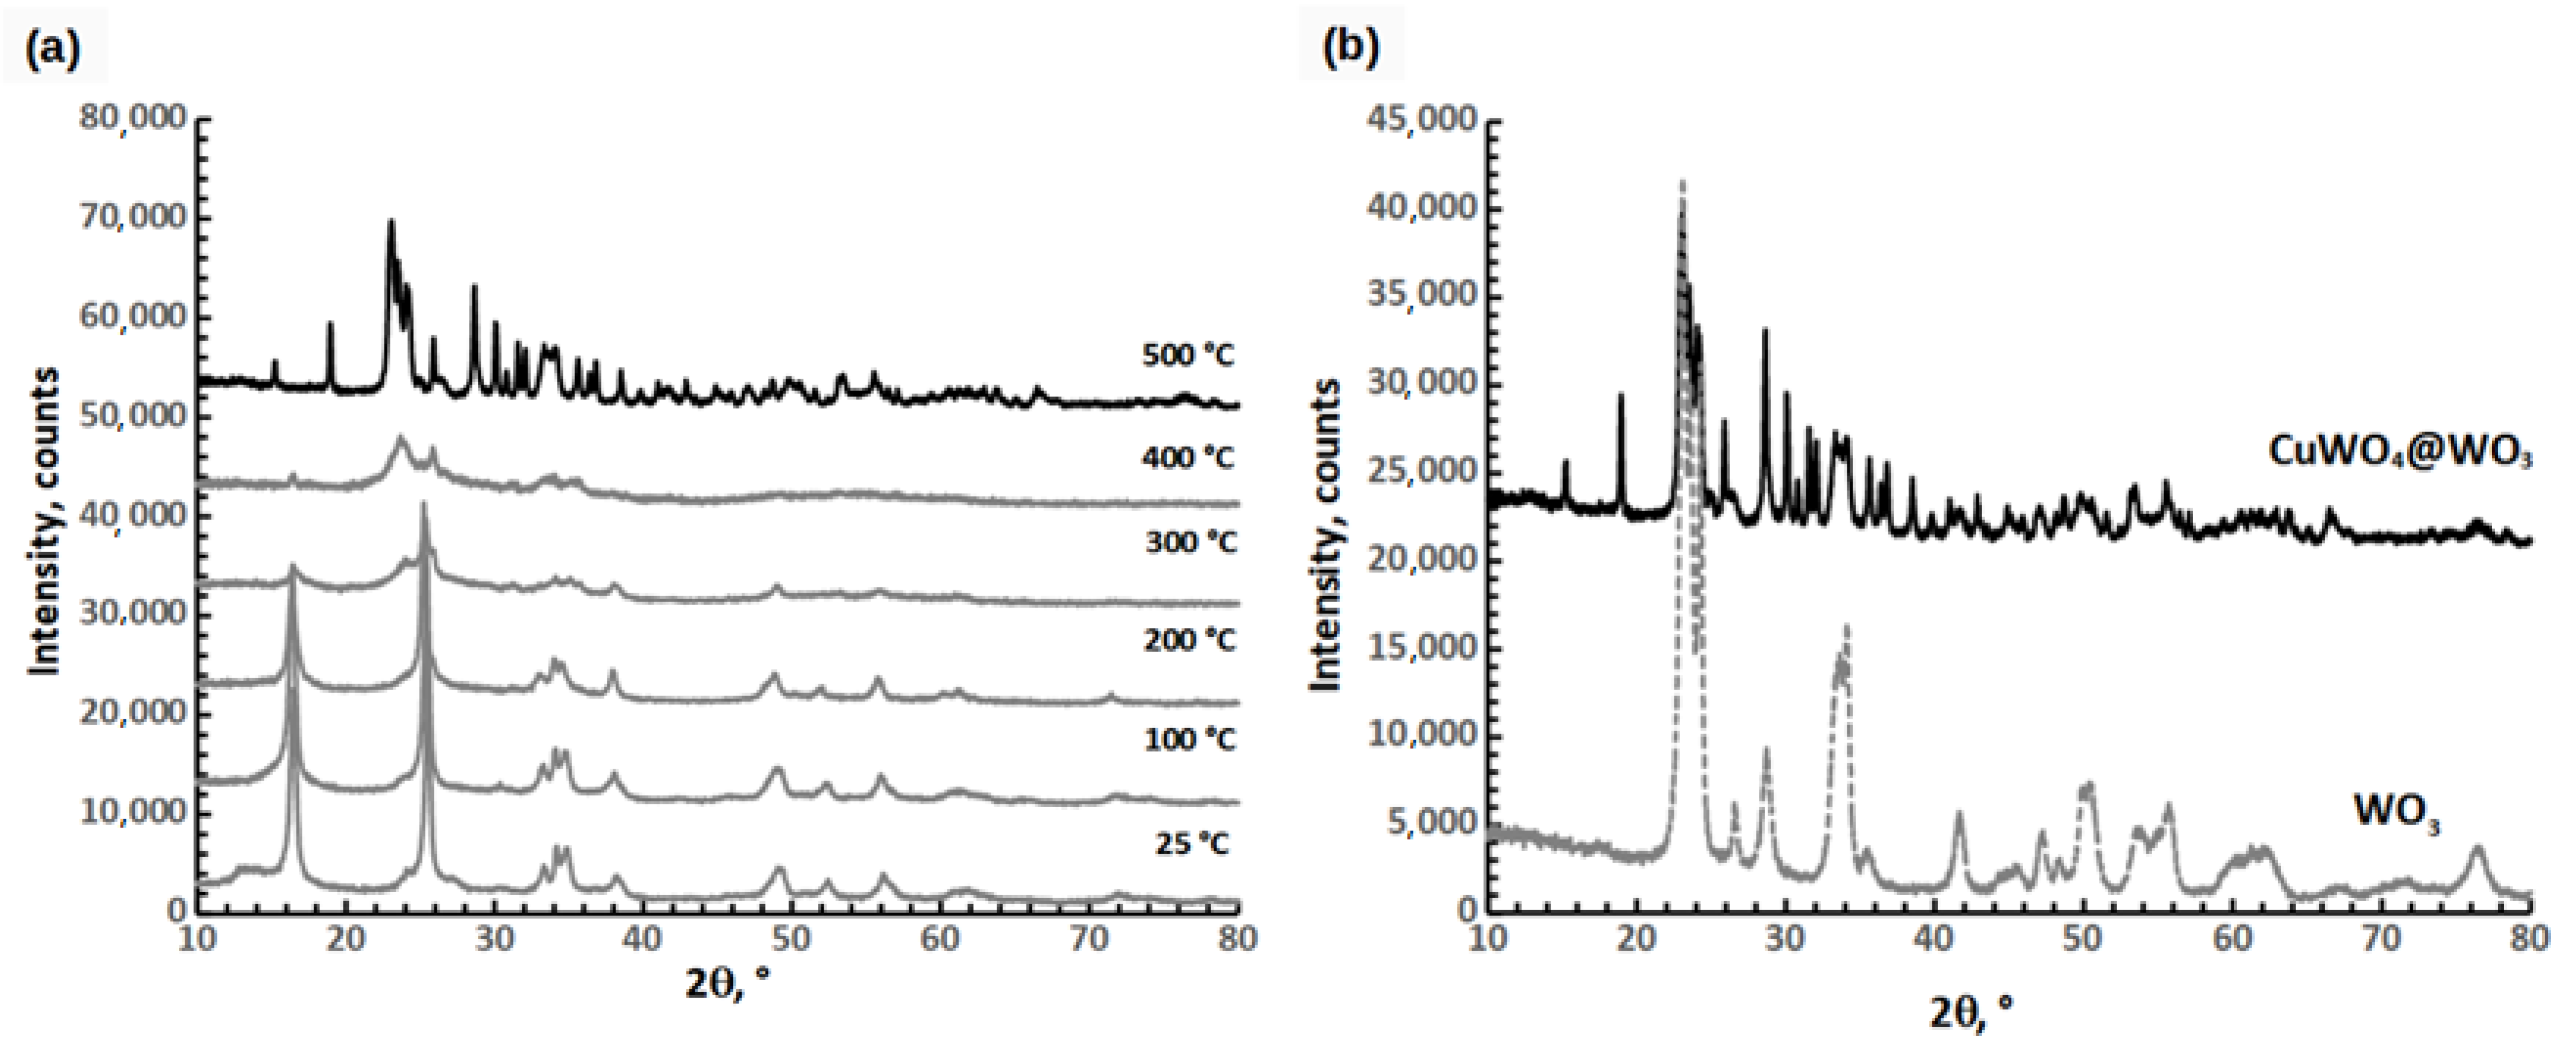
3.2. Transformation of the Cu2O@WO3·H2O NCs into CuWO4@WO3 NCs
3.3. Evaluation of the Gas Sensing Properties of NLs, NCs, and NPs
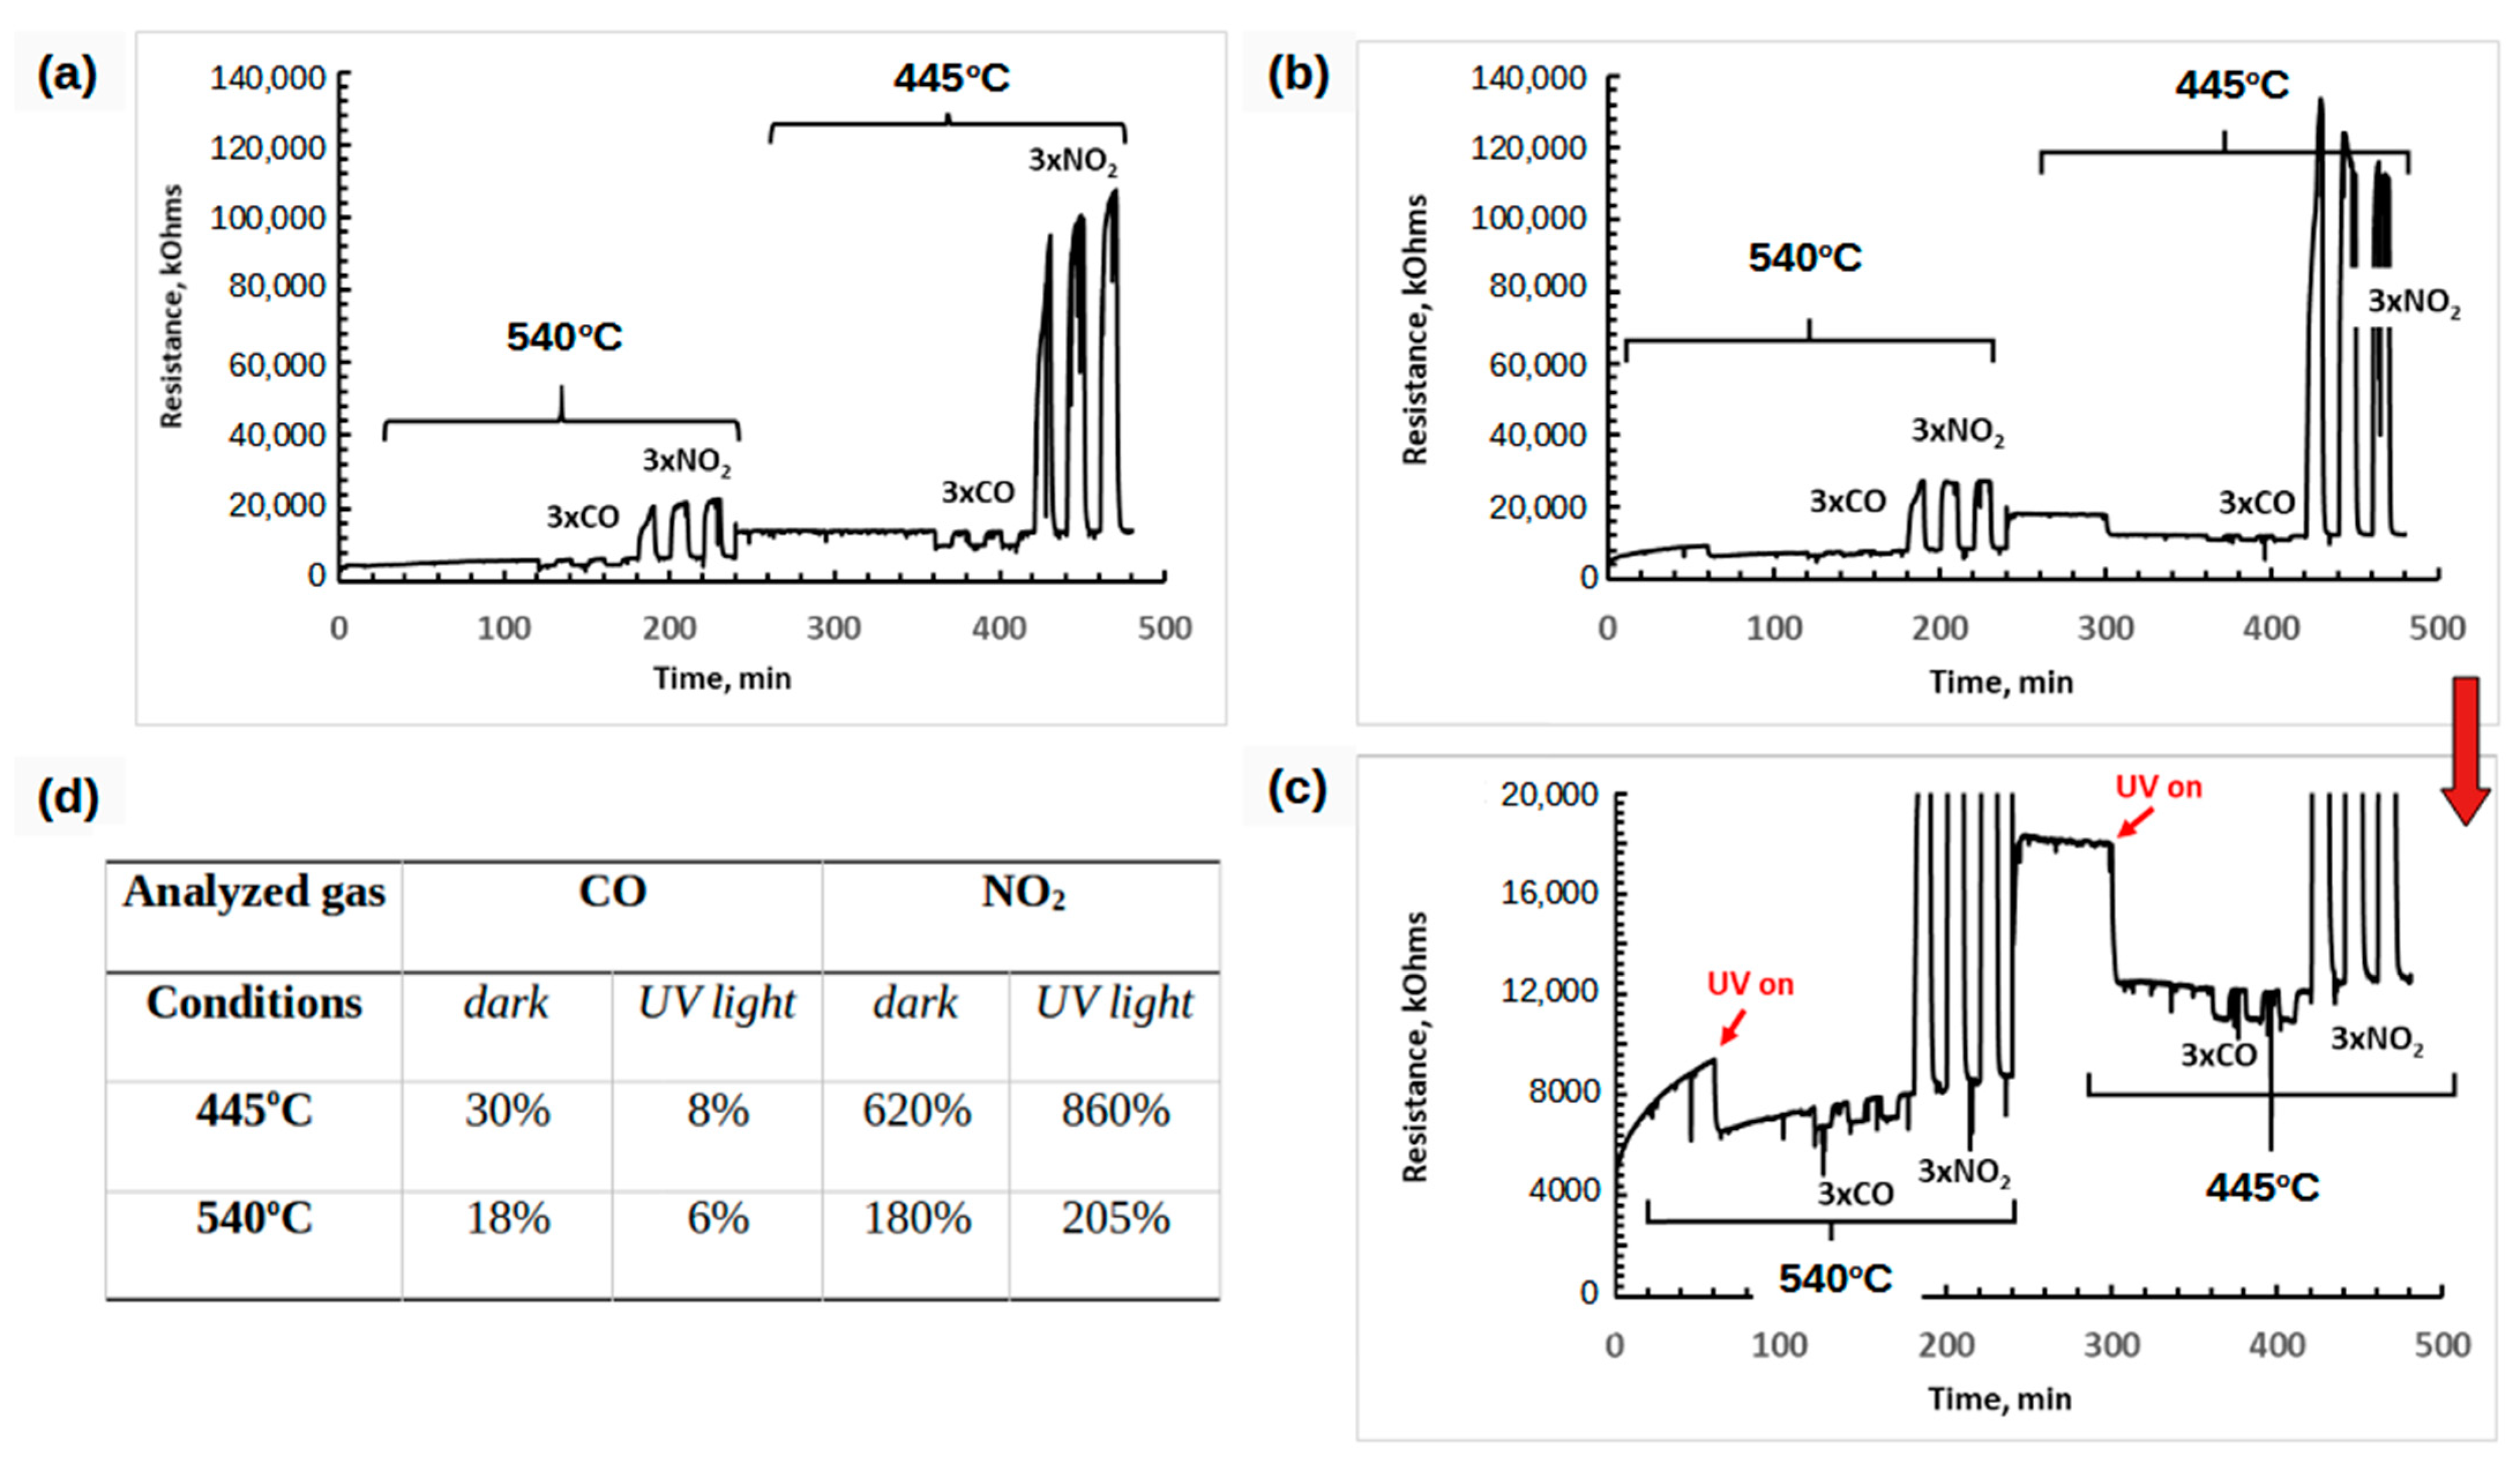
3.4. Gas Sensing Responses of CuWO4@WO3 NCs under UV Light Irradiation
3.5. The Proposed Gas Sensing Mechanism of CuWO4@WO3 NCs Sensor
3.6. The Proposed Gas Sensing Mechanism of UV Irradiated CuWO4@WO3 NCs Sensor
4. Conclusions and Future Work
- (1)
- The adaptation of an earlier described procedure [19] allowed for the preparation of the new Cu2O@WO3·H2O nanocomposite. This proposed protocol can be used as a versatile method for the preparation of metal oxide nanocomposites by in situ hydrolysis of metal–organic precursors on the WO3·2H2O nanoleaves.
- (2)
- The thermal treatment of the prepared nanocomposite onto the gas sensing device led to the formation of the CuWO4 mixed oxide grafted on the WO3 support (CuWO4@WO3).
- (3)
- The CuWO4@WO3 nanocomposite exhibits intermediate gas sensing properties compared to the CuO and WO3 sensors. However, at higher temperatures (i.e., 445 °C), the nanocomposite sensor is more sensitive to CO and NO2 than other tested sensors. This was explained by the formation of the n-n heterojunction between the CuWO4 and WO3.
- (4)
- Upon UV light irradiation of the CuWO4@WO3 nanocomposite the resistance of the sensor in air decreases but its sensitivity towards CO gas is worsened. At the same time, the sensitivity and selectivity towards NO2 increased which was associated with the photo-generation of electrons within the nanocomposite. Therefore, the CuWO4@WO3 sensitive layer can be used as a dual gas sensor.
- (5)
- At lower operating temperatures, the CuO and WO3 (at an operating temperature of 390 °C) layers can also serve as efficient gas-sensitive layers for the selective detection of CO and NO2, respectively.
Author Contributions
Funding
Institutional Review Board Statement
Informed Consent Statement
Data Availability Statement
Conflicts of Interest
References
- Manisalidis, I.; Stavropoulou, E.; Stavropoulos, A.; Bezirtzoglou, E. Environmental and Health Impacts of Air Pollution: A Review. Front. Public Health 2020, 8, 14. [Google Scholar] [CrossRef]
- McMichael, A.J.; Lindgren, E. Climate change: Present and future risks to health, and necessary responses. J. Intern. Med. 2011, 270, 401–413. [Google Scholar] [CrossRef] [PubMed]
- Szczurek, A.; Gonstał, D.; Maciejewska, M. The Gas Sensing Drone with the Lowered and Lifted Measurement Platform. Sensors 2023, 23, 1253. [Google Scholar] [CrossRef] [PubMed]
- Kaliszewski, M.; Włodarski, M.; Młyńczak, J.; Jankiewicz, B.; Auer, L.; Bartosewicz, B.; Liszewska, M.; Budner, B.; Szala, M.; Schneider, B.; et al. The Multi-Gas Sensor for Remote UAV and UGV Missions—Development and Tests. Sensors 2021, 21, 7608. [Google Scholar] [CrossRef] [PubMed]
- Szulczyński, B.; Gębicki, J. Currently Commercially Available Chemical Sensors Employed for Detection of Volatile Organic Compounds in Outdoor and Indoor Air. Environments 2017, 4, 21. [Google Scholar] [CrossRef]
- Szulczyński, B.; Wasilewski, T.; Wojnowski, W.; Majchrzak, T.; Dymerski, T.; Namieśnik, J.; Gębicki, J. Different Ways to Apply a Measurement Instrument of E-Nose Type to Evaluate Ambient Air Quality with Respect to Odour Nuisance in a Vicinity of Municipal Processing Plants. Sensors 2017, 17, 2671. [Google Scholar] [CrossRef] [PubMed]
- Seesaard, T.; Goel, N.; Kumar, M.; Wongchoosuk, C. Advances in gas sensors and electronic nose technologies for agricultural cycle applications. Comput. Electron. Agric. 2022, 193, 106673. [Google Scholar] [CrossRef]
- Miller, D.R.; Akbar, S.A.; Morris, P.A. Nanoscale metal oxide-based heterojunctions for gas sensing: A review. Sens. Actuators B Chem. 2014, 204, 250–272. [Google Scholar] [CrossRef]
- Zappa, D.; Galstyan, V.; Kaur, N.; Munasinghe Arachchige, H.M.M.; Sisman, O.; Comini, E. “Metal oxide-based heterostructures for gas sensors”—A review. Anal. Chim. Acta 2018, 1039, 1–23. [Google Scholar] [CrossRef]
- Sharma, S.; Madou, M. A new approach to gas sensing with nanotechnology. Philos. Trans. R. Soc. A Math. Phys. Eng. Sci. 2012, 370, 2448–2473. [Google Scholar] [CrossRef]
- Zhao, Z.; Yang, H.; Wei, Z.; Xue, Y.; Sun, Y.; Zhang, W.; Li, P.; Gong, W.; Zhuiykov, S.; Hu, J. NH3 Sensor Based on 3D Hierarchical Flower-Shaped n-ZnO/p-NiO Heterostructures Yields Outstanding Sensing Capabilities at ppb Level. Sensors 2020, 20, 4754. [Google Scholar] [CrossRef]
- Ojha, G.P.; Pant, B.; Acharya, J.; Lohani, P.C.; Park, M. Solvothermal-localized selenylation transformation of cobalt nickel MOFs templated heterointerfaces enriched monoclinic Co3Se4/CoNi2Se4@activated knitted carbon cloth for flexible and bi-axial stretchable supercapacitors. Chem. Eng. J. 2023, 464, 142621. [Google Scholar] [CrossRef]
- Dasineh Khiavi, N.; Katal, R.; Kholghi Eshkalak, S.; Masudy-Panah, S.; Ramakrishna, S.; Hu, J. Visible Light Driven Heterojunction Photocatalyst of CuO–Cu2O Thin Films for Photocatalytic Degradation of Organic Pollutants. Nanomaterials 2019, 9, 1011. [Google Scholar] [CrossRef]
- Yang, S.; Lei, G.; Xu, H.; Lan, Z.; Wang, Z.; Gu, H. Metal Oxide Based Heterojunctions for Gas Sensors: A Review. Nanomaterials 2021, 17, 1026. [Google Scholar] [CrossRef]
- De Lacy Costello, B.P.J.; Ewen, R.; Jones, P.R.; Ratcliffe, N.; Wat, R.K. A study of the catalytic and vapour-sensing properties of zinc oxide and tin dioxide in relation to 1-butanol and dimethyldisulphide. Sens. Actuators B Chem. 1999, 61, 199–207. [Google Scholar] [CrossRef]
- Maziarz, W. TiO2/SnO2 and TiO2/CuO thin film nano-heterostructures as gas sensors. Appl. Surf. Sci. 2019, 480, 361–370. [Google Scholar] [CrossRef]
- Kwon, H.; Yoon, J.-S.; Dong, Y.L.; Kim, Y.; Beak, C.-K.; Kim, J.Y. An array of metal oxides nanoscale hetero p-n junctions toward designable and highly-selective gas sensors. Sens. Actuators B Chem. 2018, 255, 1663–1670. [Google Scholar] [CrossRef]
- Meng, F.-J.; Xin, R.-F.; Li, S.-X. Metal Oxide Heterostructures for Improving Gas Sensing Properties: A Review. Materials 2023, 16, 263. [Google Scholar] [CrossRef] [PubMed]
- Duanmu, F.; Shen, Z.; Liu, Q.; Zhong, S.; Ji, H. A WO3-CuWO4 nanostructured heterojunction for enhanced n-butanol sensing performance. Chin. Chem. Lett. 2020, 31, 1114–1118. [Google Scholar] [CrossRef]
- Kumar, N.; Haviar, S.; Zeman, P. Three-Layer PdO/CuWO4/CuO System for Hydrogen Gas Sensing with Reduced Humidity Interference. Nanomaterials 2021, 11, 3456. [Google Scholar] [CrossRef]
- Wang, Z.; Wang, X.; Wang, H.; Chen, X.; Dai, W.; Fu, X. The role of electron transfer behavior induced by CO chemisorption on visible-light-driven CO conversion over WO3 and CuWO4/WO3. Appl. Catal. B Environ. 2020, 265, 118588. [Google Scholar] [CrossRef]
- Castello Lux, K.; Fajerwerg, K.; Hot, J.; Ringot, E.; Bertron, A.; Collière, V.; Kahn, M.L.; Loridant, S.; Coppel, Y.; Fau, P. Nano-Structuration of WO3 Nanoleaves by Localized Hydrolysis of an Organometallic Zn Precursor: Application to Photocatalytic NO2 Abatement. Nanomaterials 2022, 12, 4360. [Google Scholar] [CrossRef] [PubMed]
- Chemseddine, A.; Morineau, R.; Livage, J. Electrochromism of colloidal tungsten oxide. Solid State Ion. 1983, 9, 357–361. [Google Scholar] [CrossRef]
- Choi, Y.-G.; Sakai, G.; Shimanoe, K.; Miura, N.; Yamazoe, N. Preparation of aqueous sols of tungsten oxide dihydrate from sodium tungstate by an ion-exchange method. Sens. Actuators B Chem. 2002, 87, 63–72. [Google Scholar] [CrossRef]
- Menini, P.; Chalabi, H.; Yoboué, P.; Scheid, E.; Conédéra, V.; Salvagnac, L.; Aguir, K. High Performances of New Microhotplate for Gas Sensors. In Proceedings of the 22nd European Conference on Solid state Transducers (EUROSENSORS XXII), Dresden, Germany, 7–10 September 2008. [Google Scholar]
- Kahn, M.L.; Monge, M.; Colliere, V.; Senocq, F.; Maisonnat, A.; Chaudret, B. Size- and Shape-Control of Crystalline Zinc Oxide Nanoparticles: A New Organometallic Synthetic Method. Adv. Funct. Mater. 2005, 15, 458–468. [Google Scholar] [CrossRef]
- Casterou, C.; Collière, V.; Lecante, L.; Coppel, Y.; Eliat, P.A.; Gauffre, F.; Kahn, M.L. Improved Transversal Relaxivity for Highly Crystalline Nanoparticles of Pure γ-Fe2O3 Phase. Chemistry 2015, 14, 18855–18861. [Google Scholar] [CrossRef] [PubMed]
- Ryzhikov, A.; Jońca, J.; Kahn, M.L.; Fajerwerg, K.; Chaudret, B.; Chapelle, A.; Menini, P.; Shim, C.H.; Gaudon, A.; Fau, P. Organometallic synthesis of ZnO nanoparticles for gas sensing: Towards selectivity through nanoparticles morphology. J. Nanopart. Res. 2015, 17, 280. [Google Scholar] [CrossRef]
- Jońca, J.; Ryzhikov, A.; Palussiere, S.; Esvan, J.; Fajerwerg, K.; Menini, P.; Kahn, M.L.; Fau, P. Organometallic Synthesis of CuO Nanoparticles: Application in Low-Temperature CO Detection. ChemPhysChem 2017, 18, 2658–2665. [Google Scholar] [CrossRef]
- Jońca, J.; Ryzhikov, A.; Kahn, M.L.; Fajerwerg, K.; Chapelle, A.; Menini, P.; Fau, P. SnO2 “Russian Doll” Octahedra Prepared by Metalorganic Synthesis: A New Structure for Sub-ppm CO Detection. Eur. J. Chem. 2016, 22, 10127–10135. [Google Scholar] [CrossRef]
- Sendi, A.; Fau, P.; Fajerwerg, P.; Kahn, M.L.; Menini, P. Detection and Discrimination of Formaldehyde with CuO/SnO2 dual layers MOS Gas Sensors Operated with a Pulsed Temperature Modulation. In Proceedings of the Conference: 6th International Conference on Sensors Engineering and Electronics Instrumentation Advances (SEIA’ 2020), Porto, Portugal, 23–25 September 2020. [Google Scholar]
- Escalante, G.; Lopez, R.; Demesa, F.N.; Villa-Sanchez, G.; Castrejon-Sanchez, V.H.; Vivaldo de la Cruz, I. Correlation between Raman spectra and color of tungsten trioxide (WO3) thermally evaporated from a tungsten filament. AIP Adv. 2021, 11, 055103. [Google Scholar] [CrossRef]
- Castillero, P.; Rico-Gavira, V.; Lopez-Santos, C.; Barranco, A.; Perez-Dieste, V.; Escudero, C.; Espinos, J.P.; Gonzalez-Elipe, A.R. Formation of subsurface W5+ species in gasochromic Pt/WO3 thin films exposed to hydrogen. J. Phys. Chem. C 2017, 121, 15719–15727. [Google Scholar] [CrossRef]
- Ojha, G.P.; Muthurasu, A.; Tiwari, A.P.; Pant, B.; Chhetri, K.; Mukhiya, T.; Dahal, B.; Lee, M.; Park, M.; Kim, H.-K. Vapor solid phase grown hierarchical CuxO NWs integrated MOFs-derived CoS2 electrode for high-performance asymmetric supercapacitors and the oxygen evolution reaction. Chem. Eng. J. 2020, 399, 125532. [Google Scholar] [CrossRef]
- Kol’tsova T., N.; Nipan, G.D. System CuO-WO3. Inorg. Mater. 1999, 35, 471–472. [Google Scholar]
- Umar, A.; Algadi, H.; Kumar, R.; Akhtar, M.S.; Ibrahim, A.A.; Albargi, H.; Alhamami, M.A.M.; Alsuwian, T.; Zeng, W. Ultrathin Leaf-Shaped CuO Nanosheets Based Sensor Device for Enhanced Hydrogen Sulfide Gas Sensing Application. Chemosensors 2021, 9, 221. [Google Scholar] [CrossRef]
- Yadav, A.A.; Hunge, Y.M.; Kang, S.W. Porous Nanoplate-like Tungsten Trioxide/Reduced Graphene Oxide Catalyst for Sonocatalytic Degradation and Photocatalytic Hydrogen Production. Surf. Interfaces 2021, 24, 101075. [Google Scholar] [CrossRef]
- Liu, Y.; Li, X.; Li, X.; Shao, C.; Han, C.; Xin, J.; Lu, D.; Niu, L.; Tang, Y.; Liu, Y. Highly permeable WO3/CuWO4 heterostructure with 3D hierarchical porous structure for high-sensitive room-temperature visible-light driven gas sensor. Sens. Actuators B Chem. 2022, 365, 131926. [Google Scholar] [CrossRef]
- Oosthuizen, D.N.; Motaung, D.E.; Swart, H.C. Selective detection of CO at room temperature with CuO nanoplatelets sensor for indoor air quality monitoring manifested by crystallinity. Appl. Surf. Sci. 2019, 466, 545–553. [Google Scholar] [CrossRef]
- Hou, L.; Zhang, C.; Li, L.; Du, C.; Li, X.; Kang, X.F.; Chen, W. CO gas sensors based on p-type CuO nanotubes and CuO nanocubes: Morphology and surface structure effects on the sensing performance. Talanta 2018, 188, 41–49. [Google Scholar] [CrossRef]
- Abegg, S.; Klein Cerrejon, D.; Güntner, A.T.; Pratsinis, S.E. Thickness Optimization of Highly Porous Flame-Aerosol Deposited WO3 Films for NO2 Sensing at ppb. Nanomaterials 2020, 10, 1170. [Google Scholar] [CrossRef] [PubMed]
- Zhao, S.; Shen, Y.; Zhou, P.; Zhong, X.; Han, C.; Zhao, Q.; Wei, D. Design of Au@WO3 core−shell structured nanospheres for ppb-level NO2 sensing. Sens. Actuators B Chem. 2019, 282, 917–926. [Google Scholar] [CrossRef]
- Gonzalez, O.; Welearegay, T.G.; Vilanova, X.; Llobet, E. Using the Transient Response of WO3 Nanoneedles under Pulsed UV Light in the Detection of NH3 and NO2. Sensors 2018, 18, 1346. [Google Scholar] [CrossRef]
- Drewniak, S.; Drewniak, Ł.; Pustelny, T. Mechanisms of NO2 Detection in Hybrid Structures Containing Reduced Graphene Oxide: A Review. Sensors 2022, 22, 5316. [Google Scholar] [CrossRef] [PubMed]
- Zhang, F.; Lin, Q.; Han, F.; Wang, Z.; Tian, B.; Zhao, L.; Dong, T.; Jiang, Z. A flexible and wearable NO2 gas detection and early warning device based on a spraying process and an interdigital electrode at room temperature. Microsyst. Nanoeng. 2022, 8, 40. [Google Scholar] [CrossRef]
- Fan, C.; Shi, J.; Zhang, Y.; Quan, X.; Yang, J.; Zeng, M.; Zhou, Z.; Su, Y.; Wei, H.; Yang, Z. Fast and recoverable NO2 detection achieved by assembling ZnO on Ti3C2Tx MXene nanosheets under UV illumination at room temperature. Nanoscale 2022, 14, 3441–3451. [Google Scholar] [CrossRef] [PubMed]
- Cai, Z.; Kim, K.-K.; Park, S. Room temperature detection of NO2 gas under UV irradiation based on Au nanoparticle-decorated porous ZnO nanowires. J. Mater. Res. Technol. 2020, 9, 16289–16302. [Google Scholar] [CrossRef]
- Su, P.-G.; Yu, J.-H. Enhanced NO2 gas-sensing properties of Au-Ag bimetal decorated MWCNTs/WO3 composite sensor under UV-LED irradiation. Sens. Actuators A Phys. 2020, 303, 111718. [Google Scholar] [CrossRef]
- Castelló-Lux, K. Synthesis and Gold Decoration of Alternative Oxides to TiO2 for the Photocatalytic Degradation of NO and NO2 in Indoor Environment Conditions: Evaluation of the Efficiency and the Contribution of the Decoration on the Photocatalytic Activity. Ph.D. Thesis, Universite Paul Sabatier, Toulouse, France, 2022. Available online: https://www.theses.fr/2022ISAT0025 (accessed on 11 August 2023).
- Xuan, J.; Zhao, G.; Sun, M.; Jia, F.; Zhou, T.; Yin, G.; Liu, B. Low-temperature operating ZnO-based NO2 sensors: A review. RSC Adv. 2020, 10, 39786–39807. [Google Scholar] [CrossRef]
- Bonaccorsi, L.; Malara, A.; Donato, A.; Donato, N.; Leonardi, S.G.; Neri, G. Effects of UV Irradiation on the Sensing Properties of In2O3 for CO Detection at Low Temperature. Micromachines 2019, 10, 338. [Google Scholar] [CrossRef] [PubMed]
- Lu, G.; Xu, J.; Sun, J.; Yu, Y.; Zhang, Y.; Liu, F. UV-enhanced room temperature NO2 sensor using ZnO nanorods modified with SnO2 nanoparticles. Sens. Actuators B Chem. 2012, 162, 82–88. [Google Scholar] [CrossRef]
- Sayago, I.; Santos, J.P.; Sánchez-Vicente, C. The Effect of Rare Earths on the Response of Photo UV-Activate ZnO Gas Sensors. Sensors 2022, 22, 8150. [Google Scholar] [CrossRef]
- Cai, Z.; Park, J.; Park, S. Synthesis of Flower-like ZnO and Its Enhanced Sensitivity towards NO2 Gas Detection at Room Temperature. Chemosensors 2023, 11, 322. [Google Scholar] [CrossRef]
- Platonov, V.; Malinin, N.; Vasiliev, R.; Rumyantseva, M. Room Temperature UV-Activated NO2 and NO Detection by ZnO/rGO Composites. Chemosensors 2023, 11, 227. [Google Scholar] [CrossRef]
- Barsan, N.; Koziej, D.; Weimar, U. Metal oxide-based gas sensor research: How to? Sens. Actuators B Chem. 2007, 121, 18–35. [Google Scholar] [CrossRef]
- Chizhov, A.; Kutukov, P.; Gulin, A.; Astafiev, A.; Rumyantseva, M. UV-Activated NO2 Gas Sensing by Nanocrystalline ZnO: Mechanistic Insights from Mass Spectrometry Investigations. Chemosensors 2022, 10, 147. [Google Scholar] [CrossRef]


| TGA | Microanalysis | |||||
|---|---|---|---|---|---|---|
| CuMes Amount (Molar Equivalent) | H2O/Cu Molar Ratio | Low To H2O Weight Loss (%) | High To H2O Weight Loss (%) | Cu (% wt.) | W (% wt.) | O (% wt.) |
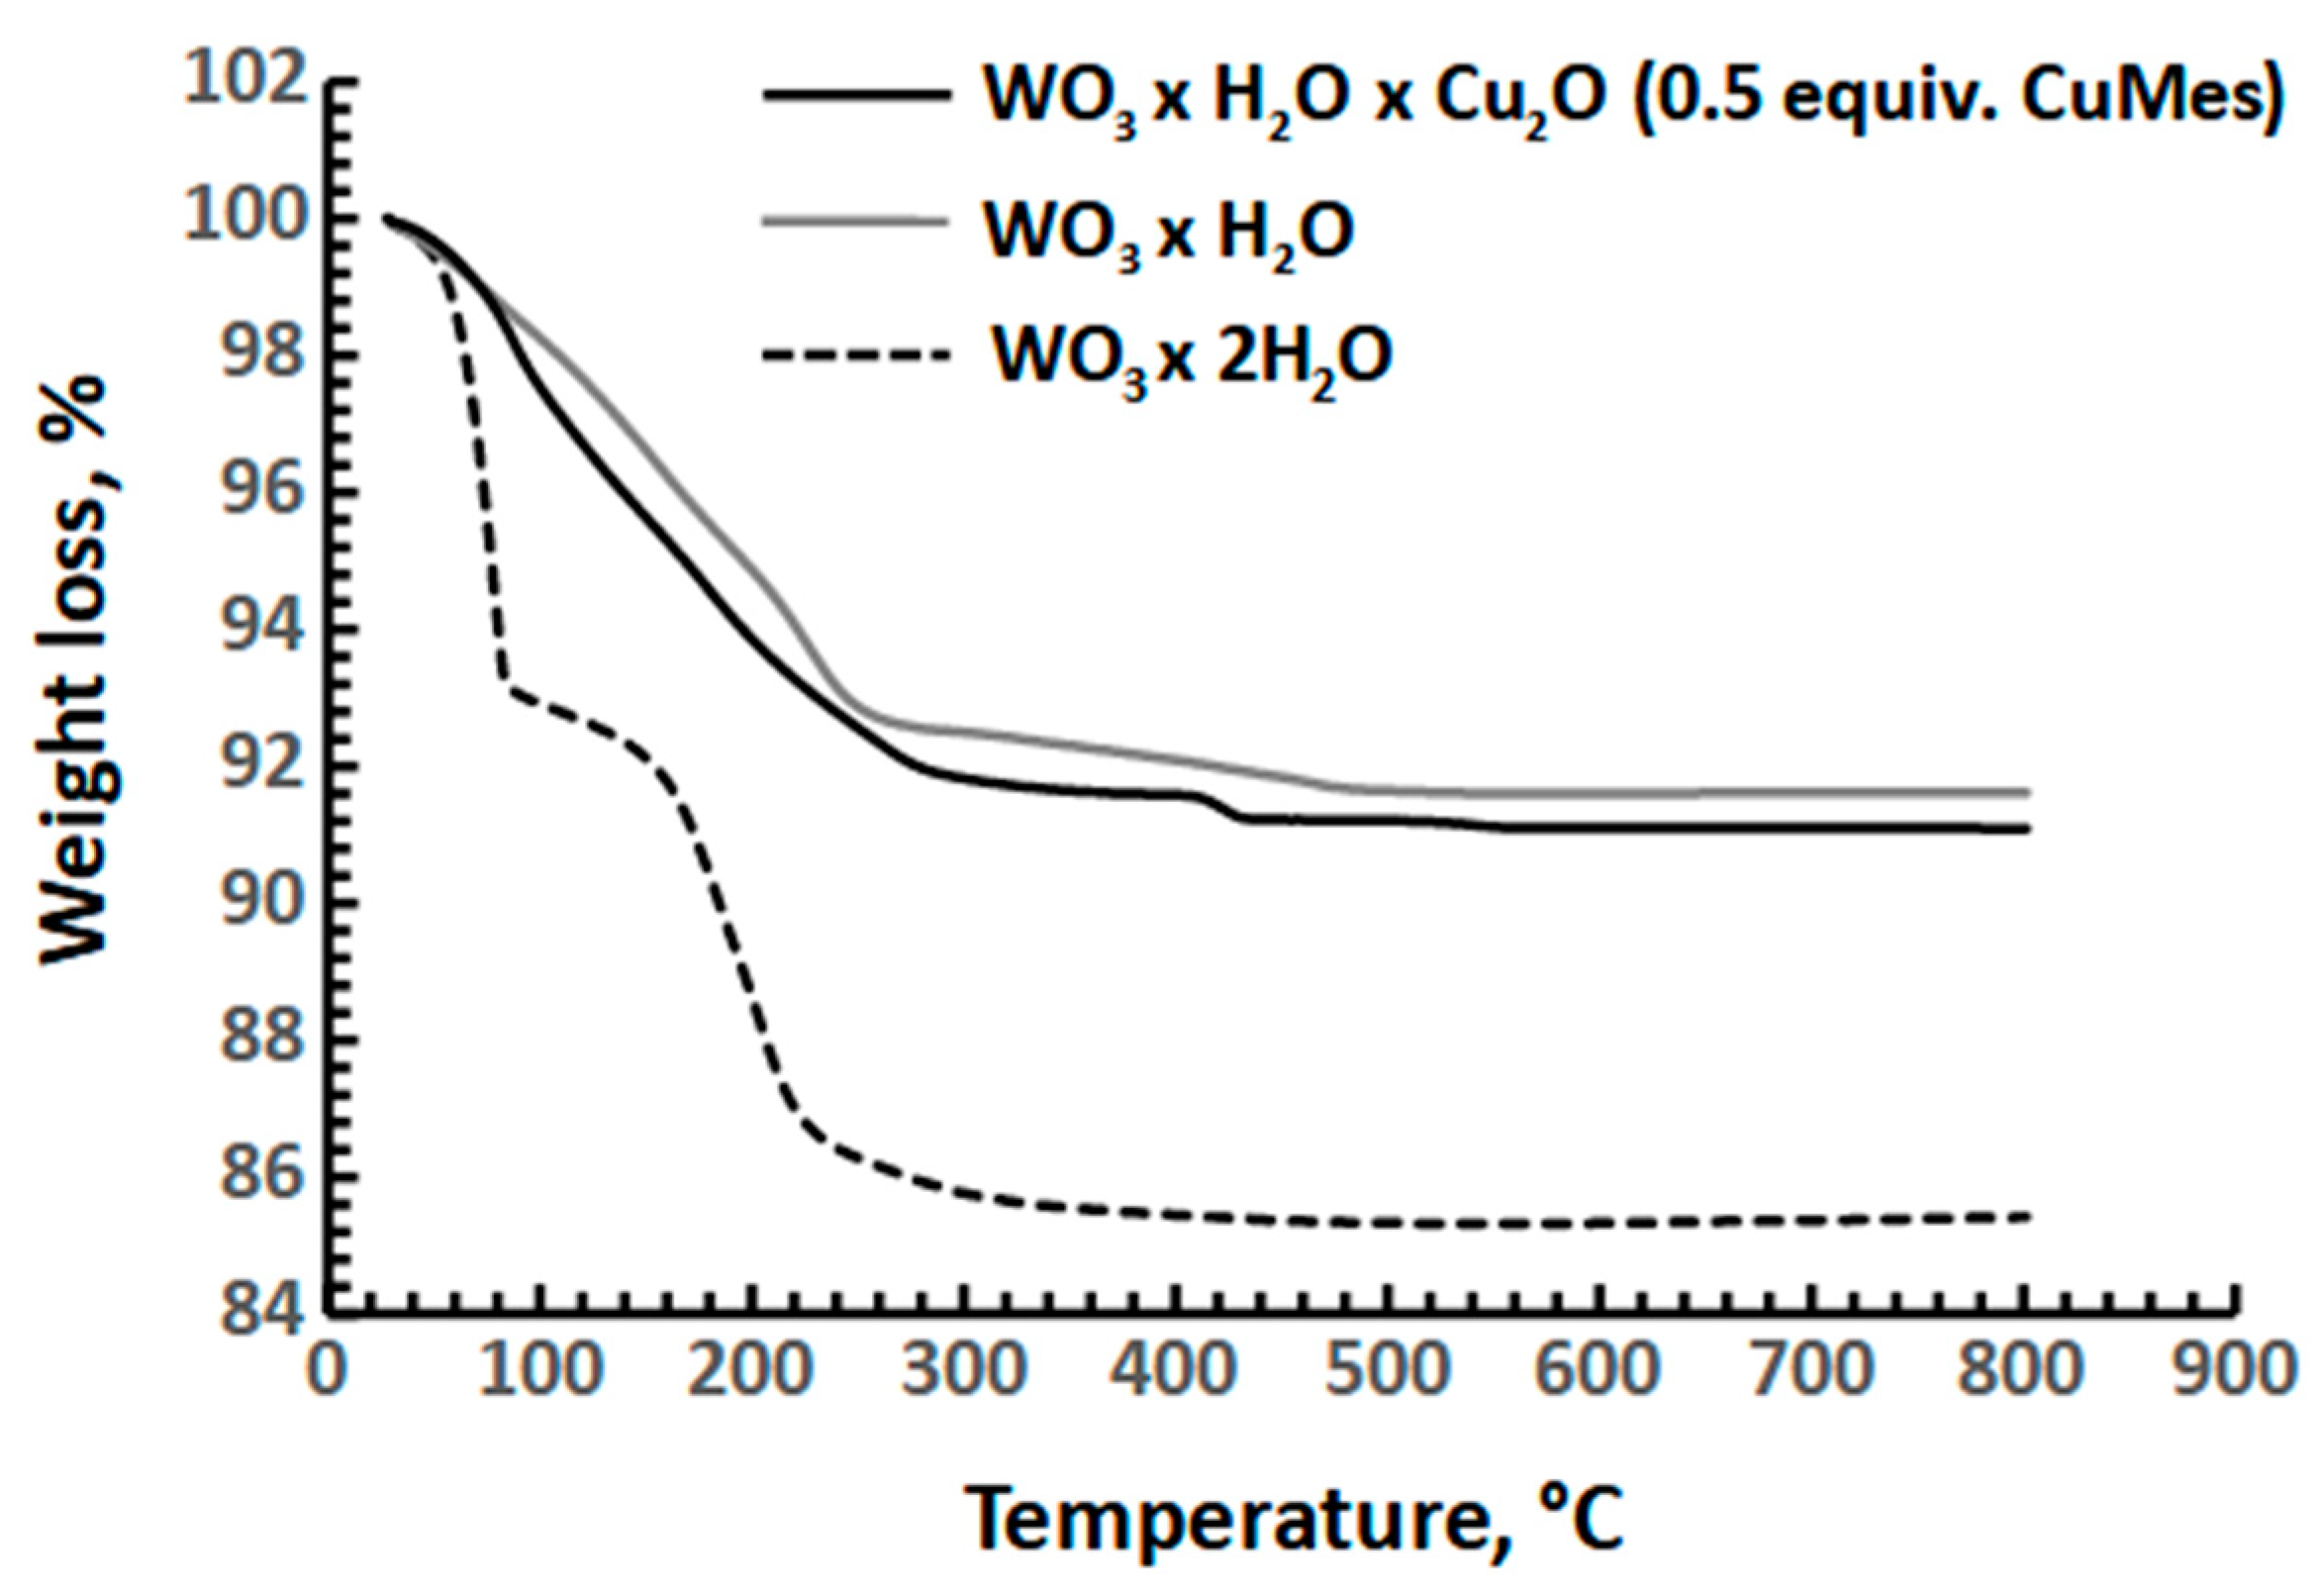
| 0 | - | 7.3 | 7.0 | - | 77.3 | 19.2 |
| 0.25 | 3.2 | 1.8 | 6.6 | 5.6 | 68.0 | 23.9 |
| 0.5 | 1.7 | 1.2 | 6.8 | 13.1 | 65.3 | 20.0 |
| 1.0 | 0.8 | 1.1 | 7.3 | 17.0 | 54.7 | 21.2 |
| Sensor | Temperature | ||||
|---|---|---|---|---|---|
| t = 540 °C | t = 445 °C | t = 390 °C | t = 250 °C | t = 110 °C | |
| CuO | <1 | <1 | <1 | 3 | 16 |
| WO3 | 580 | 612 | 828 | 2064 | 1120 |
| CuWO4@WO3 | ca. 10,000 | ca. 18,000 | r | r | r |
| Analyzed Gas | CO | NO2 | ||||
|---|---|---|---|---|---|---|
| Sensor | CuO | WO3 | CuWO4@WO3 | CuO | WO3 | CuWO4@WO3 |
| t = 540 °C | 9% | - | 18% | - | 16% | 180% |
| t = 445 °C | 14% | - | 30% | - | 80% | 620% |
| t = 390 °C | 18% | 5% | r | 3% | 225% | r |
| t = 250 °C | 34% | 7% | r | 12% | 500% * | r |
| t = 110 °C | c.a. 13% * | c.a. 13% * | r | c.a. 17%* | c.a.1900% * | r |
Disclaimer/Publisher’s Note: The statements, opinions and data contained in all publications are solely those of the individual author(s) and contributor(s) and not of MDPI and/or the editor(s). MDPI and/or the editor(s) disclaim responsibility for any injury to people or property resulting from any ideas, methods, instructions or products referred to in the content. |
© 2023 by the authors. Licensee MDPI, Basel, Switzerland. This article is an open access article distributed under the terms and conditions of the Creative Commons Attribution (CC BY) license (https://creativecommons.org/licenses/by/4.0/).
Share and Cite
Jońca, J.; Castello-Lux, K.; Fajerwerg, K.; Kahn, M.L.; Collière, V.; Menini, P.; Sówka, I.; Fau, P. Gas Sensing Properties of CuWO4@WO3 n-n Heterojunction Prepared by Direct Hydrolysis of Mesitylcopper (I) on WO3·2H2O Nanoleaves. Chemosensors 2023, 11, 495. https://doi.org/10.3390/chemosensors11090495
Jońca J, Castello-Lux K, Fajerwerg K, Kahn ML, Collière V, Menini P, Sówka I, Fau P. Gas Sensing Properties of CuWO4@WO3 n-n Heterojunction Prepared by Direct Hydrolysis of Mesitylcopper (I) on WO3·2H2O Nanoleaves. Chemosensors. 2023; 11(9):495. https://doi.org/10.3390/chemosensors11090495
Chicago/Turabian StyleJońca, Justyna, Kevin Castello-Lux, Katia Fajerwerg, Myrtil L. Kahn, Vincent Collière, Philippe Menini, Izabela Sówka, and Pierre Fau. 2023. "Gas Sensing Properties of CuWO4@WO3 n-n Heterojunction Prepared by Direct Hydrolysis of Mesitylcopper (I) on WO3·2H2O Nanoleaves" Chemosensors 11, no. 9: 495. https://doi.org/10.3390/chemosensors11090495