1. Introduction
Ginkgo ketone ester, a prevalent Chinese medicine renowned for its significant medicinal properties, primarily consists of flavonoids and terpene lactones [
1,
2]. Extracted from
Ginkgo biloba leaves, it finds prominent use in treating conditions such as blood stasis-type thoracic paralysis (angina pectoris of coronary heart disease) and blood stasis-type vertigo resulting from mild cerebral atherosclerosis [
2]. Within the realm of industrial production, the decolorization process holds a pivotal role in preparing Ginkgo ketone ester formulations. The toxicity of ginkgolic acid, such as embryotoxicity, cytotoxicity, and neurotoxicity, has been comprehensively reported [
3]. The primary objective of the decolorization process is the elimination of the toxic ginkgolic acids in the extract. The existing quality control practices for the decolorization process rely heavily on assessing the decolorized solution, yet this method presents a drawback of delayed test results. Consequently, it fails to promptly capture the dynamic changes in the ginkgolic acid during the actual decolorization process of the Ginkgo ketone ester extract [
4,
5].
In 2002, the U.S. Food and Drug Administration (FDA) introduced Process Analytical Technology (PAT) as an innovative approach aimed at enhancing process efficiency and control. PAT involves monitoring critical process parameters either in situ, online, bypass, or offline, ensuring they consistently fall within specified ranges to uphold the final product’s quality [
6,
7]. This methodology has gained widespread acceptance in the quality control of traditional Chinese medicine production processes. Raman spectroscopy, renowned for its non-destructive and rapid detection capabilities [
8,
9], has been only partially utilized in traditional Chinese medicine quality control. While it has found application in areas such as herb origin identification [
10,
11], quantitative analysis of the active ingredients [
12,
13], and detection of counterfeit medicines [
14,
15], its potential in overseeing the production process’s quality control remains underexplored.
Presently, the integration of spectroscopy and machine learning has become pervasive in the pharmaceutical sector, encompassing applications like qualitative identification [
16,
17] and quantitative detection [
18,
19]. The ResNeXt50 algorithm, introduced by Kaiming He’s team in 2017, represents a fusion of deep residual networks (ResNet) and Inception networks. Diverging from the manual design intricacies of the Inception structure, the ResNeXt50 algorithm adopts a uniform topology across its branches. The key strength of the ResNeXt50 deep network lies in its utilization of a multi-branch convolutional operation, enabling enhanced learning of diverse scales and types of features. This, in turn, augments the network’s expressive power, constituting a notable advantage in terms of both expressive capability and generalization performance.
Herein, we introduce a swift and effective approach for determining the concentrations of three ginkgolic acids during the decolorization phase of Ginkgo ketone ester preparation. Initially, an ultra-high-performance liquid chromatography-tandem mass spectrometry (UPLC-MS/MS) method was employed to quantify the levels of the three ginkgolic acids in the decolorized solution, which were used as a reference value for modelling. Subsequently, Raman spectral information from the decolorized Ginkgo ketone ester solution was collected using a portable Raman spectrometer. The competitive adaptive reweighting sampling (CARS) algorithm, in conjunction with partial least squares regression (PLSR), was then utilized to establish a quantitative PLSR correction model for the ginkgolic acid contents in the decolorized solution. Furthermore, we developed a quantitative calibration model based on the ResNeXt50 deep network. To enhance the interpretability of the model’s decision-making process, we employed the Grad-CAM algorithm, providing a visual representation for a clearer understanding of the model’s functionality.
2. Materials and Methods
2.1. Chemicals and Reagents
Methanol was purchased from the Shanghai Aladdin Chemical Reagent Co. (Shanghai, China) and Merck, German (Darmstadt, Germany). Formic acid was purchased from the Shanghai Aladdin Chemical Reagent Co. Reference substances, including ginkgolic acid C13:0, ginkgolic acid C15:1, and ginkgolic acid C17:1, were purchased from the Sichuan Weikeqi Biological Technology Co. (Chengdu, China). 91 batches of Ginkgo ketone ester decolorizing solution were supplied by the Shanghai Shangyao Xingling Technology Pharmaceutical Co. (Shanghai, China).
2.2. Determination of Three Ginkgolic Acids by UPLC-MS/MS
1 mL of the decolorized solution was transferred into a 1.5 mL centrifuge tube and centrifuged at 13,000 rpm for 5 min. Following centrifugation, 800 μL of the supernatant was filtered through a 0.22 μm microporous filter membrane into a sample bottle, constituting the test solution.
The UPLC-MS/MS analysis was conducted using a Waters Acquity UPLC H-Class Xevo TQ-S micro ultra-high-performance liquid chromatography-mass spectrometry system (Waters Corporation, Milford, MA, USA). This instrument integrates UPLC with a high-resolution mass spectrometer and is equipped with an electrospray ionization (ESI) source. Chromatographic conditions comprised an ACQUITY UPLC BEH C18 column (2.1 × 50 mm, 1.7 μm) with mobile phases of 0.1% formic acid-water (A) and methanol (B) using isocratic elution (10% A-90% B). The flow rate was maintained at 0.2 mL/min, with a column temperature of 35 °C, and an injection volume of 5.0 μL.
Mass spectrometry conditions employed the negative ion mode for detection. The capillary voltage was set at 2.50 kV, the ion source temperature at 150 °C, and nitrogen served as the desolvation gas at a flow rate of 650 L/Hr and a temperature of 350 °C. The cone pore gas was nitrogen at a flow rate of 1 L/Hr, and argon was employed as the collision gas. Sample analysis utilized a multiple reaction monitoring model (MRM). Key mass spectral parameters for the three ginkgolic acids are detailed in the following
Table S1.
2.3. Method Validation
Accurate quantities of ginkgolic acid C13:0, ginkgolic acid C15:1, and ginkgolic acid C17:1 were individually weighed and dissolved in methanol, forming control mother liquors. From each control mother liquor, an appropriate volume was diluted with methanol to create a mixed control stock solution. This mixed control stock solution was then incrementally diluted with methanol to generate six concentration gradients of the mixed control solution, aligning with proposed chromatographic and mass spectrometry conditions for sample determination. Utilizing the obtained peak area (y) as the vertical coordinate and mass concentration (x) as the horizontal coordinate, standard curves were constructed. Simultaneously, the limits of quantification (LOQ, S/N = 10) and detection (LOD, S/N = 3) for the three ginkgolic acids were determined.
Intra-day precision was assessed through six consecutive injections of the same mixed control solution within a single day. Inter-day precision involved two consecutive injections of the same mixed control solution on one day and three consecutive injections on consecutive days. Method reproducibility was gauged by preparing six parallel test solutions from the same decolorized solution and injecting them based on the proposed chromatographic and mass spectrometric conditions. Sample stability was determined by injecting the same sample solution at intervals of 0, 2, 4, 8, 12, and 24 h.
To evaluate average recovery, precisely aspirated 1 mL of a decolorized solution with a known content of each component was combined with an appropriate amount of mixed control solution at low, medium, and high concentrations. Subsequently, the sample was injected following the proposed chromatographic and mass spectrometric conditions.
2.4. Raman Spectrum Acquisition
Raman spectra acquisition was accomplished using a FI-FO portable Raman spectrometer (Beijing Zhuo Li Han Guang Instrument Co., Ltd., Beijing, China). The raw Raman spectra were collected by taking 2 mL of decolorized liquid in a liquid phase vial and placing it in the liquid detection cell of the Raman spectrometer. The laser wavelength was 785 nm; the laser power was 25 mW; the Raman scanning range was 3200~200 cm−1; the integration time was 0.1 s; and the number of integrations was 3 times.
2.5. Establishment of the CARS-PLSR Model
The CARS-PLSR model was developed as a comparative analysis alongside the ResNeXt50 model, aiming to assess the predictive performance of the ResNeXt50 model. The CARS algorithm was employed to identify characteristic wavelengths through a multi-step process: (1) Monte Carlo sampling; (2) elimination of wavelengths with small weights in the absolute value of the regression coefficients using the exponential decay function (EDF); (3) selection of wavelengths with substantial absolute values of the regression coefficients in the PLS model through adaptive reweighted sampling (ARS); and (4) application of interactive validation to identify the subset with the lowest root mean square error of cross-validation (RMSECV) values as the characteristic wavelengths [
20]. In this investigation, Monte Carlo sampling was conducted 50 times with 10-fold cross-validation, leading to the establishment of the PLSR quantitative correction model. This comprehensive approach allowed for a rigorous evaluation of the ResNeXt50 model’s predictive capabilities in comparison to the CARS-PLSR model. The software used for data analysis is Anaconda 3.0 and the programming language is Python 3.9.
2.6. Establishment of ResNeXt50 Model
The ResNeXt50 network, introduced by Kaiming He’s team in 2017, represents an enhanced iteration of the deep residual network, integrating aggregated residual structures and a grouped convolution approach. This design significantly reduces computational demands while preserving information richness. In our study, the original Raman map serves as the model input. The initial convolutional layer employs a 7 × 7 convolutional kernel with a stride of 2, succeeded by a 3 × 3 max-pooling layer with a stride of 2. The second convolutional module incorporates three types of convolutions: a 1 × 1 convolutional kernel with 128 channels; a 3 × 3 convolutional kernel with 128 channels partitioned into 32 groups of convolutions; and a 1 × 1 convolutional kernel with 256 channels. This set is repeated in three groups. The third convolution module comprises a 1 × 1 convolution kernel with 256 channels, a 3 × 3 convolution kernel with 256 channels divided into 32 groups of convolutions, and a 1 × 1 convolution kernel with 512 channels, organized in four groups. The fourth convolution module features a 1 × 1 convolution kernel with 512 channels, a 3 × 3 convolution kernel with 512 channels divided into 32 groups of convolutions, and a 1 × 1 convolution kernel with 1024 channels, repeated in six groups. The fifth convolution module includes a 1×1 convolution kernel with 1024 channels, a 3 × 3 convolution kernel with 1024 channels divided into 32 groups of convolutions, and a 1 × 1 convolution kernel with 2048 channels, repeated in three groups. Ultimately, following the average pooling layer and the fully connected layer, the model outputs the results for the three chemical compositions.
Figure 1 illustrates the detailed architecture of the ResNeXt50 network.
2.7. Visualization of the Model
The interpretability of deep learning algorithms is a crucial aspect for comprehending their functioning. In this study, the Grad-CAM algorithm was employed to enhance interpretability by visualizing images through the selection of features extracted from the final convolution layer of the ResNeXt50 model. This process sheds light on the critical aspects of the model’s decision-making process, providing valuable insights into the relationships between input features and the final predictions.
2.8. Evaluation of the Model
The assessment of the model performance relies on four key metrics, which are the correlation coefficient of calibration (
), the root mean square error of calibration (RMSEC), the correlation coefficient of prediction (
), and the root mean square error of prediction (RMSEP) [
21]. Here, the larger the
and
, the smaller the RMSEC and RMSEP, the better the model’s fitting and prediction ability.
RMSE and
R2 can be calculated according to Equations (1) and (2).
where
is the predicted value of sample
i,
is the measured value of the sample
i,
m is the number of samples, and
is the average of the measured values of the samples.
3. Results
3.1. Quantitative Assay of Three Ginkgolic Acids
The UPLC-MS/MS method was used to determine the contents of three ginkgolic acids (ginkgolic acid C13:0, ginkgolic acid C15:1, and ginkgolic acid C17:1) in 91 batches of decolorized solution. The chemical structures of the three ginkgolic acids are shown in
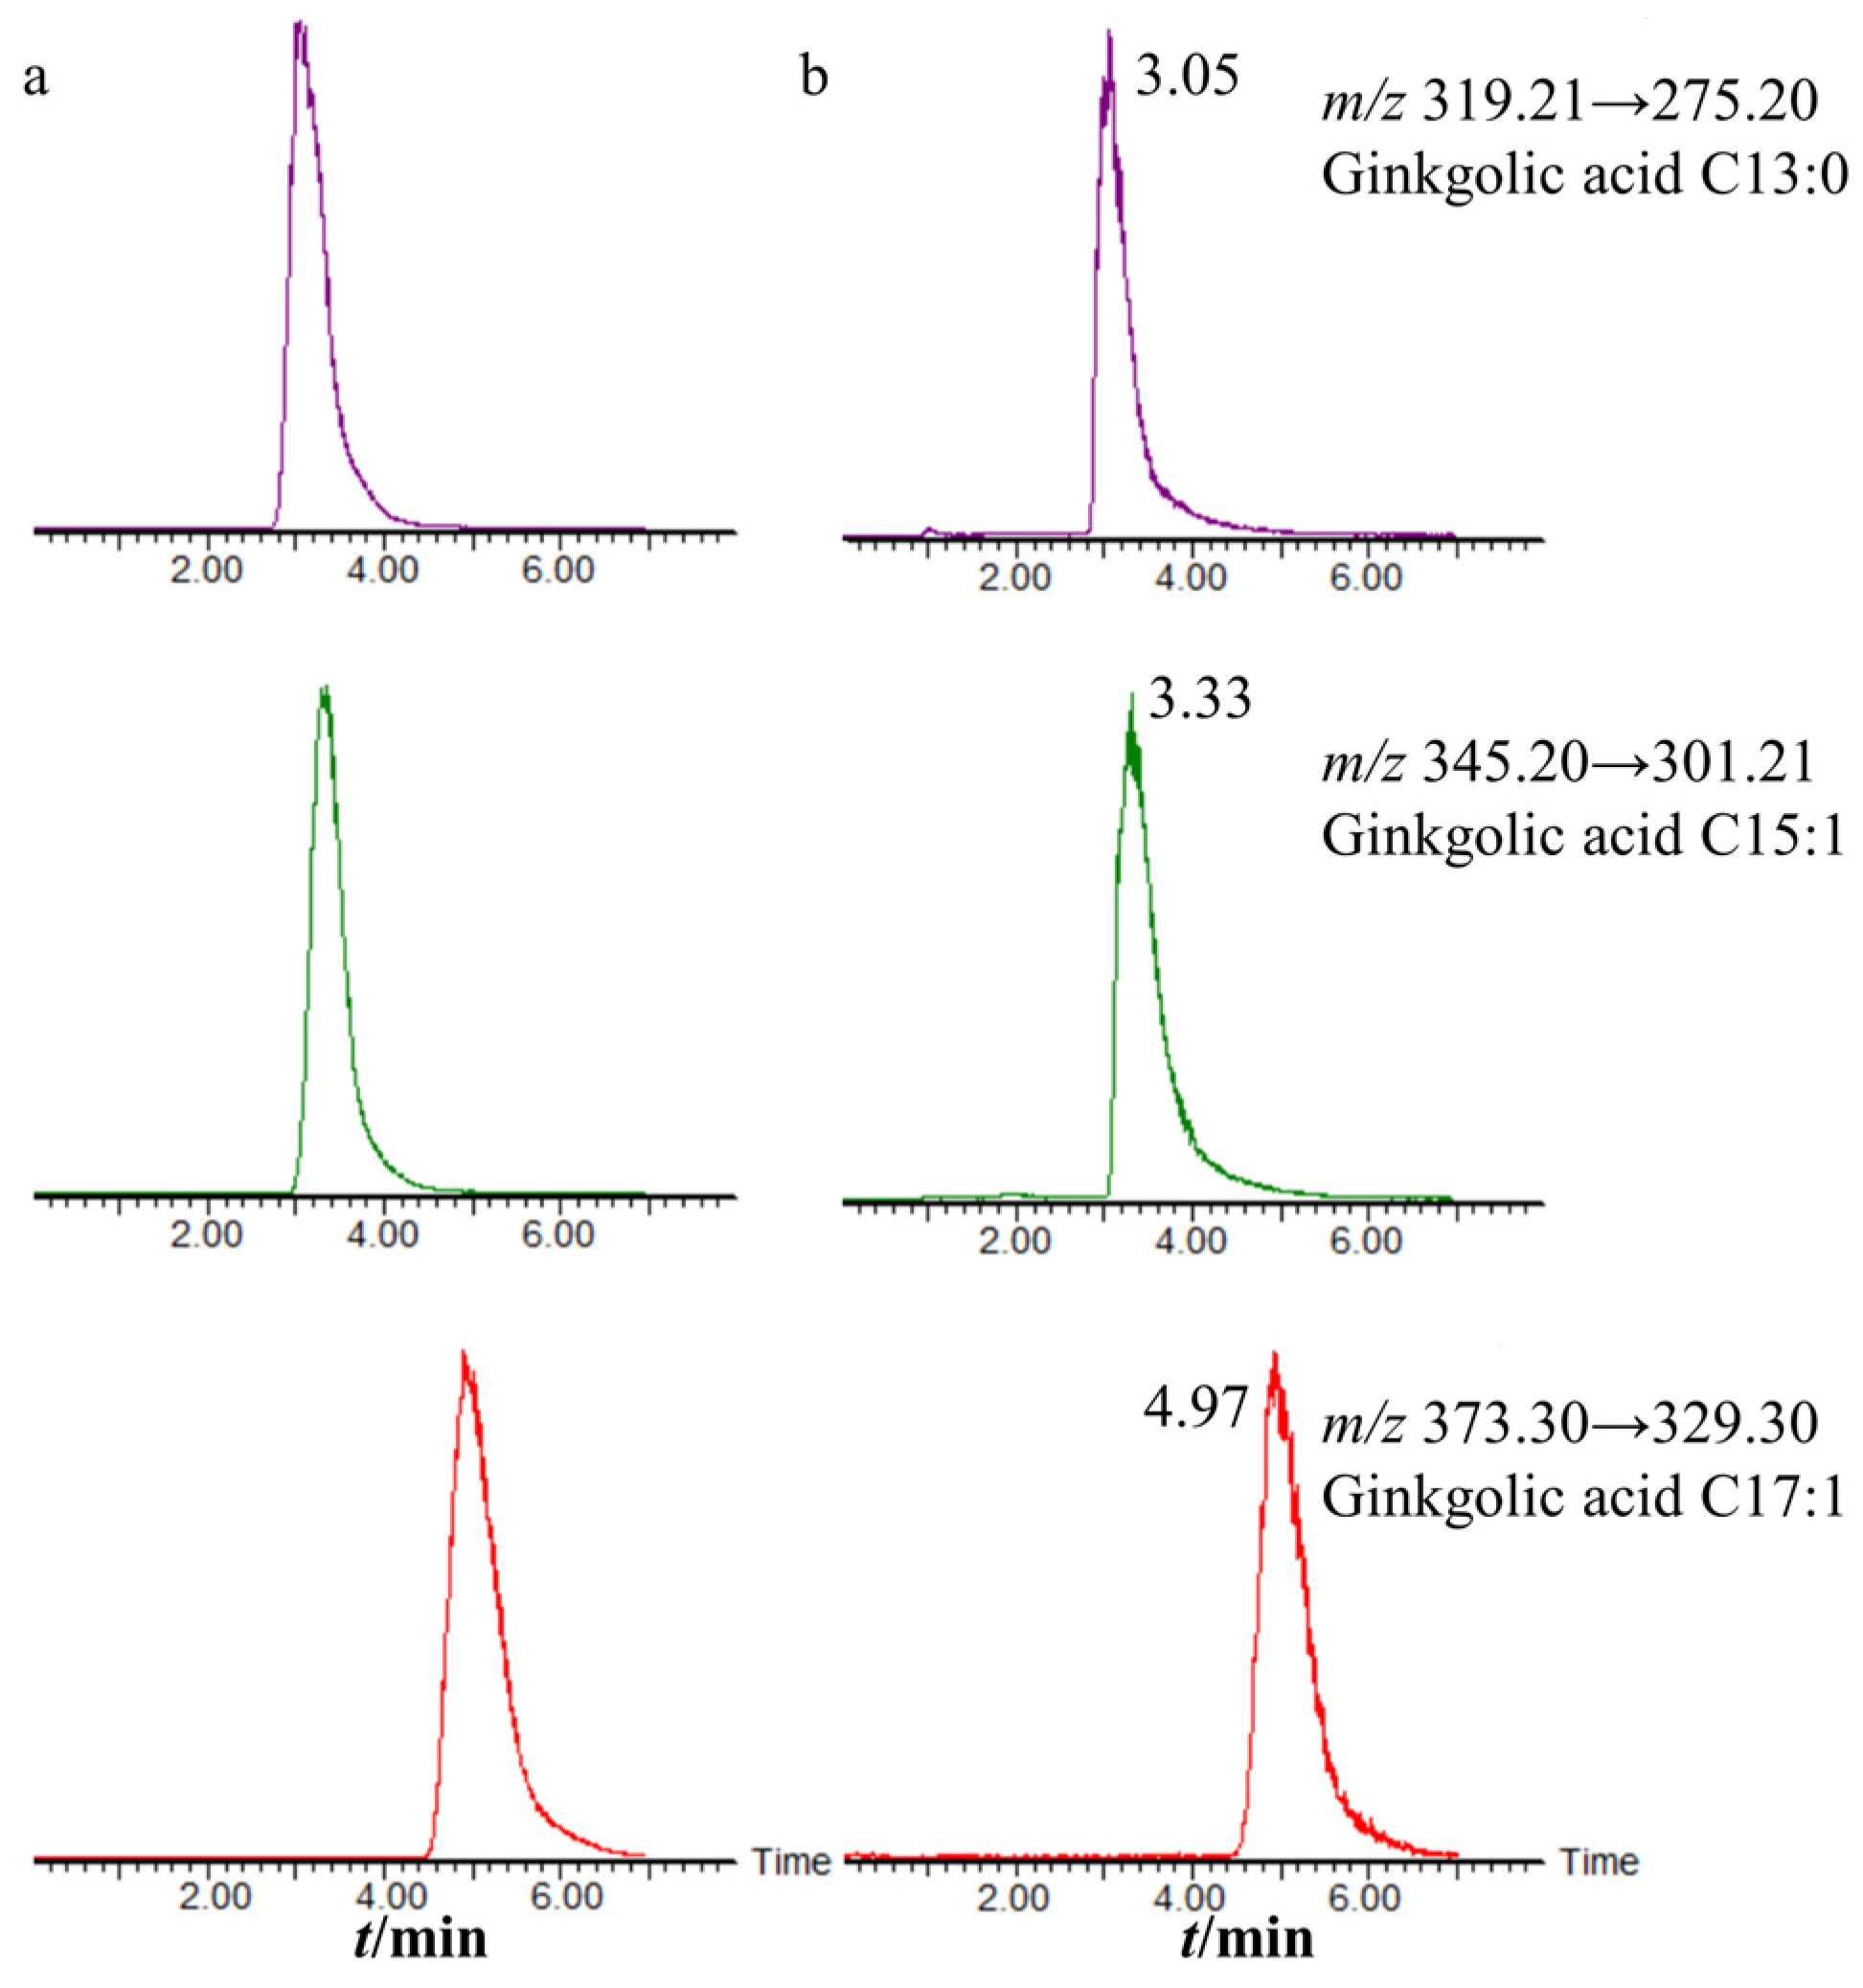
Figure 2. The three ginkgolic acids were well separated as shown in
Figure 3, which shows the chromatograms of the mixed control solution and the sample solution.
The methodology was systematically investigated, affirming its feasibility for determining the content of the three ginkgolic acids in the decolorized solution. The linearity of the three ginkgolic acids was initially scrutinized, revealing excellent linearity within their respective ranges, with linear correlation coefficients surpassing 0.9990 (
Table 1). Precision, reproducibility, and stability were also thoroughly assessed.
Table 2 showcases that the relative standard deviation (RSD) values for the concentrations of the three ginkgolic acids were all ≤4.66% in six injections within the same day, attesting to the precision of the instrument. Further, the RSD values remained ≤4.81% when employing two consecutive injections over one day and three consecutive days, confirming robust instrumental precision. The method’s reproducibility was evident, with RSD values ≤ 3.86% following the preparation of six parallel test solutions. Additionally, the stability of the solution within 24 h was validated, with RSD values ≤ 4.61% for all three ginkgolic acid concentrations. The method’s results for the three ginkgolic acids were systematically analyzed, and spiked recoveries were examined, yielding average values ranging from 96.33 to 104.89%, with RSD values all ≤3.89% (
Table S2). These findings affirm the method’s suitability for accurately determining the content of the three ginkgolic acids in the decolorized solution.
3.2. Division of Training Sets and Test Sets
The original Raman spectral images were collected using a portable Raman spectrometer. As shown in
Figure 4, the Raman spectra of 91 decolorization solution samples are roughly the same, indicating that there is not much difference between them.
The 91 batches of sample data were divided into a training (calibration) set and a test (prediction) set using the Kennard–Stone algorithm [
22] in the ratio of 4:1, with a total of 73 samples in the training set and 18 samples in the test set. As shown in
Table 3, the maximum, minimum, and mean values of the training set and the test set are not much different, indicating that there is no significant difference between the two data sets.
3.3. Performance of CARS-PLSR Model
Given the intricate chemical composition within the decolorized solution, the collected Raman spectral data encompasses not only pertinent information about the sample but also extraneous factors such as instrument-generated noise and background interference. To address this, preprocessing of the raw spectral data becomes imperative. In our approach, we employed MinMaxScaler normalization and Savitzky–Golay smoothing techniques. MinMaxScaler normalization serves as a method to standardize the data within the training set, ensuring uniformity and mitigating challenges during model training. Meanwhile, Savitzky–Golay smoothing plays a key role in eliminating noise and achieving data smoothing, refining the spectral data for more accurate analysis.
Subsequent to this, a total of 241 feature wavelengths were meticulously identified through the CARS algorithm. Leveraging raw data preprocessing and the discerned feature wavelengths, we successfully established a quantitative calibration model for Raman spectroscopy based on the CARS-PLSR algorithm. The model results are shown in
Table 4, the
values of the three ginkgolic acids were 0.9862, 0.9839, and 0.9480, respectively, and the values of RMSEP were 0.0273, 0.0305, and 0.0545 μg/mL, respectively. These results underscored the efficacy of the CARS-PLSR model in predicting ginkgolic acid concentrations accurately.
Figure 5a shows the correlation diagram of the predicted and measured values of the three ginkgolic acid contents in the CARS-PLSR model. As shown in the figure, the predicted and measured values are basically on both sides of the slash line, indicating that the predictive ability of the model is good.
3.4. Performance of ResNeXt50 Model
A quantitative calibration model for the Raman spectra of the three ginkgolic acids in the decolorized solution was developed based on the ResNeXt50 algorithm. The results are shown in
Table 4. The
values of the three ginkgolic acids were 0.9962, 0.9971, and 0.9974, respectively, and the values of RMSEP were 0.0144, 0.0130, and 0.0120 μg/mL, which indicate that the ResNeXt50 model has a good prediction ability. Compared with the results of the CARS-PLSR model, the
values of the three ginkgolic acids were larger, while RMSEP values were smaller, indicating that the ResNeXt50 model had better prediction.
Figure 5b shows the correlation diagram of the predicted and measured values of the three ginkgolic acid contents in the ResNeXt50 model. As shown in the figure, the predicted values and measured values are basically on the diagonal line with better fitting, indicating that the model has a good prediction effect and can be used for real-time monitoring of the three kinds of ginkgolic acids in the discoloration process of Ginkgo ketone ester.
3.5. Visualization of the Model
An interpretability analysis of the ResNeXt50 quantitative calibration model was conducted using the Grad-CAM algorithm, with
Figure 6 providing a visualization of the band weights associated with the three ginkgolic acids in the decolorized solution. The horizontal coordinates depict the band numbers, while the vertical coordinates represent the weights, reflecting the extent of contribution from different bands to the predicted output.
In
Figure 6, it is evident that specific Raman bands played a substantial role in predicting the content of each ginkgolic acid. For ginkgolic acid C13:0, the influential Raman wave numbers are 321.74, 1694.67, 1696.16, 1711.08, and 3068.27 cm
−1. The wavenumbers of 1694.67, 1696.16, and 1711.08 are ascribed to the carbon-carbon double bond of the benzene ring. The wavenumber of 3068.27 cm
−1 corresponded to the O-H stretching of the hydroxyl group. Similarly, for ginkgolic acid C15:1, the significant Raman wave number is 2187.02 cm
−1, which corresponded to the O-H stretching of the carboxyl group. Lastly, for ginkgolic acid C17:1, the impactful Raman wave numbers are 1645.01, 2116.63, 2117.97, 2575.88, and 2577.06 cm
−1. The wavenumbers of 2116.63 and 2117.97 cm
−1 corresponded to the O-H stretching of the carboxyl group. These results emphasize the critical influence of the mentioned bands in shaping the final decisions of the respective component models.
3.6. Trends in the Content of the Three Ginkgolic Acids
Figure 7 illustrates the variation in the content of the three ginkgolic acids across different batches of decolorized solution throughout the entire two-day decolorization process. Commencing from point 0 (before extraction initiation), the concentrations of ginkgolic acid C13:0, ginkgolic acid C15:1, and ginkgolic acid C17:1 in each batch’s decolorized solution progressively decreased with the advancement of the decolorization process. Furthermore, noteworthy consistency was observed in the trends of the three ginkgolic acids’ content changes among different batches of decolorized liquids. These trends harmonized with the alterations in the relative intensities of the original Raman spectra, indicating a correlation between the decolorization progress and the diminishing concentrations of the ginkgolic acids.
4. Discussion
Numerous techniques exist for ginkgolic acid detection in
Ginkgo biloba or its extracts, including on-line mass spectrometry [
23], high performance liquid chromatography (HPLC) [
24,
25], and UPLC-MS/MS [
26]. In our study, Raman spectroscopy, chosen for its rapid and non-destructive traits, stands out. This method, widely utilized in traditional Chinese medicine, demonstrates efficiency in discerning counterfeit medicines and tracing medicinal material origins. Our focus, however, centered on the decolorization process within Ginkgo ketone ester production. This emphasis aimed to enable swift detection throughout the production phase.
Of particular importance is the decolorization process in the production of Ginkgo ketone ester preparations, which plays a critical role in eliminating toxic substances. In this investigation, 91 samples of Ginkgo ketone ester decolorized liquid were meticulously collected. Raman spectral information and toxicity component data (contents of ginkgolic acid C13:0, ginkgolic acid C15:1, and ginkgolic acid C17:1) were obtained from these samples. The acquired Raman spectral data were correlated with the content data, leading to the development and comparison of the CARS-PLSR quantitative calibration model and the ResNeXt50 quantitative calibration model. The ultimate findings underscored that the ResNeXt50 deep network-based quantitative calibration model exhibited higher accuracy and precision. Conversely, the lower accuracy and precision of the PLSR model could be attributed to the limited sample size, indicating insufficient model training.
Furthermore, we applied the Grad-CAM algorithm to visualize and analyze the ResNeXt50 deep network, attempting to demystify the model’s inner workings by discerning the bands that significantly contribute to its predictive prowess.
The above findings underscore that the integration of Raman spectroscopy with the ResNeXt50 deep learning network proves effective for the swift determination of the three ginkgolic acid contents during the decolorization process of Ginkgo ketone ester. Nevertheless, it is imperative to acknowledge the limitation posed by the relatively small sample size in this experiment. Practical application in a Ginkgo ketone ester decolorization workshop demands an increase in the sample size to enhance the robustness and generalizability of the model.
5. Conclusions
In this study, a rapid detection method for three ginkgolic acids during the decolorization of Ginkgo ketone ester was developed, employing Raman spectroscopy and a deep learning algorithm. This method offers a viable alternative to traditional HPLC, UPLC-MS/MS, and GC methods, delivering swiftness and non-destructive analysis. Utilizing Raman spectra from the decolorized solution, we established a quantitative calibration model following spectral preprocessing and band screening in modeling. Notably, the quantitative calibration model constructed using ResNeXt50 outperformed the CARS-PLSR-based prediction model. The resultant prediction models based on ResNeXt50 algorithm displayed values of 0.9962, 0.9971, and 0.9974, alongside RMSEP values of 0.0144, 0.0130, and 0.0120 μg/mL for the three ginkgolic acids, respectively. These findings signify the models’ high accuracy and predictability, demonstrating their utility in swiftly detecting these ginkgolic acids during the decolorization process. Moreover, this rapid detection method, amalgamating Raman spectroscopy with deep learning algorithms, proves advantageous for monitoring pharmaceutical production quality. Its application contributes to ensuring production continuity and maintaining uniform product quality.
Author Contributions
Conceptualization, Y.T.; methodology, Q.L.; software, Y.T.; validation, Q.L. and M.J.; formal analysis, J.W.; investigation, D.W.; data curation, M.J.; writing—original draft preparation, Q.L.; writing—review and editing, D.W.; visualization, Y.T.; supervision, Y.T.; project administration, Y.T.; funding acquisition, Y.T. All authors have read and agreed to the published version of the manuscript.
Funding
This research was funded by the Natural Science Foundation of Zhejiang Province, grant number Y21H280036, and the Horizontal Scientific Research Project, grant number KYY-HX-20220295.
Institutional Review Board Statement
Not applicable.
Informed Consent Statement
Not applicable.
Data Availability Statement
Data are contained within the article.
Acknowledgments
The authors would like to thank the anonymous reviewers for their invaluable suggestions that helped improve the manuscript.
Conflicts of Interest
Authors Meifang Jiang, Jun Wang, Dandan Wang were employed by the company Shanghai Shangyao Xingling Technology Pharmaceutical Co., Ltd. The remaining authors declare that the research was conducted in the absence of any commercial or financial relationships that could be construed as a potential conflict of interest.
References
- Li, R.A.-O.; Xia, Z.; Li, B.; Tian, Y.; Zhang, G.; Li, M.; Dong, J.A.-O. Advances in Supercritical Carbon Dioxide Extraction of Bioactive Substances from Different Parts of Ginkgo biloba L. Molecules 2021, 26, 4011. [Google Scholar] [CrossRef] [PubMed]
- Liu, L.-N.; Jin, H.-Y.; Ke, Z.; Xu, W.-Y.; Sun, L.; Ma, S.-C. A strategy for quality control of ginkgo biloba preparations based on UPLC fingerprint analysis and multi-component separation combined with quantitative analysis. Chin. Med. 2022, 17, 72. [Google Scholar] [CrossRef] [PubMed]
- Boateng, I.A.-O. A critical review of ginkgolic acids in Ginkgo biloba leaf extract (EGb): Toxicity and technologies to remove ginkgolic acids and their promising bioactivities. Food Funct. 2022, 13, 9226–9242. [Google Scholar] [CrossRef] [PubMed]
- Yan, X.; Zhang, S.; Fu, H.; Qu, H. Combining convolutional neural networks and on-line Raman spectroscopy for monitoring the Cornu Caprae Hircus hydrolysis process. Spectrochim. Acta Part A 2020, 226, 117589. [Google Scholar] [CrossRef] [PubMed]
- Zhang, C.; Su, J. Application of near infrared spectroscopy to the analysis and fast quality assessment of traditional Chinese medicinal products. Acta Pharm. Sin. B 2014, 4, 182–192. [Google Scholar] [CrossRef]
- Zhong, L.; Gao, L.; Li, L.; Zang, H. Trends-process analytical technology in solid oral dosage manufacturing. Eur. J. Pharm. Biopharm. 2020, 153, 187–199. [Google Scholar] [CrossRef]
- Mandenius, C.-F. Realization of user-friendly bioanalytical tools to quantify and monitor critical components in bio-industrial processes through conceptual design. Eng. Life Sci. 2022, 22, 217–228. [Google Scholar] [CrossRef]
- Fuini, E.; Reimers, A.; Hudspeth, A.; Kucera, K.; Light, D. Raman spectroscopy detects adulterated counter-ions in pharmaceuticals. J. Raman Spectrosc. 2022, 53, 762–770. [Google Scholar] [CrossRef]
- Vankeirsbilck, T.; Vercauteren, A.; Baeyens, W.; Van der Weken, G.; Verpoort, F.; Vergote, G.; Remon, J.P. Applications of Raman spectroscopy in pharmaceutical analysis. TrAC Trends Anal. Chem. 2002, 21, 869–877. [Google Scholar] [CrossRef]
- Liu, T.; Kong, L.; Lin, L.; Xu, H.; Zhou, Z.; Huang, M. Identifying the origins of Tianhuang stones based on Raman spectroscopy and pattern recognition algorithms. Laser Phys. 2022, 32, 045702. [Google Scholar] [CrossRef]
- Oliveira, M.M.; Cruz-Tirado, J.P.; Barbin, D.F. Nontargeted Analytical Methods as a Powerful Tool for the Authentication of Spices and Herbs: A Review. Compr. Rev. Food Sci. Food Saf. 2019, 18, 670–689. [Google Scholar] [CrossRef] [PubMed]
- Liu, Y.; Doddi, J.; Zheng, Y.; Ho, V.; Pheil, M.; Shi, Y. Transmission Raman Spectroscopic Quantification of Active Pharmaceutical Ingredient in Coated Tablets of Hot-Melt Extruded Amorphous Solid Dispersion. Appl. Spectrosc. 2020, 74, 108–115. [Google Scholar] [CrossRef] [PubMed]
- Fakayode, S.O.; Bolton, B.; Dassow, B.; Galvez, K.; Chohan, H. Rapid screening and multicomponent quantifications of active components of oral syrup over-the-counter medications by Raman and UV-visible spectroscopy and multivariate regression analysis. Spectrochim. Acta Part A 2024, 305, 123447. [Google Scholar] [CrossRef] [PubMed]
- Frosch, T.A.-O.; Wyrwich, E.; Yan, D.; Domes, C.; Domes, R.; Popp, J.; Frosch, T.A.-O. Counterfeit and Substandard Test of the Antimalarial Tablet Riamet® by Means of Raman Hyperspectral Multicomponent Analysis. Molecules 2019, 24, 3229. [Google Scholar] [CrossRef] [PubMed]
- Zhang, X.; Wang, S.; Li, J.; Qin, J.; Wang, K.-G.; Bai, J.-T.; He, Q.-L. Study on a Non-Destructive Drug Testing Method Based on Spatially Offset Raman Spectroscopy. Spectrosc. Spectral Anal. 2019, 39, 1472–1476. [Google Scholar]
- Zhang, L.; Guan, Y.; Wang, N.; Ge, F.; Zhang, Y.; Zhao, Y. Identification of growth years for Puerariae Thomsonii Radix based on hyperspectral imaging technology and deep learning algorithm. Sci. Rep. 2023, 13, 14286. [Google Scholar] [CrossRef] [PubMed]
- Cai, Z.; Huang, Z.; He, M.; Li, C.; Qi, H.; Peng, J.; Zhou, F.; Zhang, C. Identification of geographical origins of Radix Paeoniae Alba using hyperspectral imaging with deep learning-based fusion approaches. Food Chem. 2023, 422, 136169. [Google Scholar] [CrossRef]
- Hou, H.; Xu, F.; Zhang, X.; Wu, Y.; Zhang, Y.; Zhang, C.; Wang, Z. Prediction of Lonicerae Japonicae Flos concentration in preparation of Reduning Injection based on NIRS and MIRS technology. Chin. Tradit. Herb. Drugs 2023, 54, 520–533. [Google Scholar]
- Liu, Y.; Wang, Q.; Gao, X.; Xie, A. Total phenolic content prediction in Flos Lonicerae using hyperspectral imaging combined with wavelengths selection methods. J. Food Process Eng. 2019, 42, 13224. [Google Scholar] [CrossRef]
- Yang, Y.; Zhao, C.; Huang, W.; Tian, X.; Fan, S.; Wang, Q.; Li, J. Optimization and compensation of models on tomato soluble solids content assessment with online Vis/NIRS diffuse transmission system. Infrared Phys. Technol. 2022, 121, 104050. [Google Scholar] [CrossRef]
- Tao, Y.; Bao, J.Q.; Liu, Q.; Liu, L.; Zhu, J.Q. Deep residual network enabled smart hyperspectral image analysis and its application to monitoring moisture, size distribution and contents of four bioactive compounds of granules in the fluid-bed granulation process of Guanxinning tablets. Spectrochim. Acta Part A 2023, 287, 122083. [Google Scholar] [CrossRef] [PubMed]
- de Sousa, L.C.; Gomide, J.L.; Milagres, F.R.; de Almeida, D.P. Development of NIRS calibration models for minimization of Eucalyptus spp. wood analysis. Cienc. Florest. 2011, 21, 591–599. [Google Scholar]
- Huang, Z.; Xu, Y.; Huang, Y.; Liu, C.; Jiang, K.; Wang, L. Rapid determination of ginkgolic acids in Ginkgo biloba kernels and leaves by direct analysis in real time-mass spectrometry. J. Sep. Sci. 2017, 40, 4857–4864. [Google Scholar] [CrossRef] [PubMed]
- Lee, H.; Lim, H.; Yang, J.; Hong, J. Rapid Determination of Ginkgolic Acids in Ginkgo biloba Leaf Using Online Column Switching High-Performance Liquid Chromatography-Diode Array Detection and Confirmation by Liquid Chromatography-tandem Mass Spectrometry. Bull. Korean Chem. Soc. 2013, 34, 3629–3634. [Google Scholar] [CrossRef]
- Ndjoko, K.; Wolfender, J.L.; Hostettmann, K. Determination of trace amounts of ginkgolic acids in Ginkgo biloba L. leaf extracts and phytopharmaceuticals by liquid chromatography-electrospray mass spectrometry. J. Chromatogr. B 2000, 744, 249–255. [Google Scholar] [CrossRef]
- Wang, Y.; Liu, Y.; Wu, Q.; Yao, X.; Cheng, Z. Rapid and Sensitive Determination of Major Active Ingredients and Toxic Components in Ginkgo Biloba Leaves Extract (EGb 761) by a Validated UPLC-MS-MS Method. J. Chromatogr. Sci. 2017, 55, 459–464. [Google Scholar]
| Disclaimer/Publisher’s Note: The statements, opinions and data contained in all publications are solely those of the individual author(s) and contributor(s) and not of MDPI and/or the editor(s). MDPI and/or the editor(s) disclaim responsibility for any injury to people or property resulting from any ideas, methods, instructions or products referred to in the content. |
© 2023 by the authors. Licensee MDPI, Basel, Switzerland. This article is an open access article distributed under the terms and conditions of the Creative Commons Attribution (CC BY) license (https://creativecommons.org/licenses/by/4.0/).


