Article

Carbon Nanotube-Based Electrochemical Sensor for the Determination of Anthraquinone Hair Dyes in Wastewaters

by
Ricardo De Oliveira
,
Felipe Hudari
,
Jefferson Franco
and
Maria Valnice Boldrin Zanoni
*
Departamento de Química Analítica, Instituto de Química de Araraquara, Universidade Estadual Paulista Júlio de Mesquita Filho, UNESP, Rua Francisco Degni, 55, Bairro Quitandinha, 14800-900 Araraquara, SP, Brazil
*
Author to whom correspondence should be addressed.
Chemosensors 2015, 3(1), 22-35; https://doi.org/10.3390/chemosensors3010022
Submission received: 8 December 2014 / Revised: 10 February 2015 / Accepted: 11 February 2015 / Published: 16 March 2015
(This article belongs to the Special Issue Electrochemical Sensors for Environmental and Food Analysis)

Abstract

:
The present work describes the development of a voltammetric sensor for the selective determination of Acid Green 25 (AG25) hair dye, widely used in commercial temporary hair dyes. The method is based on a glassy carbon electrode modified with multiwalled carbon nanotubes activated in the presence of sulfuric acid, where the anthraquinone group present as a chromophore in the dye molecule is reduced at −0.44 V vs. Ag/AgCl in a reversible process involving two electrons in Britton-Robinson (B-R) buffer solution at pH 4.0. Analytical curves were obtained using square wave voltammetry in the range from 1.0 × 10⁻⁷ to 7.0 × 10⁻⁶ mol·L−1, achieving a detection limit of 2.7 × 10⁻⁹ mol·L−1. The voltammograms recorded for the Acid Black 1 (AB1) dye showed that the azo groups of the dye were reduced on the carbon nanotube-modified electrode (CNTME), presenting a pair of redox peaks at −0.27 V and −0.24 V in the reverse scan. Under these experimental conditions, both dyes could be detected in the water sample, since the AG25 dye is reduced at −0.47 V. The presence of other hair dyes bearing other chromophore groups, such as Acid Black 1, Acid Red 33 and basic blue 99, did not interfere with the method, which showed an average recovery of 96.7 ± 3.5% (n = 5) for AG25 dye determination in the presence of all of these dyes. The method was successfully applied to tap water and wastewater samples collected from a water treatment plant.

1. Introduction

The extensive use of dyes and oxidizing agents for hair dye in the modern world is responsible for an endless variety of products on the market, which, in turn, seek to fulfill the quest for a diversity of colors, application processes and dye durability, while affording protection against damaged hair and safeguarding the health of human beings [1,2,3]. For this reason, available hair dyes are classified into three groups: temporary, semi-permanent and permanent, based on their fixation to hair using either non-oxidative processes or oxidative reactions [4] that interfere directly with the fixation time to the fibers.
Among them, permanent dyes have received the greatest attention, since the composition of these hair dyes includes ingredients of significant health concern, such as aromatic amines and other coupling compounds that are applied to the hair via chemical reaction in the presence of oxidative compounds [3,5]. On the other hand, semi-permanent dyes and temporary dyes represent less well studied synthetic hair dyes, bearing in their structures mainly azo groups, anthraquinone and nitro groups as chromophores [4,6]. These agents are deposited in the structure of the hair by ionic interactions or van der Waal’s forces [7] and have short fixation time to hair. They can be easily washed out and mixed with sewage, which, if not treated appropriately, can reach water reservoirs and drinking water pipelines.
Although the need for suitable analytical methods for hair dye determination is apparent, there have been few reports toward this end. The main studies have included applications of chromatographic methods for detecting oxidative dye intermediates in permanent hair colorants [8,9,10,11,12,13,14,15,16,17,18,19,20,21]. Despite the importance of temporary hair dyes as water contaminants, few analytical methods are available for their determination [22,23,24,25,26,27]. In addition, the procedure is usually quite cumbersome, with multiple stages of separation and extraction and detection limits higher than those required for their determination in environmental matrices.
The great versatility of multiwalled carbon nanotubes as electrode modifiers has attracted attention [28,29,30,31,32,33,34,35,36]. They are fulfilling the growing demand for highly sensitive, reliable and inexpensive sensors for the measurement of hazardous compounds in environmental samples, usually in highly diluted forms. The main advantages of this kind of electrode system are associated with their modest cost and wide possibilities for surface modifications. The ability to determine low levels of multiple kinds of analytes has been attributed mainly to electrocatalytic or adsorption effects due to their unique tubular nanostructure, large specific surface area, excellent conductivity, modifiable sidewalls, high conductivity and good biocompatibility [28,29,32,36].
The goal of the present paper is to investigate the voltammetric behavior of Acid Green 25 (AG25) dye (Figure 1), widely used in temporary hair dyes, on a glassy carbon electrode modified by multiwalled carbon nanotubes, with the aim of proposing a new methodology for its determination at low levels in acidic media. The proposed method is based on the reduction of anthraquinone groups present as a chromophore in the hair dye. The methodology is tested for the determination of hair dye content in tap water and wastewater collected from a water treatment station using the square wave voltammetric technique.
Figure 1. Chemical structure of Acid Green 25 hair dye (A), Acid Black 1 (B), Basic Blue 99 (C) and Acid Red 33 (D).
Chemosensors 03 00022 g001

2. Experimental Section

2.1. Chemicals

Ultra-pure reagents were purchased from Merck, and purified water derived from a Millipore Milli-Q system (resistivity 18.2 mΩ∙cm, pH 6.9) was used in the preparation of all solutions. Zero-point-zero four moles per liter of Britton-Robinson buffer (B-R) were used as the supporting electrolyte, prepared by mixing of 0.04 mol·L−1 of phosphoric acid (Merck, Darmstadt, Germany), 0.04 mol·L−1 of boric acid (Merck) and 0.04 mol·L−1 of acetic acid (Merck), adjusting the pH with a solution of 0.1 mol∙L−1 of NaOH (Synth). A solution (1 mol·L−1) of sodium hydroxide (Merck) was used for pH adjustment. Multi-walled carbon nanotubes, purity 95%, basis, d = (10 nm), l = (1–2 μm) (Dropsens, Asturias, Spain), were used in the electrode modification. Individual samples of hair dyes—AG25, Basic Blue 99 (BB99), Acid Red 33 (AR33) and Acid Black 1 (AB1)—were purchased from the Arianor Company and used to prepare standard solutions (1.0 × 10⁻³ mol·L−1) by dissolving each solid product in water. The solutions were kept in the refrigerator at 4 °C in the dark. More dilute solutions were prepared by serial dilution with water. The recovery studies of the analyte were performed using a sample of tap water with reagents added to form a of B-R buffer with a concentration of 0.04 mol·L−1. This water sample was then spiked with known amounts of the target analyte. All chemicals used in the HPLC-DAD measurements—formic acid, methanol and ammonium formate—were purchased from Sigma Aldrich.

2.2. Apparatus

Cyclic voltammetry (CV) and square wave voltammetry (SWV) were performed in an Autolab PGSTAT-30 (Eco Chemie) potentiostat/galvanostat system with an electrochemical software system (GPES 4.9) connected to a three-electrode cell, Metrohm Model 663 VA standard.
For the impedance measurements, a potentiostat/galvanostat connected to a frequency response analyzer (FRA) was employed in the frequency band from 100 kHz to 10 MHz. An open circuit potential (EOC) with 10-min stabilization, an amplitude of 10 mV (root mean square—rms) and 50 points/decade was set. Measurements were performed in B-R buffer (0.04 mol·L−1 pH 4.0) containing Acid Green 25 (AG25, 1.0 × 10⁻⁵ mol∙L−1). All of the electrochemical measurements were conducted at room temperature using a Faraday cage. A conventional three-electrode cell assembly consisting of a platinum wire as an auxiliary electrode and an Ag/AgCl (KClsat) electrode as a reference electrode was used. The working electrode was a glassy carbon electrode modified by multiwall carbon nanotubes (MWNTs).
The pH measurements were carried out on a pH meter (Corning, Model 140) with a double-junction glass electrode.
Analysis by high performance liquid chromatography with a detection diode array (HPLC-DAD) was performed on a Shimatzu chromatograph, model LC-10AT, equipped with two pumps, an automatic injector (injection volume 20 μL) and a diode array detector (Model SPD-M10AVP).

2.3. Preparation of the Electrode

A glassy carbon electrode was polished with alumina (0.3 μm, Buehler) dispersed on velour, then washed in an ultrasonic bath with deionized water for 10 min. The modification by MWNTs was conducted using the casting technique. First, a dispersed solution of 1.0 mg MWNTs in 1 mL of dimethylformamide (DMF) was prepared, and the mixture was submitted to sonication for 30 min at room temperature. An aliquot of 10 μL of this suspension was then added to the electrode surface, which was dried at 55 °C for 20 min [37].
The modified electrode (CNTME) was then submitted to a previous electrochemical treatment, transferring it to a solution from 0.1 mol·L−1 H2SO4, deoxygenating for 15 min with N2 flow and performing successive scans (10 cycles) in the potential range of −0.15 to 1.3 V.

2.4. Analysis of Dyes in Tap Water and Wastewater

A wastewater sample was collected from a water treatment plant (WTP) in Araraquara/São Paulo/Brazil. Aliquots of 25 mL of the sample were spiked with 0.047 g of AG25 dye. The sample was then filtered before analysis through a 0.45-μm PTFE filter. For analysis using SWV, 4 mL of the respective sample were added to the electrochemical cell containing 6 mL of 0.04 mol·L−1 of B-R buffer (pH 4.0). The sample was then submitted to deaerating for 15 min with nitrogen and the voltammogram recorded. The AG25 dye content in these samples was determined by the four successive standard addition method of AG25 dye.
HPLC-DAD detection was used to validate the proposed method [38]. All solutions were filtered before analysis through a 0.45-μm PTFE filter. Measurements were made under the following chromatographic conditions: a mobile phase constituted of 0.1% formic acid and 4 mmol·L−1 ammonium formate in water (A) and methanol with 0.1% formic acid and 4 mmol·L−1 ammonium formate (B) in a gradient (0–6 min 95% A, 6–13 min 5% A, 13–13.5 min 5% A, 13.5–15 min 95% A). The flow rate was 1.5 mL·min−1 in a C 18 column (Phenomenex) with a sample injection volume of 20 μL.

3. Results and Discussion

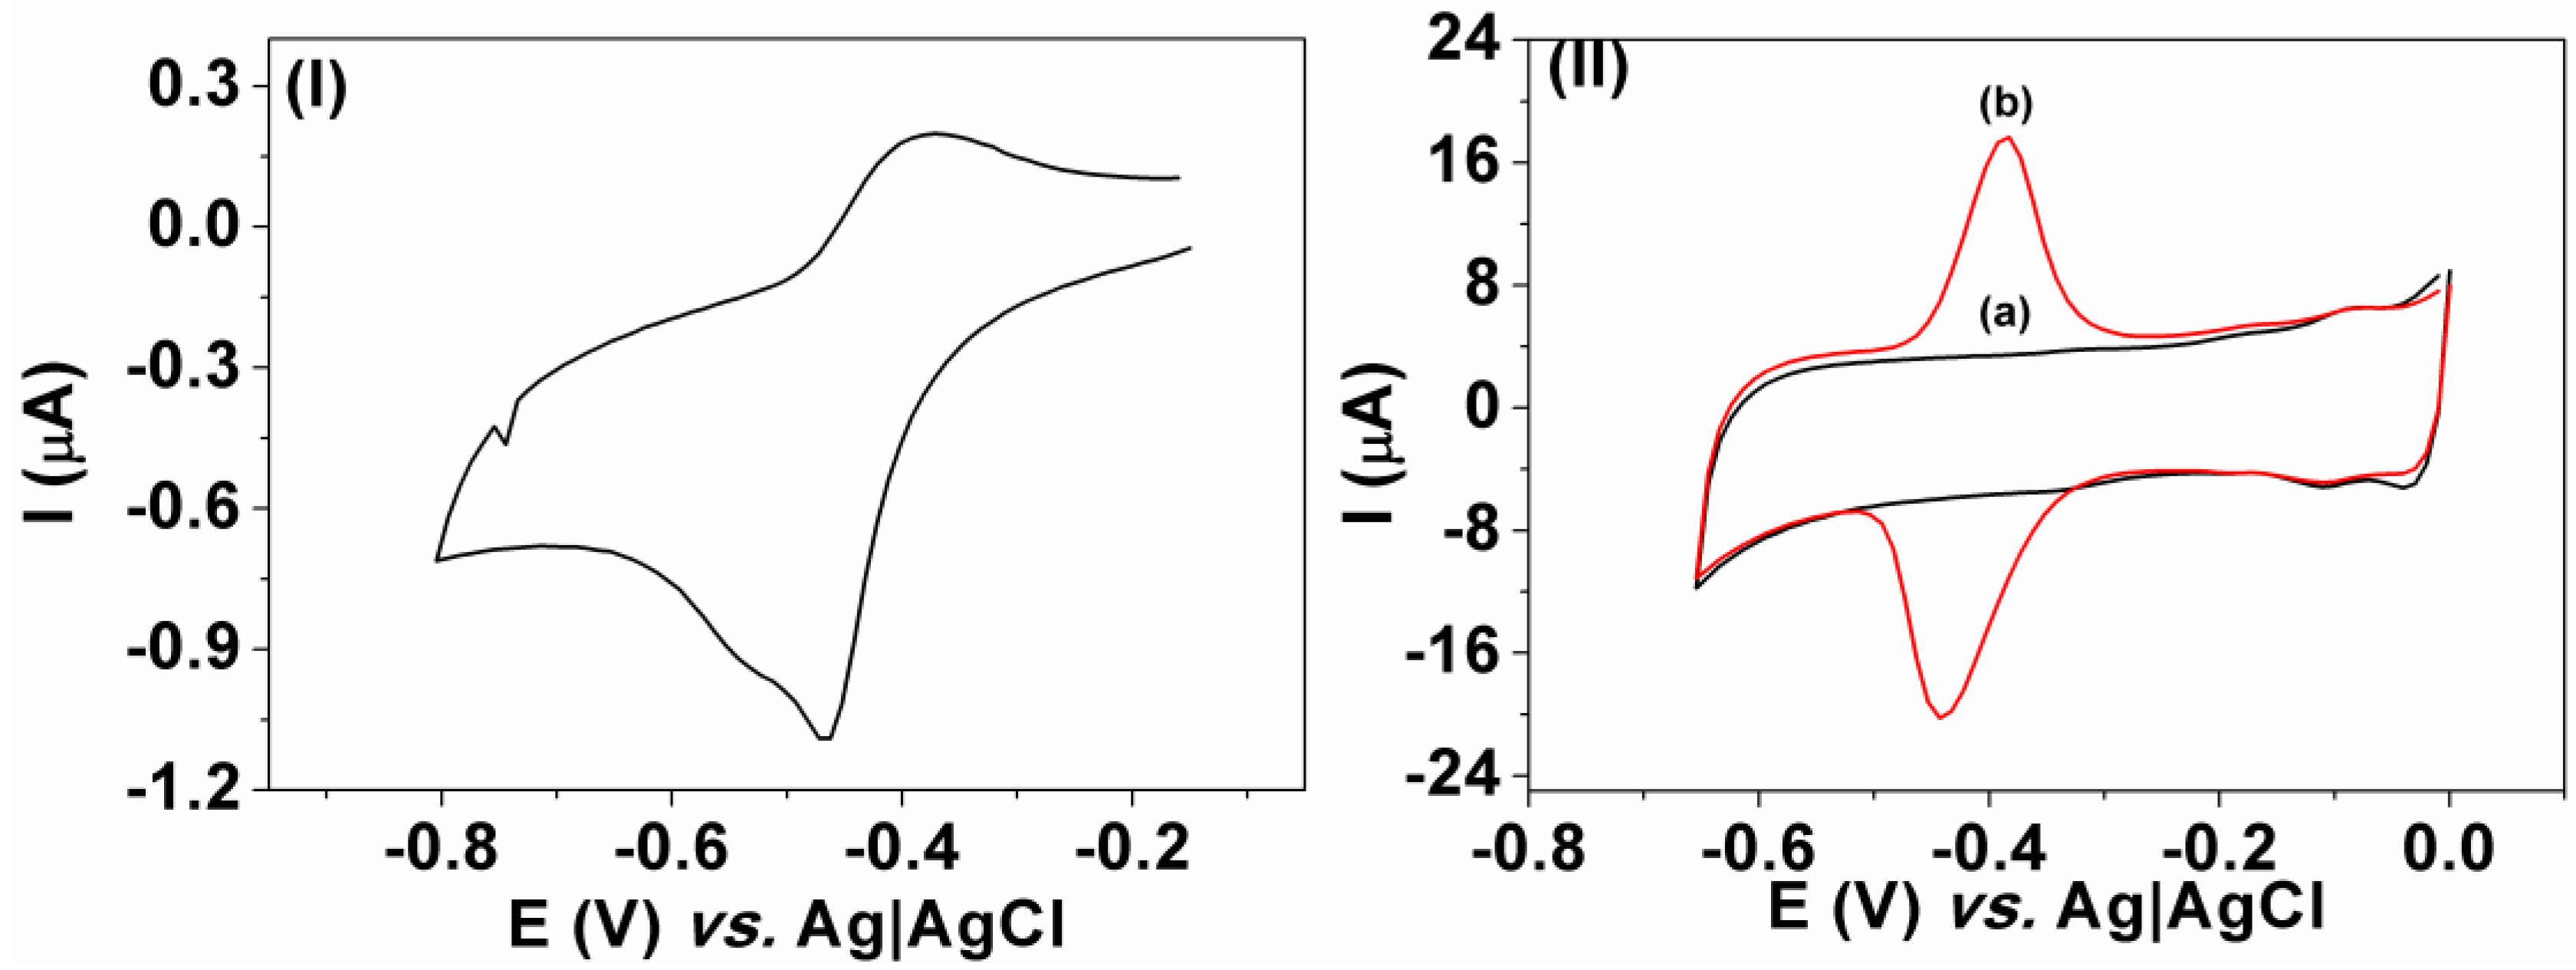
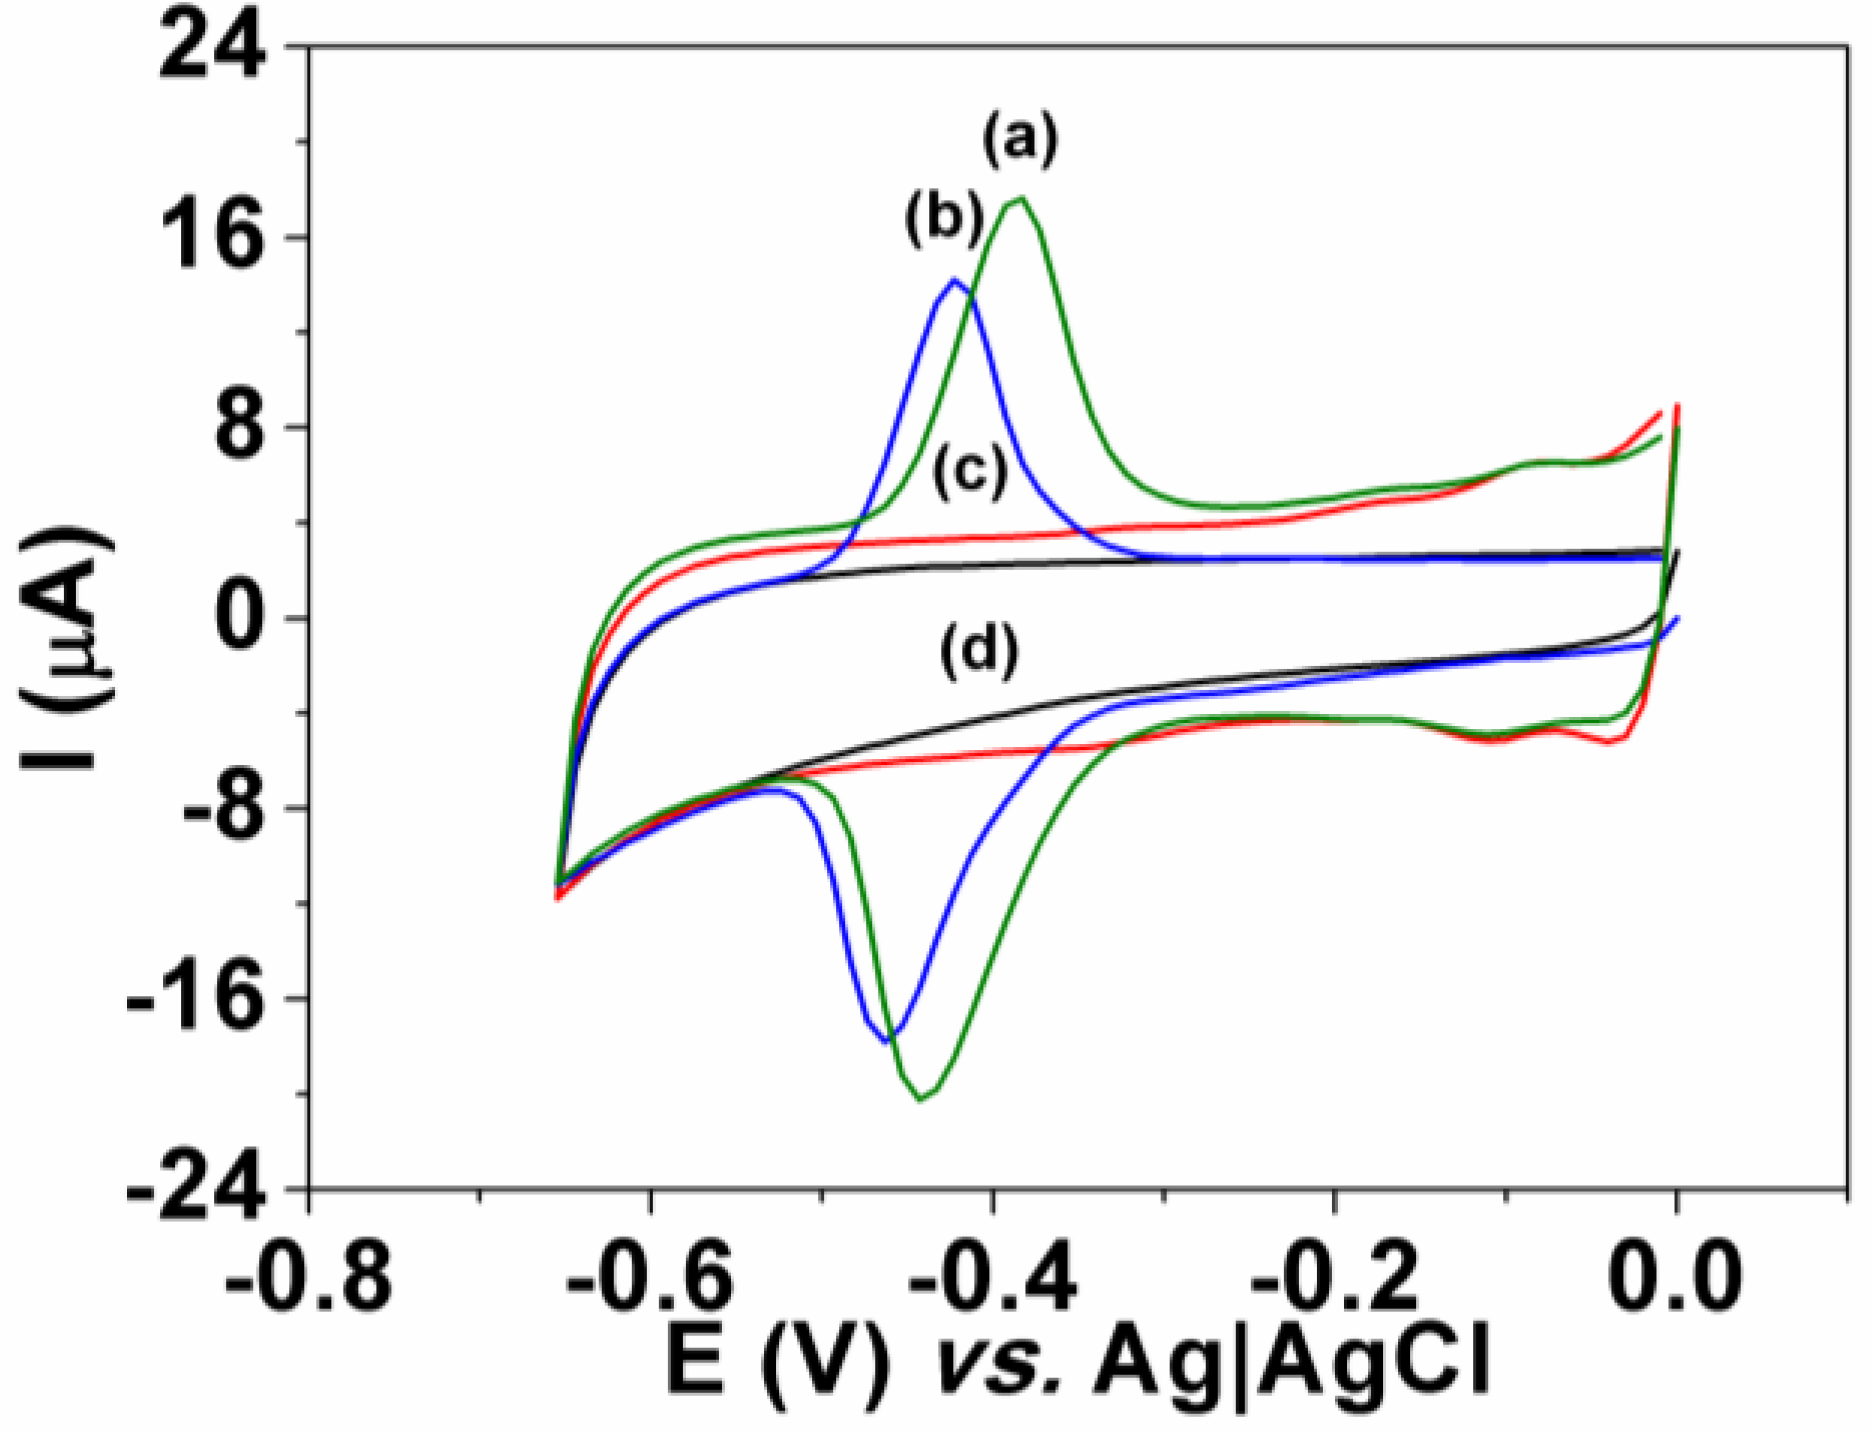
3.1. Voltammetric Behavior

The cyclic voltammograms obtained for the reduction of 1.0 × 10⁻⁵ mol·L−1 AG25 in of 0.04 mol·L−1 of B-R buffer, pH 6.0, at the glassy carbon electrode, before and after modification with MWNTs, are represented in Figure 2I. On the bare electrode, the AG25 dye was voltammetrically reduced on the glassy carbon electrode in a single-step process at around −0.47 V (Peak I), attributed to the reduction of the anthraquinone/hydroquinone group, as described in the literature [39,40,41]. A small voltammetric peak was seen on the reverse scan, where the anode-to-cathode peak height ratio (Ipa/Ipc = 0.18) and Epa − Epc = 105 mV clearly indicated that the process was not completely reversible under the surface of the glassy carbon electrode without modification [42]. In the cyclic voltammogram recorded at the CNTME, a well-resolved cathodic peak was detected at −0.44 V, to which an anodic peak at −0.39 V was associated in the backward scan (Figure 2II). The peak current ratio Ipa/Ipc was 0.96, and the peak to peak separation, ΔEp = Epa − Epc, was 30 mV. The results indicated that CNTMEs are an excellent platform for constructing an electrochemical sensor for dyes bearing anthraquinone groups and improve the reversibility of the electron transfer process due to their electrocatalytic activities [29] toward these species, enhancing the current yielded and reducing peak-to-peak separations in comparison with the bare electrode.
Figure 2. Cyclic voltammograms of the behavior of Acid Green 25 (AG25) upon its reduction on glassy carbon electrode (GCE) (I) and on carbon nanotube-modified electrode (CNTME) (II) in Britton-Robinson buffer (B-R) solution (a) and in 1 × 10⁻⁵ mol·L−1 of AG25 (b), pH 4.0, B-R buffer (0.04 mol·L−1), scan rate of 60 mV·s−1.
Chemosensors 03 00022 g002
In order to improve the response of the CNTME, the same electrode was subjected to scans in acid medium in order to remove material from the organic solvent (DMF) on its surface, thus increasing its area. The electrode was subjected to electrochemical cycling in the potential range between −0.15 and −1.3 V (10 cycles), ʋ = 50 mV·s−1, in deoxygenated H2SO4 solution (0.1 mol·L−1) with N2 for 15 min. Figure 3 compares the performance obtained for the activated and inactivated electrodes submitted to scanning in a 1.0 × 10⁻⁴ mol·L−1 solution of AG25. A slight increase in the peak current was observed for the activated CNTME, suggesting that reduction of the dye is favored on the activated surface. In order to confirm this effect on the charge-transfer resistance (Rct) and the double-layer capacitance (Cdl), measurements of electrochemical impedance spectroscopy (EIS) were carried out [39].
Figure 3. Cyclic voltammograms corresponding to the reduction of 1.0 × 10⁻⁵ mol·L−1 AG25 in 0.04 mol·L−1 of B-R buffer, pH 4.0 on: (a) activated CNTME; (b) inactivated CNTME; (c) CNTME activated only in the supporting electrolyte; and (d) inactivated CNTME in the presence of the electrolyte. Scan rate: 60 mV·s−1.
Chemosensors 03 00022 g003
The EIS measurements were performed in B-R buffer solution at pH 4.0 with 1.0 × 10⁻⁶ mol·L−1 AG25 using the activated and inactivated CNTME (Figure 4). The activated CNTME showed a decrease in charge-transfer resistance (CNTME activated = 67.5 kΩ and CNTME inactivated = 96.8 kΩ), confirming that the lowest charge-transfer resistance was on the activated electrode. For this reason, the activation process was adopted.
Figure 4. Nyquist plot registered for the CNTME (activated and inactivated) in 1.0 × 10⁻⁶ mol·L−1 of AG25, 0.04 mol·L−1 B-R buffer solution, pH = 4.0.
Chemosensors 03 00022 g004
The effect of the potential scan rate on the voltammetric response was investigated from 10 to 100 mV·s−1 at CNTME for 1.0 × 10⁻⁵ mol·L−1 of AG25 dye reduced in 0.04 mol·L−1 of B-R buffer, pH 4.0. Both the cathodic peak current and anodic peak current varied linearly with the square root of the scan rate (Ipc (A) = −9.737 × 10⁻⁶ + 8.187 × 10⁻⁶ A (mV·s−1)1/2 and Ipa (A) = −9.891 × 10⁻⁶ + 7.541 × 10⁻⁵ A (mV·s−1)1/2), suggesting that AG25 reduction follows a diffusion-controlled mechanism [43]. The dependence of the Ipa/Ipc ratio on the scan rate was equal to unity, showing that a reversible electron transfer reaction took place. From these results, a scan rate of 60 mV·s−1 was chosen for further studies.
The effects of pH on the peak potential (Epc) and cathodic peak current (Ipc) were also investigated, and the results obtained at a scan rate of 60 mV·s−1 are shown in Figure 5.
Figure 5. Effect of pH on the peak current ( ) and peak potential (▪) obtained from linear scan voltammograms of 1.0 × 10⁻⁵ mol·L−1 Ag25 dye in 0.04 mol·L−1 B-R buffer (pH 4.0).
Chemosensors 03 00022 g005
The peak potential shifted linearly to a more negative potential as the pH was increased. The slope of −65 mV·pH−1 obtained from ΔE/ΔpH suggests that a two electron-two proton transfer mechanism occurs in this pH range (Scheme 1).
Scheme 1. Mechanism of AG25 reduction at the CNTME.
Chemosensors 03 00022 g010
Taking into account that the process involves a transfer of two electrons (n = 2), according to the equation ΔE/ΔpH = (59.1 mV NH+/n)* and using the slope obtained, we can suggest that the number of protons (NH+) transferred may be two [39,43]. These results indicated that the anthraquinone reduction occurred in a similar way to that obtained on a glassy carbon electrode, except for the faster electron transfer and partial protonation, which changed the reversibility of the cyclic voltammograms obtained on the CNTME.
In addition, the Ipc values increased from pH 2.0 to 4.0 and decreased at higher pH values. This behavior can be explained by the fact that CNTME can present two pKa values (pKa1 = 3.5 to 4.1 and pKa2 = 5.8 to 7.1), depending on the number of carboxylic groups attached to its surface [44]. An electrostatic interaction can occur with the analyte, since the AG25 dye (pKa = 6.5) exhibits a positive charge in acidic media. At a pH above 4.0, there is a predominance of negative charges, and a negligible interaction is expected.

3.2. Interference

The interference of other dyes in the voltammetric process was studied by evaluating three typical dyes belonging to the family of acidic and basic hair dyes; these were taken as models of other dyes: Basic Blue 99 (BB99), Acid Red 33 (AR33) and Acid Black 1 (AB1), whose chemical structures are shown in Figure 1.
Cyclic voltammograms obtained for the reduction of 1 × 10⁻⁵ mol·L−1 AG25 dye in B-R buffer pH 4.0 at the CNTME were compared with voltammograms for the reduction of BB9, AR33 and AB1 under the same experimental conditions. The respective voltammograms are shown in Figure 6. The voltammograms recorded for the AB1 dye (Curve B) showed that the azo groups in the dye were reduced on the CNTME and present a pair of redox peaks at −0.27 V and −0.24 V in the reverse scan. Under these experimental conditions, both dyes could be detected in the water sample, since the AG25 dye is reduced at −0.47 V. On the other hand, the voltammetric curves obtained for AR33 (Curve C) and BB99 did not show any defined peak under the adopted experimental conditions (Figure 6), clearly indicating that neither dye interferes with measurements using this voltammetric sensor. The results indicate that use of the CNTME could be a good strategy to selectively monitor AG25 dye.
Figure 6. Cyclic voltammograms obtained for the reduction of 1.0 × 10⁻⁵ mol·L−1 AG25 dye (b), AB1 (c), AR33 (d), BB99 (e) and blank (a) in 0.04 mol·L−1 B-R buffer pH = 4.0. Scan rate: 60 mV·s−1.
Chemosensors 03 00022 g006

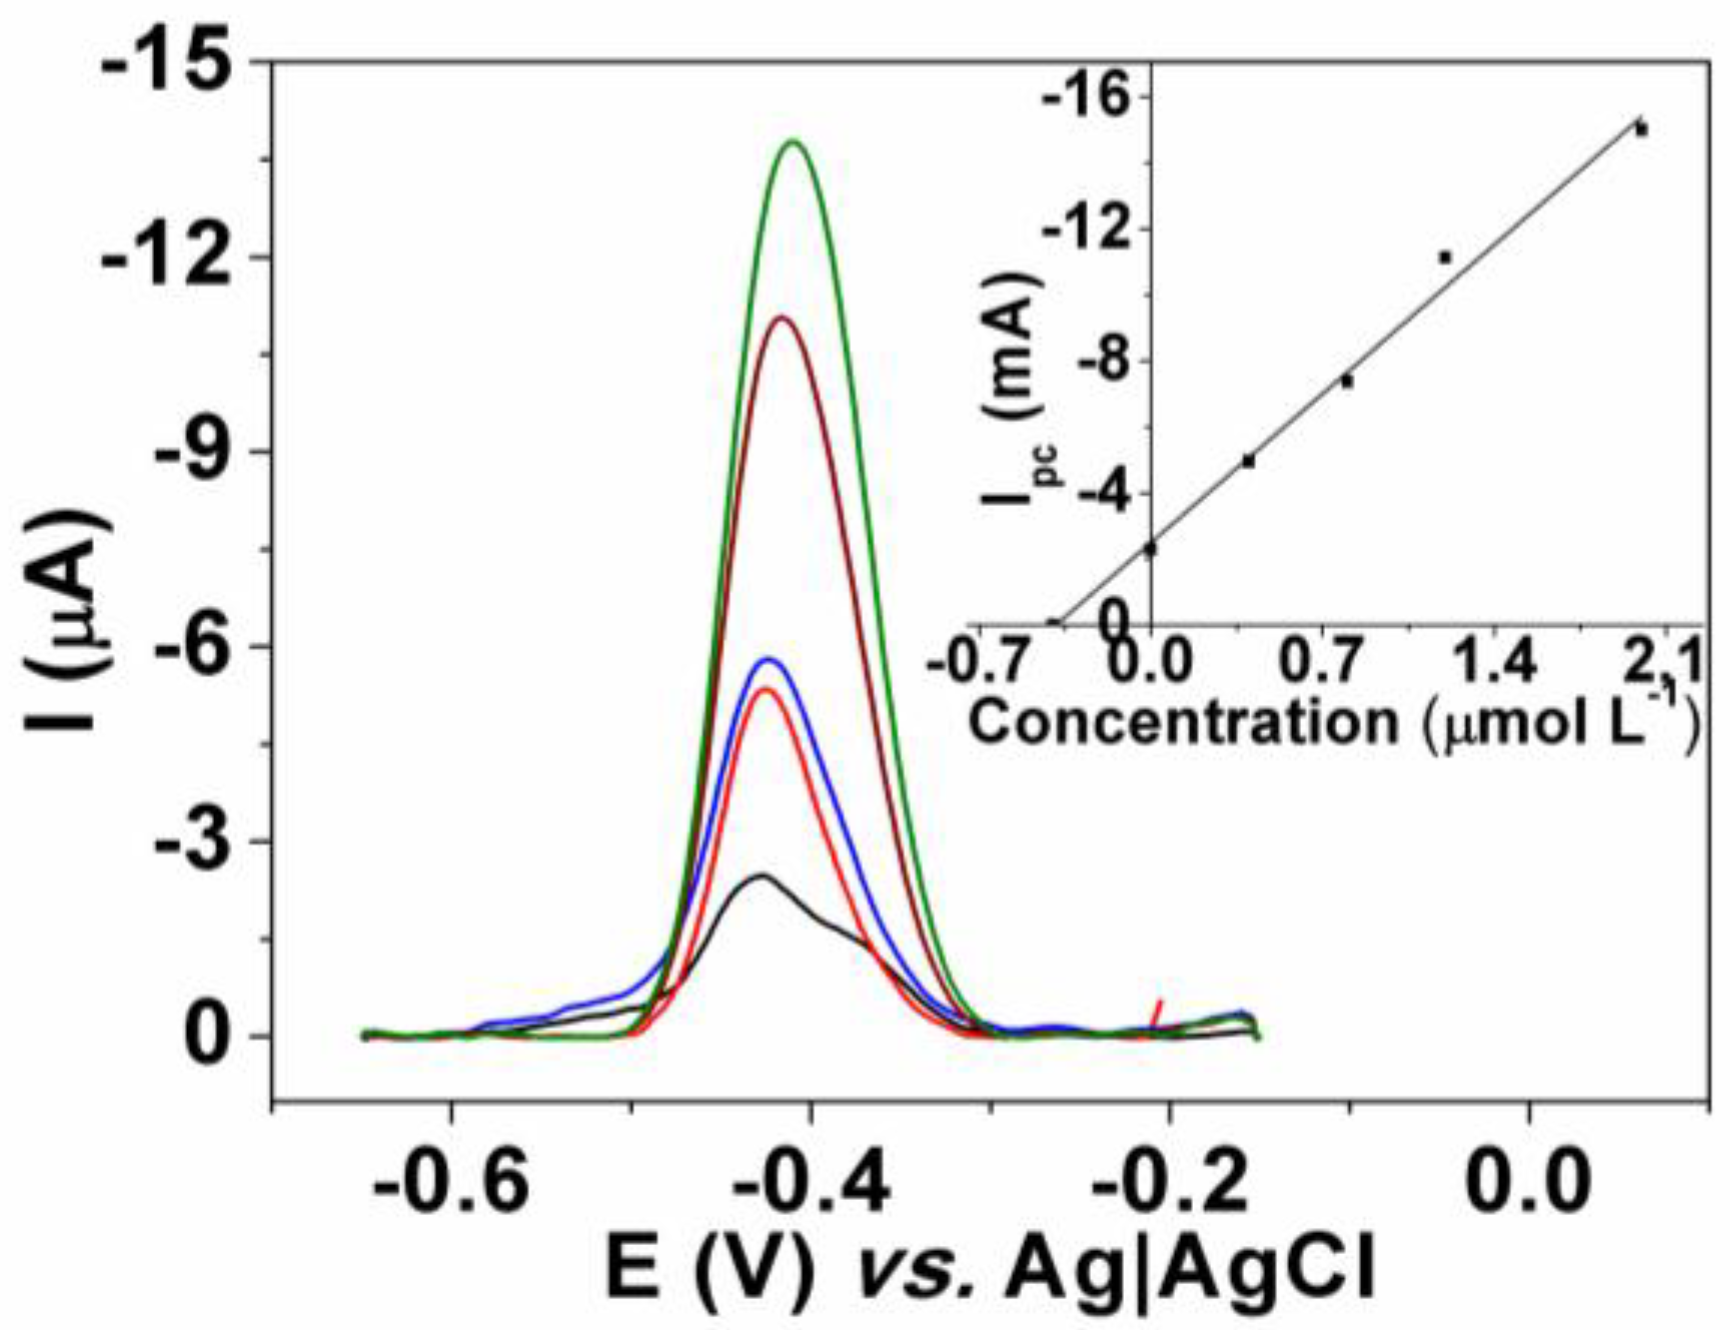
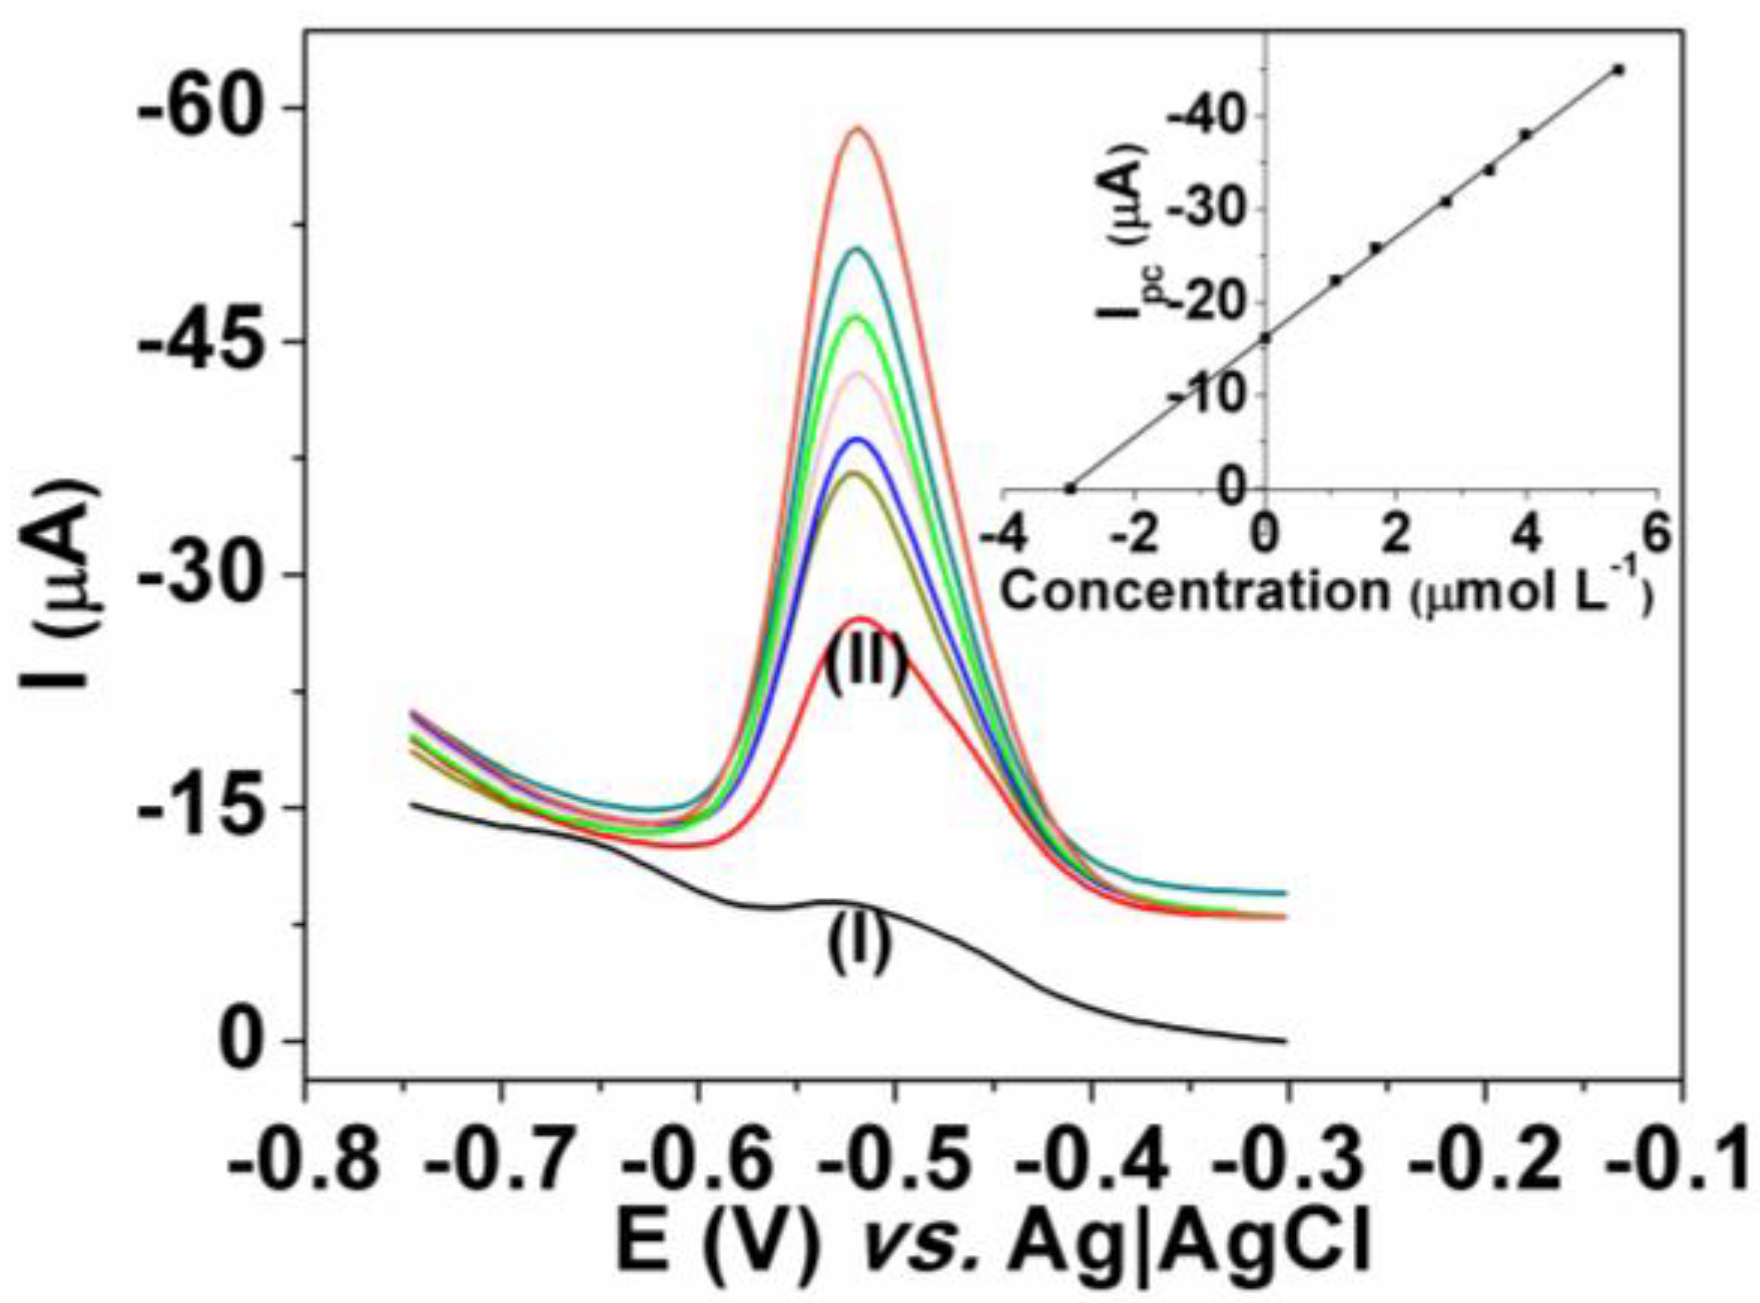
3.3. Dye Determination

SWV was used to improve the voltammetric detection of AG25 at the CNTME. The peak current obtained was dependent on various instrumental parameters, such as square-wave amplitude, square-wave frequency and step height. The experimental parameters evaluated by the SWV technique were frequency, f (from 10 to 60 Hz), scan increment, ΔEs (from 5 to 15 mV), and pulse amplitude, Esw (from 10 to 100 mV). The optimum voltammetric signal was obtained at a frequency of 10 Hz, a pulse amplitude of 60 mV and ΔEs of 5 mV, where a combination of higher resolution was associated with higher peak currents.
Using these optimized conditions, a well-defined reduction peak at about −0.43 V was detected, and the current increases while increasing the AG25 concentration from 1.0 × 10⁻⁷ to 7.0 × 10⁻⁶ mol∙L−1 AG25 dye in 0.04 mol∙L−1 B-R buffer pH = 4, as shown in Figure 7. An analytical curve (insert of Figure 7) was fitted by the equation: Ipc (μA) = 6.02 × 10⁻⁶ × [AG25] + 5.1 × 10⁻⁶ (R2 = 0.99). The limit of detection (LOD) and limit of quantification (LOQ) obtained were 2.7 × 10⁻⁹ mol∙L−1 and 8.9 × 10⁻⁹ mol∙L−1, respectively.
Figure 7. Square wave voltammetry (SWV) obtained under optimized conditions in a 0.04 mol∙L−1 B-R buffer solution with increasing concentrations of AG25: (a) blank; (b) 1.0 × 10⁻⁷; (c) 5 × 10⁻⁷; (d) 1 × 10⁻⁶; (e) 3 × 10⁻⁶; (f) 5 × 10⁻⁶; and (g) to 7.0 × 10⁻⁶ mol∙L−1. Inset: relation between Ipc vs. concentration of AG25. Parameters: pH 4.0, ƒ = 10 Hz and ΔE = 60 mV.
Chemosensors 03 00022 g007

3.4. Analytical Application

The method was applied to determine AG25 in a sample of tap water deliberately contaminated with 4.0 × 10⁻⁷ mol·L−1 of AG25 and 1.0 × 10⁻⁶ mol·L−1 of the BB99, AR33 and AB1 dyes. The AG25 dye was analyzed using the standard addition method with the addition of 4.0 × 10⁻⁷ mol·L−1 AG25 dye. The respective voltammograms are shown in Figure 8. Analysis of the peak current showed an average recovery (n = 5) of 96.7% ± 3.5%.
Figure 8. SWV in 0.04 mol∙L−1 B-R buffer spiked with increasing amounts of AG25. Insert: relation between Ipc vs. concentration AG25. Parameters: pH 4.0, ƒ = 10 Hz and ΔE = 60 mV.
Chemosensors 03 00022 g008
The applicability of the CNTME was also tested in a sample collected from a water treatment station. According to the procedure described in the Experimental Section, an aliquot of the sample was used to determine AG25 without any pretreatment. The determinations were made in triplicate by applying the method of standard addition, where the voltammograms showed well-defined peaks and an excellent linear relationship for standard additions in the concentration range between 1.07 and 5.40 μmol·L−1, as shown in Figure 9.
Figure 9. SWV for the CNTME in 0.04 mol·L−1 B-R buffer (pH 4.0) (I), plus 40 μL of added sample (II) and successive standard additions of AG25 between 1.07 and 5.40 μmol·L−1.
Chemosensors 03 00022 g009
To validate the method, the sample was analyzed by HPLC-DAD. The results for the two methods are shown in Table 1. The Student’s t-test indicated a value of 0.05, which was less than the critical value (4.30). This result shows that there is no significant difference (at a 95% confidence level) between the two methods.
Table 1. Determination of AG25 in a sample collected at a water treatment station using the proposed method and the HPLC-DAD technique.
MethodCNTMEHPLC-DADN
Found values (10−4 mol∙L−1)2.98 ± 0.0382.96 ± 0.3213

4. Conclusions

A voltammetric sensor based on multiwalled carbon nanotubes (CNTME) prepared and pretreated with sulfuric acid can be a promising tool for direct AG25 hair dye determination. The sensor can be used for direct applications in tap and wastewater samples without complex prior treatment. Good analytical performance was demonstrated. The proposed CNTME is characterized by a low detection limit, good sensitivity and excellent stability. This sensor allows the determination of acid dye anthraquinone groups even in the presence of other hair dyes bearing azo and amine groups, which do not interfere with the voltammetric response.

Acknowledgments

The authors are grateful for financial support from Fundação de Amparo à Pesquisa do Estado de São Paulo (process 2008/10449-7), CNPq and CAPES.

Author Contributions

A.O. characterized the sensor and built the analytical curve. F.H. and J.F. validated the method. M.Z. wrote the manuscript. All authors discussed the results and commented on the manuscript.

Conflicts of Interest

The authors declare no conflict of interest.

References

  1. Hueber-Beckera, F.; Nohyneka, G.J.; Meulingb, W.J.A.; Benech-Kiefferc, F.; Toutain, H. Human systemic exposure to a [14C]-para-phenylenediamine-containing oxidative hair dye and correlation with in vitro percutaneous absorption in human or pig skin. Food Chem. Toxicol. 2004, 42, 1227–1236. [Google Scholar] [CrossRef] [PubMed]
  2. Bouillon, C.; Wilkinson, J. The Science of Hair Care, 2nd ed.; Francis & Taylor: London, UK, 2005; Volume 1. [Google Scholar]
  3. Robbins, C.R. Chemical and Physical Behavior of Human Hair, 4th ed.; Springer-Verlag: Berlin, Germany, 2002. [Google Scholar]
  4. Chisvert, A.; Cháfer, A.; Salvador, A. 4.3—Hair Dyes in Cosmetics. Regulatory Aspects and Analytical Methods, in Analysis of Cosmetic Products; Chisvert, A., Cháfer, A., Salvador, A., Eds.; Elsevier: Amsterdam, The Netherlands, 2007; pp. 190–209. [Google Scholar]
  5. Corbett, J.F. Chemistry of hair colorant processesScience as an aid to formulation and development. J. Soc. Cosmet. Chem. 1984, 35, 297–310. [Google Scholar]
  6. Lademanna, J.; Richtera, H.; Jacobia, U.; Patzelta, A.; Hueber-Beckerb, F.; Ribaudc, C.; Benech-Kiefferc, F.; Dufourb, E.K.; Sterrya, W.; Schaefera, H. Human percutaneous absorption of a direct hair dye comparing in vitro and in vivo results: Implications for safety assessment and animal testing. Food Chem. Toxicol. 2008, 46, 2214–2223. [Google Scholar] [CrossRef] [PubMed]
  7. Corbett, J.F. Principles of Efficients (r2) Greater Than 0.990 Was Obtained in the Cosmetics for the Dermatologist; Frost, S.N.H.F., Ed.; C.V. Mosby: London, UK, 1982. [Google Scholar]
  8. Choudhary, G. Gas-liquid chromatographic determination of toxic diamines in permanent hair dyes. J. Chromatogr. A 1980, 193, 277–284. [Google Scholar] [CrossRef]
  9. Tokuda, H.; Kimura, Y.; Takano, S. Determination of dye intermediates in oxidative hair dyes by fused-silica capillary gas chromatography. J. Chromatogr. A 1986, 367, 345–356. [Google Scholar] [CrossRef]
  10. Schultz, B. Determination of 4-aminophenol in water by high-performance liquid chromatography with fluorescence detection. J. Chromatogr. A 1984, 299, 484–486. [Google Scholar] [CrossRef]
  11. Dowle, C.J.; Malyan, A.P.; Matheson, A.M. Separation of the ortho, meta and para isomers of aminophenol by high-performance liquid chromatography. Analyst 1990, 115, 105–107. [Google Scholar] [CrossRef]
  12. Gennaro, M.C.; Bertolo, P.L.; Marengo, E. Determination of aromatic amines at trace levels by ion interaction reagent reversed-phase high-performance liquid chromatography: Analysis of hair dyes and other water-soluble dyes. J. Chromatogr. A 1990, 518, 149–156. [Google Scholar] [CrossRef]
  13. Andrisano, V.; Gotti, R.; DiPietra, A.M.; Cavrini, V. Analysis of basic hair dyes by HPLC with on-line post-column photochemical derivatisation. Chromatographia 1994, 39, 138–145. [Google Scholar] [CrossRef]
  14. Andrisano, V.; Gotti, R.; Roveri, P.; Cavrini, V. Analysis of semipermanent hair dyes by HPLC with on-line post-column photochemical derivatisation. Chromatographia 1997, 44, 431–437. [Google Scholar] [CrossRef]
  15. Prchal, V.; Krejčová, J.; Vyskočil, V.; Pecková, K.; Fischer, J.; Zima, J.; Barek, J. Determination of 4-Aminobiphenyl and 4-Nitrobiphenyl by HPLC with Electrochemical, UV Spectrophotometric, and Fluorescent Detection. Int. J. Electrochem. Sci. 2013, 8, 2524–2535. [Google Scholar]
  16. Phirke, S.S.; Saha, M. Determination of Lawsone by HPTLC in Lawsonia Inermis L. Callus and Plantlets Regenerated in vitro. Asian J. Chem. 2014, 26, 764–766. [Google Scholar]
  17. Goetz, N.; Lasserre, P.; Boré, P.; Kalopissis, G. Percutaneous absorption of p-phenylene diamine during an actual hair dyeing procedure. Int. J. Cosmet. Sci. 1988, 10, 63–73. [Google Scholar] [CrossRef] [PubMed]
  18. Akyüz, M.; Ata, Ş. Determination of aromatic amines in hair dye and henna samples by ion-pair extraction and gas chromatography-mass spectrometry. J. Pharm. Biomed. Anal. 2008, 47, 68–80. [Google Scholar] [CrossRef] [PubMed]
  19. Sainthorant, C.; Morin, Ph.; Dreux, M.; Baudry, A.; Goetz, N. Separation of phenylenediamine, phenol and aminophenol derivatives by micellar electrokinetic chromatography Comparison of the role of anionic and cationic surfactants. J. Chromatogr. A 1995, 717, 167–179. [Google Scholar] [CrossRef]
  20. Fanali, S. Host-guest complexation in capillary isotachophoresis: II. Determination of aminophenol and diaminobenzene isomers in permanent hair colorants by using capillary isotachophoresis. J. Chromatogr. A 1989, 470, 123–129. [Google Scholar] [CrossRef]
  21. Lin, C.-E.; Chen, Y.-T.; Wang, T.-Z. Separation of benzenediamines, benzenediols and aminophenols in oxidative hair dyes by micellar electrokinetic chromatography using cationic surfactants. J. Chromatogr. A 1999, 837, 241–252. [Google Scholar] [CrossRef]
  22. Mariani, E.; Neuhoff, C.; Villa, C. Application of high-performance liquid chromatography in the analysis of direct dyes in semipermanent hair colouring cosmetics. Int. J. Cosmet. Sci. 1997, 19, 51–63. [Google Scholar] [CrossRef] [PubMed]
  23. Mariani, E.; Bargagna, A.; Longobardi, M.; Dorato, S. Application of TLC and HPTLC in the analysis of semipermanent hair dyes. Int. J. Cosmet. Sci. 1994, 16, 17–27. [Google Scholar] [CrossRef]
  24. Scarpi, C.; Ninci, F.; Centini, M.; Anselmi, C. High-performance liquid chromatography determination of direct and temporary dyes in natural hair colourings. J. Chromatogr. A 1998, 796, 319–325. [Google Scholar] [CrossRef] [PubMed]
  25. De Oliveira, R.A.G.; Zanoni, M.V.B. Highly Ordered TiO2 Nanotubes for Electrochemical Sensing of Hair Dye Basic Brown 17. Electroanalysis 2013, 25, 2507–2514. [Google Scholar] [CrossRef]
  26. Hudari, F.F.; Almeida, L.C.; Silva, B.F.; Zanoni, M.V.B. Voltammetric sensor for simultaneous determination of p-phenylenediamine and resorcinol in permanent hair dyeing and tap water by composite carbon nanotubes/chitosan modified electrode. Microchem. J. 2014, 116, 261–268. [Google Scholar] [CrossRef]
  27. Zhong, Z.; Li, G.; Wu, Y.; Luo, Z.; Zhu, B. Ultrasound-assisted matrix solid-phase dispersive liquid extraction for the determination of intermediates in hair dyes with ion chromatography. Anal. Chim. Acta 2012, 752, 53–61. [Google Scholar] [CrossRef] [PubMed]
  28. Iijima, S. Helical microtubules of graphitic carbon. Nature 1991, 354, 56–58. [Google Scholar] [CrossRef]
  29. Hu, C.; Hu, S. Carbon Nanotube-Based Electrochemical Sensors: Principles and Applications in Biomedical Systems. J. Sens. 2009, 2009. [Google Scholar] [CrossRef]
  30. Salimi, A.; Hallaj, R. Catalytic oxidation of thiols at preheated glassy carbon electrode modified with abrasive immobilization of multiwall carbon nanotubes: Applications to amperometric detection of thiocytosine, L-cysteine and glutathione. Talanta 2005, 66, 967–975. [Google Scholar] [CrossRef] [PubMed]
  31. Salimi, A.; Mahdioun, M.; Noorbakhsh, A.; Abdolmaleki, A.; Ghavami, R. A novel non-enzymatic hydrogen peroxide sensor based on single walled carbon nanotubes–manganese complex modified glassy carbon electrode. Electrochim. Acta 2011, 56, 3387–3394. [Google Scholar] [CrossRef]
  32. Shahrokhian, S.; Asadian, E. Simultaneous voltammetric determination of ascorbic acid, acetaminophen and isoniazid using thionine immobilized multi-walled carbon nanotube modified carbon paste electrode. Electrochim. Acta 2010, 55, 666–672. [Google Scholar] [CrossRef]
  33. Chauhan, N.; Pundir, C.S. An amperometric biosensor based on acetylcholinesterase immobilized onto iron oxide nanoparticles/multi-walled carbon nanotubes modified gold electrode for measurement of organophosphorus insecticides. Anal. Chim. Acta 2011, 701, 66–74. [Google Scholar] [CrossRef] [PubMed]
  34. Raoof, J.B.; Ojani, R.; Amiri-Aref, M.; Baghayeri, M. Electrodeposition of quercetin at a multi-walled carbon nanotubes modified glassy carbon electrode as a novel and efficient voltammetric sensor for simultaneous determination of levodopa, uric acid and tyramine. Sens. Actuators B Chem. 2012, 166–167, 508–518. [Google Scholar] [CrossRef]
  35. Keihan, A.H.; Sajjadi, S. Improvement of the electrochemical and electrocatalytic behavior of Prussian blue/carbon nanotubes composite via ionic liquid treatment. Electrochim. Acta 2013, 113, 803–809. [Google Scholar] [CrossRef]
  36. Corrêa, C.C.; Jannuzzi, S.A.V.; Santhiago, M.; Timm, R.A.; Formiga, A.L.B.; Kubota, L.T. Modified electrode using multi-walled carbon nanotubes and a metallopolymer for amperometric detection of L-cysteine. Electrochim. Acta 2013, 113, 332–339. [Google Scholar] [CrossRef]
  37. Jain, R.; Sharma, S. Glassy carbon electrode modified with multi-walled carbon nanotubes sensor for the quantification of antihistamine drug pheniramine in solubilized systems. J. Pharm. Anal. 2012, 2, 56–61. [Google Scholar] [CrossRef]
  38. Jia, W.; Chu, X.; Ling, Y.; Huang, J.; Lin, Y.; Chang, J. Simultaneous determination of dyes in wines by HPLC coupled to quadrupole orbitrap mass spectrometry. J. Sep. Sci. 2014, 37, 782–791. [Google Scholar] [CrossRef] [PubMed]
  39. Carneiro, P.A.; Boralle, N.; Stradiotto, N.R.; Furlan, M.; Zanoni, M.V.B. Decolourization of anthraquinone reactive dye by electrochemical reduction on reticulated glassy carbon electrode. J. Braz. Chem. Soc. 2004, 15, 587–594. [Google Scholar] [CrossRef]
  40. Du, H.; Ye, J.; Zhang, J.; Huang, X.; Yu, C. A voltammetric sensor based on graphene-modified electrode for simultaneous determination of catechol and hydroquinone. J. Electroanal. Chem. 2011, 650, 209–213. [Google Scholar] [CrossRef]
  41. Radhakrishnan, S.; Krishnamoorthy, K.; Sekar, C.; Wilson, J.; Kim, S.J. A promising electrochemical sensing platform based on ternary composite of polyaniline-Fe2O3-reduced graphene oxide for sensitive hydroquinone determination. Chem. Eng. J. 2015, 259, 594–602. [Google Scholar] [CrossRef]
  42. Bard, A.J.; Faulkner, L.R. Electrochemical Methods: Fundamentals and Applications, 2nd ed.; John Wiley: New York, NY, USA, 2001. [Google Scholar]
  43. Kumar, A.S.; Swetha, P. Simple adsorption of anthraquinone on carbon nanotube modified electrode and its efficient electrochemical behaviors. Colloids Surf. A Physicochem. Eng. Asp. 2011, 384, 597–604. [Google Scholar] [CrossRef]
  44. Mansor, N.B.T.A.; Rinaldi, J.-P.T.A.; Reiche, S.; Kutty, M.G. Chemically Modified Multi-Walled Carbon Nanotubes (MWCNTs) with Anchored Acidic Groups. Sains Malays. 2012, 41, 603–609. [Google Scholar]

