Communication

TiO2 Nanotubes Membrane Flexible Sensor for Low-Temperature H2S Detection

Comisión Nacional de Energía Atómica, CAC, Av. Gral. Paz, Buenos Aires 1499 (1650), Argentina
*
Author to whom correspondence should be addressed.
Chemosensors 2016, 4(3), 15; https://doi.org/10.3390/chemosensors4030015
Submission received: 9 July 2016 / Revised: 27 July 2016 / Accepted: 13 August 2016 / Published: 18 August 2016

Abstract

:
This paper presents the fabrication and characterization of a flexible gas sensor based on TiO2 nanotubes membrane, onto which array interdigitated gold electrodes in one side and a common heater in the backside were obtained using conventional microfabrication techniques. This was used to detect hydrogen sulphide within a concentration range of 6–38 ppm. The response to low concentrations of H2S at low temperature and good stability make the sensor a promising candidate for practical applications. These results support the proposal that the TiO2 nanotubes membrane flexible sensors are promising in portable on-site detection based on low cost nanomaterials.

Graphical Abstract

1. Introduction

Hydrogen sulphide (H2S) is a colorless, toxic, corrosive and flammable gas which smells like bad eggs [1]. Is often produced in coal, coal oil or natural gas manufacturing, crude petroleum, volcanic gases, coils, natural gas, hot springs [2]. Other sources from industrial activities include food processing, cooking ovens, craft paper mills, tanneries, and petroleum refineries [3]. Produced during anaerobic digestion of organic matter, wastes or recyclable polymeric materials [4,5]. The threshold limit value (TLV) is 10 ppm [6]. Thus, real time detection in the concentration range (<15 ppm) is the most important for the human health safety. Produces damage in breathing system to human and animals. Further, it can cause a malodor-nuisance problem even at relatively low concentrations [7]. H2S is an intermediate in the synthesis of organothiol compounds and elemental sulphur. The use of metal oxide semiconductor (MOX) to detect toxic gases has attracted considerable interest [8,9,10,11,12]. A method for measuring the quantity of H2S using a MOX gas sensor is desirable. In recent years, great efforts have been devoted to the development of portable gas sensor device. These devices require new features such as low-power consumption, low-cost and low-weight in addition than good sensitivity, selectivity and stability. In particular, the use of substrates flexible for manufacturing gas sensors could be a potential alternative to the more expensive silicon technology [13,14,15,16].
Among the various reported flexible substrates, polymers including polyimide (PI), polyethylene terephthalate (PET), poly-dimethylsiloxane (PDMS), and polyethylene naphthalate (PEN). PI has attracted immense interest because of its extraordinary thermal, mechanical, and chemical properties. Particularly among the various flexible substrate, we selected Kapton® for its excellent thermal stability, solvent resistance, low cost, electronic and mechanical properties including high Young’s modulus (2.5 GPa), wide operating work temperature (−269 to 400 °C), high resistivity (1.0 × 10¹⁷ Ω·cm), low coefficient of thermal expansion (20 ppm·°C−1), and low thermal conductivity (0.12 Wm−1·K−1) [17].
In the present paper, a new approach for developing flexible gas sensors based on TiO2 nanotube membrane is presented, which is used to research gas sensor tests on H2S at low temperature.

2. Experimental Methods

2.1. TiO2 Membrane Preparation

The highly ordered uniform TiO2 nanotubes membrane array was grown by a two-step electrochemical anodization method of a Ti metal sheet. The detailed preparation of TiO2 nanotubes membrane was reported in our previous work [18].
The samples were characterized by scanning electron microscopy (SEM), transmission electron microscopy (TEM), X-ray diffraction (XRD), Raman Spectroscopy and BET. Scanning electron microscope (Zeiss Supra40 Gemini) was employed for the morphological characterization of the TiO2 nanotubes samples. Transmission electron microscopy (TEM) observation was carried out on a Philips CM200 microscope operating at an accelerating voltage of 160 kV. ImageJ software was used to determine the diameter and length of the TiO2 nanotubes.
XRD patterns were recorded at room temperature with Cu Kα radiation of 0.15418 nm in a diffractometer (PANalytical model Empyrean) having theta-theta configuration and a graphite secondary-beam monochromator, using a generator voltage of 40 kV and current of 40 mA. The data were collected for scattering angles (2θ) ranging from 20° to 55° with a step of 0.026° for 2 s per point.
Raman measurements were carried out using a LabRAM HR Raman system (Horiba Jobin Yvon) spectrometer equipped with a microscope objective and a charge coupled device detector (CCD). The Raman spectra were recorded in a backscattering configuration using 514.5 nm line of an Ar+ laser as an excitation line.
The surface area was calculated using the Brunauer–Emmett–Teller (BET) method based on the adsorption data. The BET specific surface area and pore distribution of the samples which were degassed at 150 °C for 8 h were determined by N2 adsorption/desorption method, which were carried out on a Micromeritics Accelerated Surface Area and Porosimetry System ASAP 2020 v 3.01 instrument.

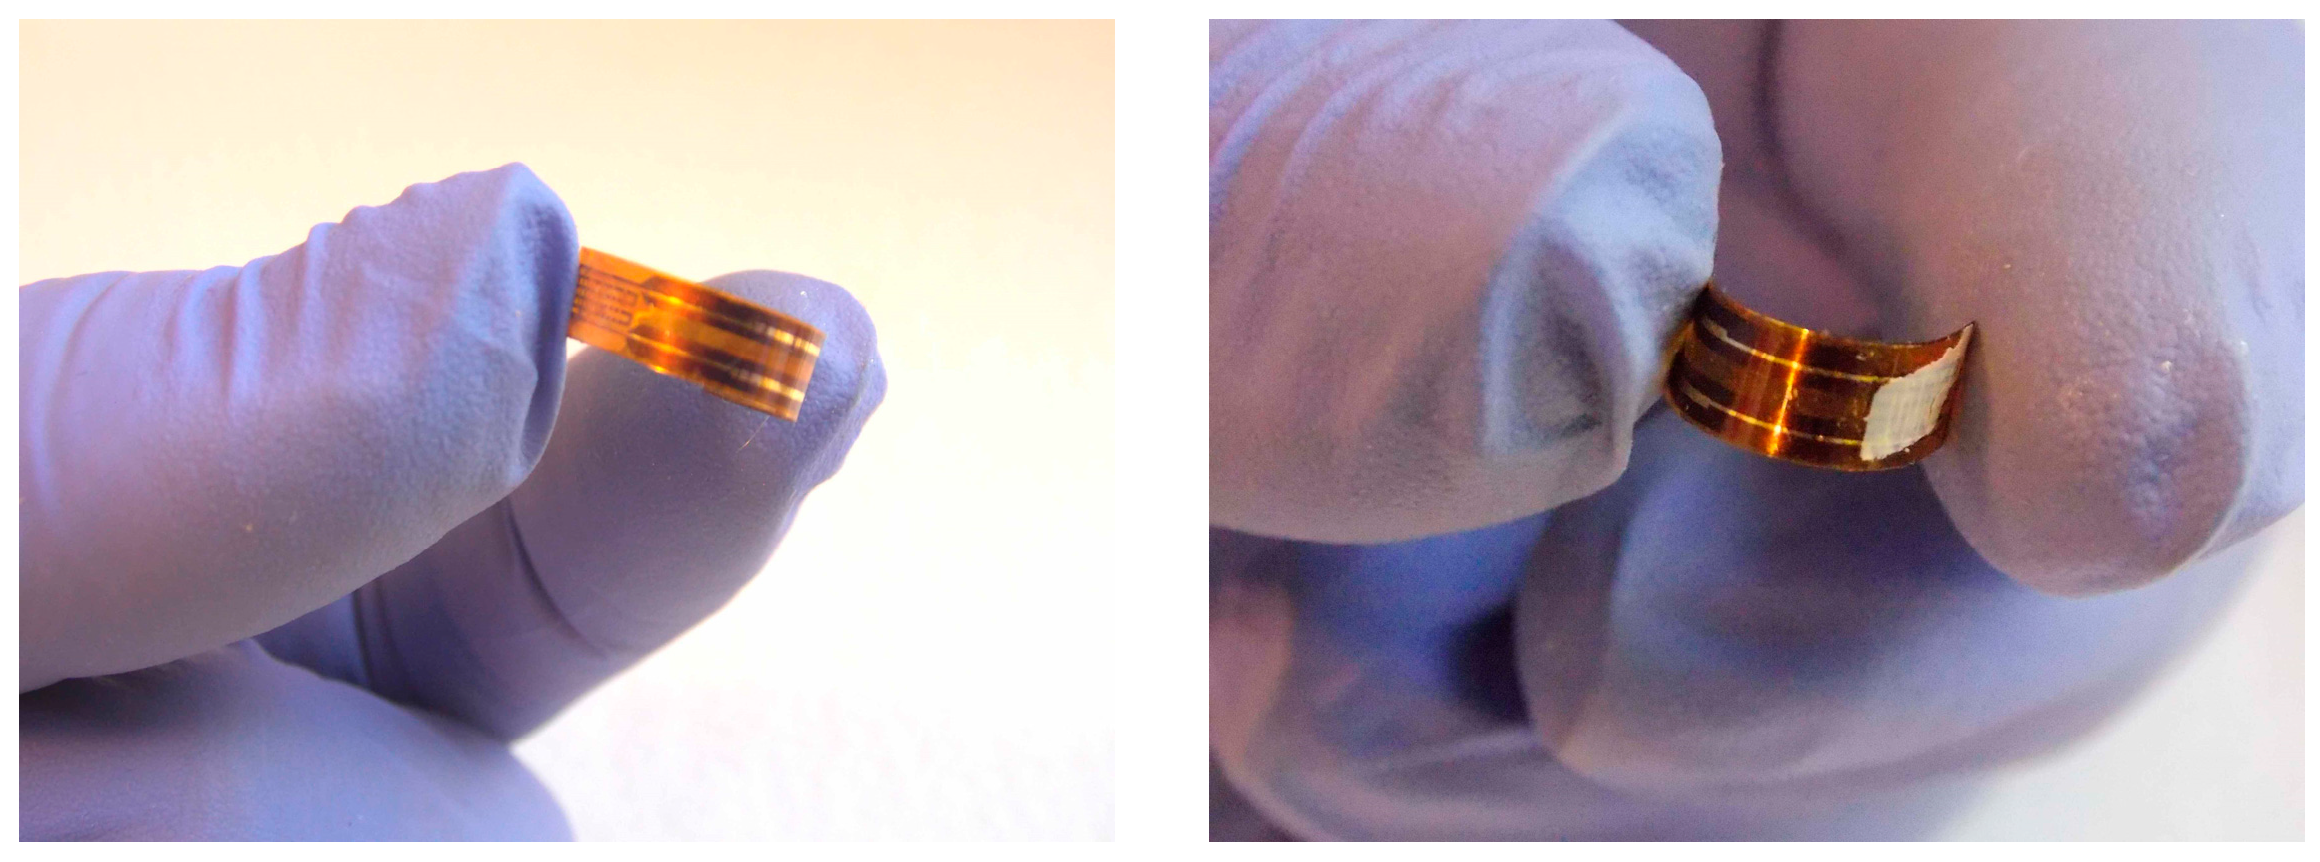
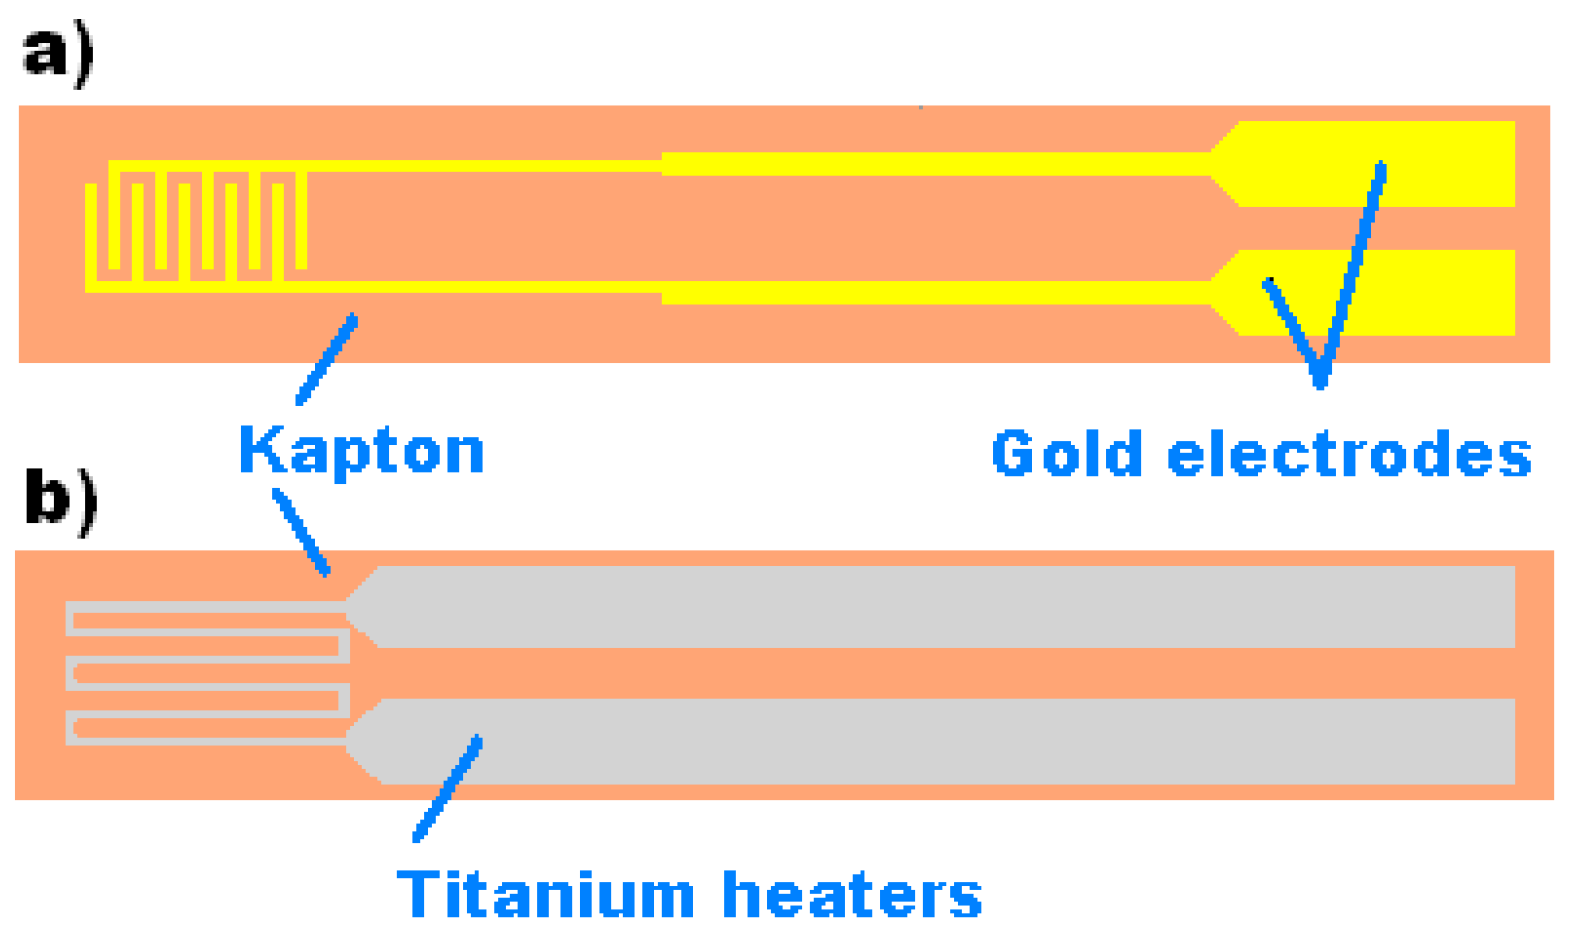
2.2. Sensor Fabrication

Kapton® HN film (poly(4,4′-oxydiphenylene-pyromellitimide), commercially available from DuPont, with thickness of 150 μm was used as a flexible substrate. The fabrication of the interdigitated gold electrodes were made by sputtering evaporation for about 250 nm thick on one side of the substrate, using conventional microfabrication procedures. There is an array of 5 interdigitated electrodes with their connection pads. The width of the electrodes and the gap in between them are 0.15 mm and 0.27 mm, respectively (Figure 1a).
On the backside of the flexible substrate a thin film of titanium was deposited by sputtering evaporation. Titanium (600 nm thick) was selected as heating material because of low electrical conductivity and good adhesion. The width of the heater was 150 μm. A voltage of 20 V was applied across the titanium heaters to achieve an operation temperature of 70 °C. In Figure 1b, we can see the circuit design used in this work.
Finally, the TiO2 membrane nanotubes was supported on the interdigitated gold electrodes. The manufacturing detailed of the process was reported in our previous work [18]. As shown in Figure 2 no visible detachment of the TiO2 membrane is displayed when the device is bent.

2.3. Sensor Characterization

The gas sensing characterizations were carried in a Teflon chamber with a volume of 50 mL under dynamic flow conditions. The target gas concentration inside the chamber was controlled by the mass flow controllers (MFC) connected to bottles of dry synthetic air (79% nitrogen and 21% oxygen) as gas carrier and gas parent. We used the parent H2S gas with calibrated concentration of 50 ppm in dry air balance. Prior to each measurement, the sensor was exposed to dry synthetic air for about 2 h to reach a stable state. Afterwards, the gas mixture (synthetic air and H2S) was delivered on one side of the sensor device at a constant total flow rate of 80 sccm (standard cubic centimeters per minute) with different H2S flow rate.
The gas concentration was controlled and measured using the following equation:
C o n c ( p p m ) = C o n c   g a s   p a r e n t ( p p m ) F l o w   r a t e   g a s   p a r e n t T o t a l   f l o w   r a t e
To achieve different humidity (10%–65%), the dry synthetic air was mixed at certain proportions with the synthetic air flowing through a bubbler filled with water and thus saturated to 100% relative humidity (RH). The RH was measured with an electronic hygrometer (Sensirion SHT 71).
A Keithley sourcemeter 2612 A with a bias voltage fixed at 2 V was used to collect real-time data from the sensor. The electrical resistance of the sensor was monitored and recorded as a function of the operating time.
The time dependent electrical resistance is measured at various gas concentrations from 6 ppm to 38 ppm, using a computer-based data acquisition system.
The resistance decreased and reached to a minimum value and after several minutes, resistance back to its initial value.
The sensor response defined as S = (R0 − Rg)/Rg where Rg denote the sensor resistance under the influence of a test gas and R0 the sensor resistance in synthetic air.
The response time is defined as the time needed for the variation in electrical resistance to reach 90% of the equilibrium value after injecting the gas, and the recovery time is defined as the time needed for the sensor to return to 90% of the original resistance in air after removing the gas.

3. Results and Discussion

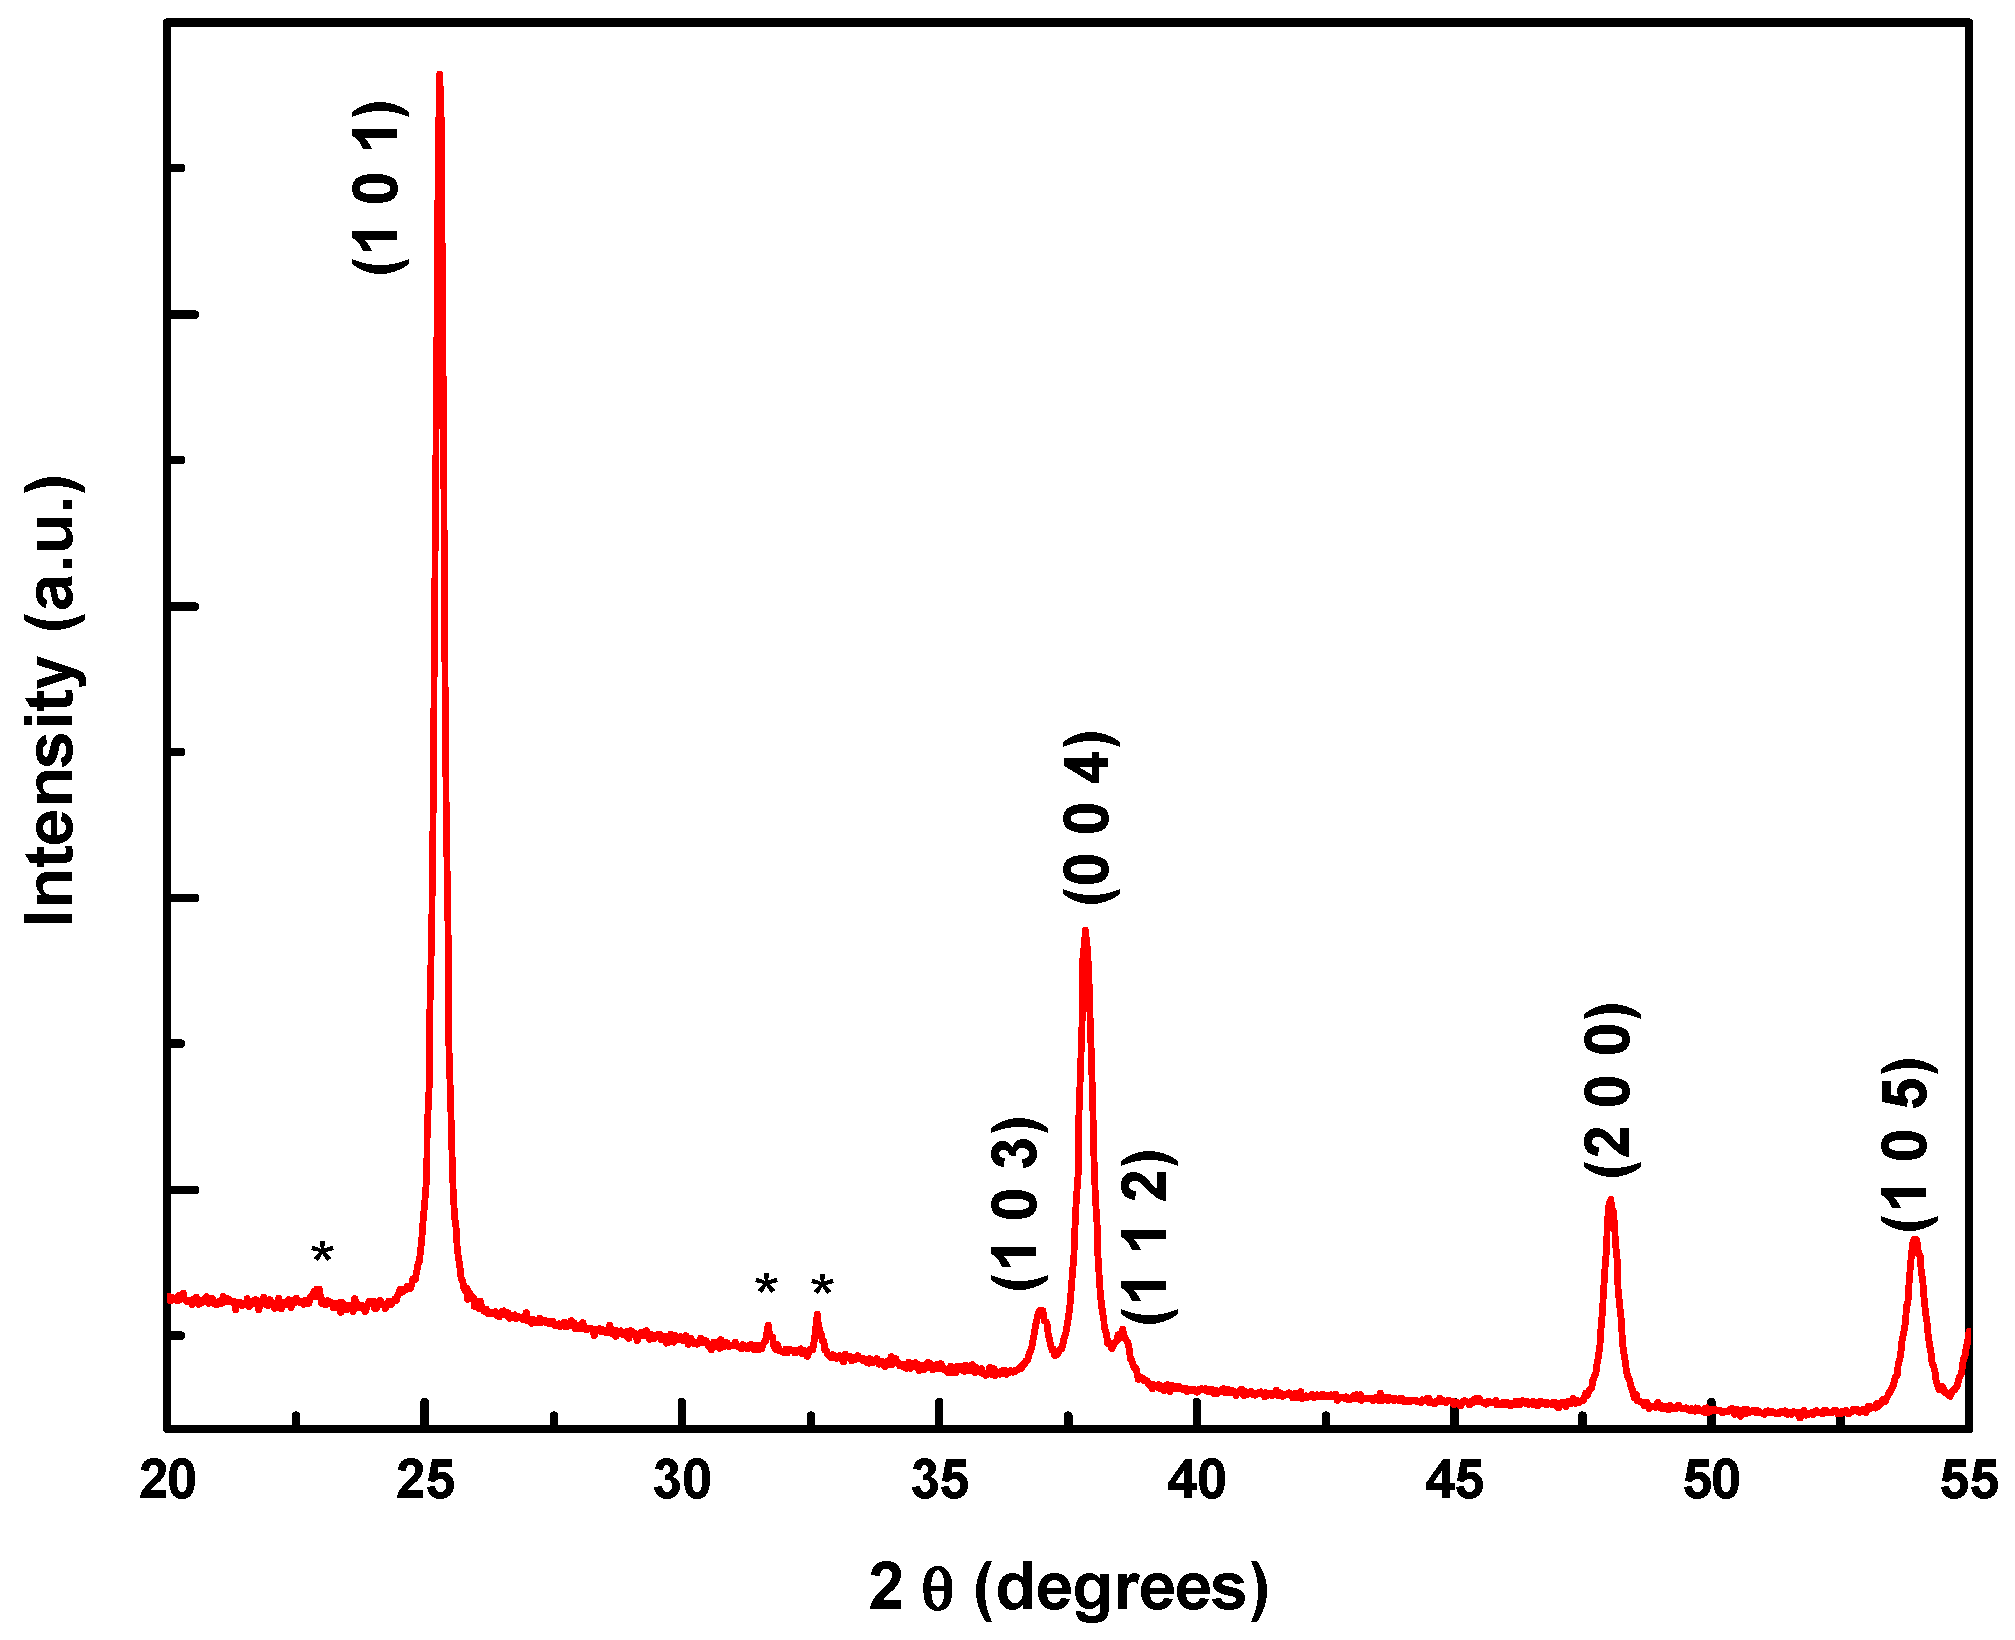
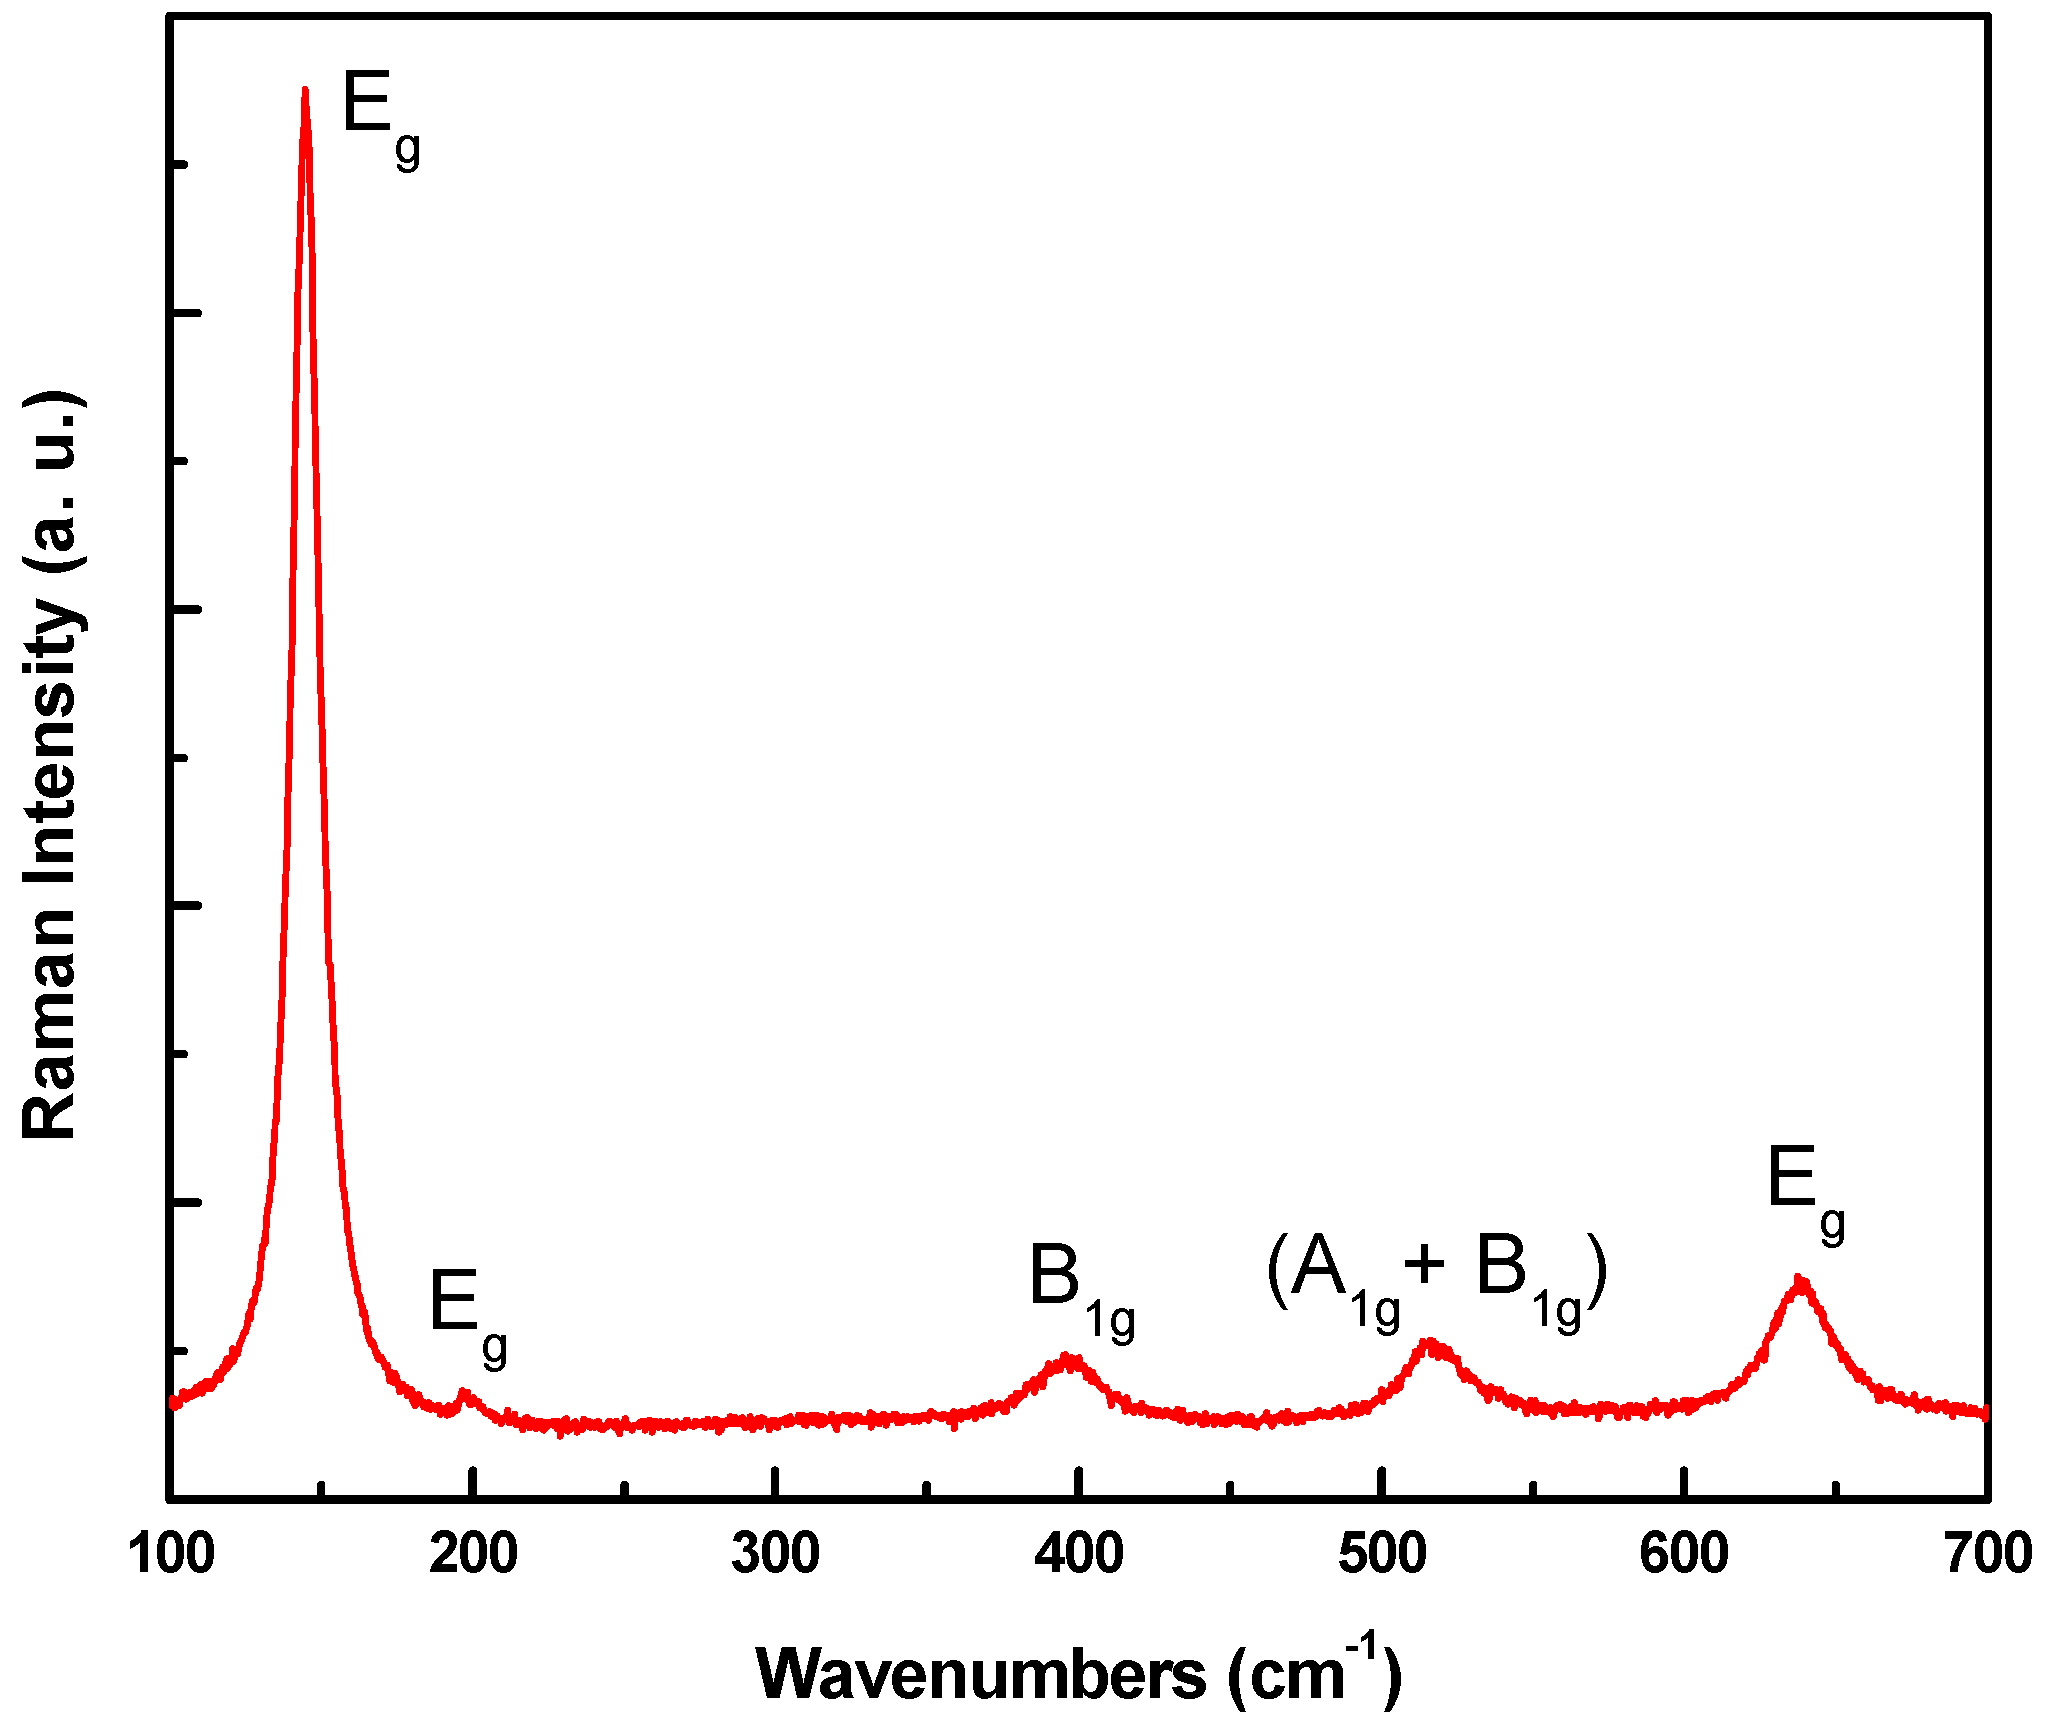
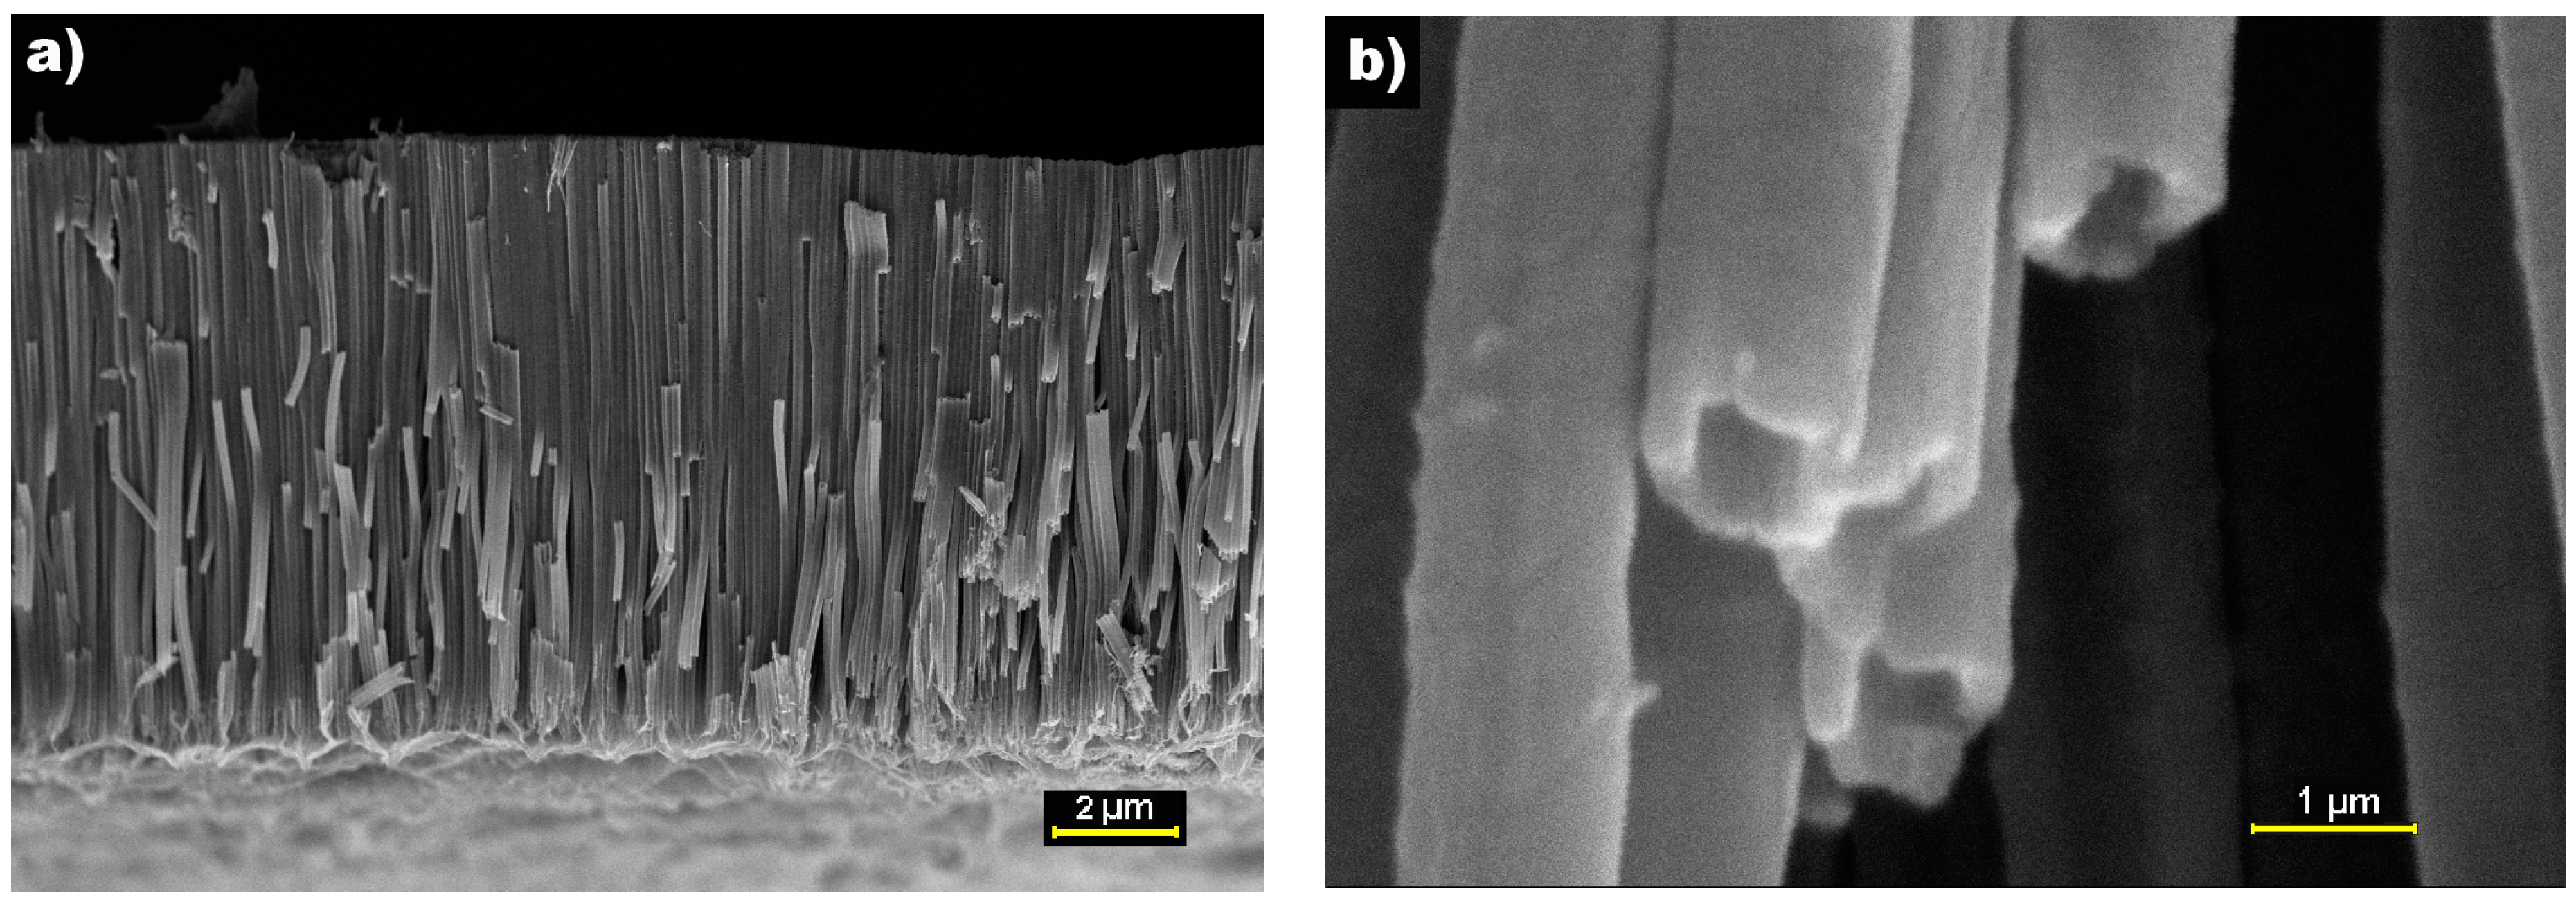
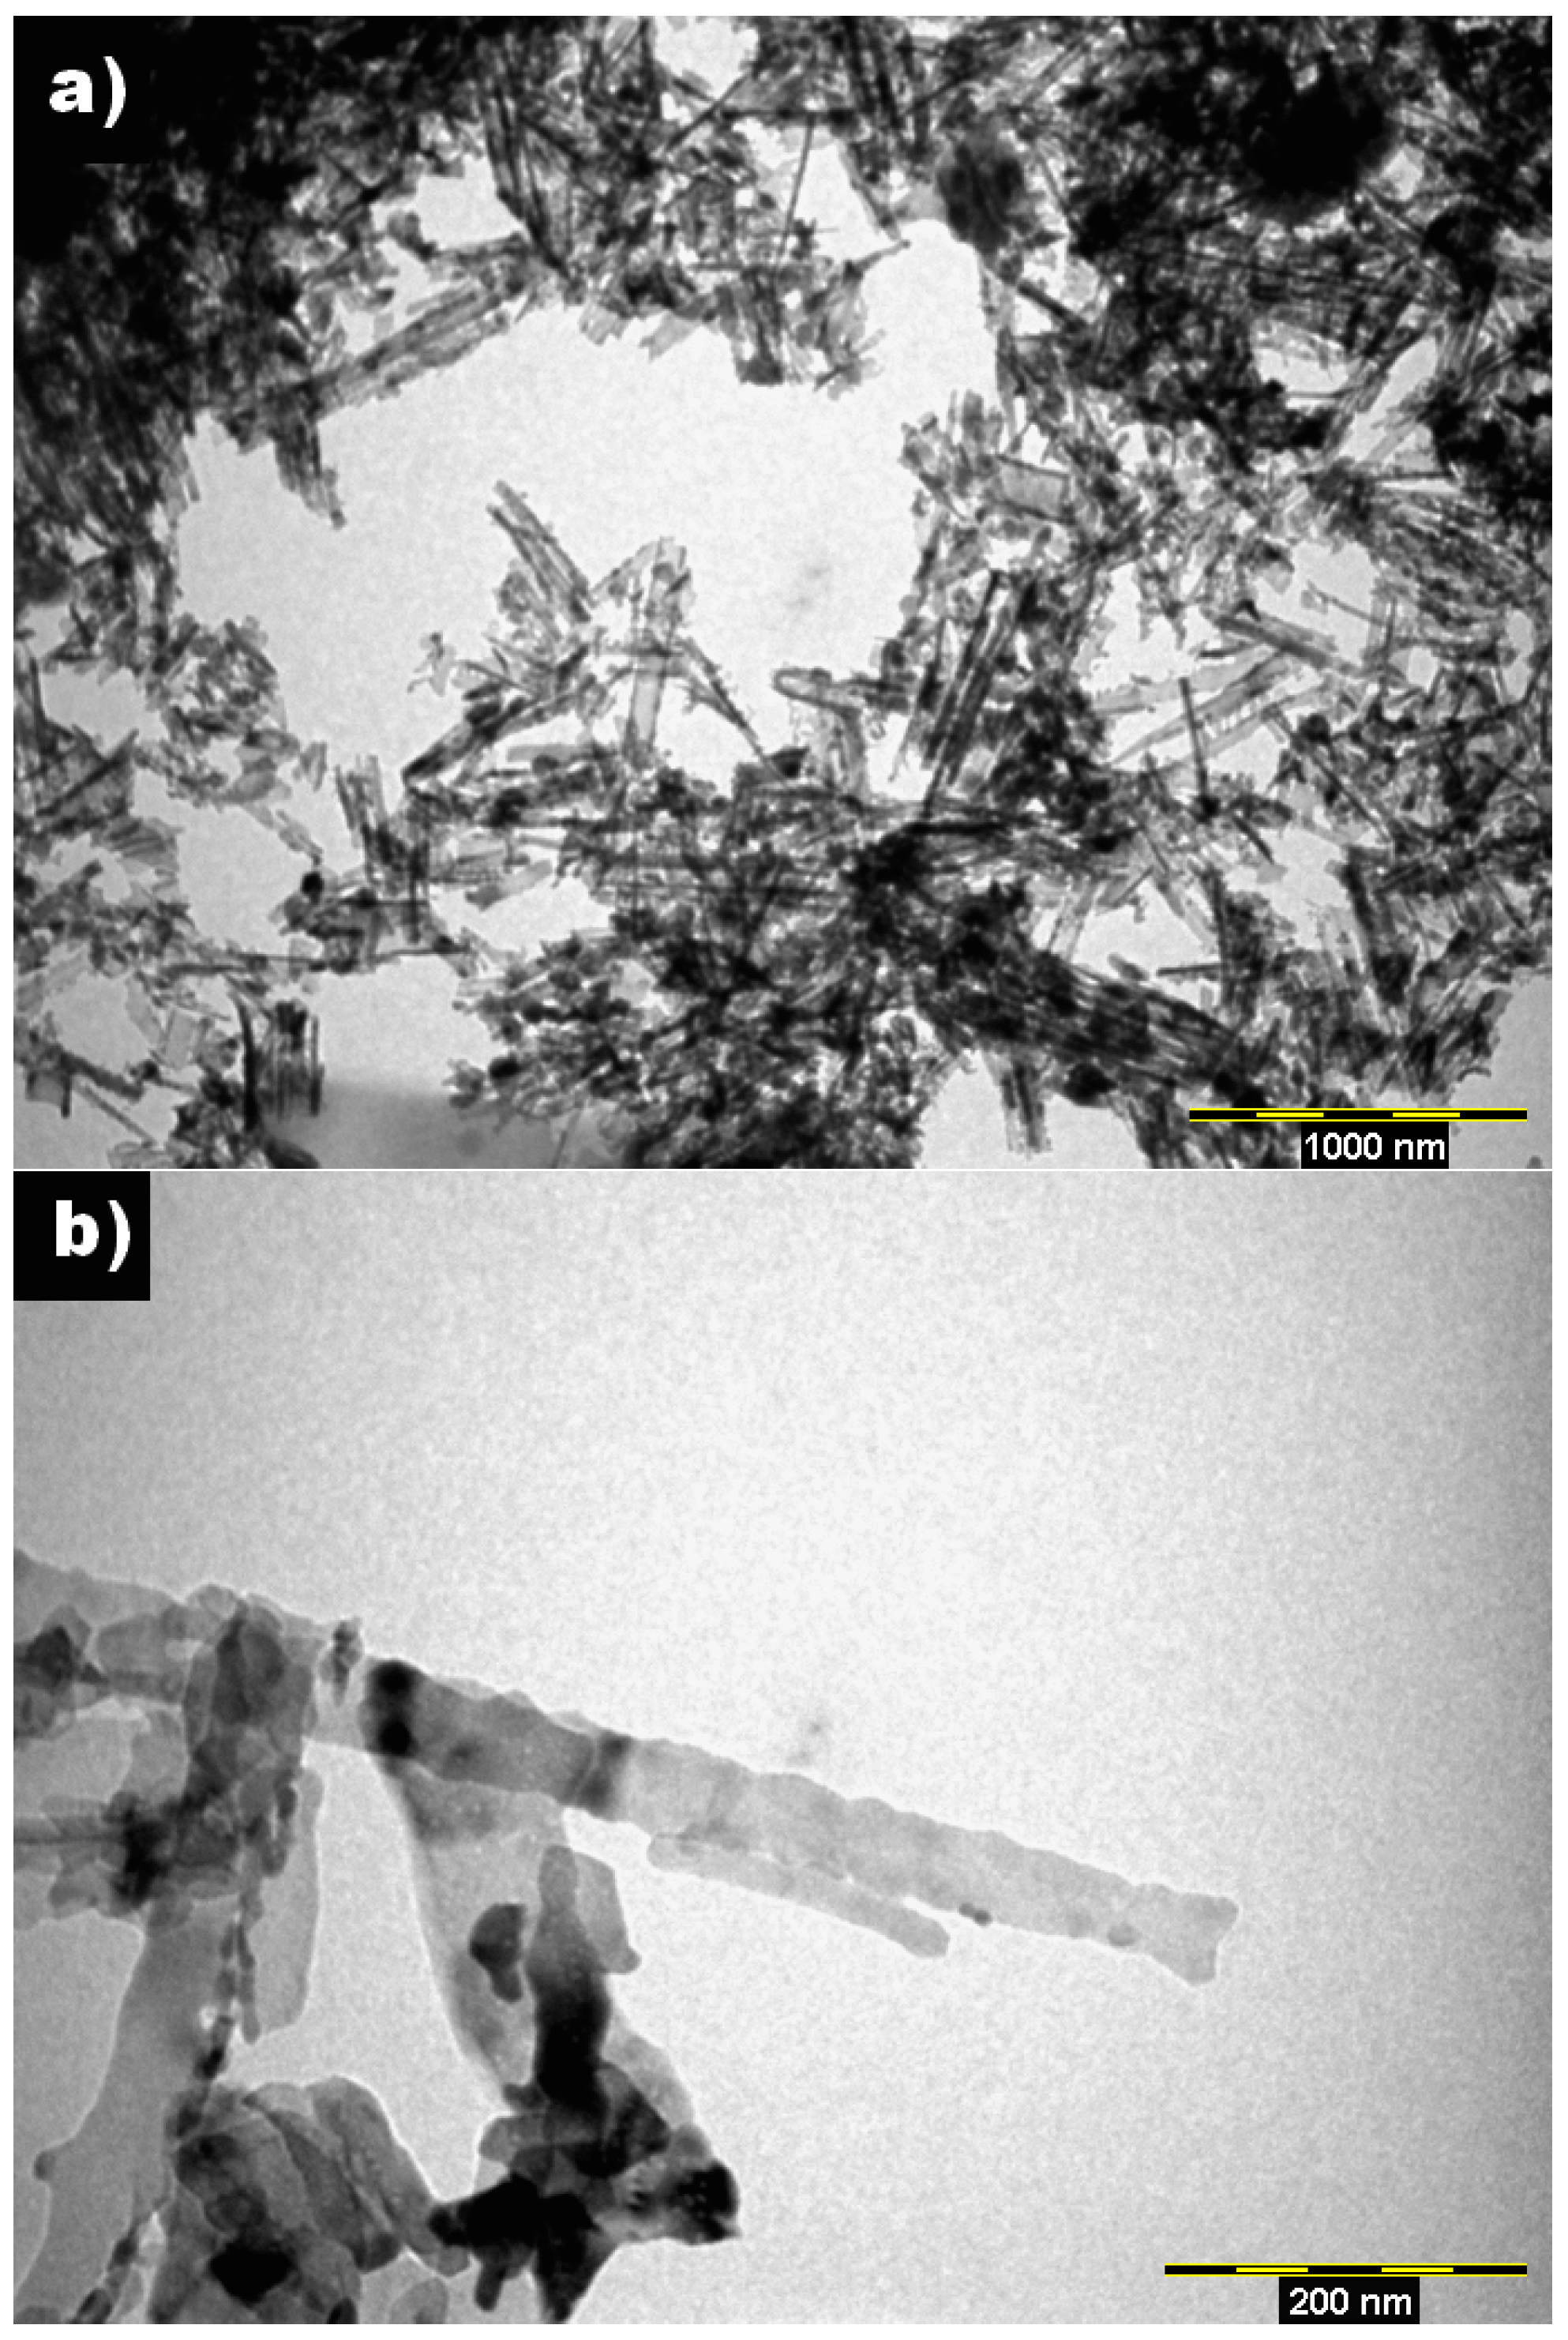
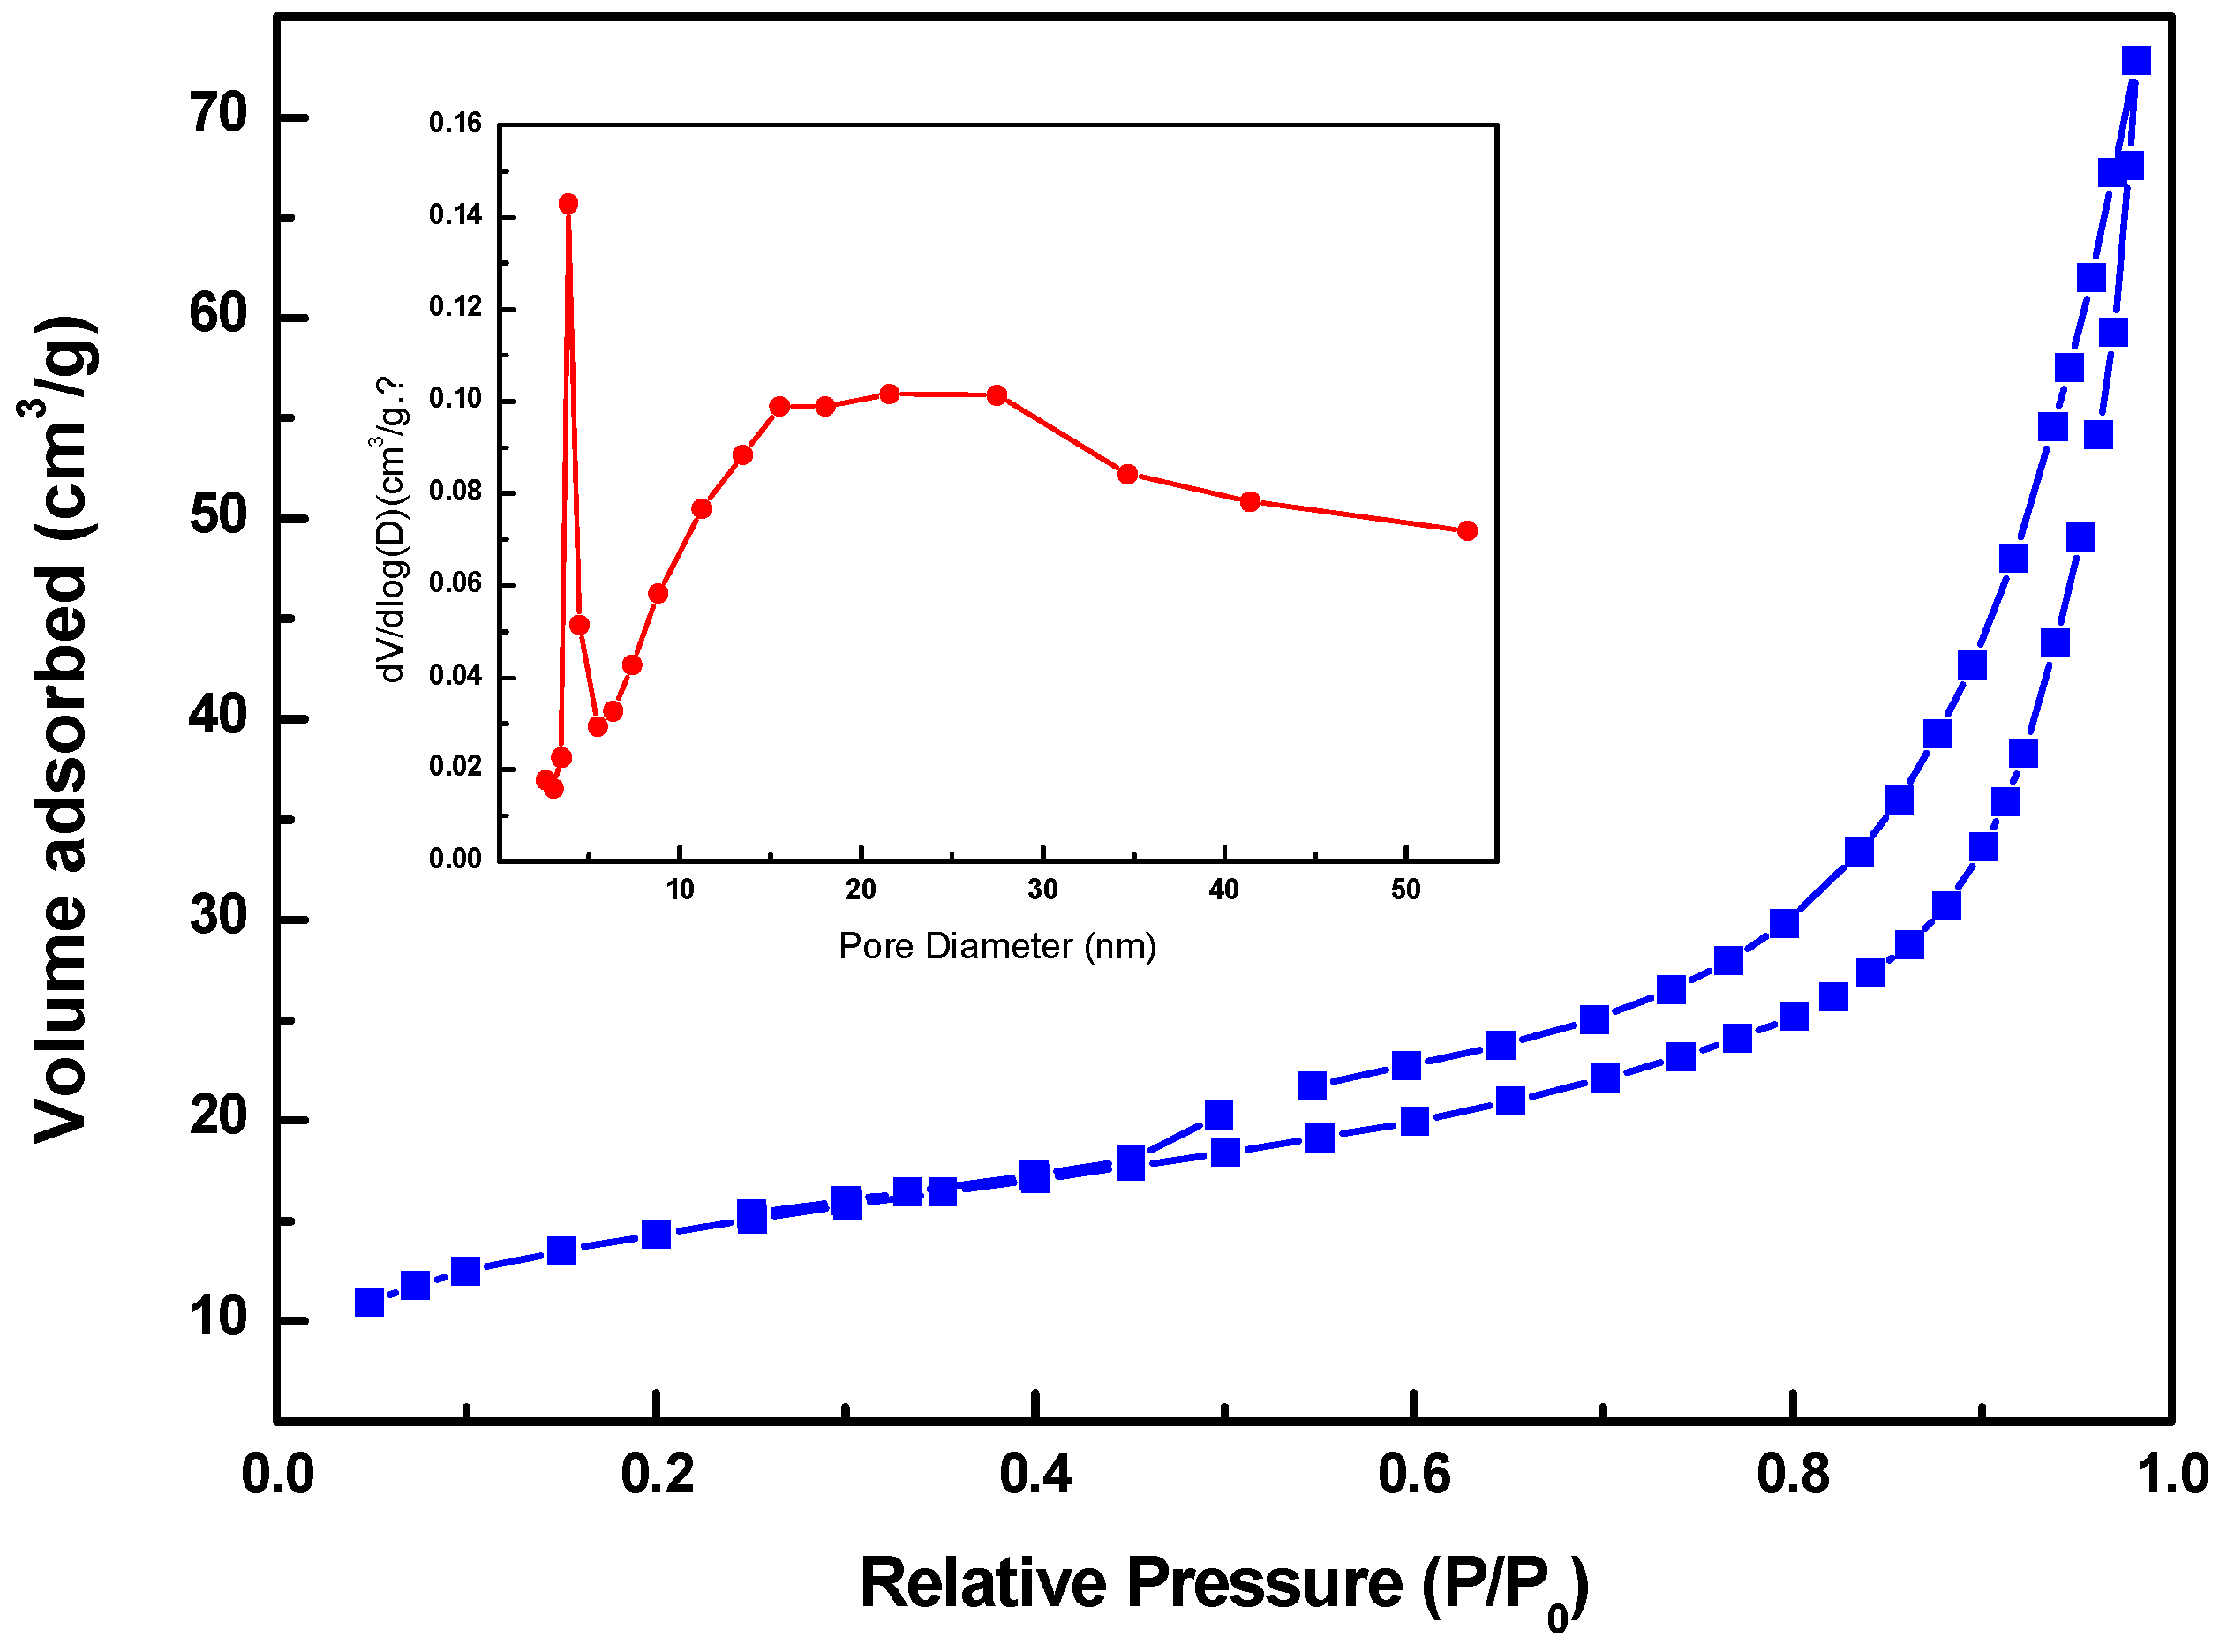
3.1. Microstructure Characterizations

Figure 3 shows the XRD patterns of the sample (calcined at 480 °C for 40 min to detach easily the TiO2 membrane from the Ti substrate) obtained for 70 V anodizing voltage. It can be seen that the phase present is anatase (01-071-1169). The diffraction peaks at 2θ = 25.1°, 37.4°, 47.8° are identified to be the (101), (004) (200) crystal faces respectively. The other phases (*) emerge presumably associated to the chemical intermediates (e.g., TiF4) of the electrochemical anodization. The average crystal grain size was 34 nm calculated by Scherrer equation from full width at half maximum of TiO2 anatase (101) diffraction peaks. Crystallite size has a significant effect on sensor performance.
Raman spectrum of annealed specimens is shown in Figure 4. Anatase phase of TiO2 has six Raman active modes (A1g + B1g + Eg) [19], which are observed at 143, 196–197, 393–395, 517–521, and 636–638 cm−1. These spectral bands prove the presence of anatase TiO2. The strongest Eg mode at 143 cm−1 is due to the symmetric stretching vibration of oxygen atoms in O–Ti–O bonds. The B1g and A1g modes are attributed to symmetric and anti-symmetric bending vibration of O–Ti–O bonds.
From SEM and TEM images (Figure 5 and Figure 6), we observed the morphology of titania nanotubes array prepared by electrochemical anodization followed by thermal annealing. The measured pore diameter was around 100 nm and the tube length was 12 μm. The wall thickness is approximately 30 nm (Figure 5b) and is similar with the average crystal grain size obtained by Scherrer equation. Probably the width of the wall is formed by one single nanocrystal.
As shown in Figure 6b, the nanotubular structure can be clearly seen, all the tubes are hollow and opened at both ends.
As seen in Figure 7, the specific surface area obtained by using the Brunauer–Emmett–Teller (BET) method for the TiO2 is 52 m2·g−1. The total pore volume (single point) (cm3·g−1): 0.11. In addition, the pore size distribution curve (inset in Figure 7) calculated from the desorption branch of the N2 isotherms by Barrett–Joyner–Halenda (BJH) method further indicate a main distribution range from 2 to 50 nm. The sample exhibited typical type IV isotherm, with distinct H2-type hysteresis loops at P/P0 ranging from 0.4 to 1.0 (IUPAC classification), indicating the existence of the mesoporous structure [20].
The large specific surface area is consistent with a nanotubular structure with a thin wall thickness. The results indicated that the TiO2 nanotubes membrane were potential to exhibit excellent properties for gas sensor applications.

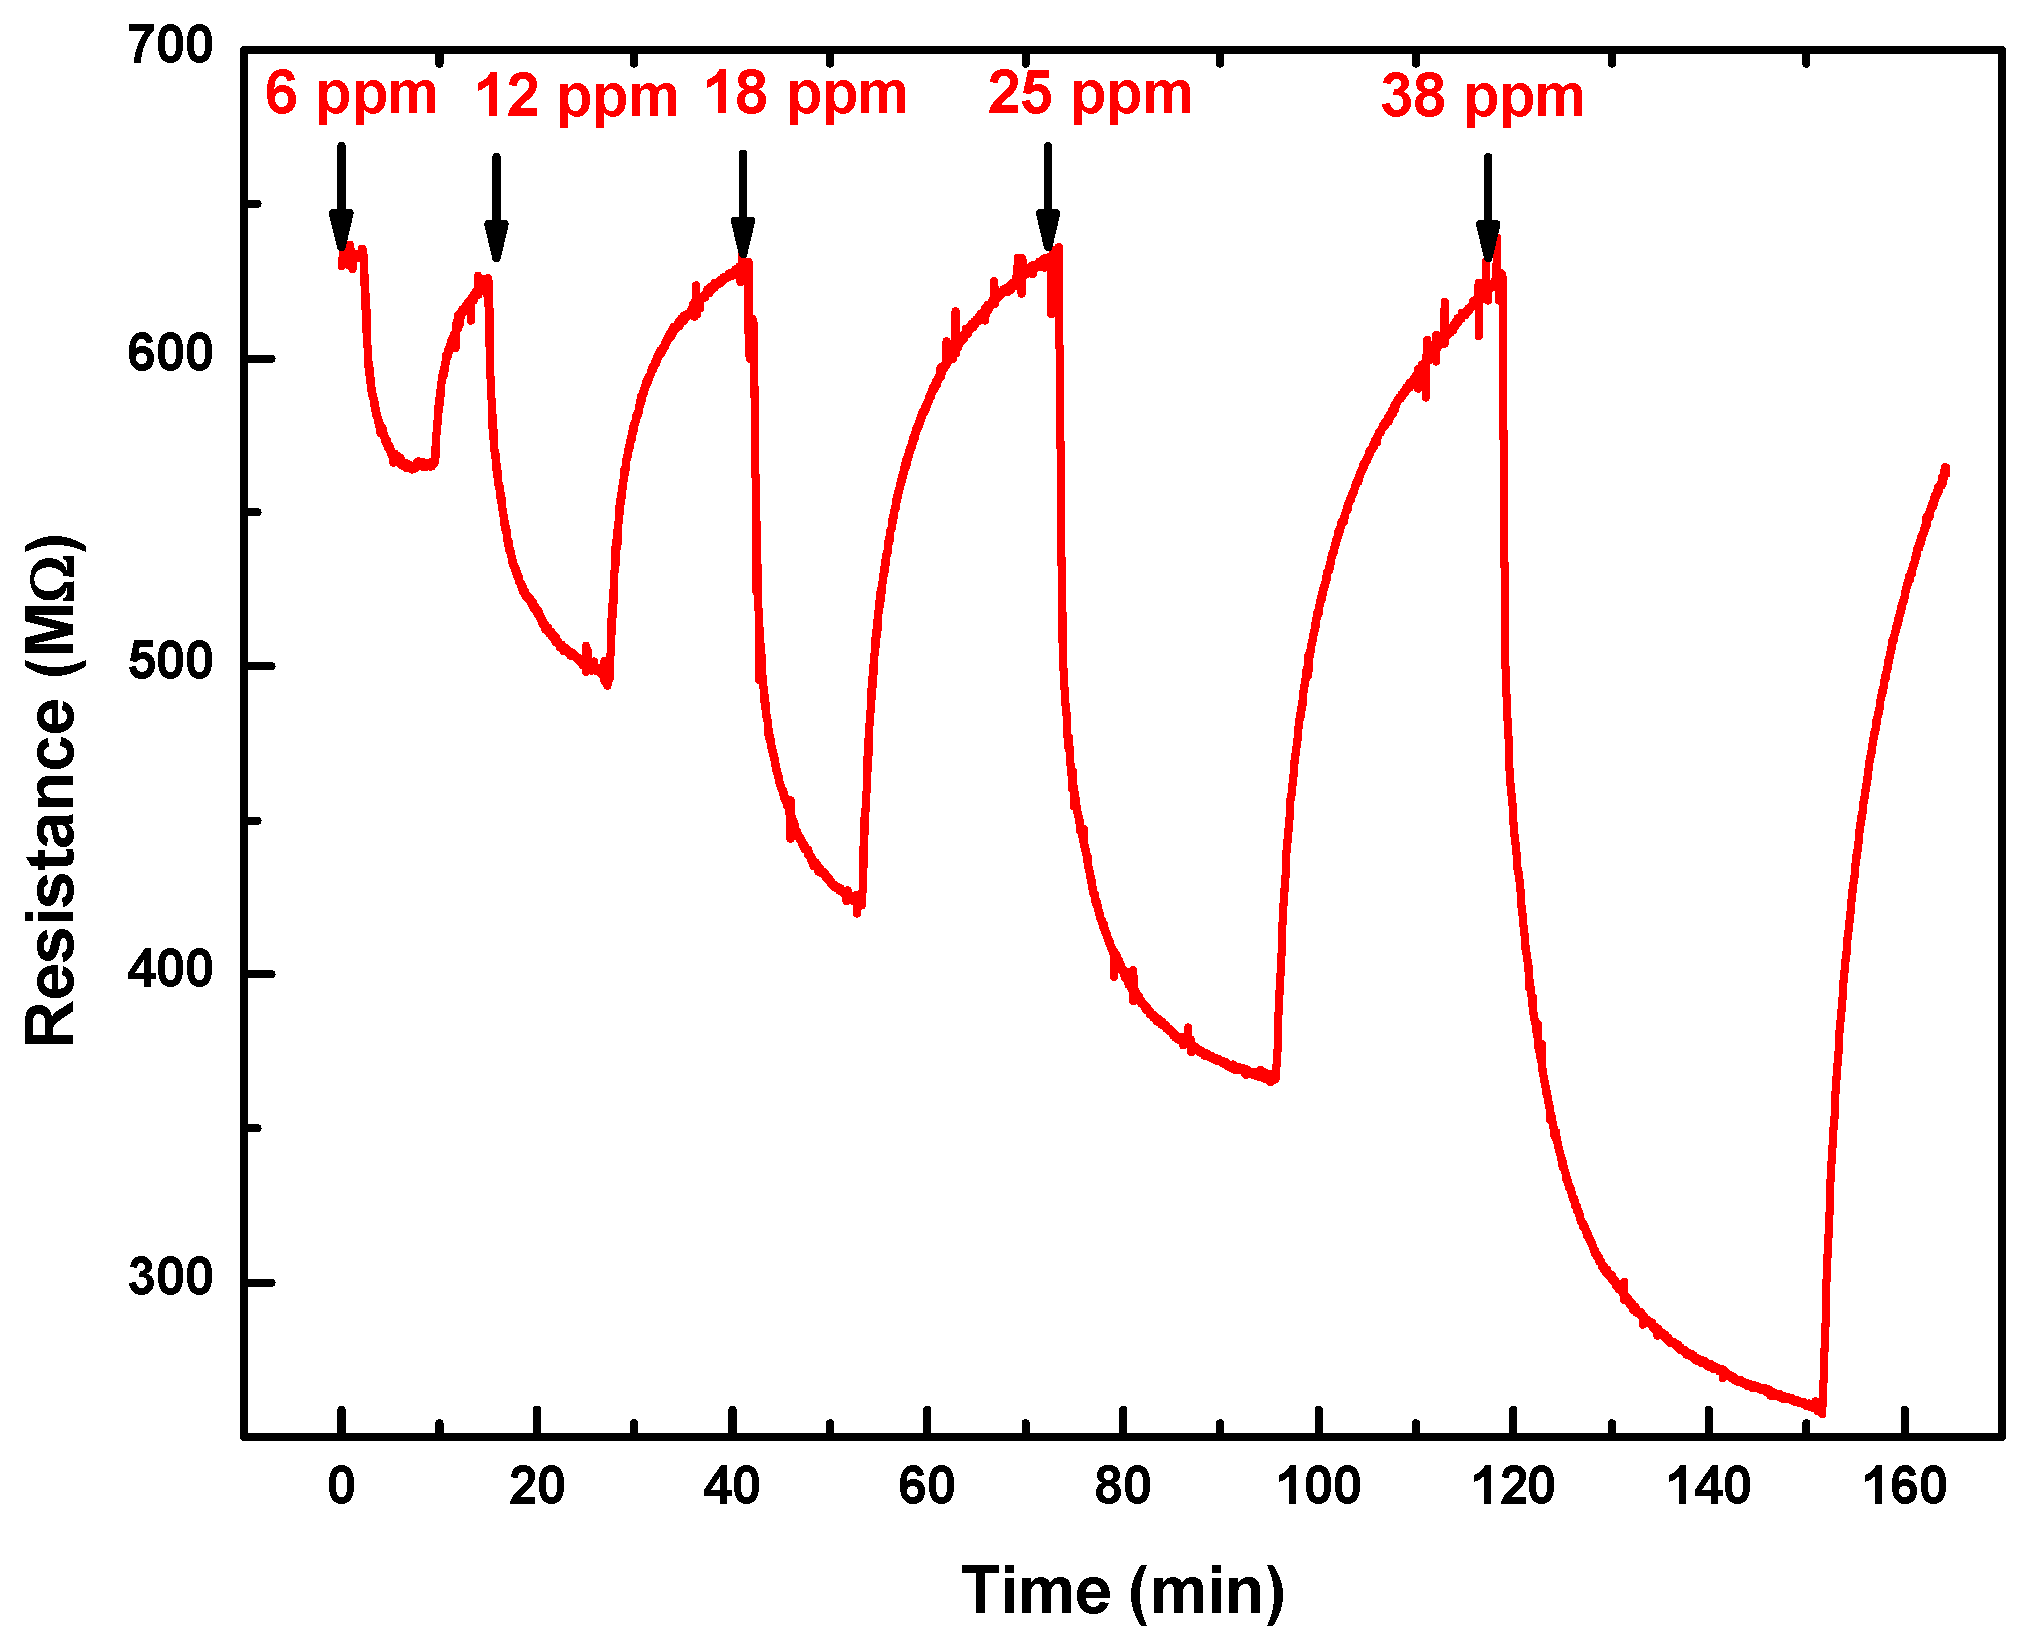
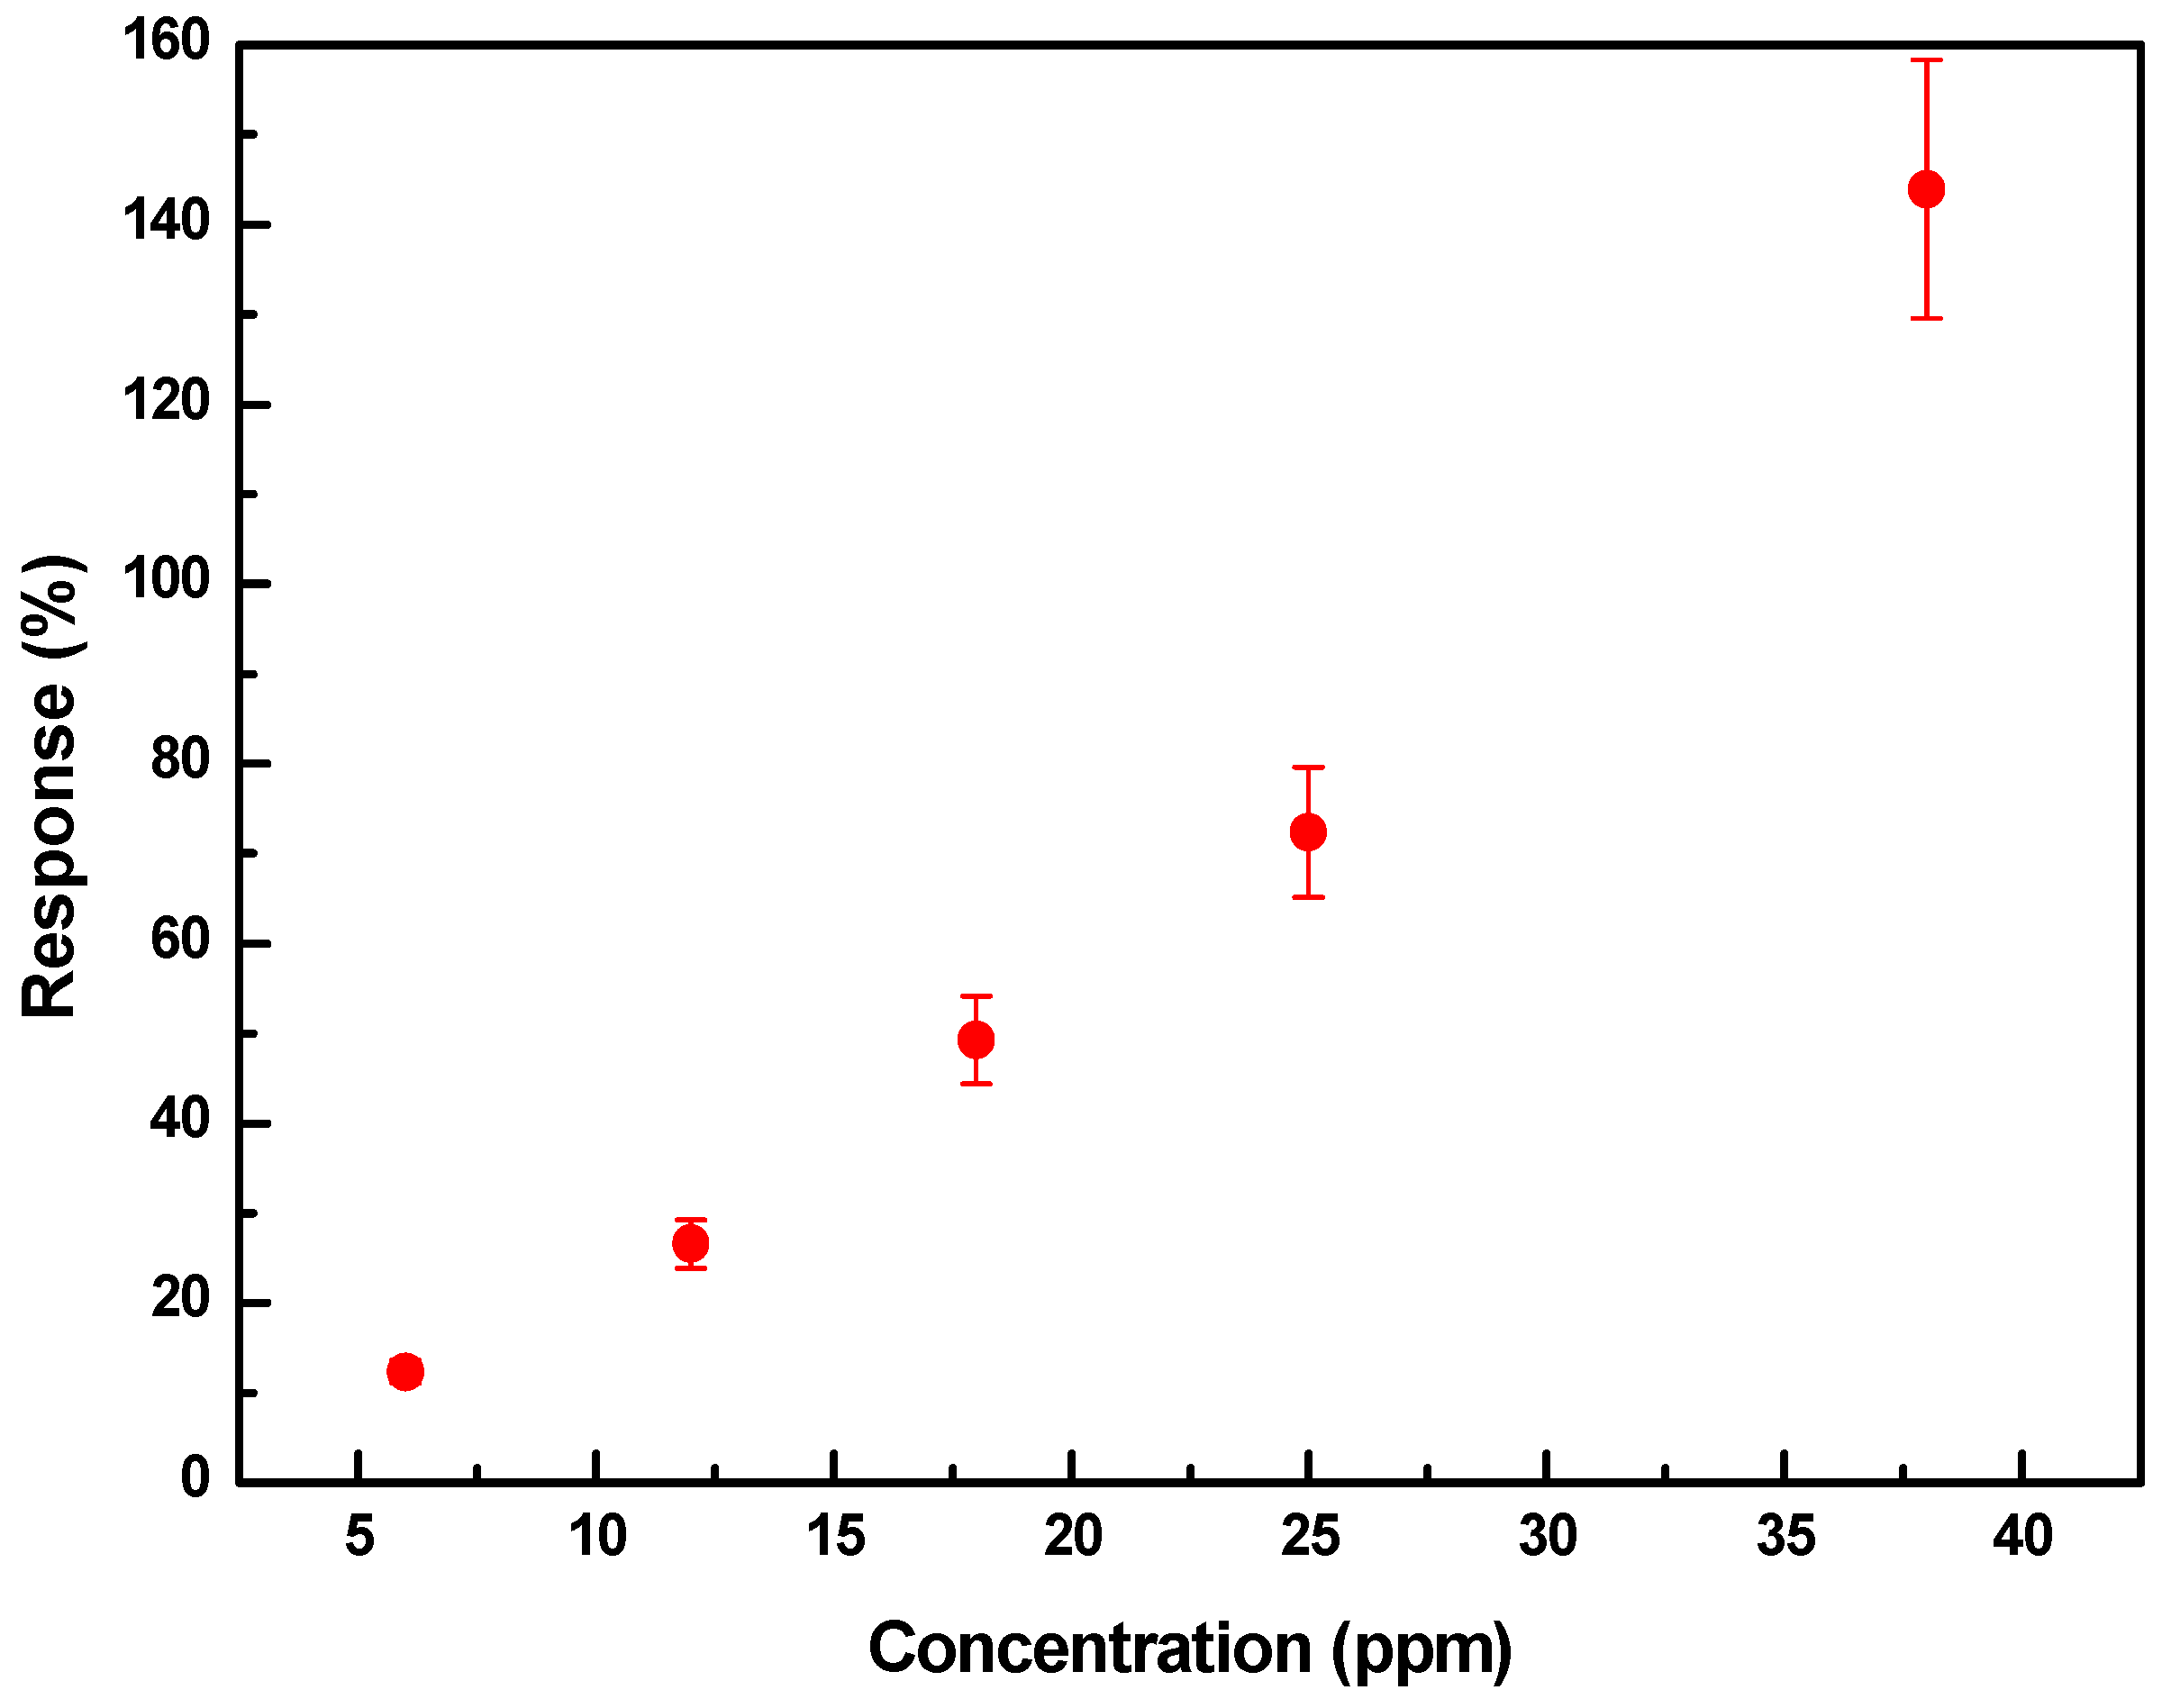
3.2. Gas Sensor Characteristics

Figure 8 shows the behavior of the flexible sensor in the presence of H2S tested at low temperature in a range of operating concentrations from 6 to 38 ppm.
In the presence of a dry-air atmosphere, the electrical resistance of the sample was found to be 600 MΩ, which was fixed as the base line resistance.
The resistance decreased when the nanotube sensors were exposed to H2S gas and recovered completely to the initial value when the gas supply was stopped.
To investigate the long term stability of the TiO2 nanotube membrane sensor, the gas sensing performance was evaluated once again after 6 months and the sensor provided reproducible results, which indicates its great potential for practical application.
It is suggested that the components adsorbed in the film surface are removed successfully after each measurement.
The response time and the recovery time are about 146 s and 209 s, respectively, for 6 ppm of H2S.
Figure 9 shows the response plot as a function of the H2S concentration in ppm. These sensors are capable of detecting H2S concentrations as low as 6 ppm. As it can be seen, the response increases with increasing concentration, which indicates a good sensitivity of the sensor.
Further, the influence of relative humidity, on the sensing performance of the sensor, was investigated for different relative humidity level (10% and 65%) at room temperature. Figure 10 shows the response of the sensor to 18 ppm H2S at 10% and 65% RH. It can be clearly seen from the figure that the reaction between the surface oxygen and the water molecules conduces to a decrease in baseline resistance of the gas sensor. However, the response to H2S is not appreciably affected by the change of RH.
In comparison with other metal oxide materials, Table 1 lists the gas sensing data of the sensors toward H2S recently reported in the literature. The relatively low operating temperature of TiO2 in this article is a suitable parameter for gas sensors because it minimizes the power needed to operate the practical devices. The relatively low operating temperature is probably due to the TiO2 nanotubes behaving like nanochannels for the diffusion of gas.
TiO2 is a n-type semiconductor. Like the most metal oxide semiconductor sensors, the sensing mechanism of the TiO2 nanotubes-based sensors was proposed to be the adsorption and desorption of the gas molecules on the surface of the sensing film, which can induce the change of the film’s resistance.
When it is exposed to air, oxygen would adsorb on its surface and form O2 (ads) O (ads) [28,29] which act as acceptors by trapping electrons from the nanotube conduction band and creating a depletion region on the nanotube surface according to the following equations:
O2 (ads) + e → O2 (ads)
O2 (ads) + e → 2O (ads)
The chemisorbed oxygen species act as surface acceptors and trap electrons increasing the electron concentration, and hence decrease the resistance of the TiO2 nanotubes.
The following reaction would take place at low temperature on the surface of the sensor [22,26]:
2H2S + 3O2 (ads) → 2H2O + 2SO2 + 3e
The adsorbed oxygen species can play a crucial role in sensing H2S gases and therefore the surface-to-volume ratio of the particular nanotubes structure, which can adsorb more oxygen species compared with nanorods and nanoparticles. At the same time, the hollow structure can enhance the diffusion of gas and achieve high sensitivity at H2S even at low temperatures.
In a word, the superior gas sensing response of the nanotubular TiO2 is due to the small nanoparticle size, large specific surface area and efficient gas diffusion access.

4. Conclusions

A flexible gas sensor based on TiO2 membrane nanotubes was fabricated. The Kapton substrate was deposited by sputtering evaporation, one side with the interdigitated gold electrodes and the other one with the heater, using conventional microfabrication procedures. Finally, the TiO2 membrane nanotubes was supported on the interdigitated gold electrodes.
The responsiveness to H2S gas at low temperature contributes to significantly reduce the power consumption. The use of a flexible sensor is the most promising for portable on-site detection. These sensors have been tested in laboratory conditions and must be validated systematically to overcome harsh environmental conditions, e.g., determine the release of H2S gas from the volcanos.

Acknowledgments

Authors are thankful to D. Vega and M. Reinoso from Division Materia Condensada, Gcia. GAYANN, CNEA for XRD analysis and Raman Spectroscopy.

Author Contributions

No one, other than the authors should have contributed substantially to the writing and revising of the manuscript.

Conflicts of Interest

The authors declare no conflict of interest.

References

  1. Beauchamp, R.O.; Bus, J.S.; Popp, J.A.; Boreiko, C.J.; Andgelkovich, D.A. A critical Review of the literature on hydrogen sulfide toxicity. Crit. Rev. Toxicol. 1984, 13, 25–97. [Google Scholar] [CrossRef] [PubMed]
  2. Werner, C.; Kelly, P.J.; Doukas, M.; Lopez, T.; Pfeffer, M.; McGimsey, R.; Neal, C. Degassing of CO2, SO2, and H2S associated with the 2009 eruption of Redoubt Volcano, Alaska. J. Volcanol. Geotherm. Res. 2013, 259, 270–284. [Google Scholar] [CrossRef]
  3. Hwanga, I.S.; Choi, J.K.; Kim, S.J.; Dong, K.Y.; Kwon, J.H.; Ju, B.K.; Lee, J.H. Enhanced H2S sensing characteristics of SnO2 nanowires functionalized with CuO. Sens. Actuators B 2009, 142, 105–110. [Google Scholar] [CrossRef]
  4. Peu, P.; Picard, S.; Diara, A.; Girault, R.; Béline, F.; Bridoux, G.; Dabert, P. Prediction of hydrogen sulphide production during anaerobic digestion of organic substrates. Bioresour. Technol. 2012, 121, 419–424. [Google Scholar] [CrossRef] [PubMed]
  5. Bear, J.C.; McGettrick, J.D.; Parkin, I.P.; Dunnill, C.W.; Hasel, T. Porous carbons from inverse vulcanised polymers. Microporous Mesoporous Mater. 2016, 232, 189–195. [Google Scholar] [CrossRef]
  6. US Environmental Protection Agency (US EPA). Toxicological Review of Hydrogen Sulfide; US EPA: Washington, DC, USA, 2003. Available online: http://www.epa.gov/IRIS/toxreviews/0061tr.pdf (accessed on 1 July 2016).
  7. Kaur, M.; Jain, N.; Sharma, K.; Bhattacharya, S.; Roy, M.; Tyagi, A.K.; Gupta, S.K.; Yakhmi, J.V. Room-temperature H2S gas sensing at ppb level by single crystal In2O3 whiskers. Sens. Actuators B 2008, 133, 456–461. [Google Scholar] [CrossRef]
  8. Guo, W.; Feng, Q.; Tao, Y.; Zheng, L.; Han, Z.; Ma, J. Systematic investigation on the gas-sensing performance of TiO2 nanoplate sensors for enhanced detection on toxic gases. Mater. Res. Bull. 2016, 73, 302–307. [Google Scholar] [CrossRef]
  9. Li, D.; Hu, J.; Fan, F.; Bai, S.; Luo, R.; Chen, A.; Liu, C.C. Quantum-sized ZnO nanoparticles synthesized in aqueous medium for toxic gases detection. J. Alloy. Compd. 2012, 539, 205–209. [Google Scholar] [CrossRef]
  10. Chatterjee, S.G.; Chatterjee, S.; Ray, A.K.; Chakraborty, A.K. Graphene-metal oxide nanohybrids for toxic gas sensor: A review. Sens. Actuators B 2015, 221, 1170–1181. [Google Scholar] [CrossRef]
  11. Zhang, X.; Zhang, J.; Jia, Y.; Xiao, P.; Tang, J. TiO2 Nanotube Array Sensor for Detecting the SF6 Decomposition Product SO2. Sensors 2012, 12, 3302–3313. [Google Scholar] [CrossRef] [PubMed]
  12. Galstyan, V.; Comini, E.; Faglia, G.; Sberveglieri, G. TiO2 Nanotubes: Recent Advances in Synthesis and Gas Sensing Properties. Sensors 2013, 13, 14813–14838. [Google Scholar] [CrossRef] [PubMed]
  13. Vallejos, S.; Gràcia, I.; Figueras, E.; Sánchez, J.; Mas, R.; Beldarrain, O.; Cané, C. Microfabrication of flexible gas sensing devices based on nanostructured semiconducting metal oxides. Sens. Actuators A 2014, 219, 88–93. [Google Scholar] [CrossRef]
  14. McAlpine, M.C.; Ahmad, H.; Wang, D.; Heath, J.R. Highly ordered nanowirearrays on plastic substrates for ultrasensitive flexible chemical sensors. Nat. Mater. 2007, 6, 379–384. [Google Scholar] [CrossRef] [PubMed]
  15. Yi, J.; Lee, J.M.W.; Park, I.I. Vertically aligned ZnO nanorods and graphenehybrid architectures for high-sensitive flexible gas sensors. Sens. Actuators B 2011, 155, 264–269. [Google Scholar] [CrossRef]
  16. Claramunt, S.; Monereo, O.; Boix, M.; Leghrib, R.; Prades, J.D.; Cornet, A.; Merino, P.; Merino, C.; Cirera, A. Flexible gas sensor array with an embedded heater basedon metal decorated carbon nanofibres. Sens. Actuators B 2013, 187, 401–406. [Google Scholar] [CrossRef]
  17. Walia, S.; Shah, C.M.; Gutruf, P.; Nili, H.; Chowdhury, D.R.; Withayachumnankul, W.; Bhaskaran, M.; Sriram, S. Flexible metasurfaces and metamaterials: A review of materials and fabrication processes at micro- and nano-scales. Appl. Phys. Rev. 2015, 2, 011303. [Google Scholar] [CrossRef]
  18. Perillo, P.M.; Rodríguez, D.F. Low temperature trimethylamine flexible gas sensor based on TiO2 membrane nanotubes. J. Alloy. Compd. 2016, 657, 765–769. [Google Scholar] [CrossRef]
  19. Ohsaka, T.; Izumi, F.; Fujiki, Y. Raman spectrum of anatase TiO2. J. Raman Spectroc. 1978, 7, 321–324. [Google Scholar] [CrossRef]
  20. Sing, K.S.W.; Everett, D.H.; Haul, R.A.W.; Moscou, L.; Pierotti, R.A.; Rouquerol, J.; Siemieniewska, T. Reporting physisorption data for gas/solid systems with special reference to the determination of surface area and porosity (recommendations 1984). Pure Appl. Chem. 1985, 57, 603–619. [Google Scholar] [CrossRef]
  21. Pongpaiboonkul, S.; Phokharatkul, D.; Hodak, J.H.; Wisitsoraat, A.; Hodak, S.K. Enhancement of H2S-sensing performances with Fe-doping in CaCu3Ti4O12 thin films prepared by a sol-gel method. Sens. Actuators B 2016, 224, 118–127. [Google Scholar] [CrossRef]
  22. Wang, L.; Kang, Y.; Wang, Y.; Zhu, B.; Zhang, S.; Huang, W.; Wang, S. CuO nanoparticle decorated ZnO nanorod sensor for low-temperature H2S detection. Mater. Sci. Eng. C 2012, 32, 2079–2085. [Google Scholar] [CrossRef]
  23. Ramgir, N.S.; Sharma, P.K.; Datta, N.; Kaur, M.; Debnath, A.K.; Aswal, D.K.; Gupta, S.K. Room temperature H2S sensor based on Au modified ZnO nanowires. Sens. Actuators B 2013, 186, 718–726. [Google Scholar] [CrossRef]
  24. Moon, S.; Vuong, N.M.; Lee, D.; Kim, D.; Lee, H.; Kim, D.; Hong, S.; Yoon, S. Co3O4–SWCNT composites for H2S gas sensor application. Sens. Actuators B 2016, 222, 166–172. [Google Scholar] [CrossRef]
  25. Li, Z.; Huang, Y.; Zhang, S.; Chen, W.; Kuang, Z.; Ao, D.; Liu, W.; Fu, Y. A fast response & recovery H2S gas sensor based on α-Fe2O3 nanoparticles with ppb level detection limit. J. Hazard. Mater. 2015, 300, 167–174. [Google Scholar] [PubMed]
  26. Asad, M.; Sheikhi, M.H.; Pourfath, M.; Moradi, M. High sensitive and selective flexible H2S gas sensors based on Cu nanoparticle decorated SWCNT. Sens. Actuators B 2015, 210, 1–8. [Google Scholar] [CrossRef]
  27. Hosseini, Z.S.; Mortezaali, A.; Iraji zad, A.; Fardindoost, S. Sensitive and selective room temperature H2S gas sensor based on Au sensitized vertical ZnO nanorods with flower-like structures. J. Alloy. Compd. 2015, 628, 222–229. [Google Scholar] [CrossRef]
  28. Batzill, M.; Diebold, U. The surface and materials science of tin oxide. Prog. Surf. Sci. 2005, 79, 47–154. [Google Scholar] [CrossRef]
  29. Kohl, D. Surface processes in the detection of reducing gases with SnO2-based devices. Sens. Actuators B 1989, 18, 71–113. [Google Scholar] [CrossRef]
Figure 1. Schematic diagram of the flexible sensor (a) Top part of the sensor consisting of gold interdigitated electrodes; (b) Titanium heater deposited at the bottom part of the Kapton substrate.
Chemosensors 04 00015 g001
Figure 2. Optical image of the fabricated sensor.
Chemosensors 04 00015 g002
Figure 3. X-ray diffractogram of the TiO2 after annealed at 480 °C.
Chemosensors 04 00015 g003
Figure 4. Raman spectrum of annealed TiO2 nanotube arrays.
Chemosensors 04 00015 g004
Figure 5. SEM micrograph of the TiO2 nanotubes membrane at (a) low (b) high magnification.
Chemosensors 04 00015 g005
Figure 6. TEM micrograph of the (a) bundles and (b) single TiO2 nanotubes membrane.
Chemosensors 04 00015 g006
Figure 7. Nitrogen adsorption–desorption isotherm of TiO2 and its BJH pore size distribution desorption plot (inset image).
Chemosensors 04 00015 g007
Figure 8. Resistance evolution in presence of several H2S concentrations.
Chemosensors 04 00015 g008
Figure 9. Response of TiO2 sensors vs. H2S concentration.
Chemosensors 04 00015 g009
Figure 10. Resistance evolution in presence of 18 ppm H2S concentration at different RH.
Chemosensors 04 00015 g010
Table 1. Gas-sensing response of recently reported metal oxide sensors toward H2S.
MaterialsMethodTemperature °CConcentration (ppm)H2S (Response)Response DefinitionRef.
9 wt% Fe-doped CaCu3Ti4O12sol-gel25010126Ra/Rg[21]
CuO-ZnOhydrothermal10010040Ra/Rg[22]
ZnO nanowireshydrothermal25579Ig/Ia[23]
Co3O4–SWCNTarc-discharge250100500(Rg − Ra)/Ra × 100[24]
α-Fe2O3 nanoparthydrothermal30064Ra/Rg[25]
Cu nanoparticles SWCNTchemical route252026(Rg − Ra)/Ra × 100[26]
ZnO nanorodsvapor phase transport253475Ra/Rg[27]
TiO2 nanotubesanodization706–3812–144(Ra − Rg)/Rg × 100This work

