Article

Miniaturized Aptamer-Based Assays for Protein Detection

1
Elettra-Sincrotone S.C.p.A., SS 14 km 163,5 in AREA Science Park, Basovizza, Trieste 34149, Italy
2
Department of Physics, University of Trieste, Via Valerio 9, Trieste 34127, Italy
3
INSTM-ST Unit, SS 14 km 163,5 in AREA Science Park, Basovizza, Trieste 34149, Italy
4
Centre of Excellence for Biosensors, Instrumentation and Process Control, Tovarniška 26, Ajdovščina SI-5270, Slovenia
*
Author to whom correspondence should be addressed.
Chemosensors 2016, 4(3), 18; https://doi.org/10.3390/chemosensors4030018
Submission received: 11 July 2016 / Revised: 12 August 2016 / Accepted: 29 August 2016 / Published: 2 September 2016
(This article belongs to the Special Issue Electrochemical Immunosensors and Aptasensors)

Abstract

:
The availability of devices for cancer biomarker detection at early stages of the disease is one of the most critical issues in biomedicine. Towards this goal, to increase the assay sensitivity, device miniaturization strategies empowered by the employment of high affinity protein binders constitute a valuable approach. In this work we propose two different surface-based miniaturized platforms for biomarker detection in body fluids: the first platform is an atomic force microscopy (AFM)-based nanoarray, where AFM is used to generate functional nanoscale areas and to detect biorecognition through careful topographic measurements; the second platform consists of a miniaturized electrochemical cell to detect biomarkers through electrochemical impedance spectroscopy (EIS) analysis. Both devices rely on robust and highly-specific protein binders as aptamers, and were tested for thrombin detection. An active layer of DNA-aptamer conjugates was immobilized via DNA directed immobilization on complementary single-stranded DNA self-assembled monolayers confined on a nano/micro area of a gold surface. Results obtained with these devices were compared with the output of surface plasmon resonance (SPR) assays used as reference. We succeeded in capturing antigens in concentrations as low as a few nM. We put forward ideas to push the sensitivity further to the pM range, assuring low biosample volume (μL range) assay conditions.

Graphical Abstract

1. Introduction

The rapid and reliable detection of multiple biomarkers simultaneously in small sample volumes is increasingly requested in current clinical practice and represents a fundamental step towards personalized medicine [1]. Nowadays, most of the available diagnostic devices are solid-state based analytical assays, where a functionalized surface works as the active element for biorecognition. Site-specific immobilization of multiple active elements on the same surface to probe low biosample volumes requires miniaturization and is generally technologically demanding, since it entails successive steps specifically tailored to each biomarker probe.
One promising strategy for multiplexing probe immobilization is DDI (DNA-directed immobilization) [2,3,4,5], where different DNA-conjugated antibodies targeting different biomarkers are immobilized via Watson-Crick base pairing on surface-tethered complementary DNA sequences. However the synthesis of DNA-protein conjugates is quite challenging, requires click-chemistry kits and careful optimization in order to assure a final construct that is both suitable for immobilization and preserves the original affinity.
Nucleic acid aptamers can offer a valid alternative to antibodies. Aptamers are oligosequences selected in vitro to bind a target with high affinity. In particular, they show highly specific binding activity since aptamer-target interaction is based on three-dimensional folding patterns, resulting in dissociation constants in the picomolar range. In addition, aptamers, if compared to standard proteins, show higher stability, and ease of chemical modification. Aptamer production is fully automated, highly reproducible, and low-cost. Moreover, aptamers are naturally integrable in the context of DDI: DNA-aptamer constructs are produced simply by adding a surface binding sequence to the aptamer during oligo-synthesis.
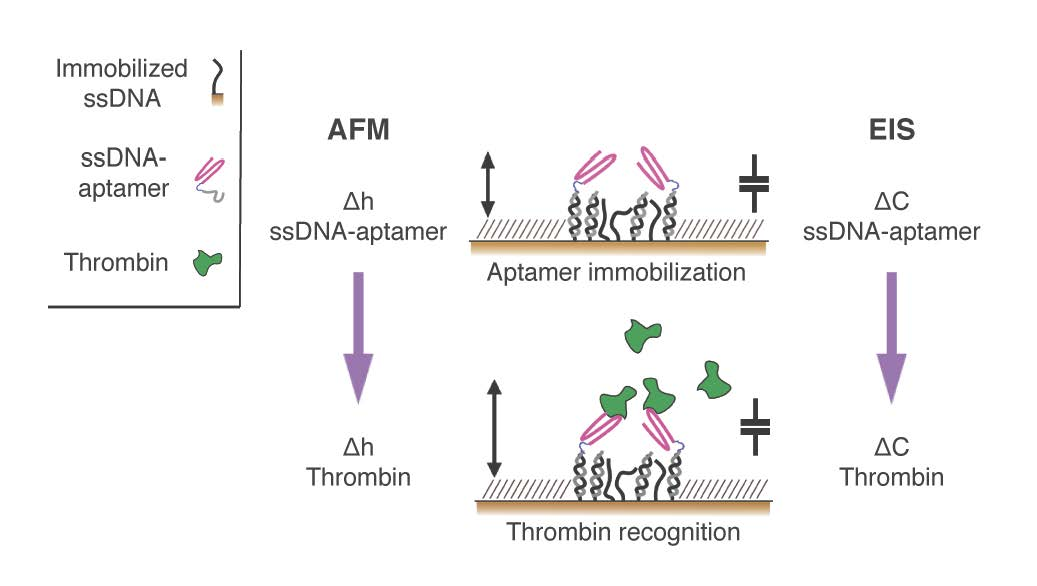
In this paper, we exploited aptamers as the active recognition elements of miniaturized DNA-based biosensors. We modified aptamers with a DNA tag (cDNA), meant to hybridize to micron-sized surface-grafted complementary DNA monolayers, to create the desired functional areas (Figure 1). In particular, we carefully optimized the immobilization strategy to implement DNA-modified aptamers onto two innovative, DNA-based miniaturized sensor platforms: (i) atomic force microscopy (AFM)-based nanoarrays, and (ii) electrochemical impedance spectroscopy (EIS)-based microelectrodes. Both of these platforms have been designed and developed to allow for the sensitive detection of biomolecules in small sample volumes.
In the case of nanoarrays, we capitalize here on the exploitation of AFM-based lithography, nanografting [6,7,8], and AFM topographic imaging in physiological environment successfully demonstrated in the work of Bano et al. for the detection of multiple proteins in standardized human serum [9], and successively by Bosco and Ganau et al., for the ultimate integration with a device for cell sorting, to measure the secretome of few selected cells [
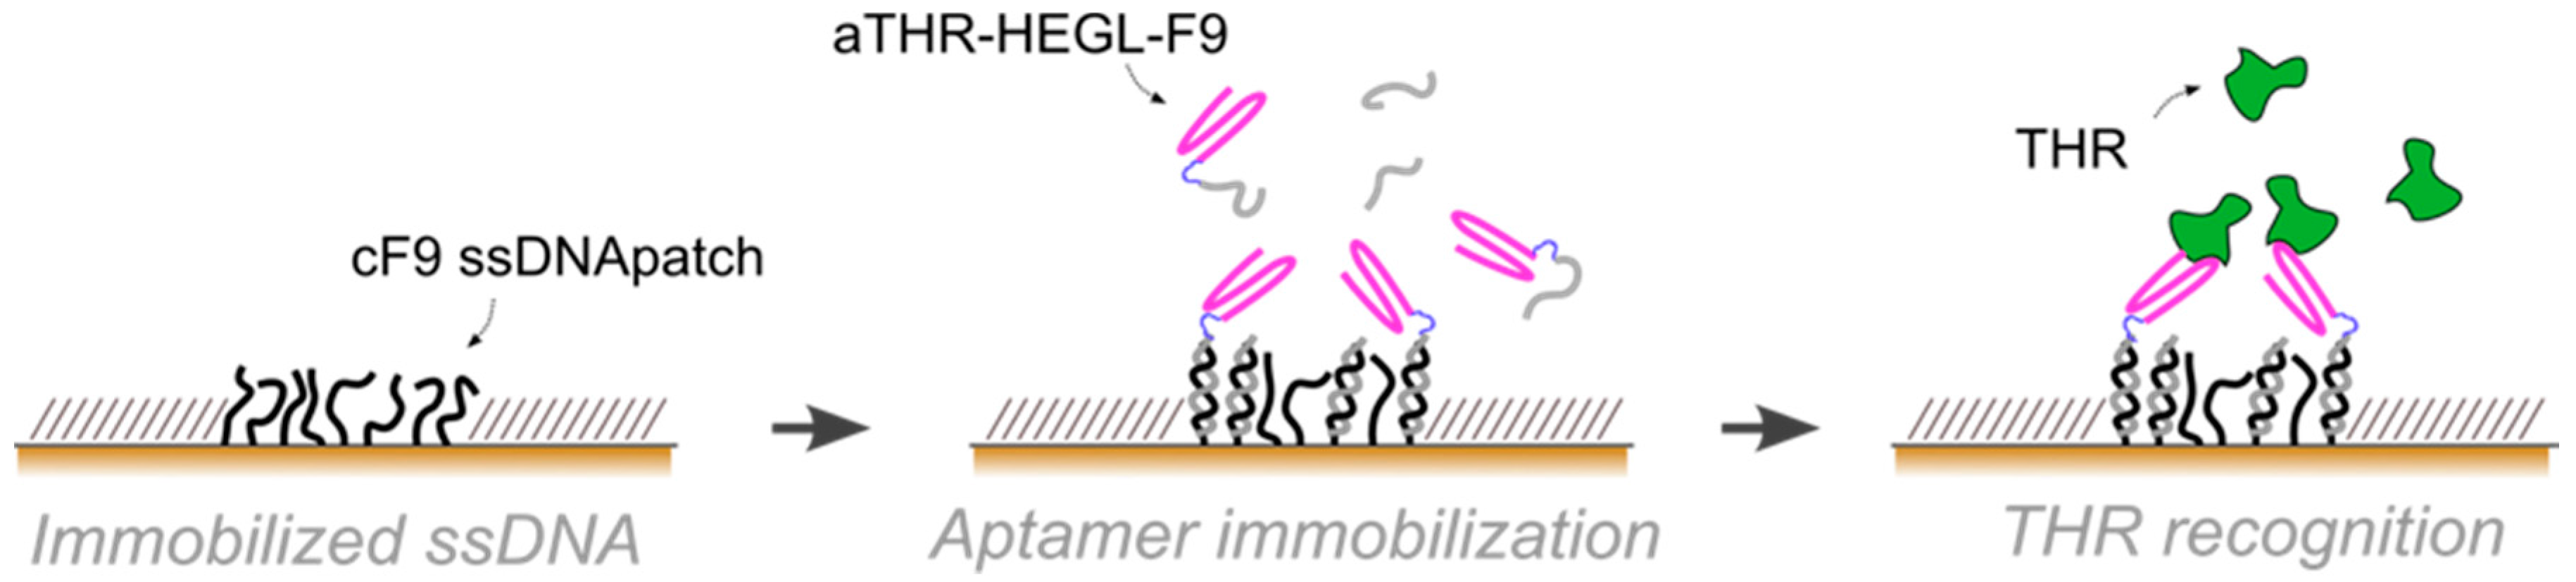
10]. By AFM nanografting we confined nanospots of thiol-modified single-stranded DNA monolayers inside a bio-repellent, self-assembled monolayer (SAM) of oligoethyleneglycol-terminated alkanethiols. The density of the DNA-confined SAM can be tuned via nanografting, and adjusted to the steric requirements of the biorecognition elements. On such active DNA nanospots, the aptamer-cDNA conjugate is then loaded through Watson-Crick base-pairing, in a process known as DNA-directed immobilization [9]. On the other side, an electrochemical impedance-based biosensor, with a three-electrode design developed in our group for the recognition of nucleic acids [11,12], are tested towards protein detection through modified aptamers. The working micro-electrode is fully covered by a functional, thiolated, single-stranded DNA SAM, on which the aptamer-cDNA conjugate is then loaded via DDI.
As a proof of principle, in this study we used an extensively-investigated aptamer for thrombin (THR) [13] that shows a well-characterized structure and binding properties (KD = 50 nM), confirmed by several studies [14,15]. Two constructs were proposed in this regard: a simple design consisting of the aptamer region on the 5′ side, extending with the immobilization region complementary to the DNA grafted monolayer on the 3′ side (Supplementary Materials, Figure S1a); a second design similar to the first one, but containing a hexaethilenglycol-spacer (HEGL) between the two regions to improve the functionality of aptamer binding site (Supplementary Materials, Figure S1b). As stated in several works, the use of polyethyleneglycol groups can significantly improve biorecognition sensitivity by reducing nonspecific interactions and steric hindrance effects [16,17]. In both cases the surface linking oligo sequence (with an alkanethiol linker to bind to the gold surface), and the complementary one on the aptamer side, were carefully selected to have minimal influence on the protein binding—aptamer region in order to avoid possible interferences during aptamer immobilization and then on the aptamer binding interaction with THR.

2. Materials and Methods

2.1. Preliminary Affinity Characterization of the DNA-Aptamer Constructs

Affinity characterization of the DNA-aptamer constructs was first carried out in silico using the web service UNAFold, developed by Zucker and his coworkers [18]. The software application [19] for hybridization of two different oligonucleotide strands was used to generate temperature-dependent concentration plots of the tested sequence pairs in buffer, considering an ionic composition of 150 mM Na+, 2 mM Mg2+, similar to the binding buffer used in further wet experiments. The calculated concentrations from the plot data for hybridized and free sequences at 25 °C were further used to determine the theoretical dissociation constants (KD). In this regard theoretical KD values were calculated and compared for the thiolated linker sequence cF9 (5′-CTTCACGATTGCCACTTTCCAC-3′) vs. the protein binding aptamer sequence (5′-GGTTGGTGTGGTTGG-3′) and the complementary hybridization region F9 (5′-GTGGAAAGTGGCAATCGTGAAG-3′) used in the aptamer constructs. The designed aptamer constructs were further tested in bulk conditions for their functionality, testing the binding affinity for human thrombin (HT) in a qualitative electrophoretic mobility shift assay (EMSA) (Supplementary Materials). Two different aptamer constructs were prepared: the one in which the F9 sequence is directly extending from the aptamer sequence (5′-GGTTGGTGTGGTTGGGTGGAAAGTGGCAATCGTGAAG-3′), named F9aTHR and with hexaethyleneglycol (HEGL) linker in between, (5′-GGTTGGTGTGGTTGG-HEGL-GTGGAAAGTGGCAATCGTGAAG-3′), named F9-HEGL-aTHR. All the reagents in the binding experiments including buffers, human thrombin and materials used for synthesis of aptamer constructs F9aTHR and F9-HEGL-aTHR, were ordered from Sigma-Aldrich Corp. (Saint Louis, MO, USA).
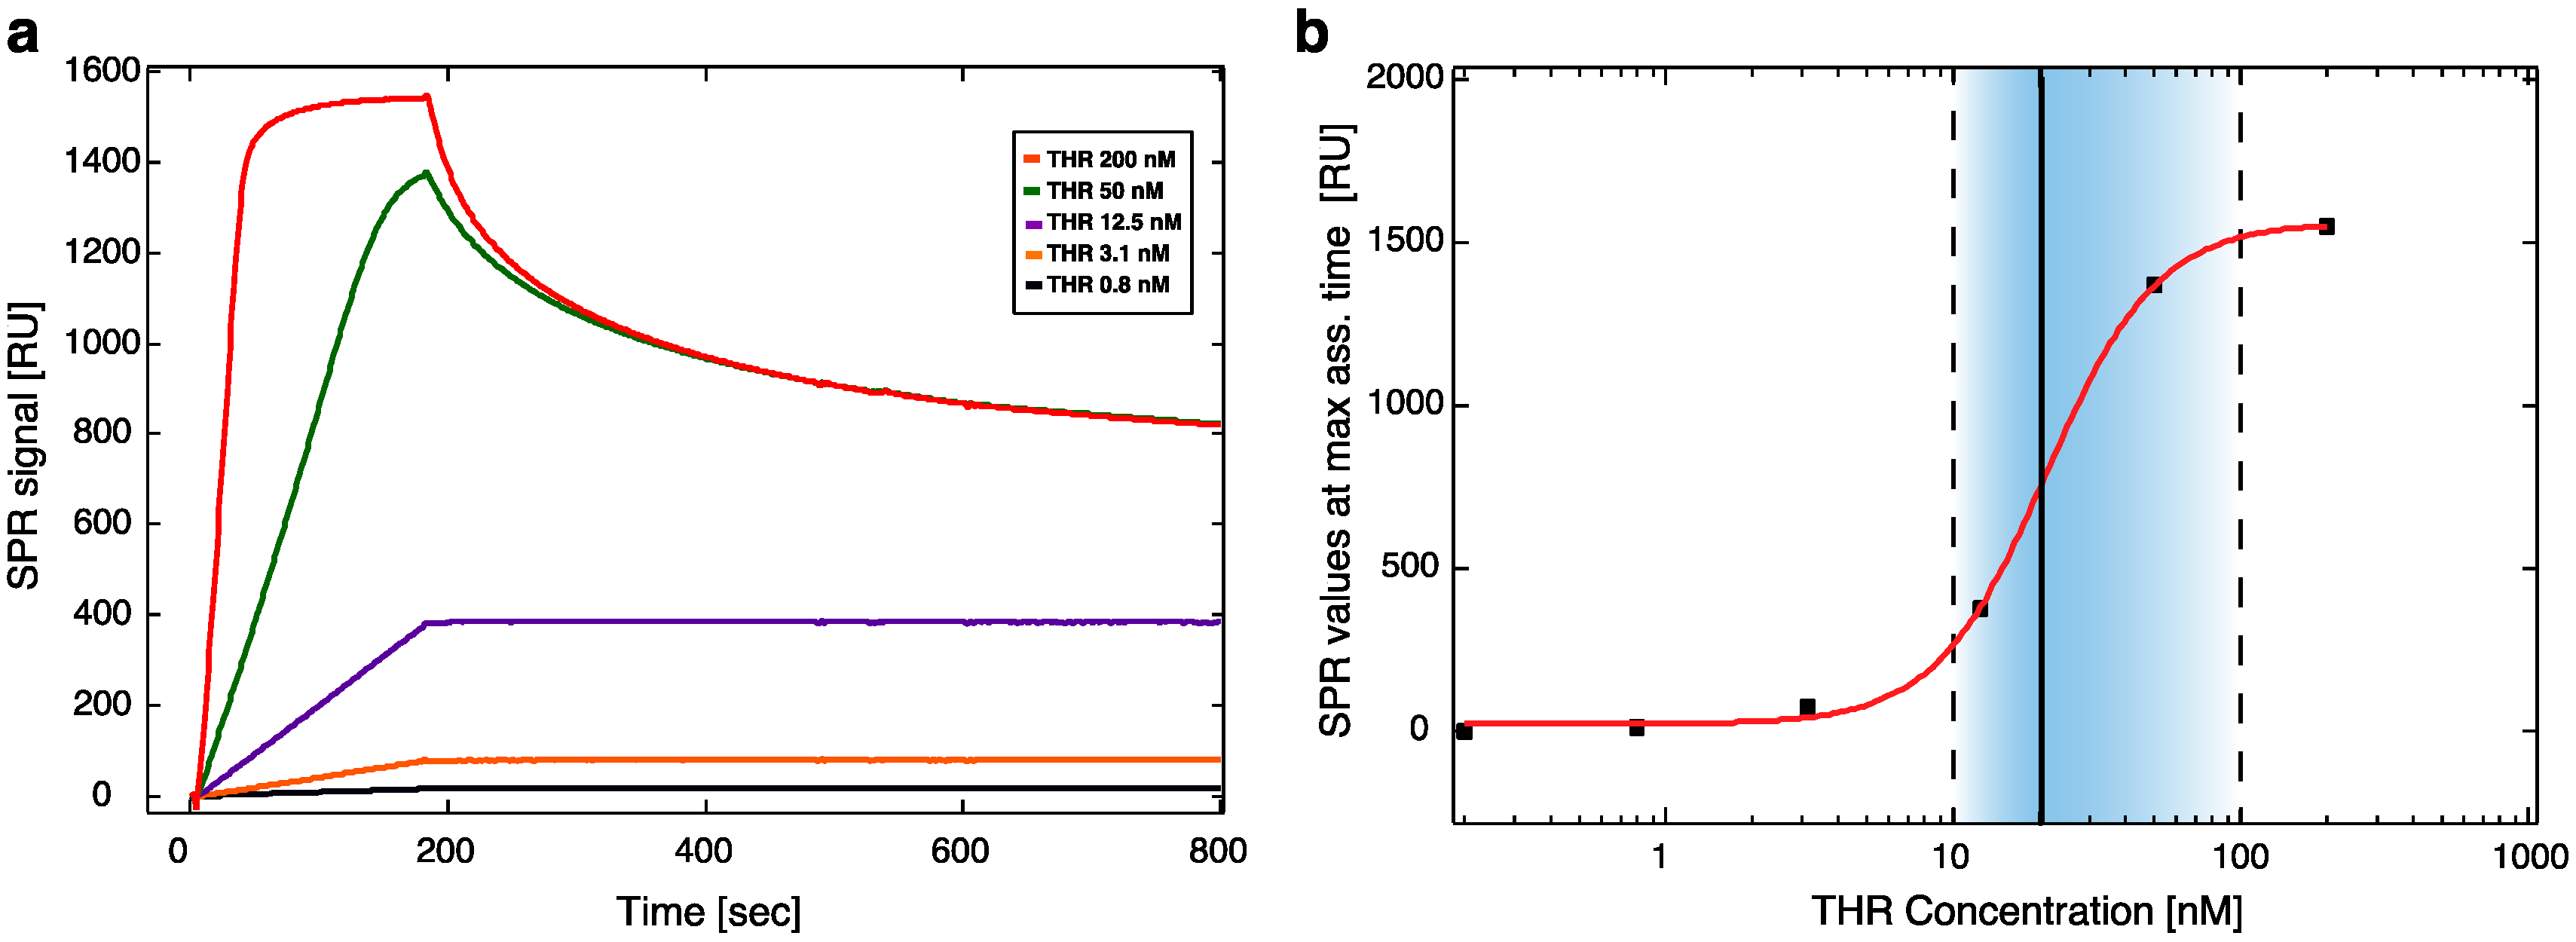
To test aptamer affinity on surfaces, a Biacore X100 Surface Plasmon Resonance (GE Healthcare, Little Chalfont, Buckinghamshire, UK) instrument was used at a constant temperature of 25 °C. A continuous flow (5 μL/min) of PBS buffer (running buffer) was maintained during all the experiments. First, a biotinilated cF9 sequence (cF9-biotin, 2 μM in PBS buffer) was immobilized over the Biacore SA gold chip surface. The immobilization through streptavidin-biotin binding was stopped after reaching a binding level of ~1200 RU, corresponding to an amount of ssDNA on the surface that ensure an efficient attachment of the molecules in the following steps of the experiment; then the surface was rinsed with two 1 min pulses of 50 mM NaOH solution, in order to remove unbound cF9-biotin [20]. The hybridization was carried out by incubation with F9-HEGL-aTHR at 30 μM in TE buffer with 1 M NaCl until reaching a binding level of ~500 RU, to form an active layer suitable to detect a binding signal also with the lowest concentrations of analyte. The immobilization procedure was followed by a flow of running buffer for 2 h in order to remove aptamers non-specifically bound to the surface and to stabilize the baseline. After this procedure the signal remained constant without any baseline drifting. Binding affinity tests were performed injecting different dilutions of thrombin (0, 0.2, 0.8, 3.1, 12.5, 50, and 200 nM) in running buffer at a flow rate of 30 μL/min for 3 min (association phase) and afterwards flushing with running buffer for 5 min (dissociation phase). For the regeneration of the surface 1 min pulses of a 50 mM NaOH solution were used, followed by a stabilization time of 5 min [21]. Binding affinity parameters were calculated using the BIAevaluation 3.1 software (Biacore GE Healthcare, Little Chalfont, Buckinghamshire, UK).

2.2. AFM-Based Nanoarrays

All AFM experiments were carried out on a XE-100 Park Instrument (Park System Corp., KANC 4F, Suwon, Korea) with a customized liquid cell. A tip-assisted AFM-based nanolithography technique has been used to fabricate DNA nanoarrays with high surface density (1–2 × 10¹³ molecules/cm2): using Si cantilevers (NSC36B Mikromasch (Mikromasch, Innovative Solutions Bulgaria Ltd., Sofia, Bulgaria), spring constant: 0.6 N/m) multiple nanografting assembled monolayers (NAM) of thiol-modified single-stranded DNA (ssDNA), named cF9, were prepared by serial AFM-based nanografting inside a self-assembled monolayer (SAM) of a top oligo ethylene glycol terminated alkanethiol, TOEG ((1-mercaptoundec-11-yl)hexa(ethyleneglycol), HS-(CH2)11-(OCH2CH2)6-OH from Sigma Aldrich) on ultraflat gold surfaces [22] following standard protocols reported earlier [9,23]. The DNA patches were obtained promoting the replacement of the TOEG molecules with the oligonucleotides by the AFM tip scanning an area of 1 μm × 1 μm or less at high force (about 100 nN) in the presence of a solution of thiolated ssDNA sequences (5 μM in TE buffer 1 M NaCl) at a scan rate of 2 Hz. Several patches (6–8 for each experiment, to guarantee good statistics) of cF9 ssDNA were produced.
Aptamer immobilization was performed via DDI, incubating the ssDNA SAM with 1:1 mix of F9-HEGL-aTHR and F9 at 2 μM in TE buffer with 1 M NaCl in order to avoid steric hindrance by reducing the aptamer surface density, hence, preserving the activity.
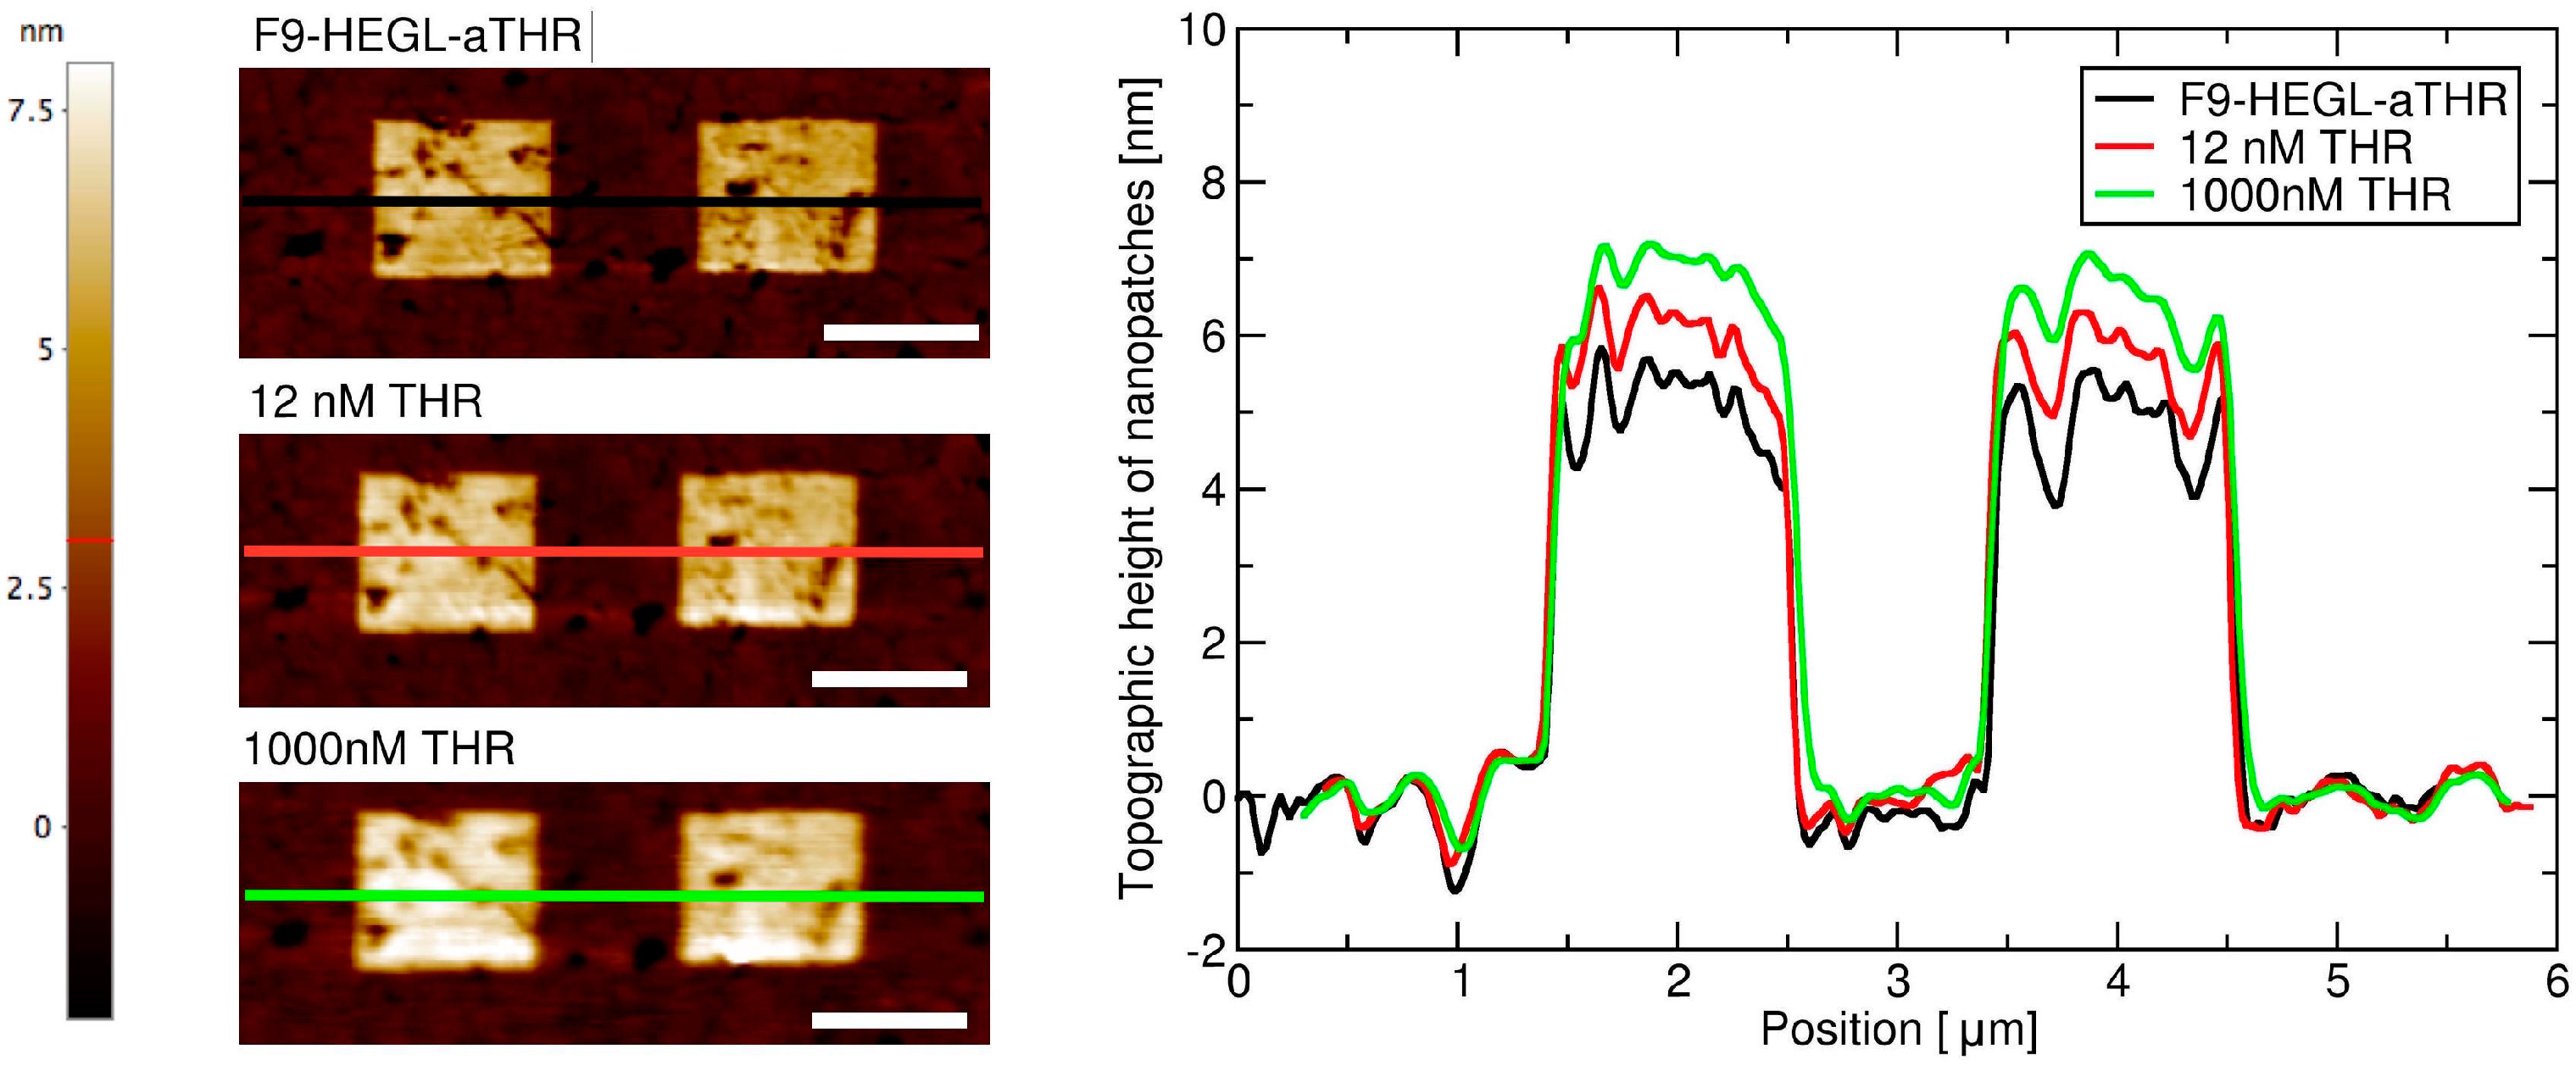
Aptamer-thrombin binding was promoted through the incubation of aptamer nanopatches for one hour with a solution (volume of about 100 μL) containing thrombin at different concentrations (THR buffer: 20 mM Tris pH 7.4, 140 mM NaCl, 5 mM KCl, 1 mM MgCl2, 1 mM CaCl2); topographic height variations over the NAMs were measured with AFM in gentle contact with standard silicon cantilevers (CSC38 Mikromasch, spring constant: 0.06 N/m) at a 1 Hz scan rate, applying a force of 0.1 nN to detect and quantify binding affinity.

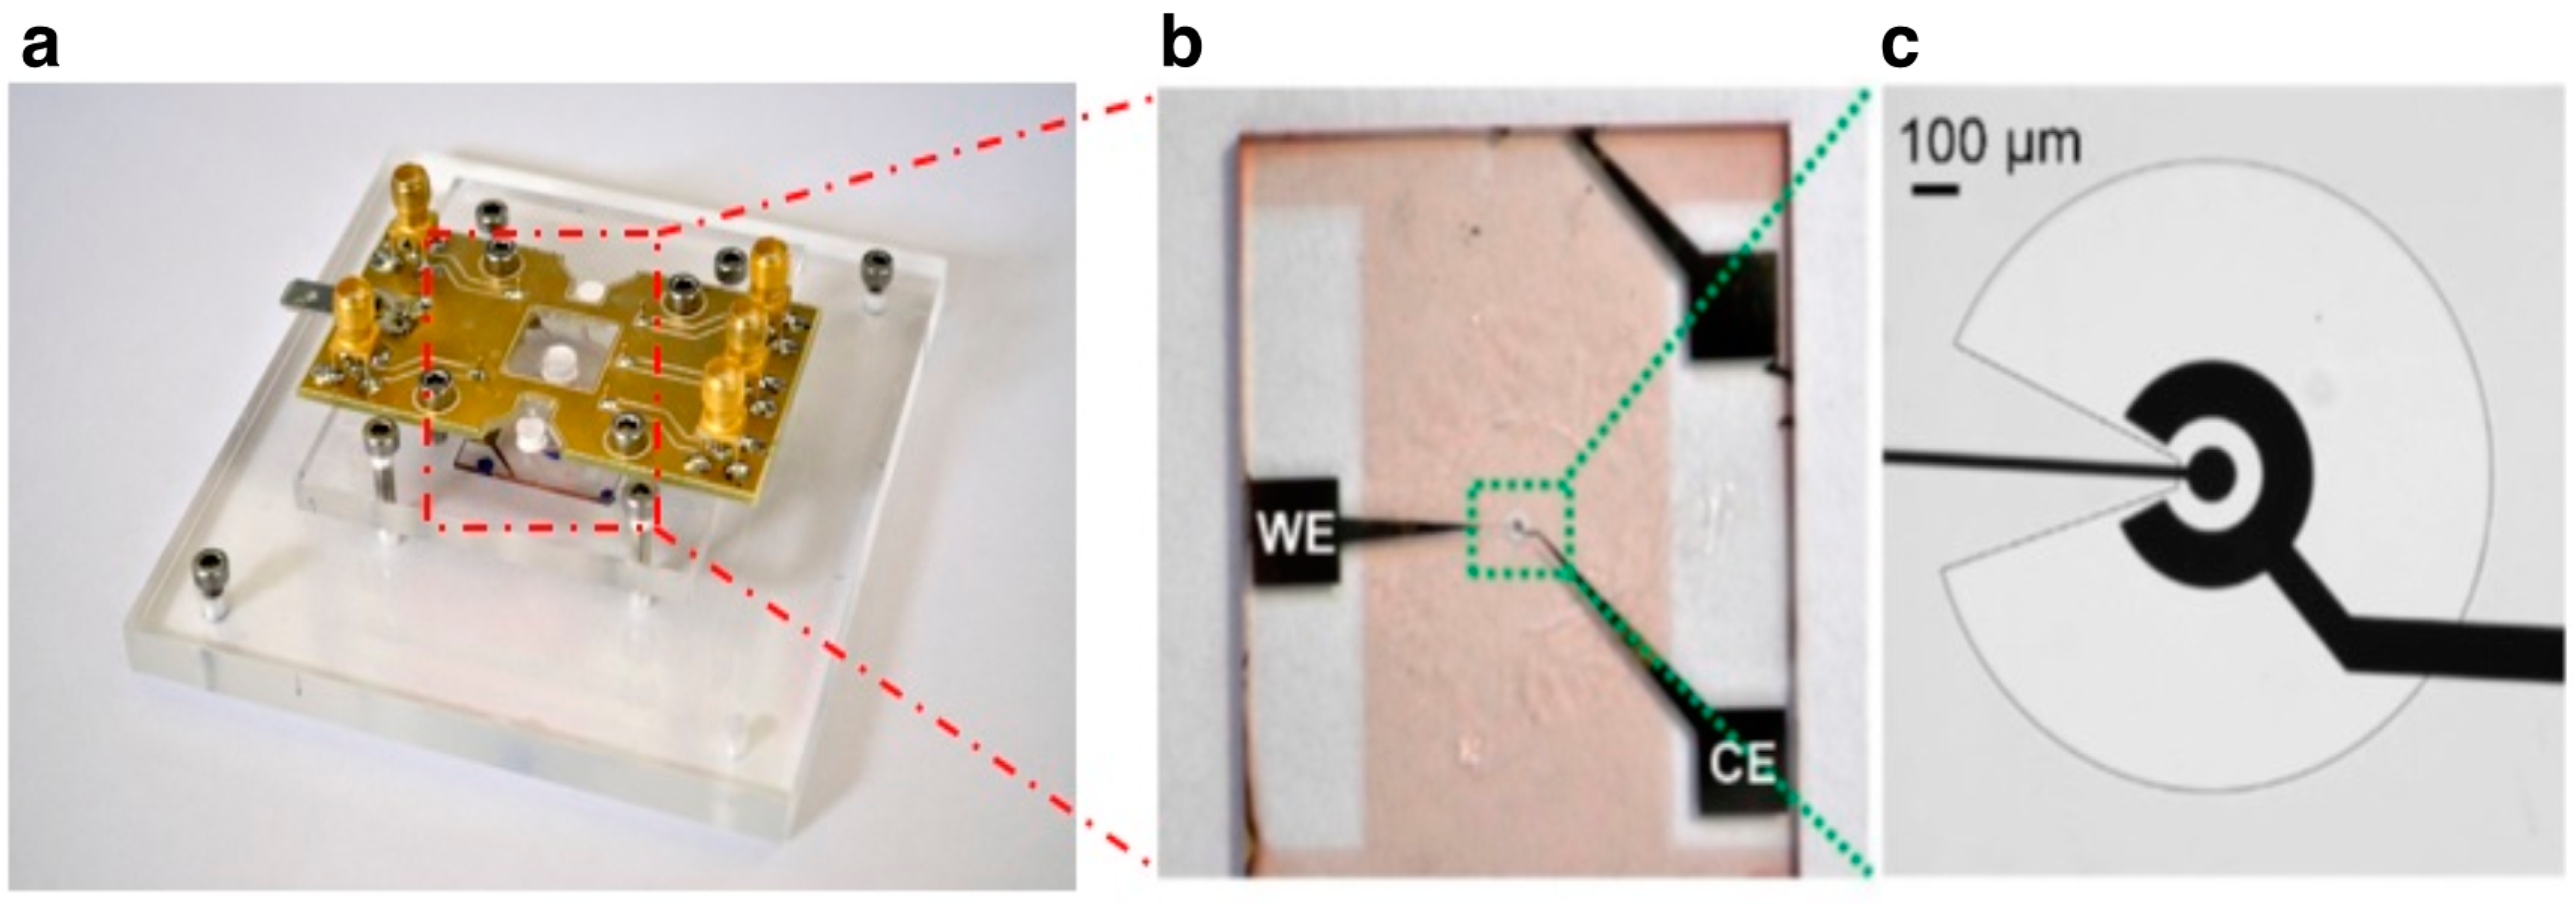
2.3. EIS-Based Devices

Electrochemical impedance spectroscopy (EIS)-based devices were fabricated using optical lithography techniques. They consist of a three-electrode electrochemical cell with microfabricated working (WE) and the counter (CE) gold electrodes and a classical mm-sized Ag/AgCl reference electrode (RE). As in standard electrochemical setup, the potential (AC, 10 mV rms) is applied across WE and RE, whereas the current is measured across WE and CE. The differential capacitance (Cd) defines the charge density (σM) change at the metal surface for a small variation of the applied potential (φ):
C d = σ M φ
is obtained by fitting the current response of the device upon application of the AC voltage at four frequencies: 100 Hz, 200 Hz, 250 Hz, and 400 Hz, by using the HEKA PG340 USB bipotentiostat (HEKA Elektronik, Dr. Schulze, GmbH, Lambrecht, Germany). As already explained in [11,12], at each frequency we collect 200 complete periods from which we compute the root mean squared value of the measured current, Irms = 2πfVrmsC
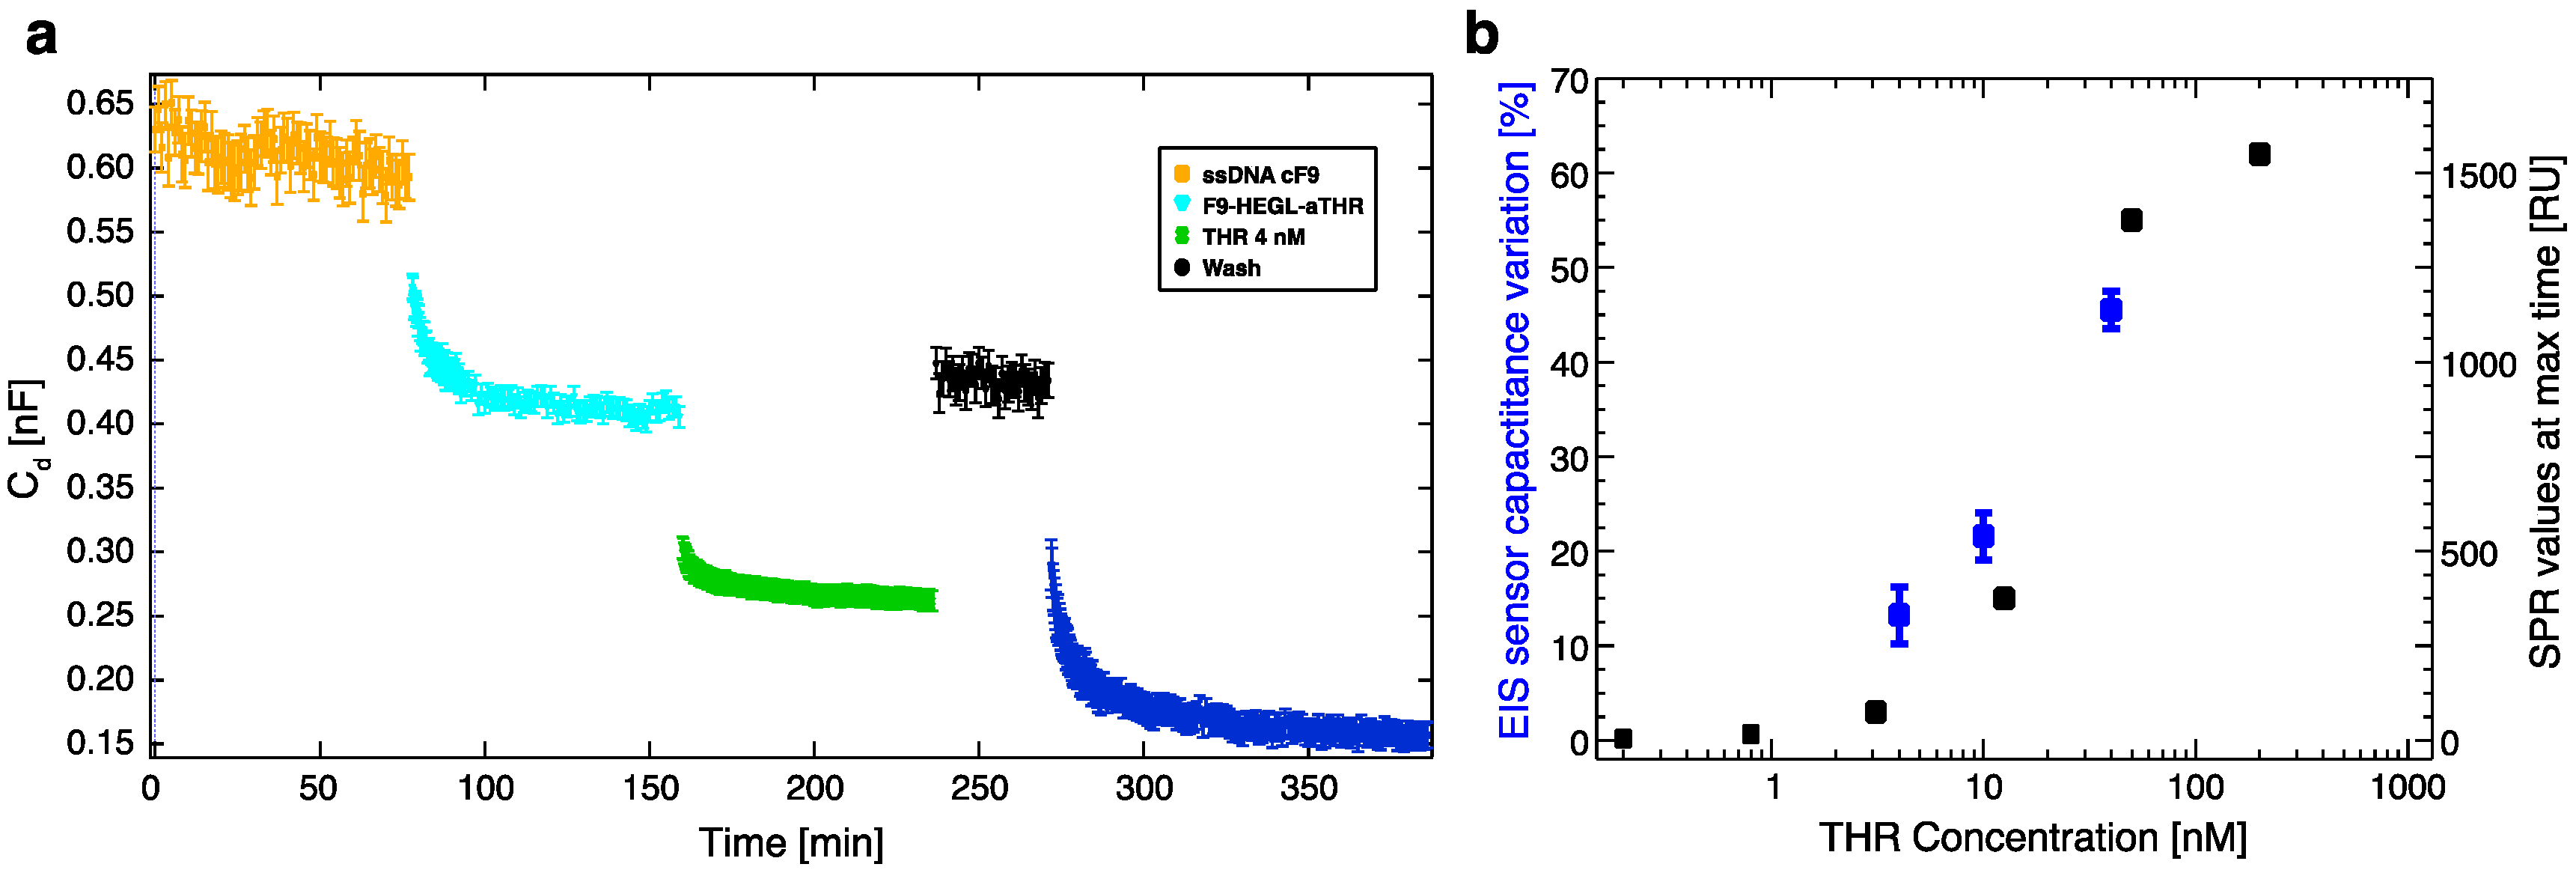
d, and the relative uncertainties using error propagation analysis. We also proved that the device is reusable up to several times and the data are reproducible on different sensors with a standard deviation of only a few percent.
Cd variations, recorded upon exposing the electrochemical cell to aptamer-DNA conjugate/analyte containing solutions, were quantitatively connected to the number of biorecognition events. In particular, Cd is mostly affected by molecular layer height changes, the replacement of water molecules in the biological layer, and by electrical charge redistribution upon biorecognition.
Electrodes were first patterned on clean microscope slides using MEGAPOSITTM SPRTM 220 1.2 (Series Photo-Resist) (The Dow Chemical Company, Michigan, USA) as the optical positive resist. The slides were then metalized in an e-beam evaporator, with a 20-nm Ti layer, in order to promote the adhesion, followed by 80-nm Au layer deposition and then kept in an acetone bath overnight in order to perform the lift-off process. After lift-off, the electrodes were coated again with an insulating layer of NANOTMSU8-2002 (MicroChem Corp., Westborough, MA, USA), shaped to expose only the circular part of WE and CE. SU8 was used as insulating material to reduce the active surface area for biorecognition. The circular WE exposed to the solution, the arc of the CE and the profile of the SU8 layer, which covers the rest of the metal electrodes, are visible in Figure 2.
The insulating SU8-layer had a thickness of about 1.5 μm, measured using a 3D surface profilometer. Gold electrode functionalization with ssDNA molecules was carried out using the well-established procedures for creating DNA SAMs on gold [24,25,26]. Initially the electrodes were wetted for 15 min with a drop of a high-ionic-strength buffer, TE NaCl 1 M, containing cF9-SH to create a low density DNA SAM (2.1 × 10¹² molecules/cm2) [12]. Low density monolayers were chosen to avoid steric hindrance limitations to the hybridization efficiency. In this regime DNA hybridization follows Langmuir-like kinetics [12,27], while electrostatic charges are largely screened allowing for fast hybridization kinetics and reducing the limit of detection of the device. After each functionalization step the devices were rinsed with the proper DNA/protein buffer solution, prior to capacitance measurements. SAM hybridization was performed with 1 μM DNA-aptamer construct in about 100 μL solution (same volume as for the nanoarray measurements) containing 100 mM KCl. To follow hybridization kinetics, we initially measured at a rate of four measurements/min for 15 min, then we slowed down to one measurement/min until the Cd differential variations between successive points were lower than 6%, which we considered to be the “steady-state” of our measure.

3. Results and Discussion

3.1. Preliminary Affinity Characterization of the DNA-Aptamer Constructs

All of the experiments were carried out using a buffer (THR buffer) that folds the aptamer in the functional conformation for the recognition of the antigen. To this aim, preliminary tests were carried out to check that both the affinity of the DNA-aptamer construct for the surface immobilized complementary strand and the one for the ligand were preserved. In this regard an estimation of hybridization affinity between the thiolated linker and aptamer construct was first performed in silico. According to UNAFold analysis, the calculated KD value of cF9-F9aTHR binding in bulk conditions resulted to be in the order of magnitude of attomolar, much lower than the KD value obtained for F9 binding to the aptamer region alone (6.5 μM), therefore, suggesting that the immobilization of the DNA-aptamer constructs is occurring essentially through the cF9-F9 pairing. Using EMSA, we also verified that both DNA-aptamer constructs were able to bind thrombin (Supplementary Materials, Figure S2). However, F9-HEGL-aTHR was observed to bind more efficiently to THR compared to F9aTHR, so in the following experiments we decided to focus on the first construct.
Binding affinity analysis was then performed on surface immobilized aptamers via SPR, following the DNA-aptamer immobilization procedure described in the previous session. A wide THR concentration range (0.8–200 nM) was screened with Biacore. The signal response is proportional to the THR concentration (Figure 3a); the mostly straight binding lines in the association phase obtained with analyte injections up to 12.5 nM show a possible mass transfer contribution. These curves do not display a sufficient curvature to perform kinetic analysis. Although an equilibrium state has not been reached for all the concentrations tested, we recorded the binding level at the end of the association phase. These values, plotted against THR concentration, were fitted with a single site interaction model. This “non-steady-state” analysis implies an underestimation of the binding affinity [28,29]. Therefore, we can conclude from the SPR data that the KD is in the range 10–100 nM, in agreement with the value reported in the literature for the aptamer-THR binding (KD = 50 nM) (Figure 3b).

3.2. AFM Mechanical Sensing on Nanostructured Assay

The AFM nanoarray platform was built starting from cF9 DNA nanografting, on which we loaded via DDI the F9-HEGL-aTHR aptamer construct (Figure 4 left, top image).
By using AFM topographic imaging, we monitored height profile changes over DNA-aptamers loaded by DDI on cF9 nanografted arrays (Figure 4: left, upper patches; right, black profile) vs. different THR concentrations in the binding buffer (Figure 4 left, mid and lower images; Figure 4 right, red and green profiles correspond to 12 nM and 1000 nM THR, respectively), due to the conformation change of the aptamer upon binding the ligand. In all these steps the TOEG SAM embedding the patches is used as a reference level to monitor topographic height changes [9]. Differential height changes are shown in Figure 5a. By plotting height change vs. concentration, we extracted an effective dissociation constant for this system in the range 10–100 nM, a value that is in good agreement both with literature and with the SPR results obtained using the same molecular construct. As one can clearly see in Figure 5a, the data are affected by significantly large errors that could be attributed to the fact that when the ligand binds to the aptamer, it folds to a more compact shape.
This results in a reduced AFM differential height, since the height increase due to protein uptake is counterbalanced by the height decrease due to a change in binder conformation. Additionally, the softness of the nanopatches contributes to such large errors: the coupling of the aptamer to the nucleic acid linker, in fact, increases the compressibility of the entire nanopatch, giving more variability while measuring AFM height variation [30]. We then performed a so-called “compressibility analysis”: we monitored the softness of the patches, exposed to different THR concentrations, by imaging progressively the patches at increased tip load. The variation of (absolute) patch height vs. tip load for the bare DNA patches, the patches loaded with the aptamer constructs and then the last ones exposed to different THR concentrations are shown in Figure 5b. As shown in Figure 5b, while applying only 200 pN, nanopatches can be compressed up to 40% of the height measured at minimum force (about 50 pN below which the AFM tip loss its contact with the surface). However, from such analysis we can conclude that the higher the THR concentration, the stiffer the patch towards tip compression. The increase of nanopatch stiffness upon THR immobilization is due to the high compactness of globular proteins (as THR), much higher than for nucleic acids at the ionic strength used for the experiments. A stiffness change of about 30%–35% upon 4 nM THR binding can, in fact, be estimated from the compressibility experiments, at variance with the patch height that stays almost constant.

3.3. EIS on Self Assembled Monolayers

Finally we performed an EIS analysis of the DNA-aptamer construct binding. First we checked the stability of the DNA-aptamer SAM-covered electrode in KCl buffer solution (Figure 6a, in orange); then, we changed the buffer with the one for THR, which contains divalent ions. The capacitance-change kinetics measured in-situ upon changing of the buffer solution (Figure 6a, in cyan) has to be attributed to the electrode interface rearrangement caused by the conformational reorganization of the nucleic acids upon the interaction with the divalent salt solution. At this point, after stabilization, we challenged the device for thrombin detection. In particular, we monitored the capacitance response to three different THR concentrations, on the same device, regenerating it (using a solution with 2 M NaCl) after each test. The capacitance variation upon binding of 4 nM THR is shown in green. After regeneration, we tested again the stability of the aptamer-functionalized electrode (in black) and incubated the sensor with a solution with a 40 nM thrombin (in blue). We compared the maximum capacitance variation between the two equilibrium states at different concentration (4, 10 and 40 nM) by the EIS sensor obtaining 12.3% ± 3.9%, 21.1% ± 3.3%, and 44.9% ± 2.7% respectively, in very good agreement with SPR data (Figure 6b).

4. Conclusions

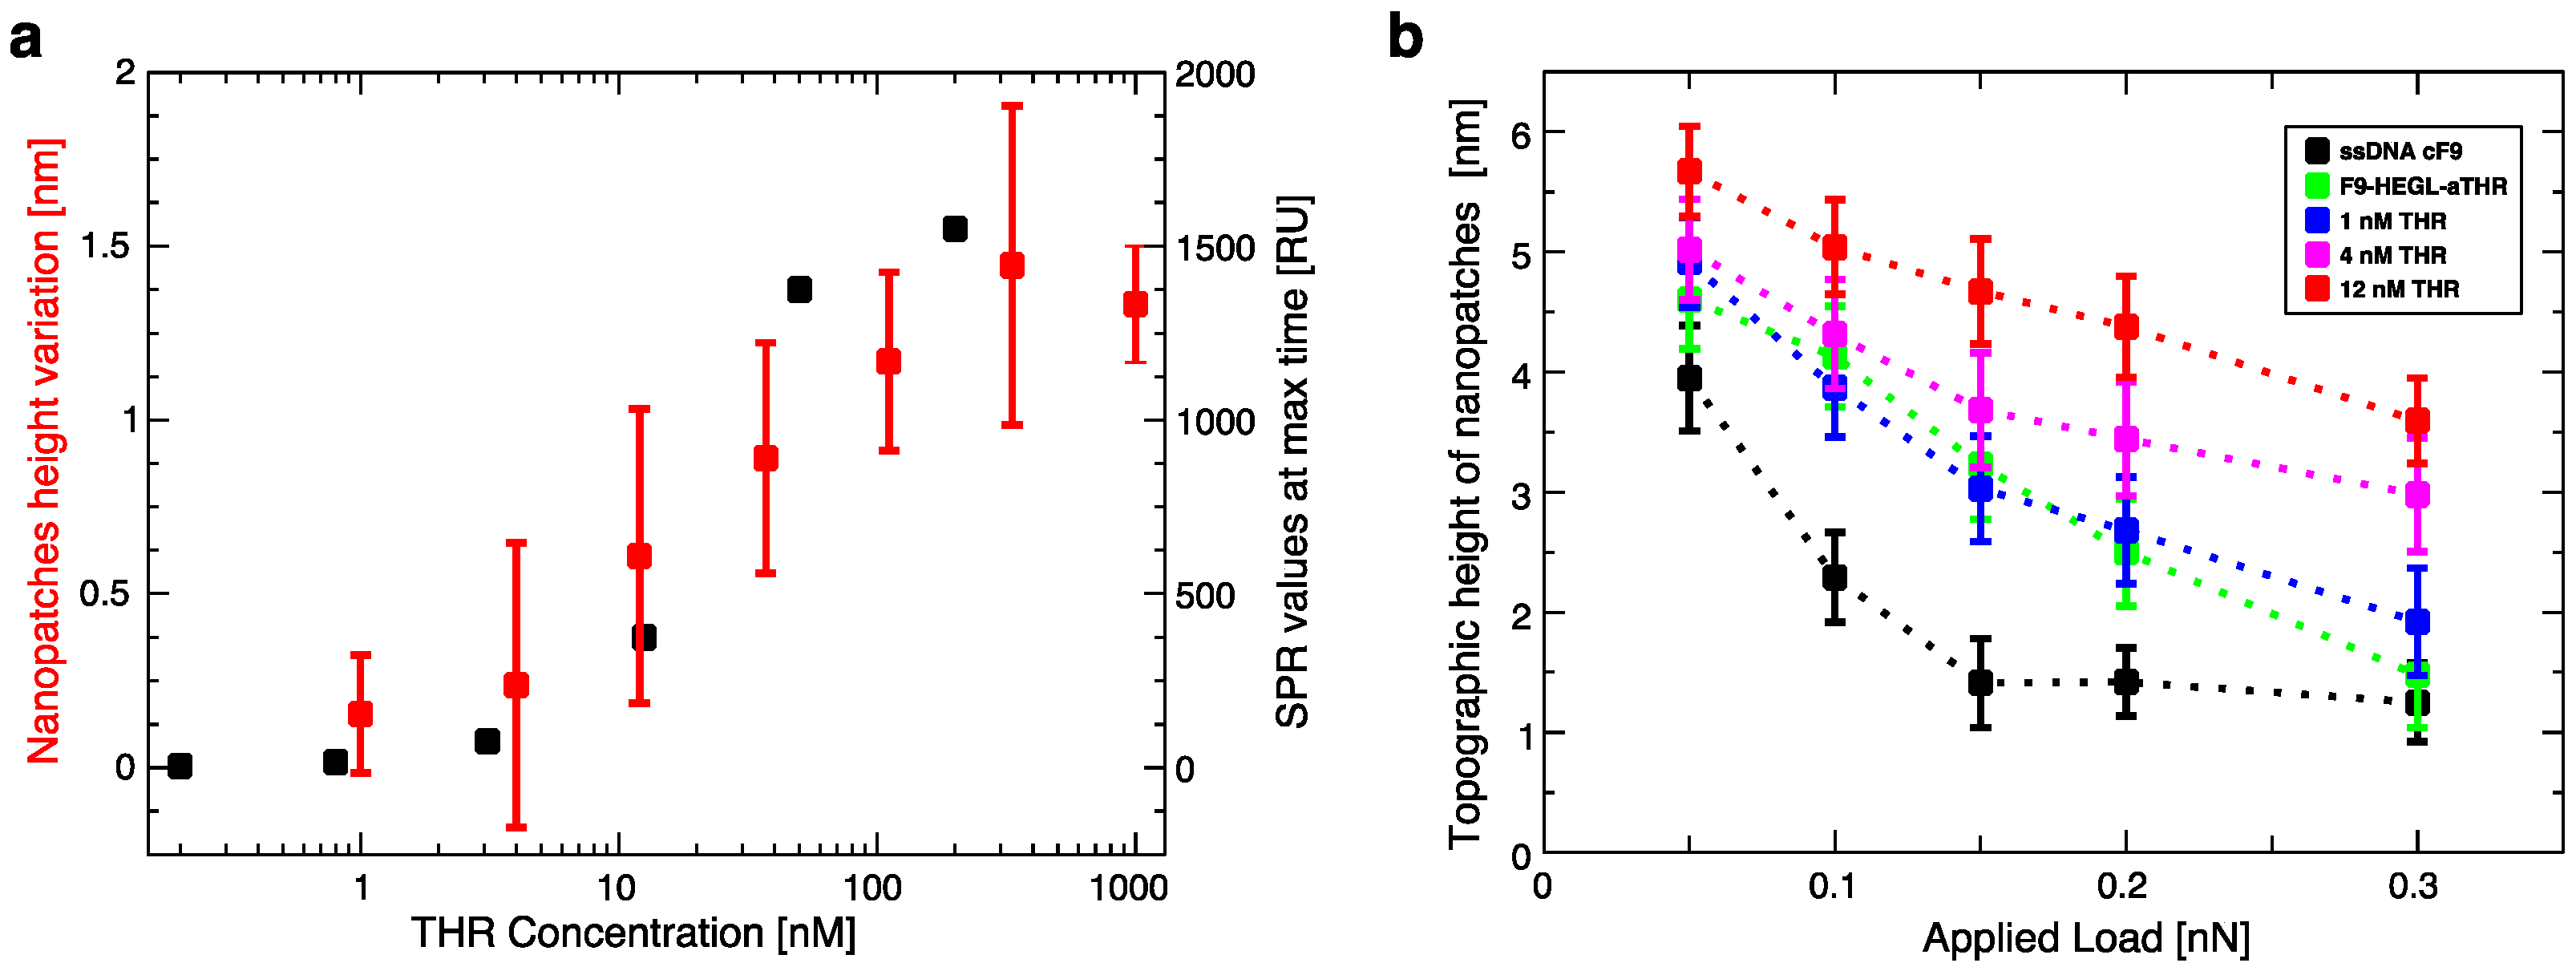
Within this work we proved that short oligo-labelled aptamers can be used for the detection of biomolecules in miniaturized, surface-based devices, as nanoarrays and electrochemical microfabricated cells, in a scheme which allows for multiplexing analysis. First, we demonstrated in bulk that by linking a short oligo via a polyethileneglycol linker to an aptamer designed and optimized for thrombin recognition, the binding affinity was preserved. Then, by immobilizing the DNA-aptamer construct on a SPR chips via DNA-directed immobilization and performing binding affinity measurements via SPR, we obtained a value of KD in the range of 10–100 nM, in good agreement with the available literature for in bulk studies, demonstrating that the aptamer functionality was retained upon surface immobilization. Successful thrombin detection was achieved by tuning aptamer surface density on the active area to low values in order to allow aptamers conformational rearrangement necessary to bind the ligands. Additionally, we demonstrated that carefully optimized miniaturized devices could be used in a quantitative manner to determine thrombin concentration in solution, with the given, ultimate advantage with respect to other assays to be used with low volume biosamples. We used two miniaturized platforms, one based on AFM lithography and topography readout, and one on electrochemical impedance spectroscopy measurements. In both cases the measured binding affinity curves overlapped with SPR data impressively well. In particular, although these measurements are preliminary, we observed that at low thrombin concentrations (<5 nM), the EIS sensor is more sensitive than SPR, and that could be pushed to reach lower detection limits (we expect, in the pM range). On the other hand, DNA nanoarrays also allowed for an estimation of the binding affinity which resulted in good agreement with SPR data. Here, the change of conformation of aptamer upon THR binding towards a more compact structure worked reducing the expected height variation due to immobilization of THR on the device. Although still detectable, the error associated to the measurements makes this device less reliable than SPR chips to measure binding affinity. However, mechanical compressibility measurements performed on the nanopatches helped to validate the result. The height change measurements on the nanoarrays, moreover, can be combined with the monitoring of roughness variations on the patch and outside it to infer the occurrence of specific binding only on the patch, and exclude the presence of aspecific binding outside it, even without the use of (expensive) sandwich schemes.
We put forward the idea to complement our data with AFM-based force spectroscopy measurements to investigate the variation of the mechanical properties of the DNA-aptamer conjugate structures upon ligand binding. This additional strategy might be particularly profitable given the peculiar properties of aptamers, which undergo a global conformational change upon binding. Furthermore, combining the output of these two techniques, a structural-mechanical model for the interface may be derived to be, in turn, used to describe the details of capacitance changes at the gold electrode.

Supplementary Materials

The following are available online at: www.mdpi.com/2227-9040/4/3/18/s1.

Acknowledgments

This work has been supported by a Project financed by Cross-Border Cooperation Programme Italy-Slovenia 2007–2013 (Project PROTEO, Code N. CB166) (to E.A., J.M., L.C.) and by a grant from Associazione Italiana per la Ricerca sul Cancro (AIRC) (AIRC 5 per mille 2011, No. 12214) (to A.B., P.C., L.C.). We would like to thank Pietro Parisse and Paola Storici for stimulating discussions.

Author Contributions

A.B. designed the experiments, performed the AFM measurements, and helped with EIS measurements; E.A. designed the experiments, performed the SPR measurements and part of the AFM experiments; J.M. designed and provided all the DNA-aptamer constructs; P.C. performed all the EIS experiments; L.C. designed the experiments and coordinated the work. All the authors have contributed to write the manuscript and have given approval to the final version of it.

Conflicts of Interest

The authors declare no conflict of interest.

References

  1. Stegh, A.H. Toward personalized cancer nanomedicine—Past, present, and future. Integr. Biol. 2013, 5, 48–65. [Google Scholar] [CrossRef] [PubMed]
  2. Niemeyer, C.M.; Sano, T.; Smith, C.L.; Cantor, C.R. Oligonucleotide-directed self-assembly of proteins: Semisynthetic DNA-streptavidin hybrid molecules as connectors for the generation of macroscopic arrays and the construction of supramolecular bioconjugates. Nucleic Acids Res. 1994, 22, 5530–5539. [Google Scholar] [CrossRef] [PubMed]
  3. Niemeyer, C.M.; Boldt, L.; Ceyhan, B.; Blohm, D. DNA-directed immobilization: Efficient, reversible, and site-selective surface binding of proteins by means of covalent DNA-streptavidin conjugates. Anal. Biochem. 1999, 268, 54–63. [Google Scholar] [CrossRef] [PubMed]
  4. Niemeyer, C.M. The developments of semisynthetic DNA-protein conjugates. Trends Biotechnol. 2002, 20, 395–401. [Google Scholar] [CrossRef]
  5. Niemeyer, C.M. Semisynthetic DNA-protein conjugates for biosensing and nanofabrication. Angew. Chem. Int. 2010, 49, 1200–1216. [Google Scholar] [CrossRef] [PubMed]
  6. Liu, M.; Amro, N.A.; Chow, C.S.; Liu, G.Y. Production of nanostructures of DNA on surfaces. Nano Lett. 2002, 2, 863–867. [Google Scholar] [CrossRef]
  7. Liu, M.; Amro, N.A.; Liu, G.Y. Nanografting for surface physical chemistry. Annu. Rev. Phys. Chem. 2008, 59, 367–86. [Google Scholar] [CrossRef] [PubMed]
  8. Mirmomtaz, E.; Castronovo, M.; Grunwald, C.; Bano, F.; Scaini, D.; Ensafi, A.A.; Scoles, G.; Casalis, L. Quantitative study of the effect of coverage on the hybridization efficiency of surface-bound DNA nanostructures. Nano Lett. 2008, 8, 4134–4139. [Google Scholar] [CrossRef] [PubMed]
  9. Bano, F.; Fruk, L.; Sanavio, B.; Glettenberg, M.; Casalis, L.; Niemeyer, C.M.; Scoles, G. Toward multiprotein nanoarrays using nanografting and DNA directed immobilization of proteins. Nano Lett. 2009, 9, 2614–2618. [Google Scholar] [CrossRef] [PubMed]
  10. Ganau, M.; Bosco, A.; Palma, A.; Corvaglia, S.; Parisse, P.; Fruk, L.; Beltrami, A.P.; Cesselli, D.; Casalis, L.; Scoles, G. A DNA-based nano-immunoassay for the label-free detection of glial fibrillary acidic protein in multicell lysates. Nanomedicine 2015, 11, 293–300. [Google Scholar] [CrossRef] [PubMed]
  11. Ianeselli, L.; Grenci, G.; Callegari, C.; Tormen, M.; Casalis, L. Development of stable and reproducible biosensors based on electrochemical impedance spectroscopy: Three-electrode vs. two-electrode setup. Biosens. Bioelectron. 2014, 15, 1–6. [Google Scholar] [CrossRef] [PubMed]
  12. Capaldo, P.; Alfarano, S.R.; Ianeselli, L.; Dal Zilio, S.; Bosco, A.; Parisse, P.; Casalis, L. Circulating disease biomarkers detection in complex matrices: Real-time, in-situ measurements of DNA/miRNA hybridization via electrochemical impedance spectroscopy. ACS Sens. 2016, 8, 1003–1010. [Google Scholar] [CrossRef]
  13. Bock, L.C.; Griffin, L.C.; Latham, J.A.; Vermaas, E.H.; Toole, J.J. Selection of single-stranded DNA molecules that bind and inhibit human thrombin. Nature 1992, 355, 564–566. [Google Scholar] [CrossRef] [PubMed]
  14. Padmanabhan, K.; Padmanabhan, K.P.; Ferrara, J.D.; Sadler, J.E.; Tulinsky, A. The structure of alpha-thrombin inhibited by a 15-mer single-stranded DNA aptamer. J. Biol. Chem. 1993, 268, 17651–17654. [Google Scholar] [PubMed]
  15. Padmanabhan, K.; Tulinsky, A. An ambiguous structure of a DNA 15-mer thrombin complex. Acta Cryst. 1996, 52, D272–D282. [Google Scholar] [CrossRef] [PubMed]
  16. Charles, P.T.; Stubbs, V.R.; Soto, C.M.; Martin, B.D.; White, B.J.; Taitt, C.R. Reduction of non-specific protein adsorption using Poly(ethylene)glycol (PEG) modified polyacrylate hydrogels in immunoassays for staphylococcal enterotoxin b detection. Sensors 2009, 9, 645–655. [Google Scholar] [CrossRef] [PubMed]
  17. Arya, S.K.; Solanki, P.R.; Datta, M.; Malhotra, B.D. Recent advances in self-assembled monolayers based biomolecular electronic devices. Biosens. Bioelectron. 2009, 24, 2810–2817. [Google Scholar] [CrossRef] [PubMed]
  18. Markham, N.R.; Zuker, M. UNAFold: Software for nucleic acid folding and hybridization. In Bioinformatics: Structure, Function and Applications—Methods in Molecular Biology; Keith, J.M., Ed.; Humana Press: Totowa, NJ, USA, 2008; pp. 3–31. [Google Scholar]
  19. The DINAMelt Web Server. Available online: http://www.mfold.rna.albany.edu/?q=DINAMelt/software (accessed on 1 July 2016).
  20. Zhang, D.; Yan, Y.; Li, Q.; Yu, T.; Cheng, W.; Wang, L.; Ju, H.; Ding, S. Label-free and high-sensitive detection of salmonella using a surface plasmon resonance DNA-based biosensor. J. Biotechnol. 2012, 160, 123–128. [Google Scholar] [CrossRef] [PubMed]
  21. Pasternak, A.; Hernandez, F.; Rasmussen, L.; Vester, B.; Wengel, J. Improved thrombin binding aptamer by incorporation of a single unlocked nucleic acid monomer. Nucleic Acids Res. 2011, 39, 1155–1164. [Google Scholar] [CrossRef] [PubMed]
  22. Gupta, P.; Loos, K.; Korniakov, A.; Spagnoli, C.; Cowman, M.; Ulman, A. Facile route to ultraflat SAM-protected gold surfaces by “amphiphile splitting”. Angew. Chem. 2004, 43, 520–523. [Google Scholar] [CrossRef] [PubMed]
  23. Castronovo, M.; Scaini, D. The atomic force microscopy as a lithographic tool: Nanografting of DNA nanostructures for biosensing applications. Methods Mol. Biol. 2011, 749, 209–221. [Google Scholar] [PubMed]
  24. Steel, A.B.; Herne, T.M.; Tarlov, M.J. Electrochemical quantitation of DNA immobilized on gold. Anal. Chem. 1998, 70, 4670–4677. [Google Scholar] [CrossRef] [PubMed]
  25. Levicky, R.; Herne, T.M.; Tarlov, M.J.; Satija, S.K. Using self-assembly to control the structure of DNA monolayers on gold: A neutron reflectivity study. J. Am. Chem. Soc. 1998, 120, 9787–9792. [Google Scholar] [CrossRef]
  26. Peterson, A.W.; Wolf, L.K.; Georgiadis, R.M. Hybridization of mismatched or partially matched DNA at surfaces. J. Am. Chem. Soc. 2002, 682, 14601–14607. [Google Scholar] [CrossRef]
  27. Peterson, A.W.; Heaton, R.J.; Georgiadis, R.M. The effect of surface probe density on DNA hybridization. Nucleic Acids Res. 2001, 29, 5163–5168. [Google Scholar] [CrossRef] [PubMed]
  28. Hulme, E.C.; Trevethick, A. Ligand binding assays at equilibrium: Validation and interpretation. Br. J. Pharmacol. 2010, 161, 1219–1237. [Google Scholar] [CrossRef] [PubMed]
  29. Basic Theory of Affinity. Available online: https://www.biacore.com/lifesciences/help/basic_theory_of_affinity/ (accessed on 1 July 2016).
  30. Bosco, A.; Bano, F.; Parisse, P.; Casalis, L.; DeSimone, A.; Micheletti, C. Hybridization in nanostructured DNA monolayers probed by AFM: Theory vs. experiment. Nanoscale 2012, 4, 1734–1741. [Google Scholar] [CrossRef] [PubMed]
Figure 1. Cartoon representing the DDI strategy to immobilize an aptamer on the micron-sized DNA-based biosensor.
Chemosensors 04 00018 g001
Figure 2. (a) Sample holder equipped with an electronic card to bring the signal to the HEKA-bipotentiostat; (b) microfabricated working and counter gold electrodes (black) on the patterned insulation layer (SPR 220 1.2) (pink); and (c) zoom-in of the central part of the electrodes. The diameter of the WE in contact with the solution is 100 μm. The patterned resist used to electrically insulate the electrodes is clearly recognizable as the darker-gray outer area of the image.
Chemosensors 04 00018 g002
Figure 3. SPR characterization: (a) sensograms of different THR concentrations (0.8–200 nM); and (b) binding affinity analysis; SPR responses at the end of the association phase are plotted against THR concentration and fitted (red line) to a single site interaction model ([RU] = RUmax − (1/(1 + KD/[A]))) the black vertical line indicates the value of KD found from the RU model; the light-blue area is the range of possible KD values (see text).
Chemosensors 04 00018 g003
Figure 4. Images of the nanopatches on the gold surface (left, bar 1 μm) and their topographic profiles (right). Black: F9-HEGL-aTHR aptamer immobilization; red: THR 12 nM incubation; and green: THR 1000 nM incubation.
Chemosensors 04 00018 g004
Figure 5. (a) Comparison of binding curves obtained from the height variation measured with the AFM on DNA nanopatches (left) and SPR data (right) vs. THR concentration; and (b) evaluation of the static compressibility on DNA nanopatches at low concentrations of THR.
Chemosensors 04 00018 g005
Figure 6. (a) Capacitance measured with the EIS setup at different steps of the immobilization; and (b) comparison of data obtained from the capacitance variation measured with the EIS setup (left) and SPR data (right) vs. THR concentration.
Chemosensors 04 00018 g006

