Simultaneous Analysis of Sensor Data for Breath Control in Respiratory Air


1
Karlsruhe Institute of Technology (KIT), Hermann-von-Helmholtz-Platz 1, D-76344 Eggenstein-Leopoldshafen, Germany
2
3S GmbH, Mainzer Str. 148, D-66121 Saarbrücken, Germany
*
Author to whom correspondence should be addressed.
Chemosensors 2018, 6(2), 15; https://doi.org/10.3390/chemosensors6020015
Submission received: 12 February 2018
/
Revised: 20 March 2018
/
Accepted: 29 March 2018
/
Published: 3 April 2018
(This article belongs to the Special Issue Selected Papers from Symposium "New Technologies, Intelligent Sensors/Analytics, Cross-linked Sensor Systems and New Application Fields")
Abstract
:There is a broad field of applications of breath monitoring in human health care, medical applications and alcohol control. In this report, an innovative mobile sensor system for breath control in respiratory air called AGaMon will be introduced. The sensor system is able to recognize a multitude of different gases like ethanol (which is the leading component of alcoholic drinks), H2S (which is the leading component for halitosis), H2 (which is the leading component for dyspepsia and food intolerance), NO (which is the leading component for asthma) or acetone (which is the leading component for diabetes), thus ,covering almost all significant aspects. An innovative calibration and evaluation procedure called SimPlus was developed which is able to evaluate the sensor data simultaneously. That means, SimPlus is able to identify the samples simultaneously; for example, whether the measured sample is ethanol or another substance under consideration. Furthermore, SimPlus is able to determine the concentration of the identified sample. This will be demonstrated in this report for the application of ethanol, H2, acetone and the binary mixture ethanol-H2. It has been shown that SimPlus could identify the investigated gases and volatile organic compounds (VOCs) very well and that the relative analysis errors were smaller than 10% in all considered applications.
1. Introduction
The chemical analysis of gases and volatile organic compounds (VOCs) like discriminated monitoring of toxic gas leakages, online monitoring of volatile components in chemical and biochemical processes, quality monitoring in food processing, etc. has gained great attention in recent years. Especially breath monitoring in the respiratory air has gained great attention, because this field of application covers a broad range like human health care, medical applications and alcohol control. In this context, an innovative mobile sensor system for breath control in the respiratory air called AGaMon will be introduced which is able to recognize a multitude of different gases and VOCs like ethanol (which is the leading component of alcoholic drinks), H2S (which is the leading component for halitosis), H2 (which is the leading component for dyspepsia and food intolerance), NO (which is the leading component for asthma) or acetone (which is the leading component for diabetes), thus covering almost all significant aspects..
In the context of analyzing VOCs, metal oxide gas sensors (MOGs) are well established as gas sensing devices. The main reasons are that they are very sensitive, have good long-term stability and are low in price. However, when these sensor devices are operated in an isothermal mode with a constant temperature at the sensor head, they do not have the capability to be selective. Therefore, they are not applicable for exacting analysis of gas mixtures. This is the reason that other means are necessary like gas sensor arrays of MOGs [1,2] or the operation of MOGs in a thermo-cyclic mode. The simultaneous sampling of the conductance values, gained from this operation mode, leads to so-called “conduction over time profiles” (CTPs) [3,4,5]. These profiles are something like a fingerprint of the gas mixture under consideration. Therefore, these CTPs can be used for gas mixture identification and concentration determination of the components as well.
There is a broad field of applications of breath monitoring in human health care, medical applications and alcohol control. In the field of alcohol control, a detailed investigation based on the AGaMon system and on an innovative calibration procedure ProSens 3.0 is described in [6]. In this investigation, ethanol is the leading component but also other interfering gases may influence the measurement results.
In the human breathing air, a multitude of different gases may occur, which can be used for human health care. This multitude of different gases has to be simultaneously identified and analyzed. Simultaneously means here that the measurements are performed with only one sensor system and the following analysis is performed with only one analysis procedure covering all the different gases or gas mixtures.
However, well-introduced evaluation procedures for data analysis like ProSens [7], ProSens 3.0, which is an extension of ProSens for the analysis of ternary gas mixtures, principal component analysis [8] or frequency-based signature gas identification [9] are only designed to analyze one mono-component gas or one gas mixture of well-defined components and not for varying target gases.
Therefore, a new mathematical calibration and evaluation procedure called SimSens was developed and in a first investigation applied to data in the field of cable fire detection [10]. In this paper, the procedure SimPlus, an enhanced version of the procedure SimSens, is introduced to meet the requirements in the field of human health care. Whereas SimSens was only applicable to mono gases, SimPlus is also able to analyze and identify gas mixtures. The numerical gas analyses based on sensor signals from the thermo-cyclically operated sensor system AGaMon in the context of breath control is reported.
In this report, exemplarily ethanol, H2, acetone and a binary ethanol/H2 mixture are investigated. A binary mixture was chosen, because in the human breath not only mono gases or VOCs may occur but also mixtures of them. The main object of this research is to prove that SimPlus is able to identify and distinguish the investigated substances and to determine the concentration of the samples.
2. Mobile Sensor System AGaMon
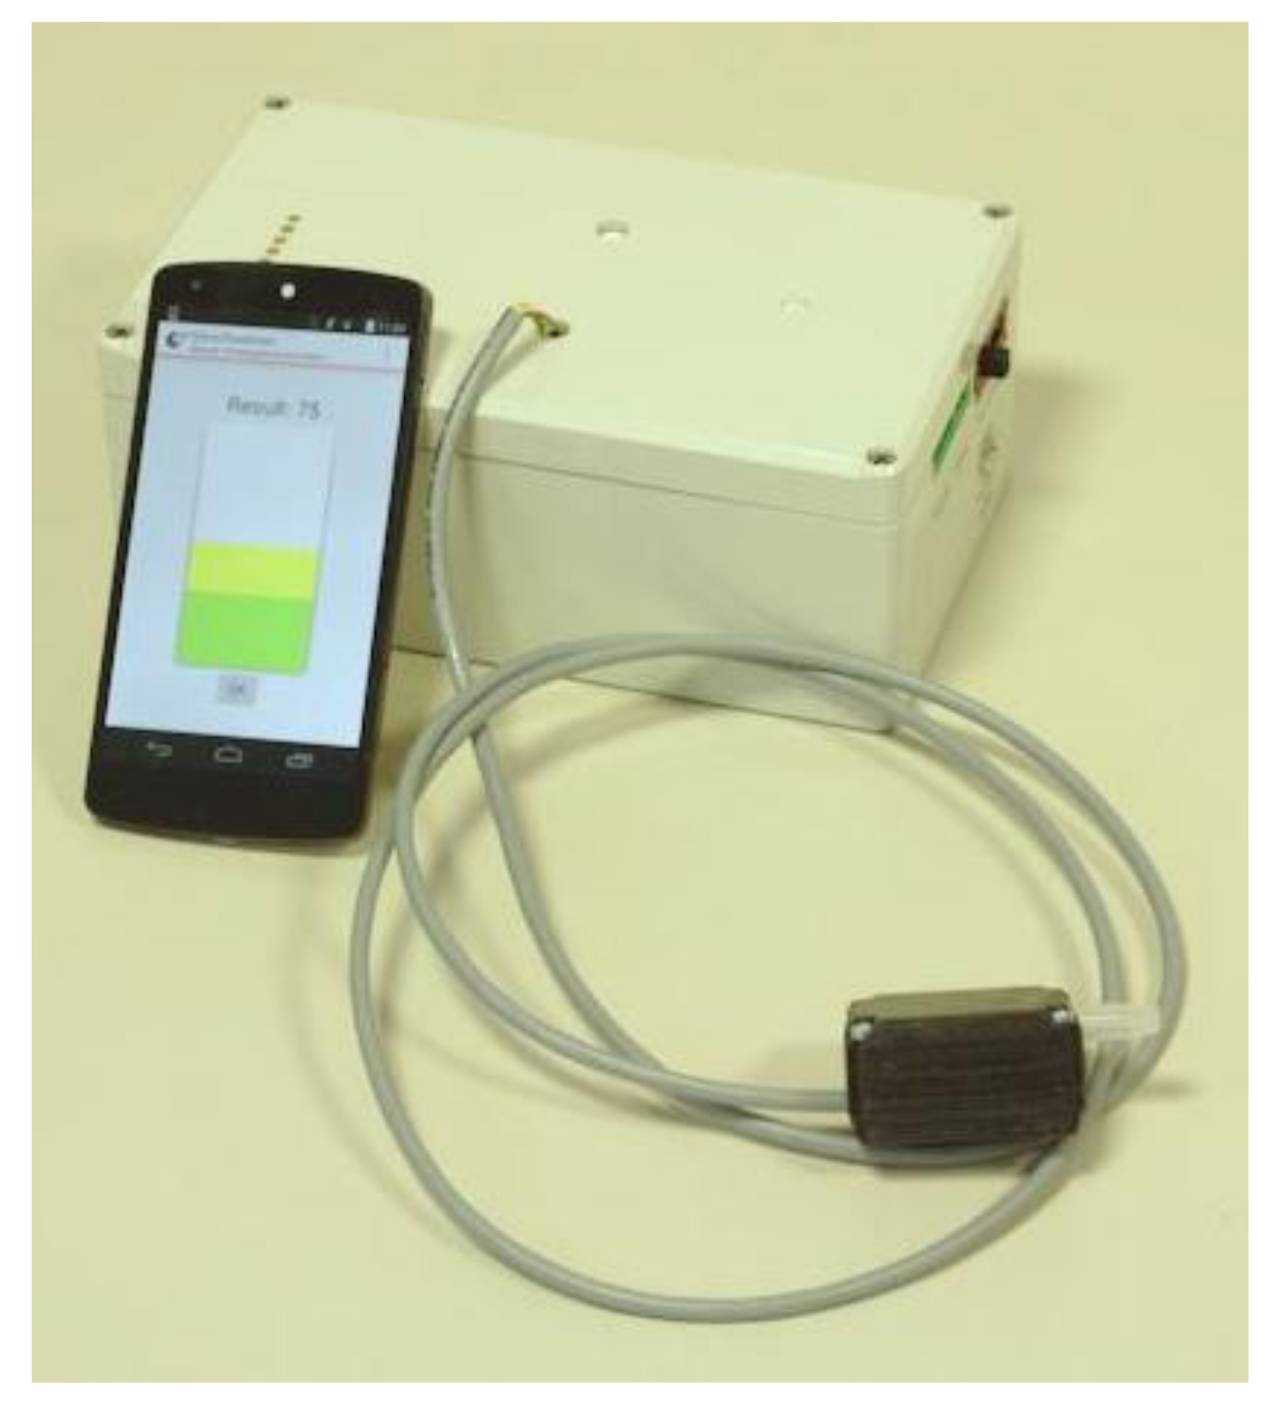
For breath control of respiratory air, an innovative sensor system platform was developed. Based on this platform, an adapter for smartphones was developed for mobile monitoring of the breathing air. Figure 1 shows the pre-release prototype version of the mobile sensor system [6].
The sensor system runs an embedded metal oxide gas sensor in a thermo-cyclic mode and supports a variety of commercially available metal oxide gas sensors. Via its graphical user interface different parametrizable temperature cycles can be configured. The platform is connected to a standard PC via USB, where the data live visualization and the storage is carried out. The platform can additionally be connected over Bluetooth to mobile applications running on smart phones. In this investigation, the sensor MLV from Applied Sensors [11] was used.
An important item is that the system allows the sensors to be exposed to several interfering gases and VOCs like H2S, H2, NO or acetone, which are leading components for human health care.
Gas mixtures were generated by dosing test gases in a carrier gas. Both test gases and the carrier gas were dosed using mass flow controllers.
The carrier gas was synthetic air (79% N2, 21% O2), enriched to 100% relative humidity to emulate human alveolar exhalation.
Ethanol gas was generated by bubbling synthetic air through a temperature controlled cascade of wash bottles with a mixture of water and ethanol according to the Dubowski equation. This has the added benefit that the ethanol test gas does not influence the principal properties of the carrier gas. Other test gases were dosed directly from test gas canisters in smaller quantities.
In order to simulate an exhalation, the gas mixture was only applied to the sensor during the 10 s observation period. The sensor was flushed with clean air between measurements.
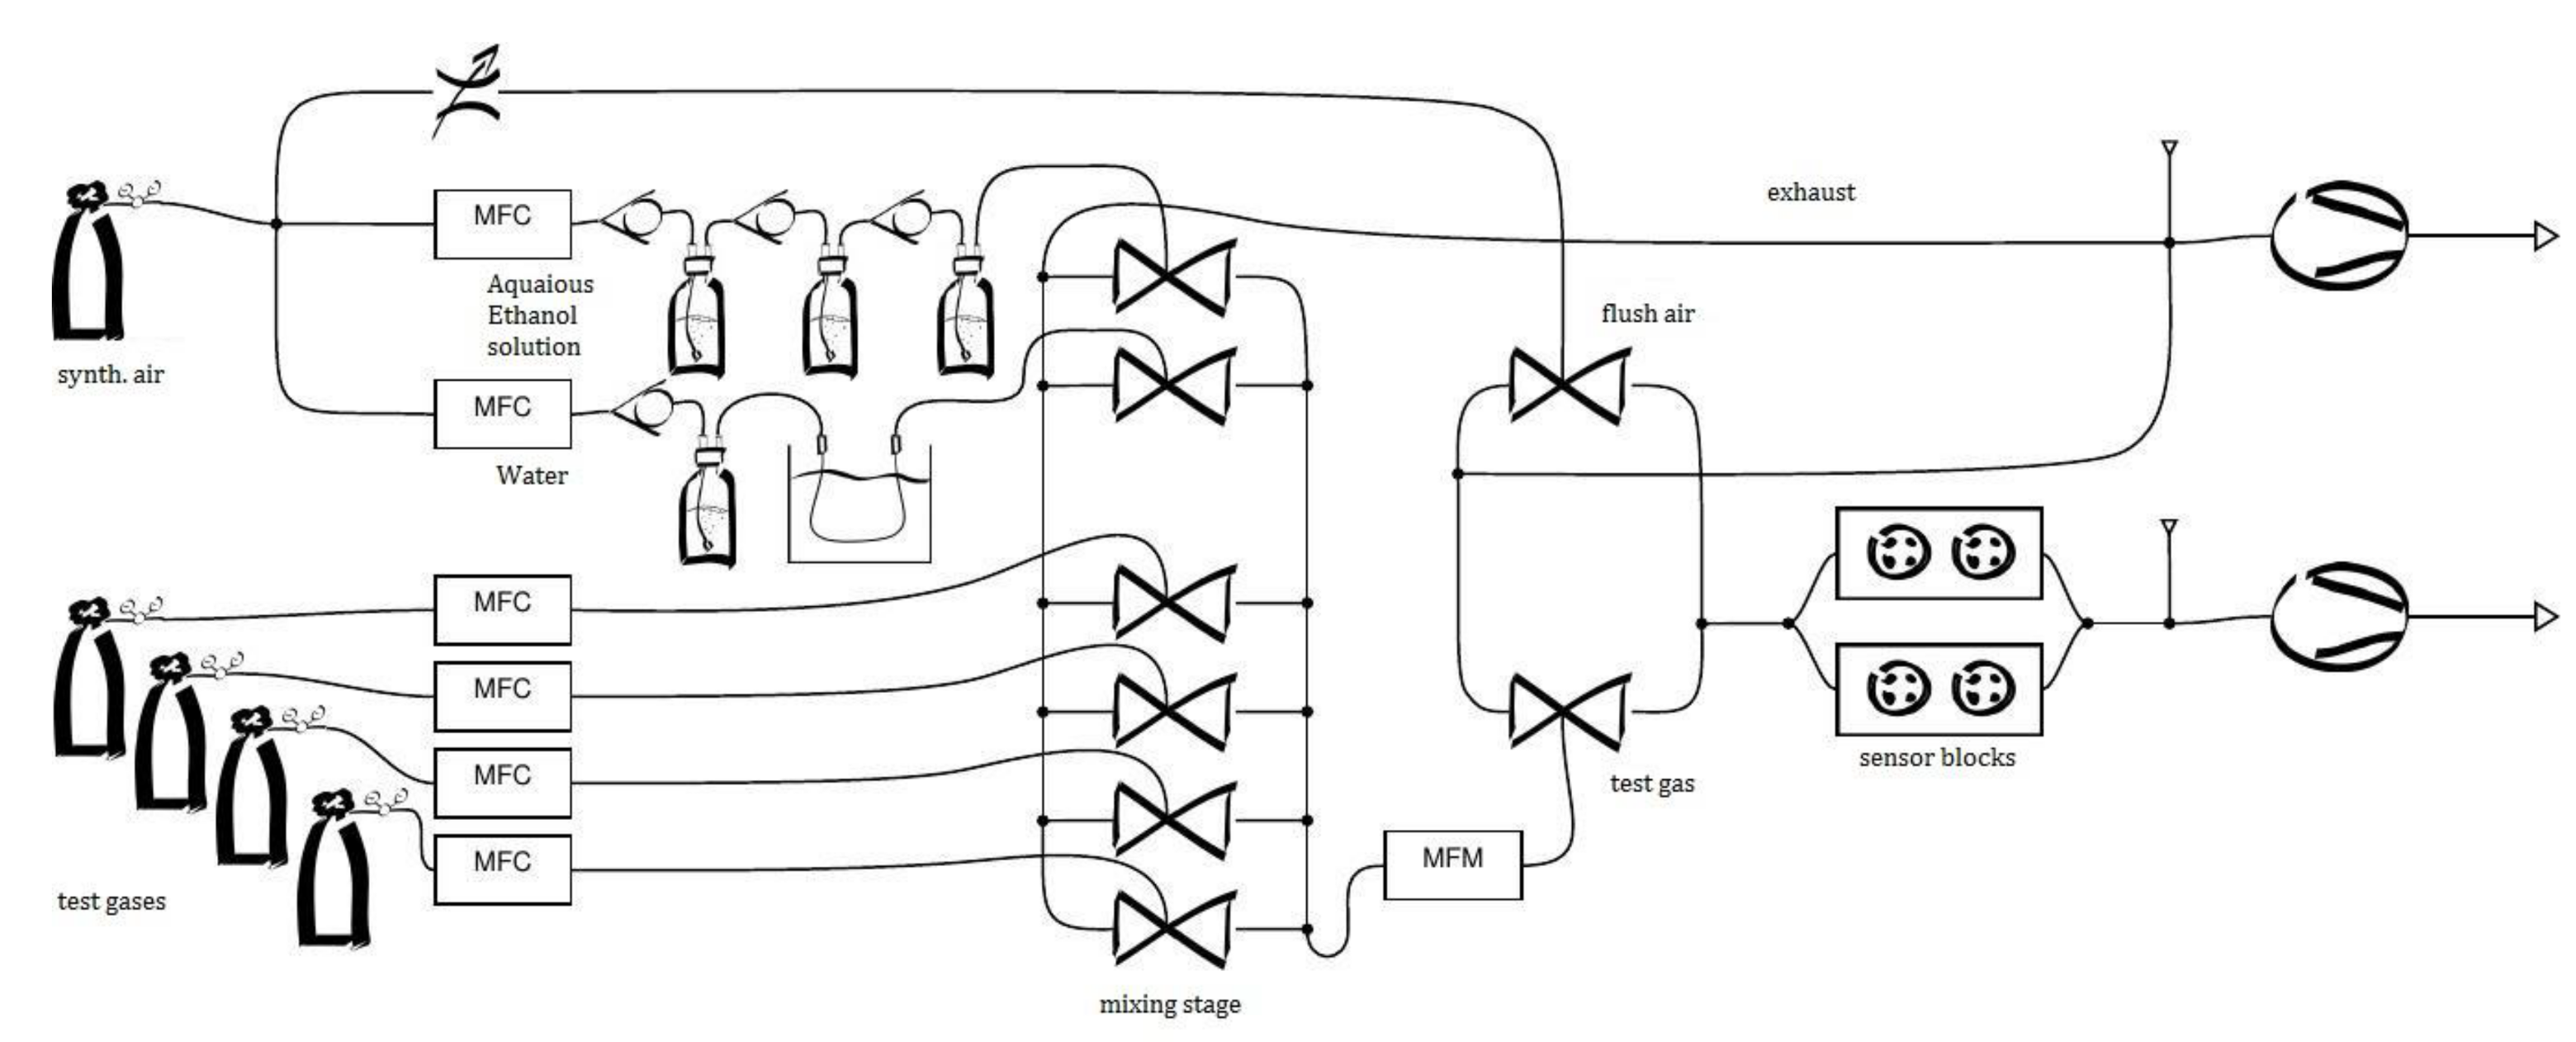
Figure 2 shows a schematic of the gas mixing system for parallel measurement of up to four sensors.
3. Concept of SimPlus
To meet the requirements of simultaneously analyzing more than one gas or gas mixture, the procedure SimPlus (Program for Simultaneous Analysis of Gases) was developed. SimPlus is an extension of ProSens, which was designed to analyze only one gas or one gas mixture, and an enhancement of SimSens, which was designed for evaluation of cable fire detection. SimPlus consists of two components, which are connected together. The first component is the calibration part. In the calibration part, SimPlus determines the mathematical calibration models for every gas under consideration. For each calibration model, functions for determination of the component concentrations and functions for calculating the corresponding so-called theoretical CTP for substance identification are determined. These functions are parametric functions and the parameters are calculated by multiple linear regressions of conduction values versus concentration values and CPT values, respectively. For details of determining the parameters see [6] where the calculation is described for one calibration model. Only these parameters are transferred to the second component of SimPlus, the evaluation part. The main advantage of this approach is that very time consuming calculations, which need a lot of storage, can be performed in a one-time job on a PC.
When an unknown gas sample is measured, the evaluation part of SimPlus calculates the theoretical CTPs for each calibrated gas based on the parameters determined in the related calibration models. If measured CTP and one of the theoretical CTPs are close together, i.e., a difference value calculated from the sum of quadratic differences of every sample point of the measured CTP and the theoretical CTP is smaller than a predetermined decision limit, SimPlus identifies the currently measured gas sample with the related calibrated gas. Otherwise, SimPlus recognizes that the gas sample is none of the calibrated gases. In case of identification, SimPlus calculates the concentration of the gas sample based on the identified calibration model. For details of determining, the theoretical CTPs see again [6] where the calculation is described for one theoretical CTP.
4. Data Analysis
As mentioned above, the sensor system AGaMon is designed to detect a magnitude of various gases and gas components in the respiratory air to cover a broad range of significant aspects. In this investigation, three mono gases respectively VOCs are exemplarily under consideration: ethanol, H2 and acetone. Furthermore, a binary gas mixture ethanol/H2 is investigated.
The calibration and evaluation procedure SimPlus should be able to classify gas samples in a correct manner and to calculate the concentrations of the samples.
In a first step, SimPlus calculates the parametrized calibration model of each gas and gas mixture under consideration based on calibration measurements and transfers the parameters to the evaluation part.
The samples in Table 1 are chosen for calibration with SimPlus.
The samples given in Table 2 are additionally chosen for evaluation with SimPlus.
After measuring the gas samples, the evaluation part of SimPlus calculates the “theoretical” CTPs of the samples on the basis of the calibration models of all calibrated gases and compares these theoretical CTPs with the really measured CTP.
The results for some samples are exemplarily visualized in the following figures.
When an unknown sample is measured, the evaluation part of SimPlus calculates the theoretical CTPs based on all calibration models and compares these CTPs with the measured CTP.
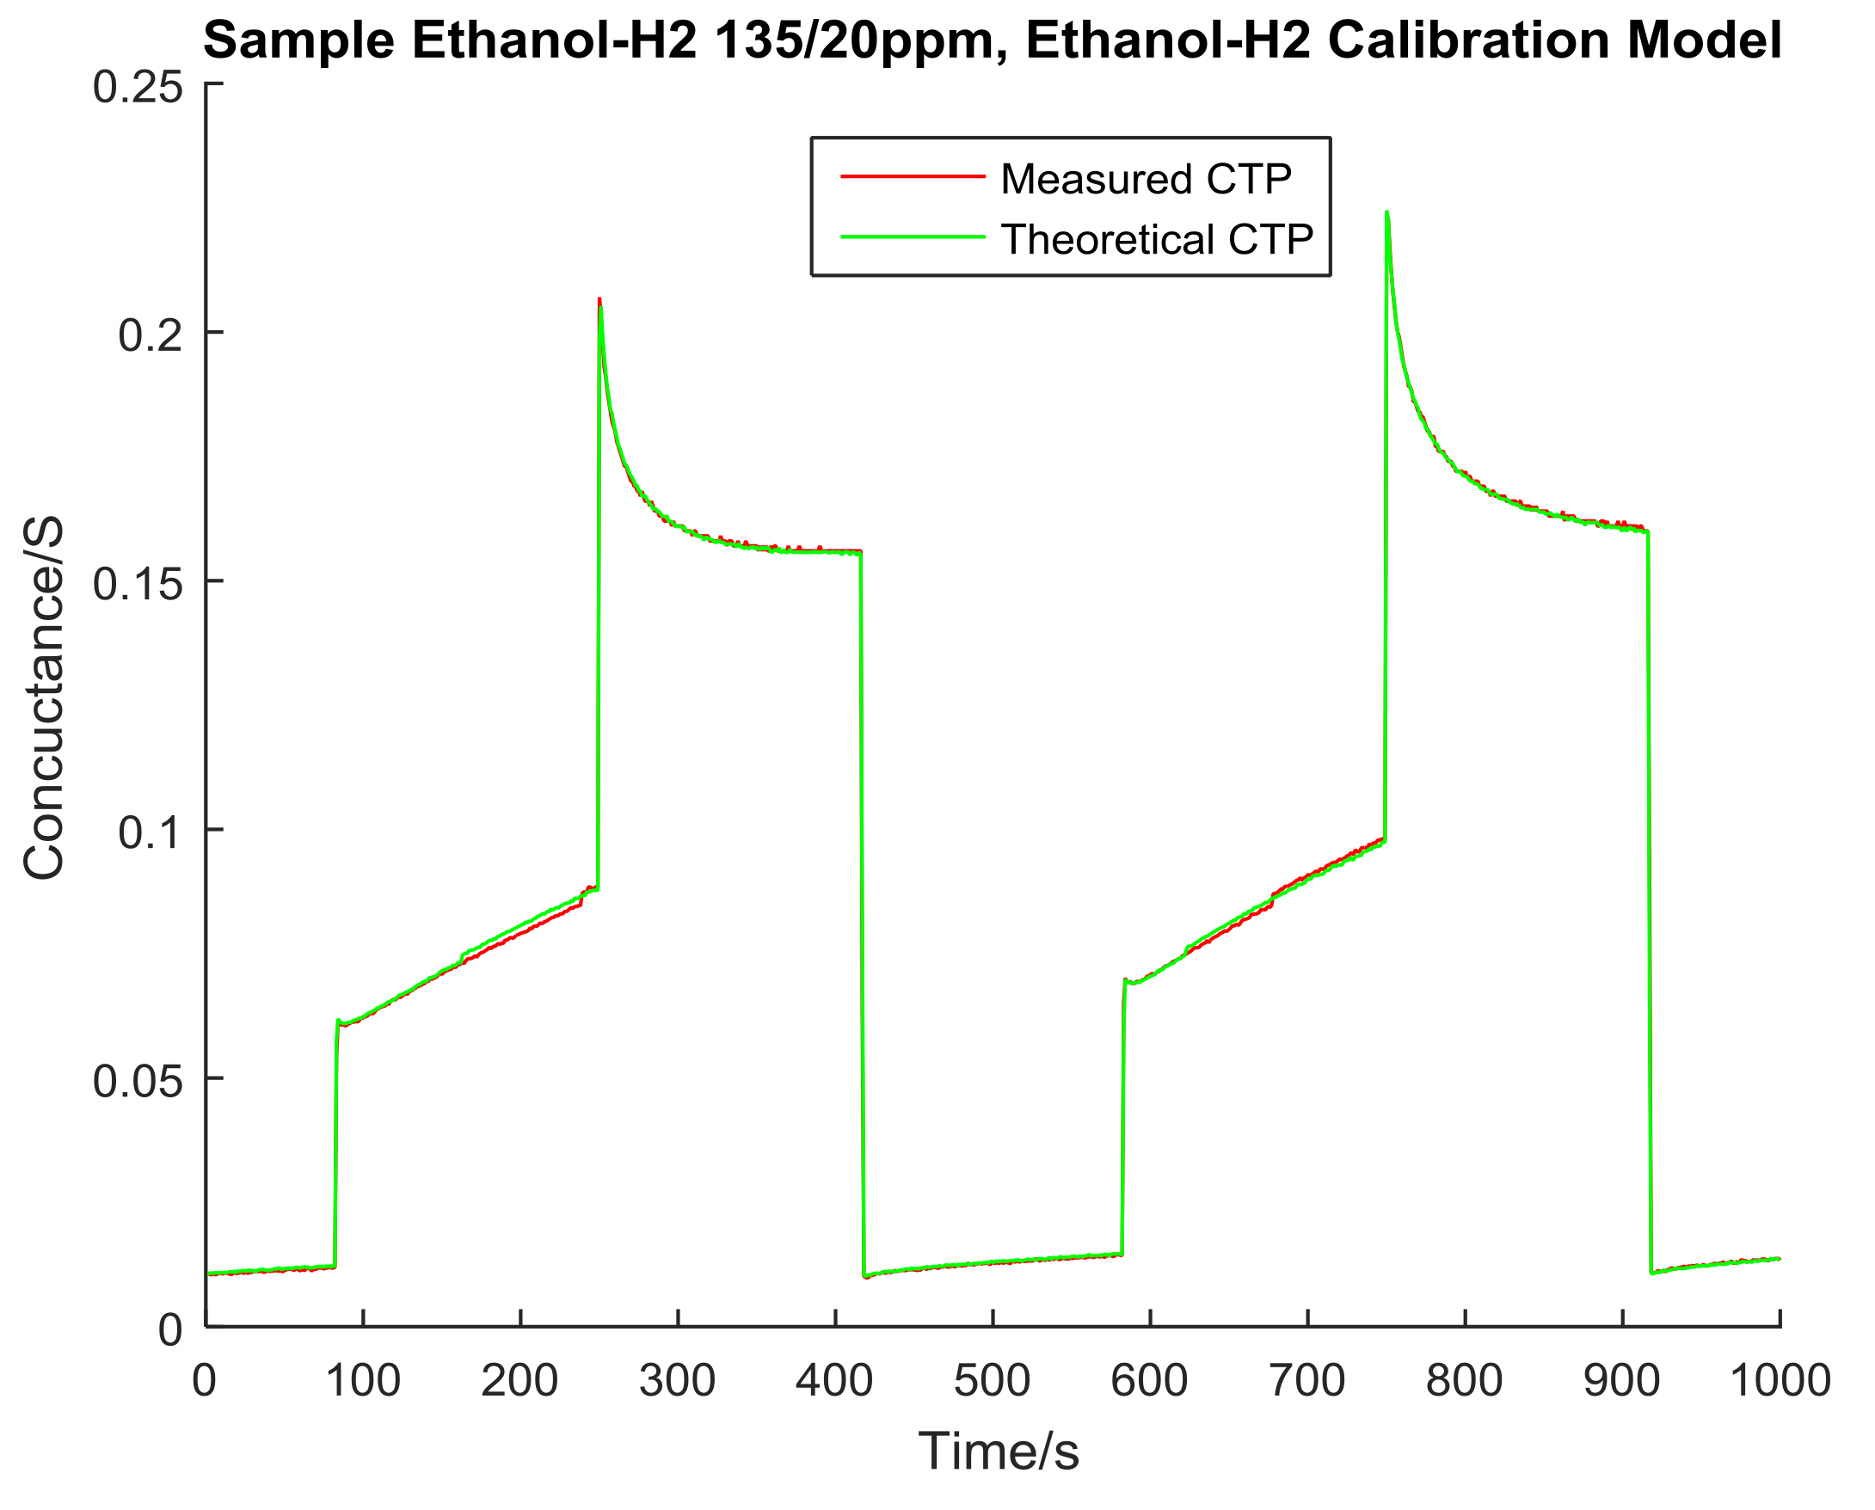
In Figure 3, the measured CTP of an unknown sample—here a binary ethanol/H2 mixture—and the theoretical CTP based on the ethanol/H2 calibration model are close together. So the measured sample can be identified as a binary ethanol/H2 mixture. On the other hand, measured CTP of this sample and theoretical CTP, now based on the H2 calibration model, differ very much, as can be seen in Figure 4. So it is clear, that the measured sample is not a H2 gas. Also, the measured CTP of this sample and theoretical CTPs based on the ethanol calibration model or acetone calibration model differ very much. That means that SimPlus recognizes the measured sample really as a binary ethanol/H2 mixture and recognizes that the measured sample is none of the other substances.
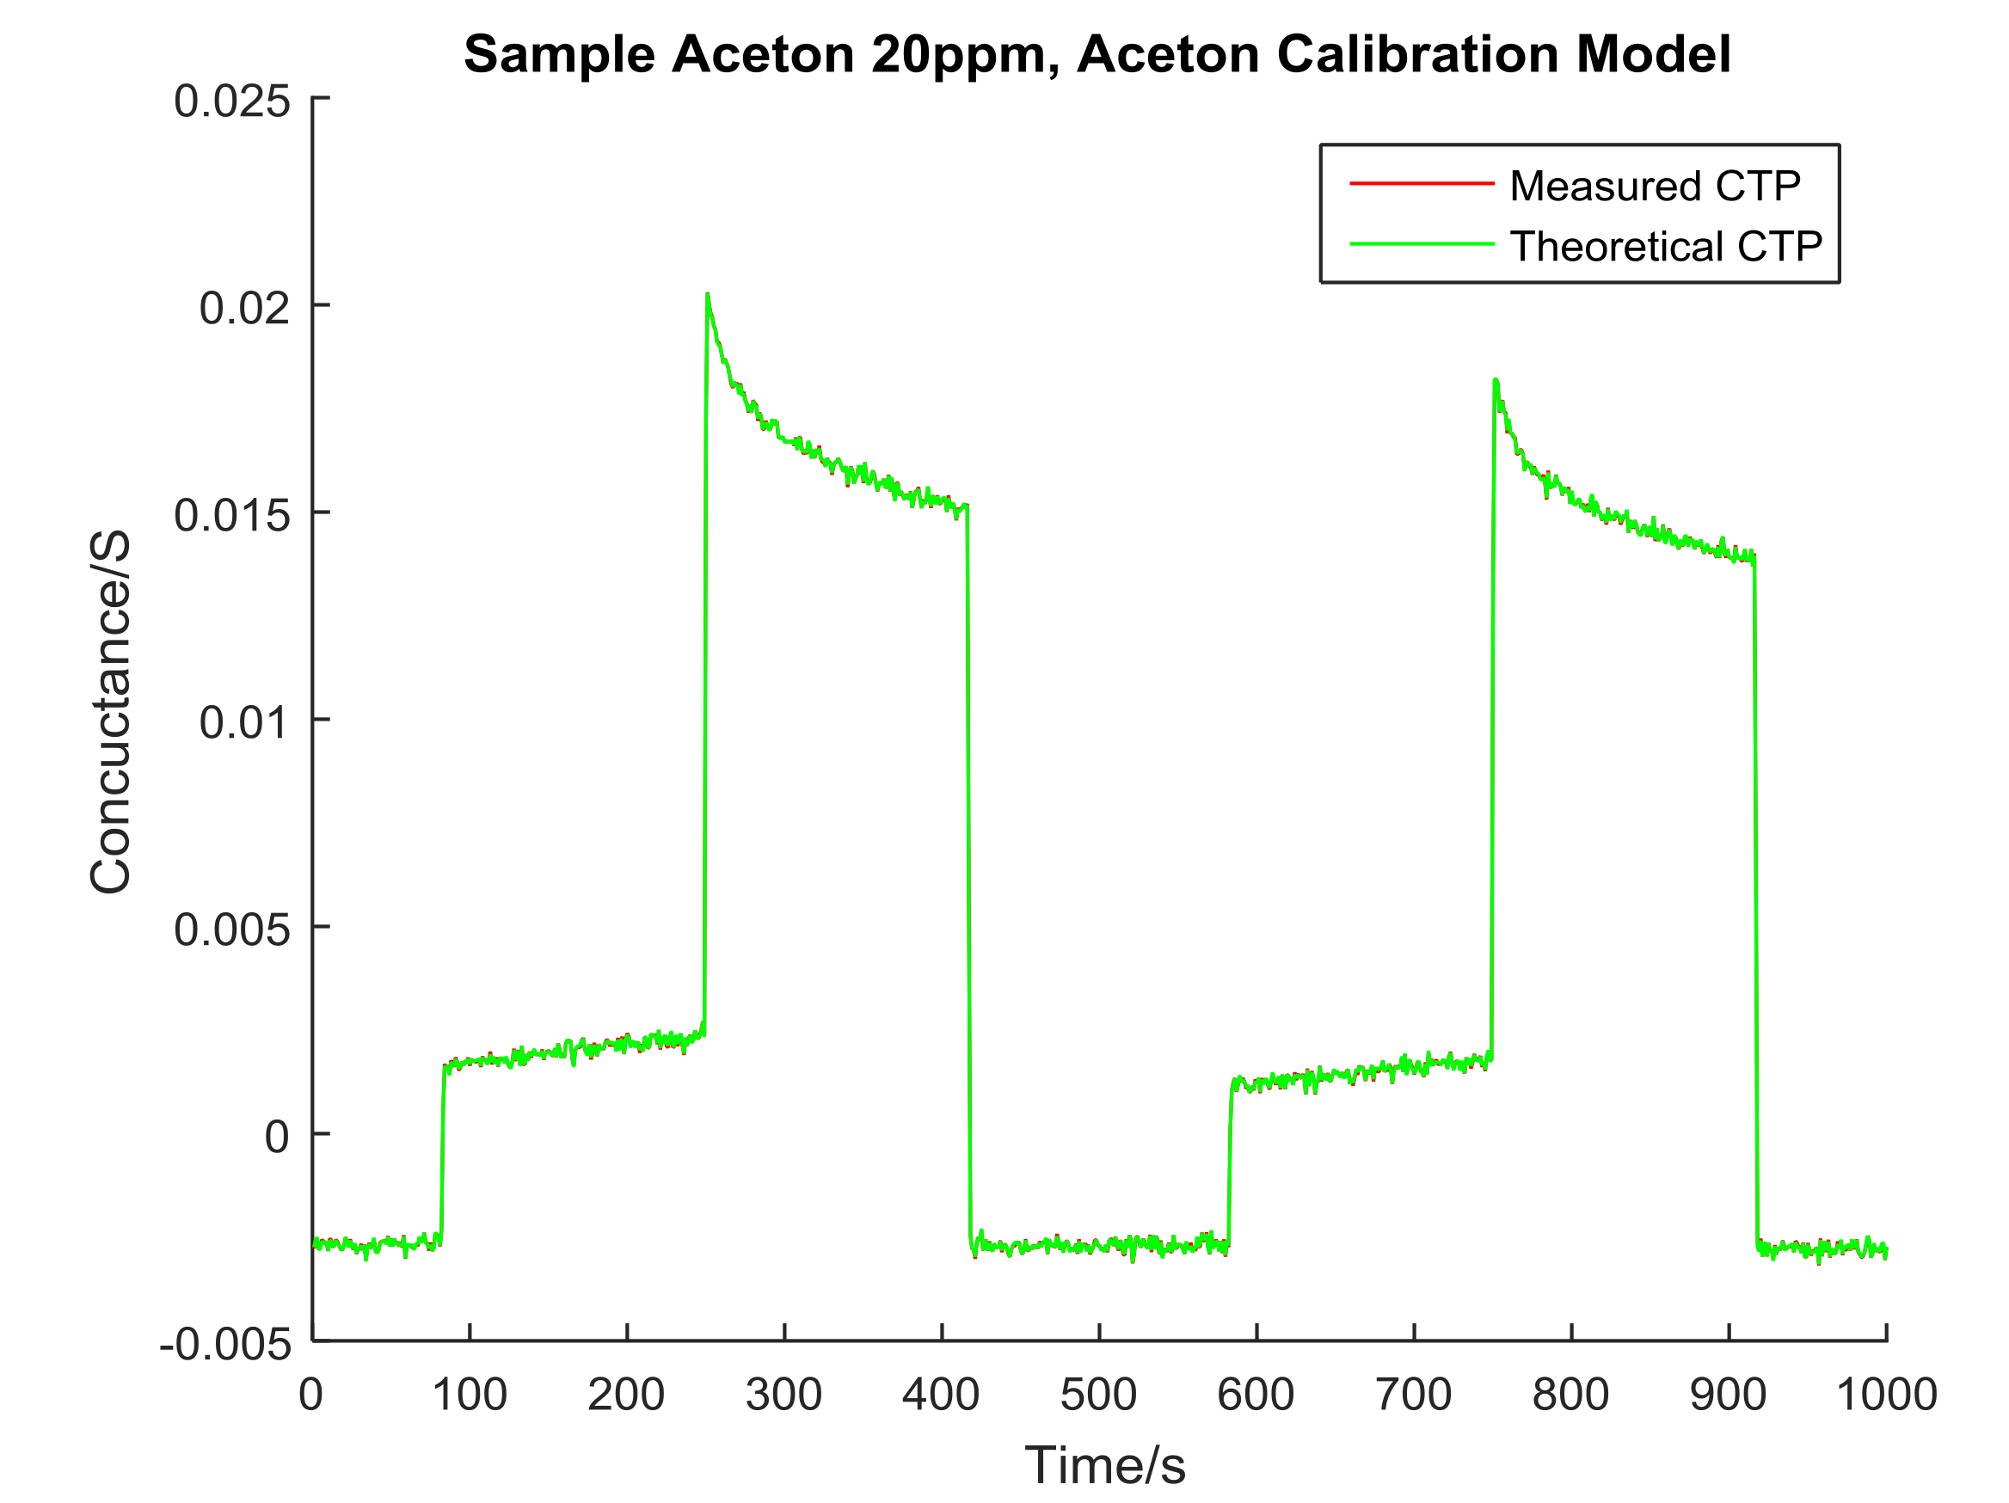
Measuring another sample—in this case an acetone sample—measured CTP and the theoretical CTP based on the acetone calibration model are close together as can be seen in Figure 5. So the sample can be identified as an acetone sample. In Figure 6, measured CTP of the sample and theoretical CTP, now based on the H2 calibration model, differ very much. Therefore, it is clear that the measured sample is not a H2 gas. Also, the measured CTP of this sample and theoretical CTPs based on the ethanol calibration model or ethanol/H2 calibration model differ very much. That means that SimPlus recognizes the measured sample really as an acetone sample and recognizes that the measured sample is none of the other substances.
Of course, the decision for substance identification is not based on a visual impression. Therefore, a “difference value” as described in chapter III is calculated. Only if this difference value is smaller than a predetermined decision value, SimPlus identifies the unknown gas sample with the related calibrated gas mixture. Table 3 shows the difference values for the gas samples.
In Table 3, the column indicates the measured samples and the row refers to the calibration model on which the theoretical CTPs are based.
It can be clearly seen that, in all cases, the difference values are very small, nearly zero (red marked numbers in the table), when the measured CTP is compared with the theoretical CTP based on the calibration model of its own sample. In all other cases, the difference values between measured CTP and theoretical CTP are significant higher.
The decision value is set to 0.0010 concerning the ethanol model. In all other cases, the decision values are set to 0.0001.
That means that SimPlus is able to identify the samples in a correct manner. This is very important to avoid false alarms and misleading analysis results.
After substance identification, SimPlus calculates the concentration of the samples.
In Table 4, the relative analysis errors between dosed concentrations and calculated concentrations are given.
It can be seen that in all considered cases, analyzing the VOCs ethanol and acetone, the mono gas H2 and the binary ethanol/H2 mixture as well, the relative analysis errors between dosed concentrations and determined concentrations of the samples and the sample components, respectively, are smaller than 10%.
This is really a very good analysis result.
5. Conclusions
The thermo-cyclic operated sensor system AGaMon is able to recognize, in the field of breath control in the respiratory air, a multitude of different gases and VOCs like ethanol (which is the main component in alcoholic drinks), H2 (which is the leading component for dyspepsia and food intolerance), or acetone (which is the leading component for diabetes), thus covering almost all significant aspects in this area. The calibration and evaluation procedure SimPlus is capable for simultaneous analysis of the sensor data. SimPlus identifies and classifies the measured samples in all considered cases very well. The relative analysis errors between dosed concentrations and calculated cases are, in all considered cases, smaller than 10%. These fine analysis results are all the more remarkable because only one sensor element is incorporated in the sensor system AGaMon.
Acknowledgments
The research and development project was supported by the Central Innovation Program for small and medium-sized enterprises (SME) of the German Bundesministerium für Wirtschaft und Technologie (BMWi).
Author Contributions
Thorsten Conrad and Jens Peter conceived, designed and performed the experiments; Rolf Seifert and Hubert Keller analyzed the data; Rolf Seifert wrote the paper.
Conflicts of Interest
The authors declare no conflicts of interest.
References
- Althainz, P.; Goschnick, J.; Ehrmann, S.; Ache, H.J. Multisensor Microsystem for Contaminants in Air. Sens. Actuators B Chem. 1996, 33, 72–76. [Google Scholar] [CrossRef]
- Sysoev, V.V.; Kiselev, I.; Frietsch, M.; Goschnick, J. Discrimination Power of a Metal-Oxide Thin-Film Sensor Microarray. Sensors 2004, 4, 37–46. [Google Scholar] [CrossRef]
- Frank, K.; Hetznecker, A.; Kohler, H.; Schindler, V.; Schönauer, U.; Arnanthigo, Y.; Falk, D.; Keller, H.B.; Seifert, R. Metal oxide gas sensors for field analysis: Novel SnO2/La2O3 sensor element for analysis of dissolved toluene/ethanol binary mixtures. Sensors 2005, 2, 207–209. [Google Scholar]
- Frank, K.; Magapu, V.; Schindler, V.; Arnanthigo, Y.; Kohler, H.; Keller, H.B.; Seifert, R. Improving the analysis capability of tin oxide gas sensors by dynamic operation, appropriate additives and an advanced evaluation procedure. Sensors 2007, 1, 139–144. [Google Scholar]
- Frank, K.; Magapu, V.; Schindler, V.; Kohler, H.; Keller, H.B.; Seifert, R. Chemical Analysis with Tin Oxide Gas Sensors: Choice of Additives, Method of Operation and Analysis of Numerical Signal. Sens. Lett. 2008, 6, 908–911. [Google Scholar] [CrossRef]
- Seifert, R.; Conrad, T.; Peter, J.; Keller, H.B. Mobile Sensor System AGaMon for Breath Control: Thermo-cyclic Operation and Numerical Signal Analysis of Ternary Gas Mixtures. In Proceedings of the 8th International Conference on Sensor Device Technologies and Applications, Rome, Italy, 10–14 September 2017; pp. 109–114. [Google Scholar]
- Seifert, R.; Keller, H.B.; Frank, K.; Kohler, H. ProSens—An efficient mathematical procedure for calibration and evaluation of tin oxide gas sensor data. Sens. Lett. 2011, 9, 7–10. [Google Scholar] [CrossRef]
- Gardner, J.W. Detection of vapours and odours from a multi sensor array using pat-tern recognition. Part I, Principal component and cluster analysis. Sens. Actuators B Chem. 1991, 4, 109–115. [Google Scholar] [CrossRef]
- Ng, K.T.; Boussaid, F.; Bermak, A. A frequency-based signature gas identification circuit for SnO2 gas sensors. In Proceedings of the 2010 IEEE International Symposium on Circuits and Systems, Paris, France, 30 May–2 June 2010; pp. 2275–2278. [Google Scholar]
- Keller, H.B.; Seifert, R.; Kohler, H. SimSens—A New Mathematical Procedure for Simultaneous Analysis of Gases with Resistive Gas Sensors. Sens. Actuators B. Chem. 2015, 203–207. [Google Scholar] [CrossRef]
- AS-MLV-P2MEMS. MOS Gas Sensor Component for VOC Detection. Available online: http://ams.com/eng/Products/Environmental-Sensors/Gas-Sensors/AS-MLV-P2 (accessed on 11 June 2016).
Figure 1.
Pre-release Version of the Mobile Sensor System.

Figure 2.
Gas mixing unit, specifically considering the ethanol provision at high relative humidities near 100%. MFC: Mass flow controller, MFM: Mass flow meter.
Figure 2.
Gas mixing unit, specifically considering the ethanol provision at high relative humidities near 100%. MFC: Mass flow controller, MFM: Mass flow meter.

Figure 3.
Comparison of measured CTP of a binary ethanol/H2 mixture and the related theoretical CTP based on the ethanol/H2 calibration.
Figure 3.
Comparison of measured CTP of a binary ethanol/H2 mixture and the related theoretical CTP based on the ethanol/H2 calibration.

Figure 4.
Comparison of measured CTP of a binary ethanol/H2 mixture and the related theoretical CTP based on the H2 calibration model.
Figure 4.
Comparison of measured CTP of a binary ethanol/H2 mixture and the related theoretical CTP based on the H2 calibration model.

Figure 5.
Comparison of measured CTP of an acetone sample and the related theoretical CTP based on the acetone calibration model.
Figure 5.
Comparison of measured CTP of an acetone sample and the related theoretical CTP based on the acetone calibration model.

Figure 6.
Comparison of measured CTP of an acetone sample and the related theoretical CTP based on the acetone calibration model.
Figure 6.
Comparison of measured CTP of an acetone sample and the related theoretical CTP based on the acetone calibration model.


Table 1.
Gas samples for calibration.
| Ethanol | H2 | Acetone | Ethanol/H2 | Ethanol/H2 |
|---|---|---|---|---|
| 50 ppm | 10 ppm | 0.5 ppm | 50 ppm/10 ppm | 100 ppm/30 ppm |
| 100 ppm | 20 ppm | 1 ppm | 50 ppm/20 ppm | 175 ppm/10 ppm |
| 175 ppm | 30 ppm | 2 ppm | 50 ppm/30 ppm | 175 ppm/20 ppm |
| - | - | 100 ppm/10 ppm | 175 ppm/30 ppm |
Table 2.
Further gas samples for evaluation.
| Ethanol | Ethanol/H2 | Ethanol/H2 | Ethanol/H2 |
|---|---|---|---|
| 135 ppm | 135 ppm/10 ppm | 135 ppm/20 ppm | 1135 ppm/30 ppm |
Table 3.
Difference values between measured CTPs and theoretical CTPs.The decision value is set to 0.0001.
Table 3.
Difference values between measured CTPs and theoretical CTPs.The decision value is set to 0.0001.
| Sample/Model | Ethanol | H2 | Acetone | Ethanol/H2 |
|---|---|---|---|---|
| Ethanol 50 ppm | 0.0000 | 0.0092 | 0.1982 | 0.0003 |
| Ethanol 100 ppm | 0.0000 | 0.0353 | 1.1977 | 0.0003 |
| Ethanol 135 ppm | 0.0009 | 0.0511 | 2.1785 | 0.0004 |
| Ethanol 175 ppm | 0.0000 | 0.0807 | 3.3276 | 0.0002 |
| H2 10 ppm | 0.0098 | 0.0000 | 0.2327 | 0.0109 |
| H2 20 ppm | 0.0311 | 0.0000 | 1.0826 | 0.0175 |
| H2 30 ppm | 0.0572 | 0.0000 | 2.4299 | 0.0181 |
| Acetone 0.5 ppm | 0.0043 | 0.0027 | 0.000 | 0.0089 |
| Acetone 1 ppm | 0.0040 | 0.0023 | 0.000 | 0.0088 |
| Acetone 2 ppm | 0.0038 | 0.0024 | 0.000 | 0.0086 |
| Ethanol/H2 50 ppm/10 ppm | 0.0056 | 0.0236 | 1.6922 | 0.0000 |
| Ethanol/H2 50 ppm/20 ppm | 0.0228 | 0.0335 | 3.8462 | 0.0000 |
| Ethanol/H2 50 ppm/30 ppm | 0.0708 | 0.0803 | 7.1130 | 0.0000 |
| Ethanol/H2 100 ppm/10 ppm | 0.0111 | 0.0665 | 4.5184 | 0.0000 |
| Ethanol/H2 100 ppm/20 ppm | 0.0709 | 0.1689 | 8.6767 | 0.0000 |
| Ethanol/H2 100 ppm/30 ppm | 0.3115 | 0.3884 | 14.3375 | 0.0000 |
| Ethanol/H2 135 ppm/10 ppm | 0.0274 | 0.1268 | 6.4551 | 0.0001 |
| Ethanol/H2 135 ppm/20 ppm | 0.1603 | 0.3103 | 11.6890 | 0.0000 |
| Ethanol/H2 135 ppm/30 ppm | 0.5304 | 0.7165 | 18.0694 | 0.0000 |
| Ethanol/H2 175 ppm/10 ppm | 0.0577 | 0.2252 | 8.7091 | 0.0000 |
| Ethanol/H2 175 ppm/20 ppm | 0.3307 | 0.5422 | 15.3622 | 0.0000 |
| Ethanol/H2 175 ppm/30 ppm | 0.8789 | 1.1849 | 22.0615 | 0.0000 |
Table 4.
Relative Analysis Errors between dosed concentrations and determined concentrations of the samples and the sample components, respectively, in %.
Table 4.
Relative Analysis Errors between dosed concentrations and determined concentrations of the samples and the sample components, respectively, in %.
| Sample | Ethanol | H2 | Acetone |
|---|---|---|---|
| Ethanol 50 ppm | 6.6% | ||
| Ethanol 100 ppm | 6.2% | ||
| Ethanol 135 ppm | 4.6% | ||
| Ethanol 175 ppm | 1.7% | ||
| H2 10 ppm | 1.0% | ||
| H2 20 ppm | 1.5% | ||
| H2 30 ppm | 0.1% | ||
| Acetone 0.5 ppm | 8.0% | ||
| Acetone 1 ppm | 5.0% | ||
| Acetone 2 ppm | 1.0% | ||
| Ethanol/H2 50 ppm/10 ppm | 4.2% | 6.0% | |
| Ethanol/H2 50 ppm/20 ppm | 6.0% | 2.5% | |
| Ethanol/H2 50 ppm/30 ppm | 2.0% | 6.3% | |
| Ethanol/H2 100 ppm/10 ppm | 4.4% | 6.0% | |
| Ethanol/H2 100 ppm/20 ppm | 8.6% | 3.5% | |
| Ethanol/H2 100 ppm/30 ppm | 2.6% | 9.0% | |
| Ethanol/H2 135 ppm/10 ppm | 5.2% | 9.0% | |
| Ethanol/H2 135 ppm/20 ppm | 0.1% | 5.0% | |
| Ethanol/H2 135 ppm/30 ppm | 1.2% | 3.7% | |
| Ethanol/H2 175 ppm/10 ppm | 0.0% | 2.0% | |
| Ethanol/H2 175 ppm/20 ppm | 2.3% | 2.5% | |
| Ethanol/H2 175 ppm/30 ppm | 1.0% | 4.3% |
© 2018 by the authors. Licensee MDPI, Basel, Switzerland. This article is an open access article distributed under the terms and conditions of the Creative Commons Attribution (CC BY) license (http://creativecommons.org/licenses/by/4.0/).
Share and Cite
MDPI and ACS Style
Seifert, R.; Conrad, T.; Peter, J.; Keller, H. Simultaneous Analysis of Sensor Data for Breath Control in Respiratory Air. Chemosensors 2018, 6, 15. https://doi.org/10.3390/chemosensors6020015
AMA Style
Seifert R, Conrad T, Peter J, Keller H. Simultaneous Analysis of Sensor Data for Breath Control in Respiratory Air. Chemosensors. 2018; 6(2):15. https://doi.org/10.3390/chemosensors6020015
Chicago/Turabian StyleSeifert, Rolf, Thorsten Conrad, Jens Peter, and Hubert Keller. 2018. "Simultaneous Analysis of Sensor Data for Breath Control in Respiratory Air" Chemosensors 6, no. 2: 15. https://doi.org/10.3390/chemosensors6020015
Note that from the first issue of 2016, this journal uses article numbers instead of page numbers. See further details here.