Article

Resistive Low-Temperature Sensor Based on the SiO2ZrO2 Film for Detection of High Concentrations of NO2 Gas

by
Tatiana N. Myasoedova
1,*,
Tatiana S. Mikhailova
1,
Galina E. Yalovega
2 and
Nina K. Plugotarenko
1
1
Institute of Nanotechnologies, Electronics and Equipment Engineering, Southern Federal University, Chekhov str. 2, 347928 Taganrog, Russia
2
Faculty of Physics, Southern Federal University, Zorge str. 5, 344090 Rostov-on-Don, Russia
*
Author to whom correspondence should be addressed.
Chemosensors 2018, 6(4), 67; https://doi.org/10.3390/chemosensors6040067
Submission received: 14 November 2018 / Revised: 7 December 2018 / Accepted: 14 December 2018 / Published: 19 December 2018
(This article belongs to the Special Issue Thin Film Based Sensors)

Abstract

:
The SiO2ZrO2 composite films were prepared by means of sol-gel technology and characterized by scanning electron microscopy, energy dispersive X-ray (EDX) analysis, and X-ray diffraction. The presence of the stable monoclinic ZrO2 with an impurity of tetragonal phases is shown. The film surface is characterized by the presence of ZrOCl2·6H2O or ZrCl(OH)/ZrCl(OH)2 grains. The crystallite size negligibly depends on the annealing temperature of the film and amount to 10–12 nm and 9–12 nm for the films thermally treated at 200 °C and 500 °C, respectively. The film’s resistance is rather sensitive to the presence of NO2 impurities in the air at a low operating temperature (25 °C). Accelerated stability tests of the initial resistance showed high stability and reproducibility of the sensor based on the SiO2ZrO2 film thermally treated at 500 °C.

1. Introduction

As a low-cost selective oxidizer for the industry, nitrogen dioxide (or nitrogen tetroxide) is currently gaining recognition with a resultant increase of production in tank car quantities. The toxic level presence of this gas in any working area is an industrial hygiene problem, and its unwanted presence in any area may present an air-pollution problem. In the workplace, exposures to NO2 have been reported in such occupations as electroplating, acetylene welding, agriculture, space exploration, the detonation of explosives, certain military activities, and burning of nitrogen-containing propellants [1]. In such situations, exposure concentrations can be very high. For example, in armored vehicles during live-fire tests, peak concentrations of NO2 have been measured at over 2000 ppm. That decreases to about 500 ppm after one minute and decreases to about 20 ppm within five minutes [2]. So, the reliable sensors are in demand. At present, the well-known and popular sensors are the semiconducting sensors. Such advantages as high sensitivity, low cost, and simplicity of fabrication allow for the use of semiconducting oxides for gas sensor production. The significant disadvantages of semiconducting oxides are low selectivity and stability, mainly caused by the recrystallization processes and surface degradation during the exploitation. The way to improve the sensor’s characteristics is the synthesis of mixed oxide systems by doping the high dispersed matrix with different catalysts. Once formed, the mixed oxides display acidic sites due to the excess negative or positive charge or due to defects in the lattice that positively affect the catalytic properties.
Therefore, research activities have turned towards the development of mixed oxide gas sensitive materials that can be stable in harsh environments and can be used for a long time. In this context, silica-supported zirconia oxide can be used because of its thermal and chemical stability and its higher resistance to degradation compared to the isolated oxides [3,4].
Silica is the basic material of microelectronics—it finds an application as a matrix for the future production of nanosized gas sensitive materials or for improving gas sensitivity and stability of sensors [5,6]. Also, silica application in mixed oxide systems minimizes the buildup of thermal stresses during sensor fabrication and, therefore, improves adhesion.
Zirconia (ZrO2) is a material of great technological interest, having high thermal and chemical stability, low thermal conductivity, excellent corrosion resisting properties, as well as chemical and microbial resistance [7,8]. Also, ZrO2 is a wide band gap p-type semiconductor that exhibits abundant oxygen vacancies on its surface. So, zirconia-based electrochemical and semiconducting sensors are attracting much attention [9,10,11].
Zirconia-based sensors are mainly used as O2 and O3 sensors as they can rapidly respond to changes in the exhaust gas composition. A few works have been devoted to the elaboration of NOx zirconia-based sensors [12,13,14,15]. Micro-sensors of this type has been tested to monitor ozone (O3) in ambient air at low concentrations (10 ppb) since the end of the 1980s [12,13,14]. However, due to reliability problems, there is a hesitancy to apply these sensors for air pollution monitoring, especially in harsh environments in the industry. Almost all the zirconia-based sensors work at high operating temperatures (over 300 °C) [16]. A line of research, which has attracted attention in the past few years, is the low-temperature sensitivity of metal–oxide gas sensors. Some researchers have shown that metal–oxides can also work at room temperature and slightly above [17,18,19,20,21].
Our previous studies showed the sensitivity of SiO2ZrO2 composite films, fabricated using a Zr(ONO3)2 precursor, to small concentrations of NO2 and O3 gases (1 ppm and 0.02 ppm, respectively) under low working temperatures, and showed the high stability of the initial resistance [22].
In this work, the studies on SiO2ZrO2 thin films, fabricated using a ZrOCl2·8H2O precursor, for low-temperature NO2 sensor applications are presented.

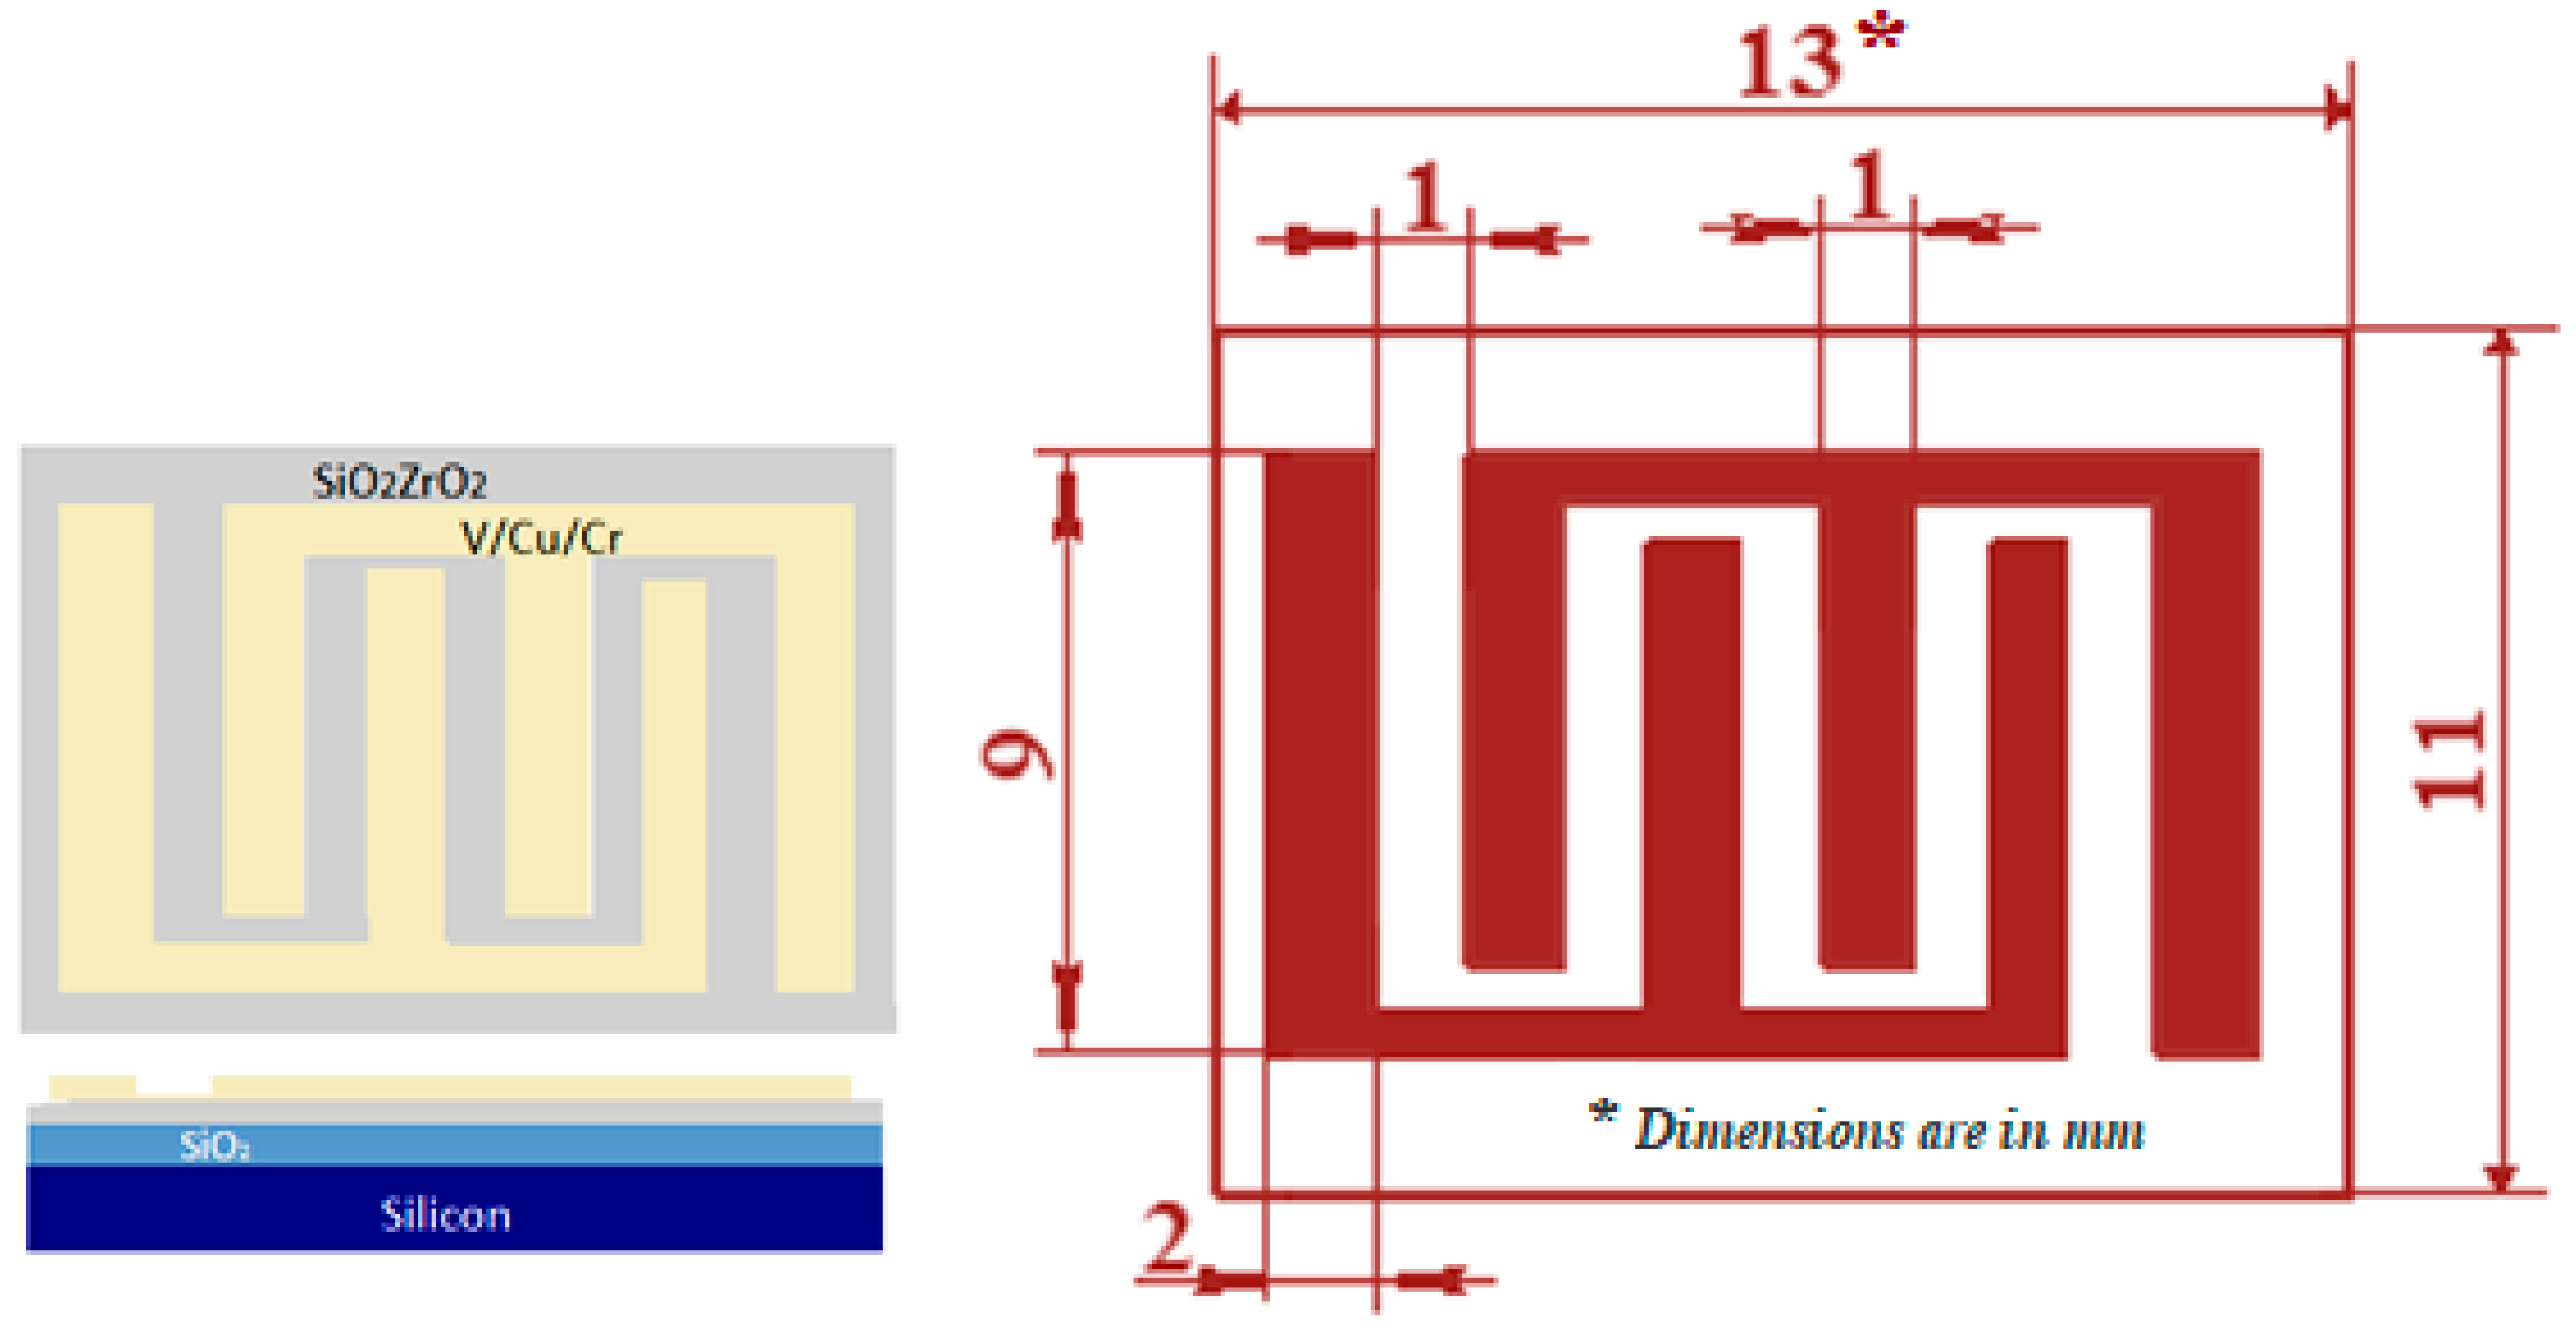
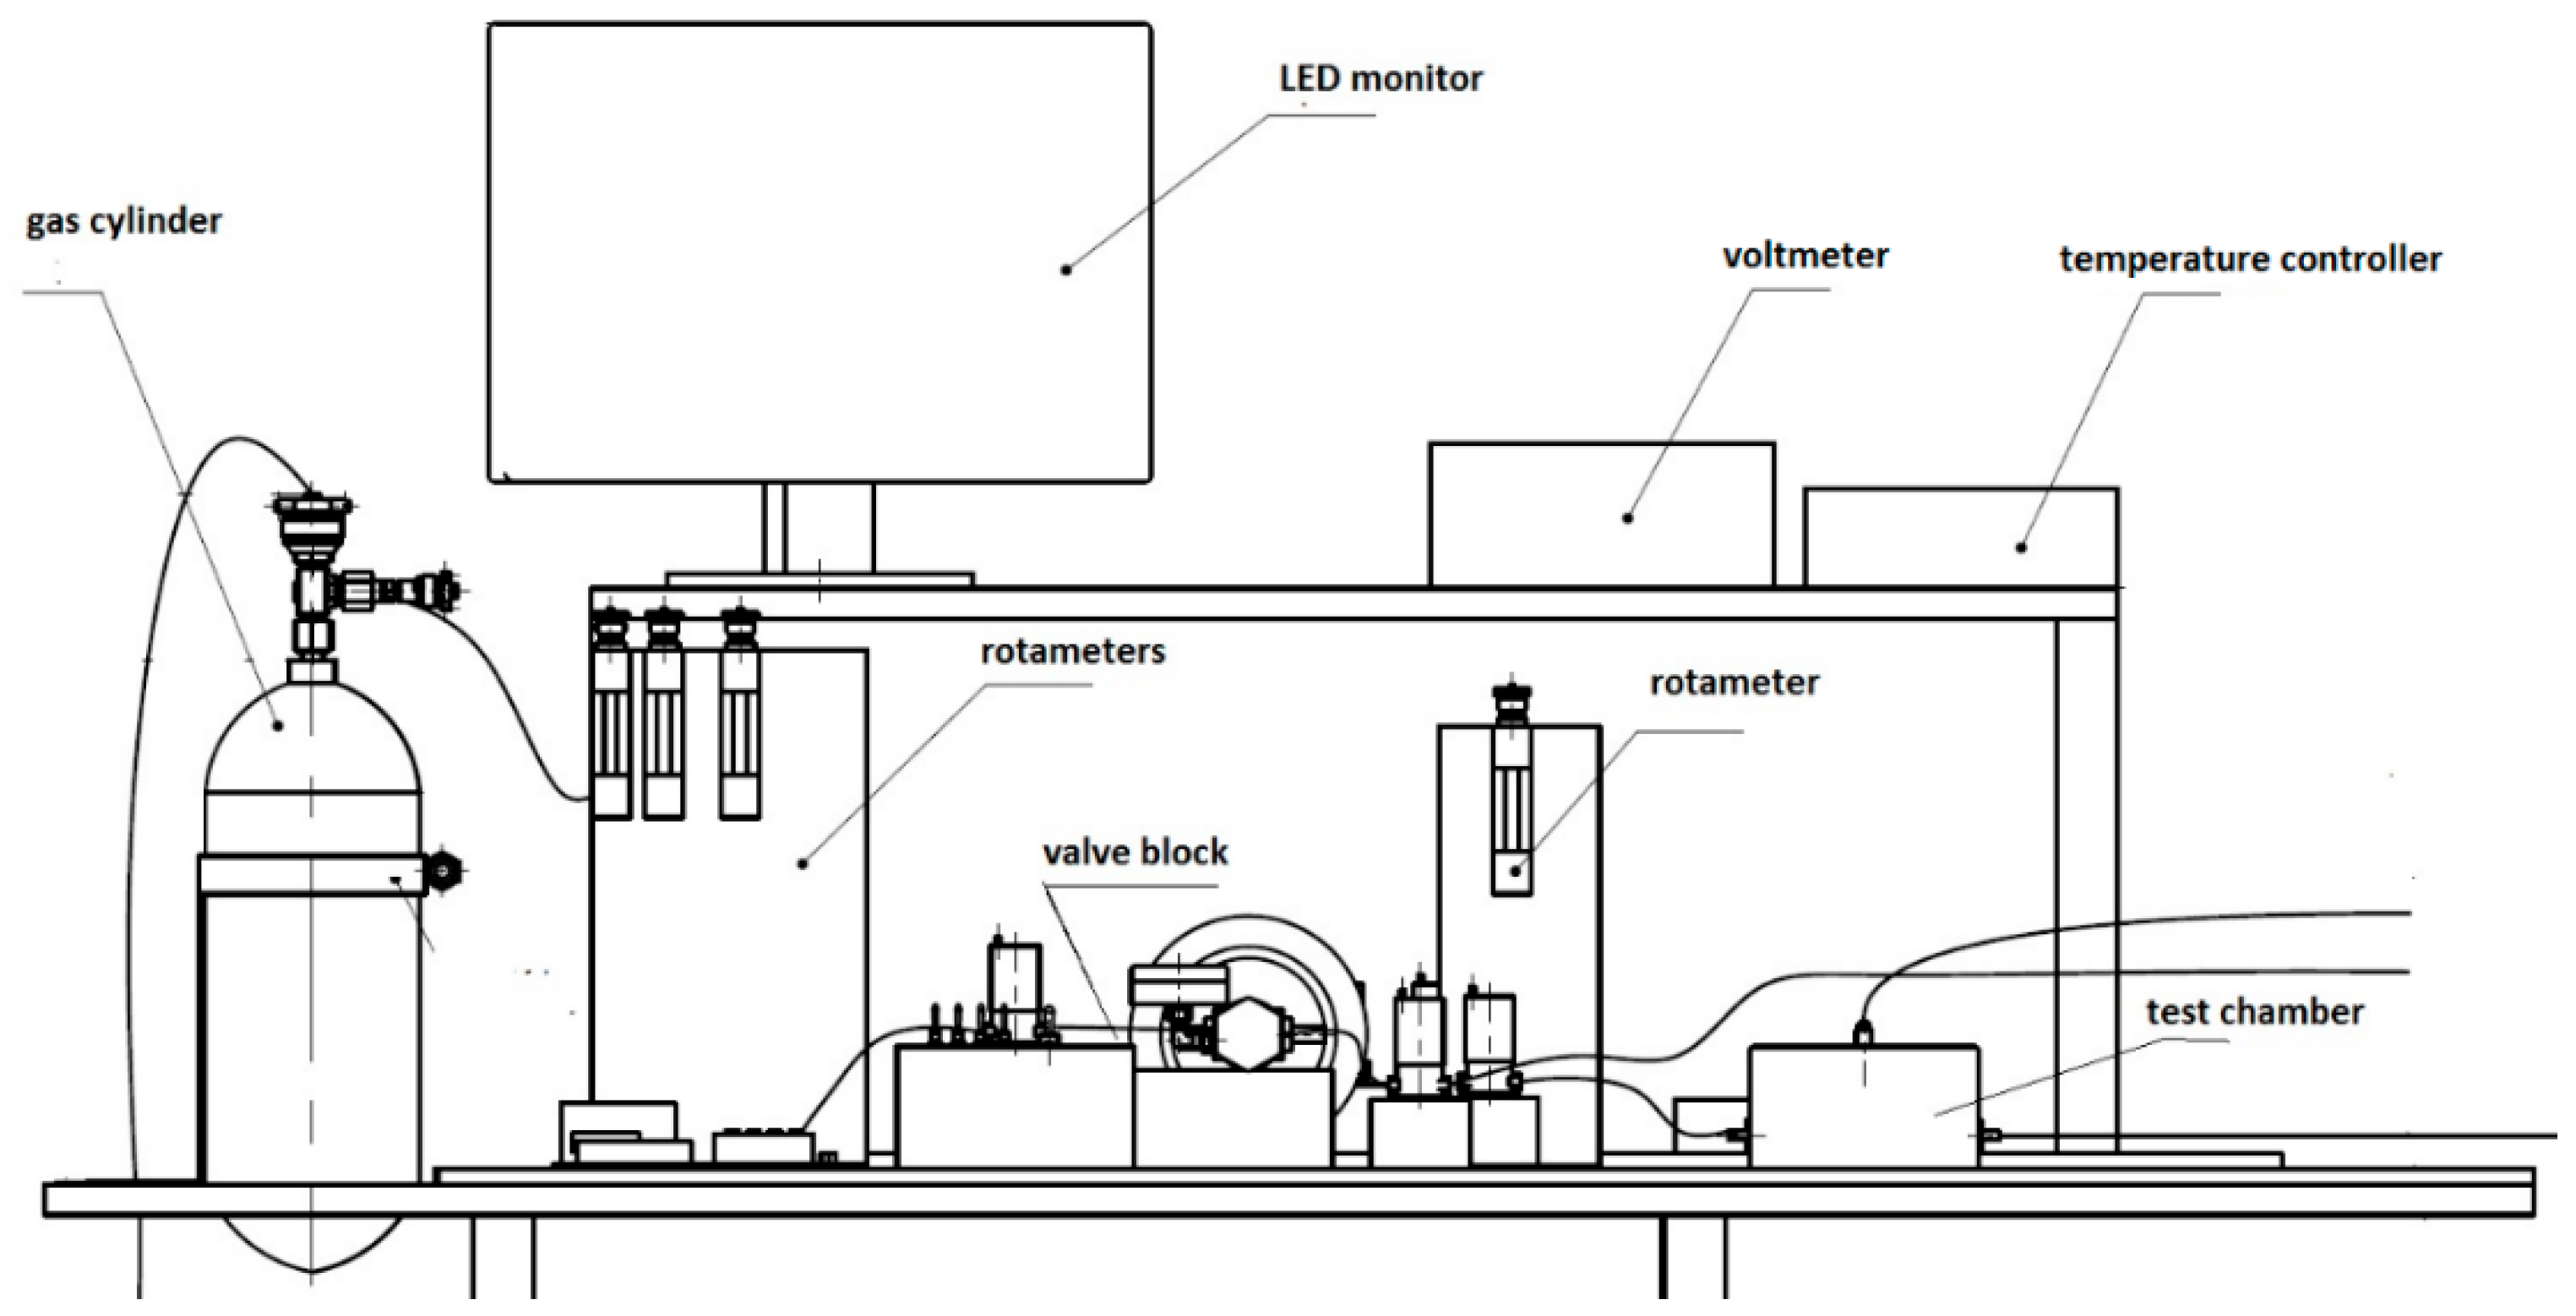
2. Materials and Methods

The SiO2ZrO2 composite films were synthesized by the sol-gel technique. ZrOCl2·8H2O was preliminarily dissolved in distilled water at room temperature and then poured into an alcoholic solution of tetraethoxysilane (TEOS), prepared 24 h before. TEOS was dissolved in absolute isopropanol at a volume ratio of 1:7. The zirconium concentration in the TEOS-based solution was 1 wt.%. The final mixture was spin-coated onto the silicon substrate. Prior to the spin-coating procedure, a 2 μm-thick silicon dioxide insulating layer was first grown on a Si (111) substrate by wet oxidation. The samples prepared by the technique as a result of this procedure were first dried at 100 °C for 2 h and then thermally treated at 500 °C for 2 h in air.
Film morphology was characterized by SEM (scanning electron microscopy) (microscope LEO 1560, ZEISS, Oberkochen, Germany) with an operating voltage of 5 kV. The chemical analysis of the films was investigated using an energy dispersive X-ray (EDX) method. All measurements were carried out using a complex analytic device based on the both scanning electron microscope VEGA II LMU with an operating voltage of 20 kV and a microanalysis system INCA ENERGY450/XT with a silicon drift detector (X-Act SDD) (Tescan/OXFORD Instruments Analytical, Great Britain, UK). EDX and wavelength-dispersive X-ray (WDX) detectors were used for greater accuracy in the determination of chlorine. The thickness of the film treated at 500 °C estimated from SEM images is ~155 nm. X-ray diffraction (XRD) phase analysis was performed with an ARL X’TRA diffractometer equipped with a solid-state Si(Li) detector that registered selectively Cu Ka radiation (λ = 1.5418 A°). Due to the very small thickness of the layer, the first conventional scan in the Bragg–Brentano mode only revealed the single-crystalline Si substrate in the (001) orientation. Then, all other scans were made in the grazing incidence mode, with incidence angles (ω) of 3°.
The band gap energy was determined from the optical absorption spectra recorded using a commercial spectrophotometer LEKI SS1207 (Leki Instruments, Helsinki, Finland) and analyzed by the empirical relation: αhν ∞(hν-Eg)m, where hv is the photon energy, Eg is the band gap energy and m is an exponent determined by the nature of the electron transition during the absorption process, i.e., m = 1/2 for direct transition and m = 2 for indirect transition.
To fabricate the SiO2ZrO2 gas sensors, V/Cu/Cr layers were deposited via an interdigitated shadow mask onto the SiO2ZrO2/SiO2/Si templates to serve as the contact electrodes (Figure 1).
The measurement setup used for the measurement of gas sensor characteristics and electronic parameters in controlled gas environments is shown in Figure 2. The setup consists of: (i) a test chamber with the substrate holder, heating element and Pt-thermocouple, and (ii) control, supply, and measurement electronics (voltmeter and temperature controller). The operating temperature and electronic control of the measurement system are automated by means of a personal computer. The gas inlet is controlled by the valve block and rotameters.
The gas-sensitive properties of the films were tested to NO2 inputs to be varied in the concentration range of 40–1060 ppm. The sensors were heated from room temperature to 200 °C to get the dependence of resistance on temperature and the sensor operating temperature.

3. Results and Discussion

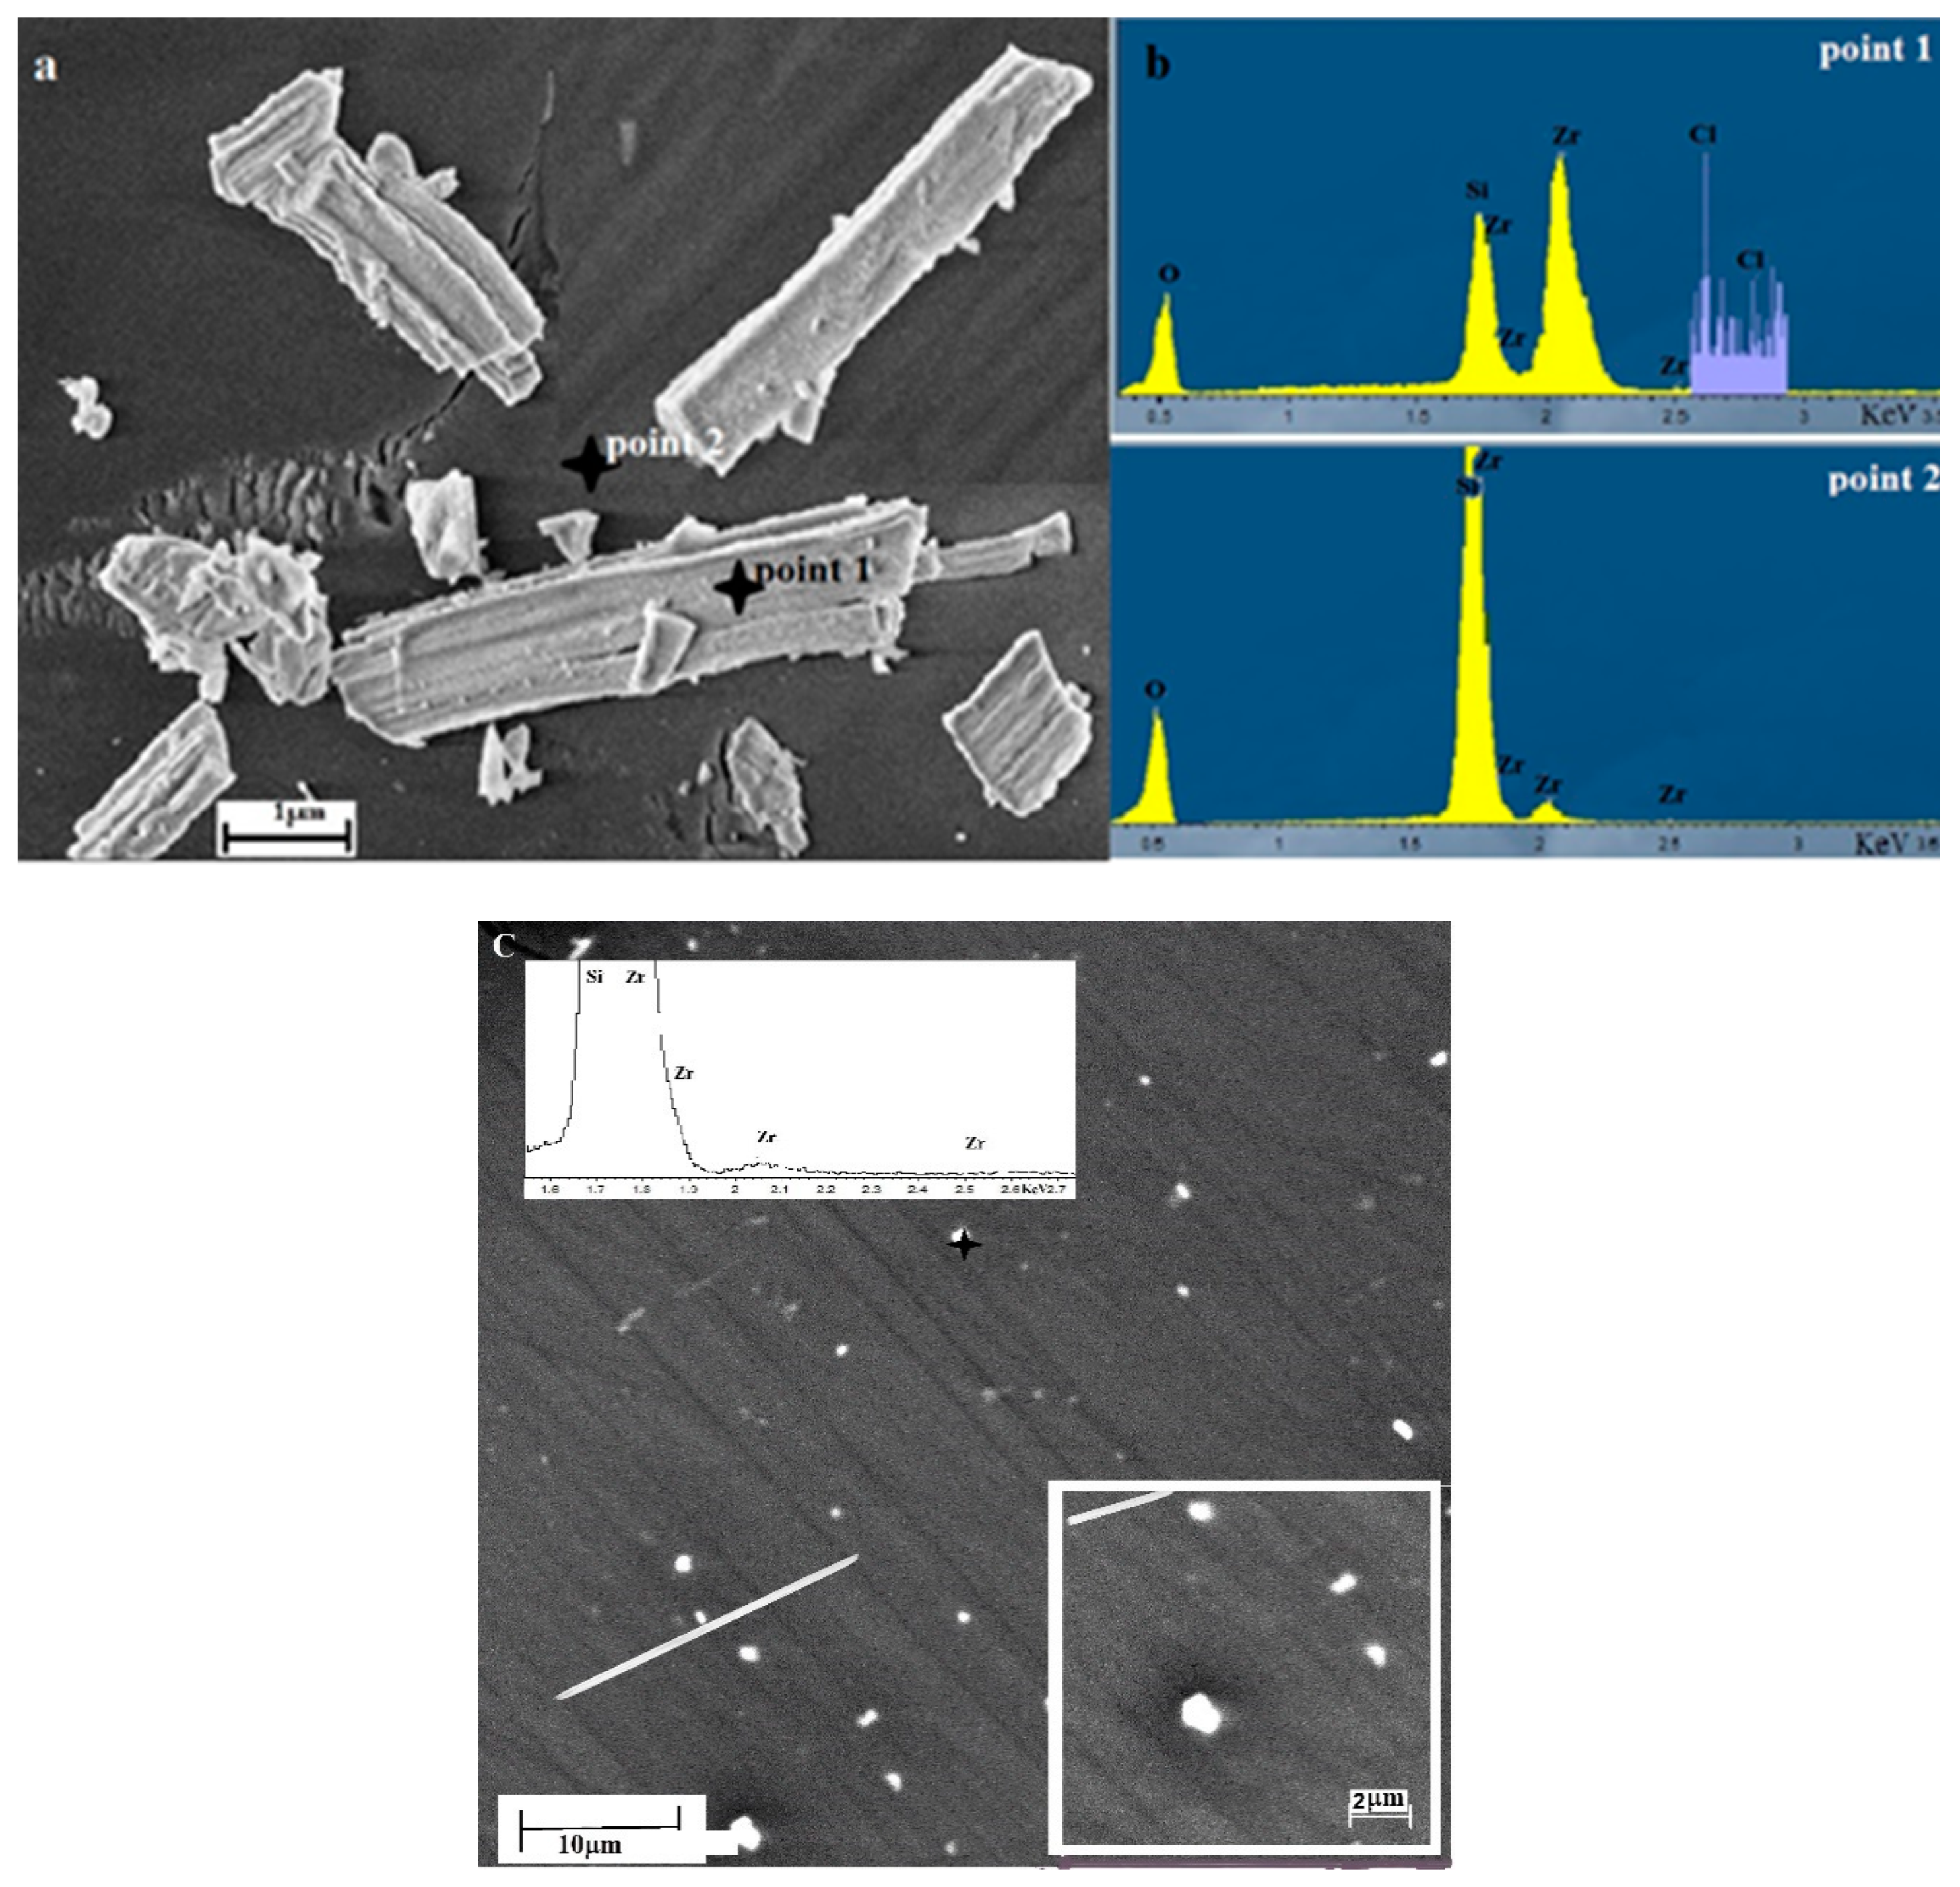
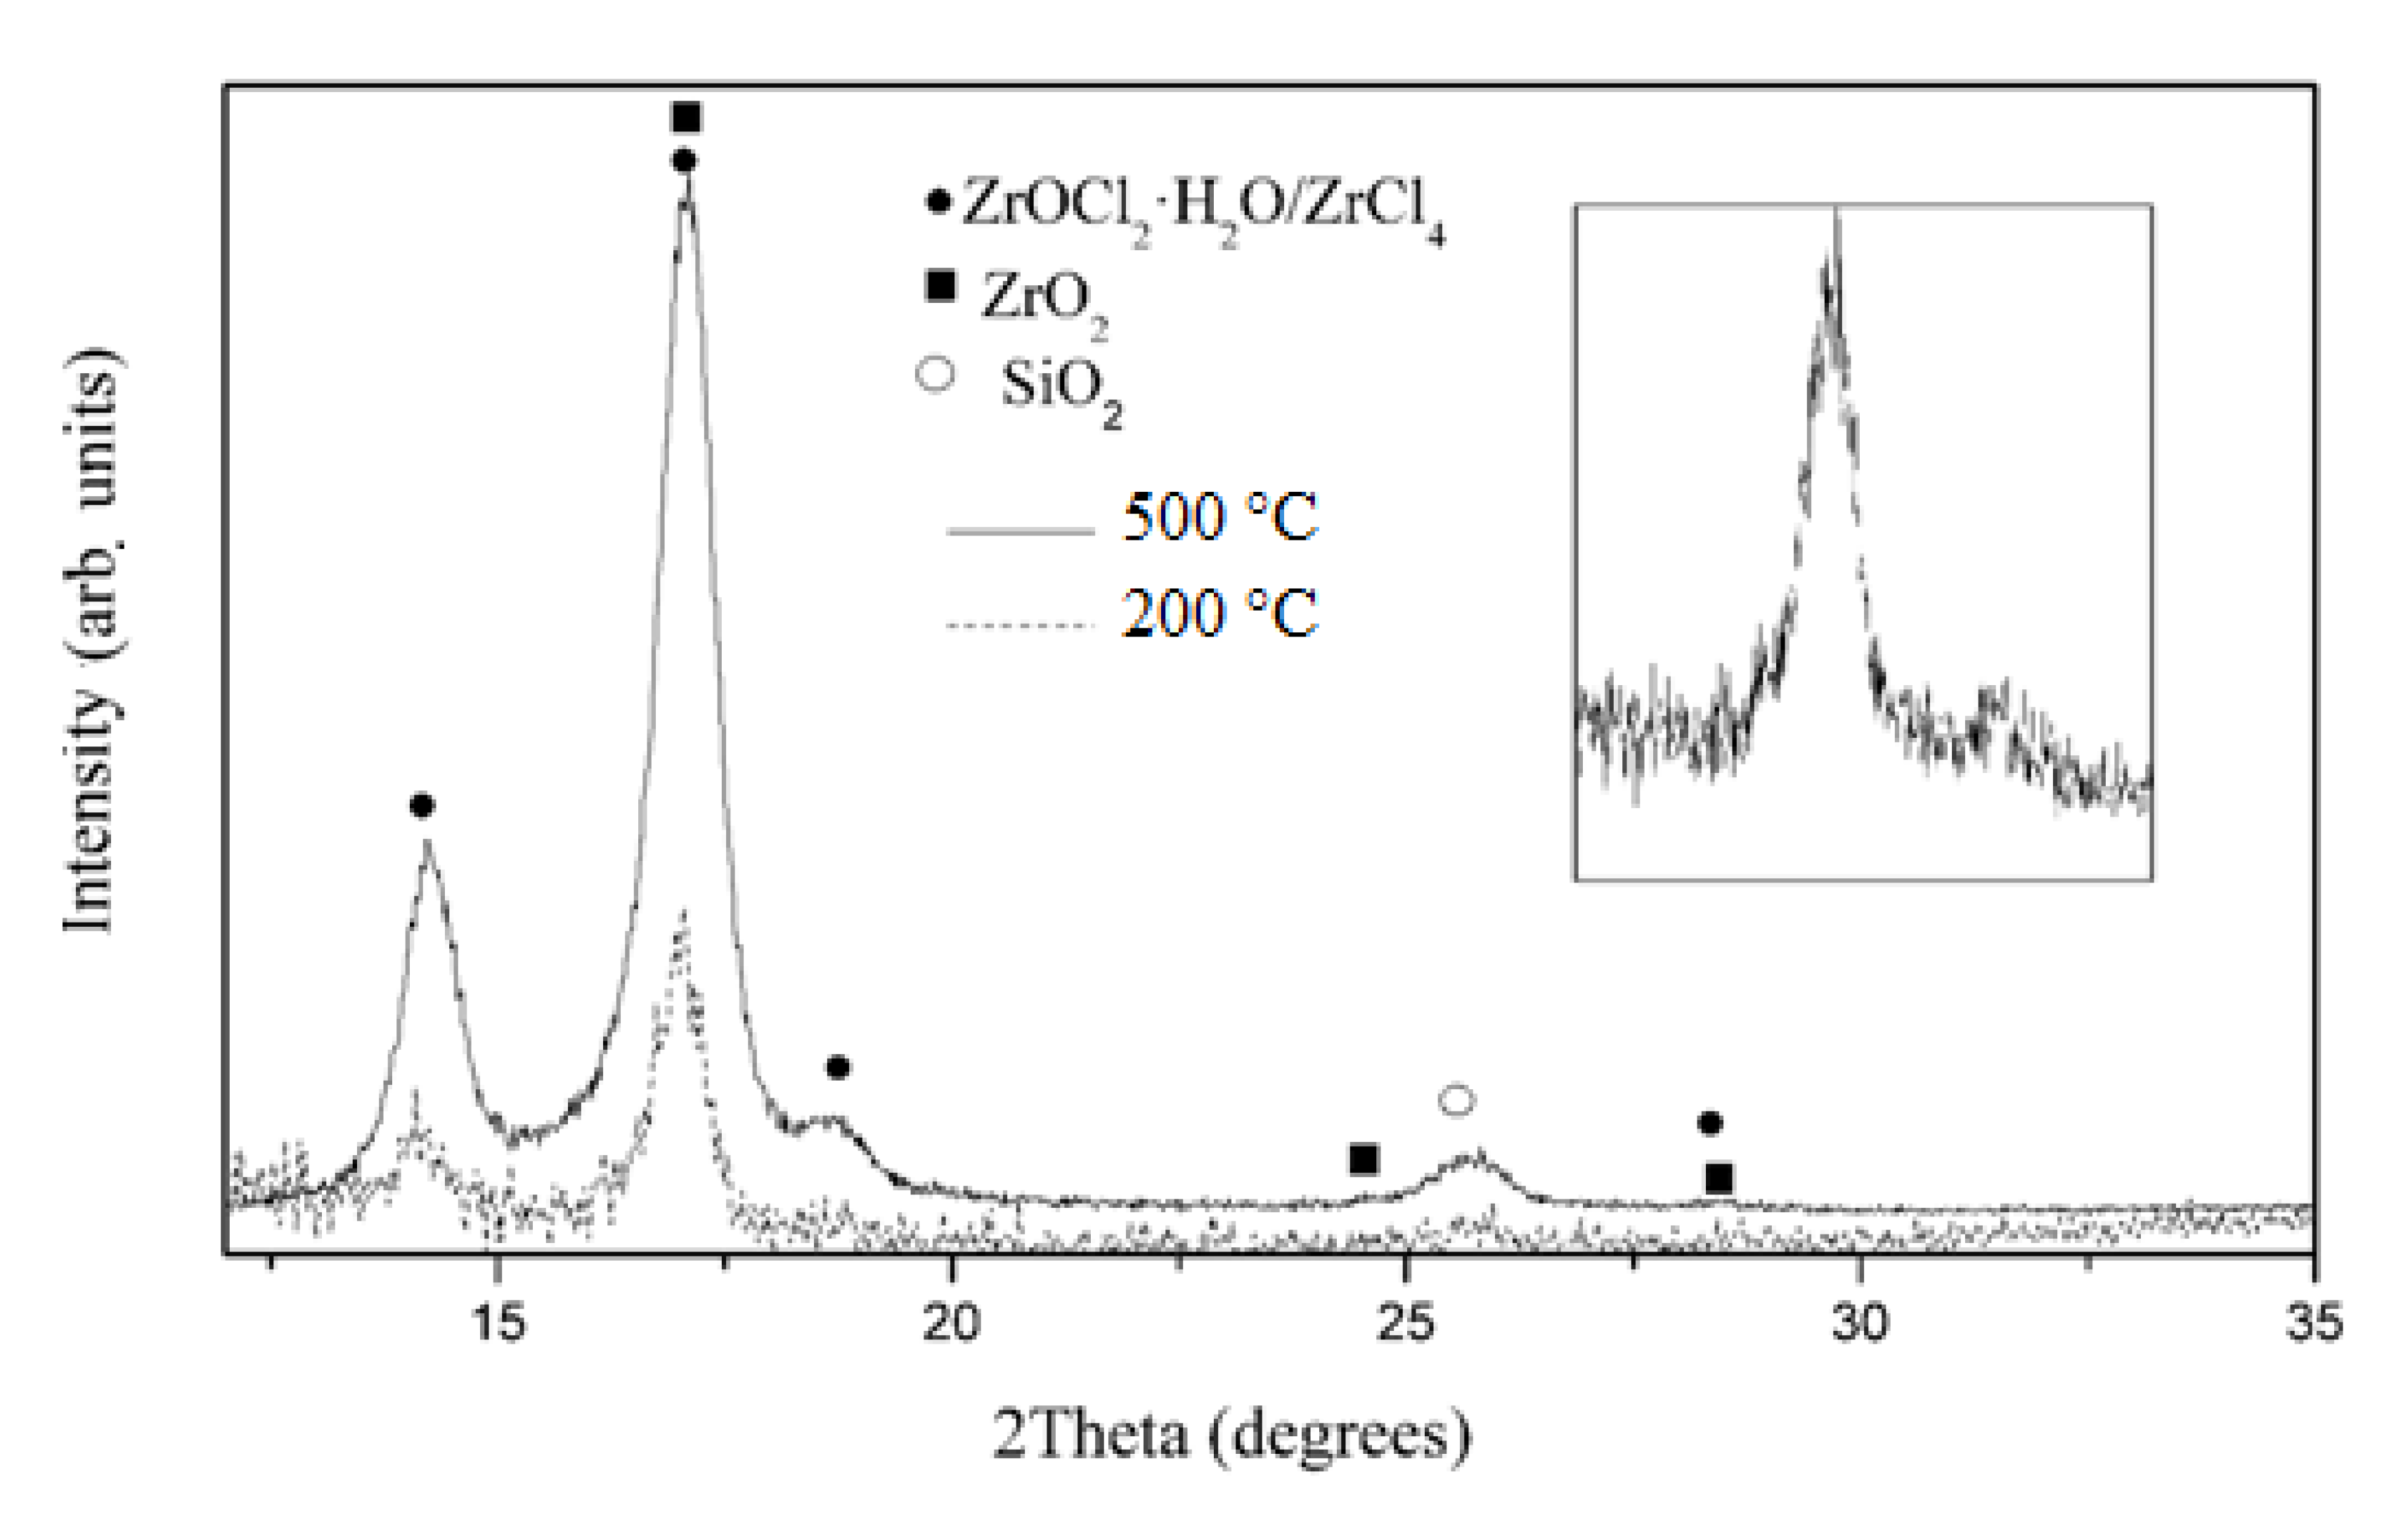
3.1. Characterization

SEM micrographs (Figure 3a) reveal the formation of 1 μm-thick crystallites with a length range of 1–4 μm on the surface of the film. It seems appropriate to consider that the particles which appear in the SEM image have a rectangular shape and crystalline structure. The EDX study was carried out to clarify the chemical composition of different points of SiO2ZrO2 films, namely: crystallites (Figure 3b, point 1) and the film surface itself (Figure 3b, point 2). Note that the minimum electron beam spot size achievable for the EDX analysis was approximately 500 nm, which allows for the accurate determination of the elemental composition of the crystallites. As can be seen, crystallites contain zirconium and chlorine (point 1), while on the surface of the films (point 2), there is a significant decrease in the amount of zirconium and the complete absence of chlorine. The relative content of elements in terms of 100% (semi-quantitative analysis) is presented in Table 1. The thickness of the films excludes quantitative analysis—the depth of generation of the analytical signal (~2 μm) is greater than the thickness of the film.
The used synthesis technique leads to the formation of a complex, multiphase system in SiO2ZrO2 films, which is clearly illustrated by the diffraction pattern (Figure 4). The X-ray diffraction patterns of the thermally treated samples at 500 °C and 200 °C have the same peaks and contain both low-intensity and high-intensity wide peaks that may indicate the presence of small size crystallites or non-stoichiometric phases in the samples. Lower intensity peaks at 200° can be explained by a smaller number and the size of the crystallites. A sufficiently high background, hindering the identification of weak peaks of the crystalline phase, indicates the presence of amorphous structures. Since the peaks are wide enough, it is reasonable to identify them as groups of reflections from different crystalline phases, since overlapping or similar peaks cannot be separated in this case. As shown in [23,24], the weakest peaks around 17°, 24.26° and 28.3° (Figure 4, insert) are due to the (110), (011), (−111) planes and can be attributed to the most intense reflections of a stable monoclinic ZrO2 with an impurity of tetragonal phases. The weak intensity of the peaks can be explained by the fact that the temperature of 500 °C is the initial temperature of the formation of the zirconia crystal structure in the films [25]. А wide peak at 25° can include a reflex from the (011) plane of SiO2. However, these phases do not explain the presence of high-intensity bright peaks around 14.22°, 17.0° and 18.6° on the diffractogram. As the literature analysis showed, a peak of 14.22° is a characteristic of ZrCl4 [26]. However, the presence of peaks at 17.0° and 18.6°, which are not characteristic of this compound, does not allow one to unequivocally approve the full decomposition of the precursor ZrOCl2·8H2O into ZrO2 and ZrCl4. The partial peaks at 14.22°, 17.0° and 18.6° are closest to an underdeveloped ZrOCl2·8H2O with less water, for example, ZrOCl2·6H2O or ZrCl(OH)/ZrCl(OH)2 as it was shown for CaCl(OH)/CaCl(OH)2 [27]. It is possible that the introduction of silicon prevents the complete decomposition of ZrOCl2·8H2O and the removal of chlorine.
Thus, based on the combined analysis of EDX and XRD data, we suppose that crystallites on the surface of the films can be formed by ZrO2 and residual ZrCl4/ZrOCl2·6H2O or ZrCl(OH)/ZrCl(OH)2 phases in the presence of silicon dioxide. We assume that small zirconium oxide nanoparticles and zirconium ions are embedded in a silicon matrix, as was observed for the SiO2CuOx films studied by us earlier [28].
The average size of the crystallites in the film estimated from the Scherrer equation was 10–12 nm and 9–12 nm for the films thermally treated at 200 °C and 500 °C, respectively. So, we can assume that large grains on the film surface (Figure 3) are really the crystallite agglomerates. The authors [29] produced the pure ZrO2 material by use of the sol-gel technique. The average particle size of ZrO2 nanoparticles is found to be 25 nm. In the present work, hierarchical pore structures were prepared by the sol-gel method in alkoxy-derived silica systems [30]. The silica particles cover the zirconia crystallites and prevent aggregation during the thermal treatment. Such a structure allows gas adsorption onto zirconia crystallites through the silica pores.

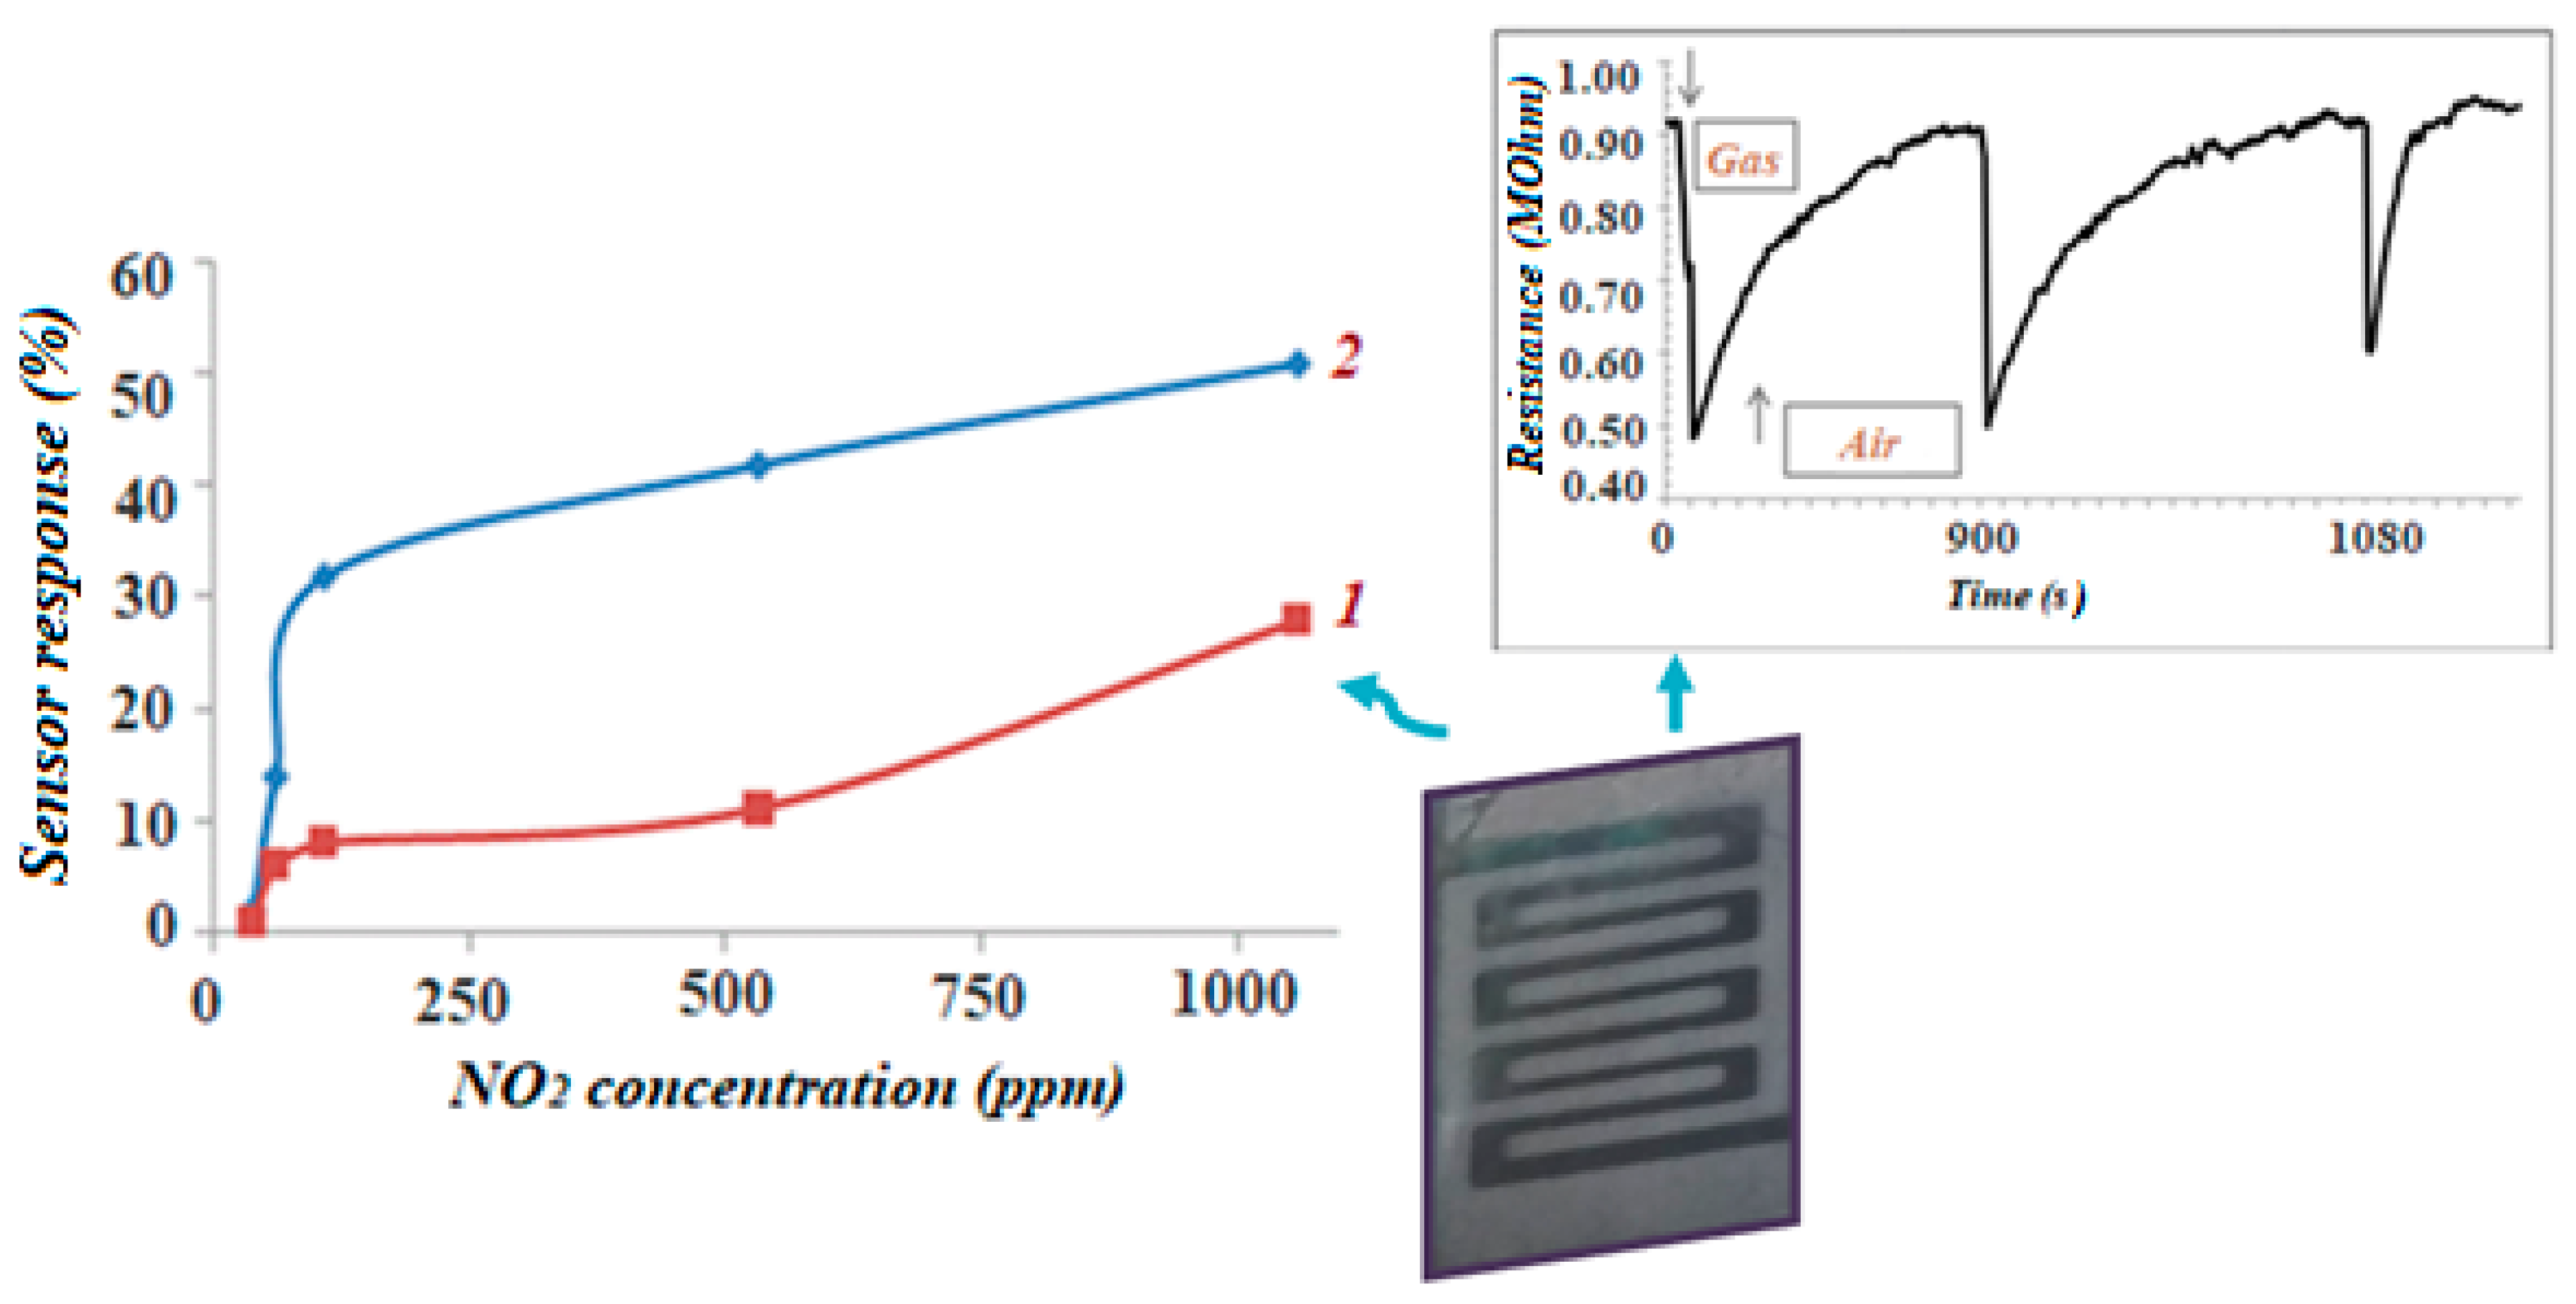
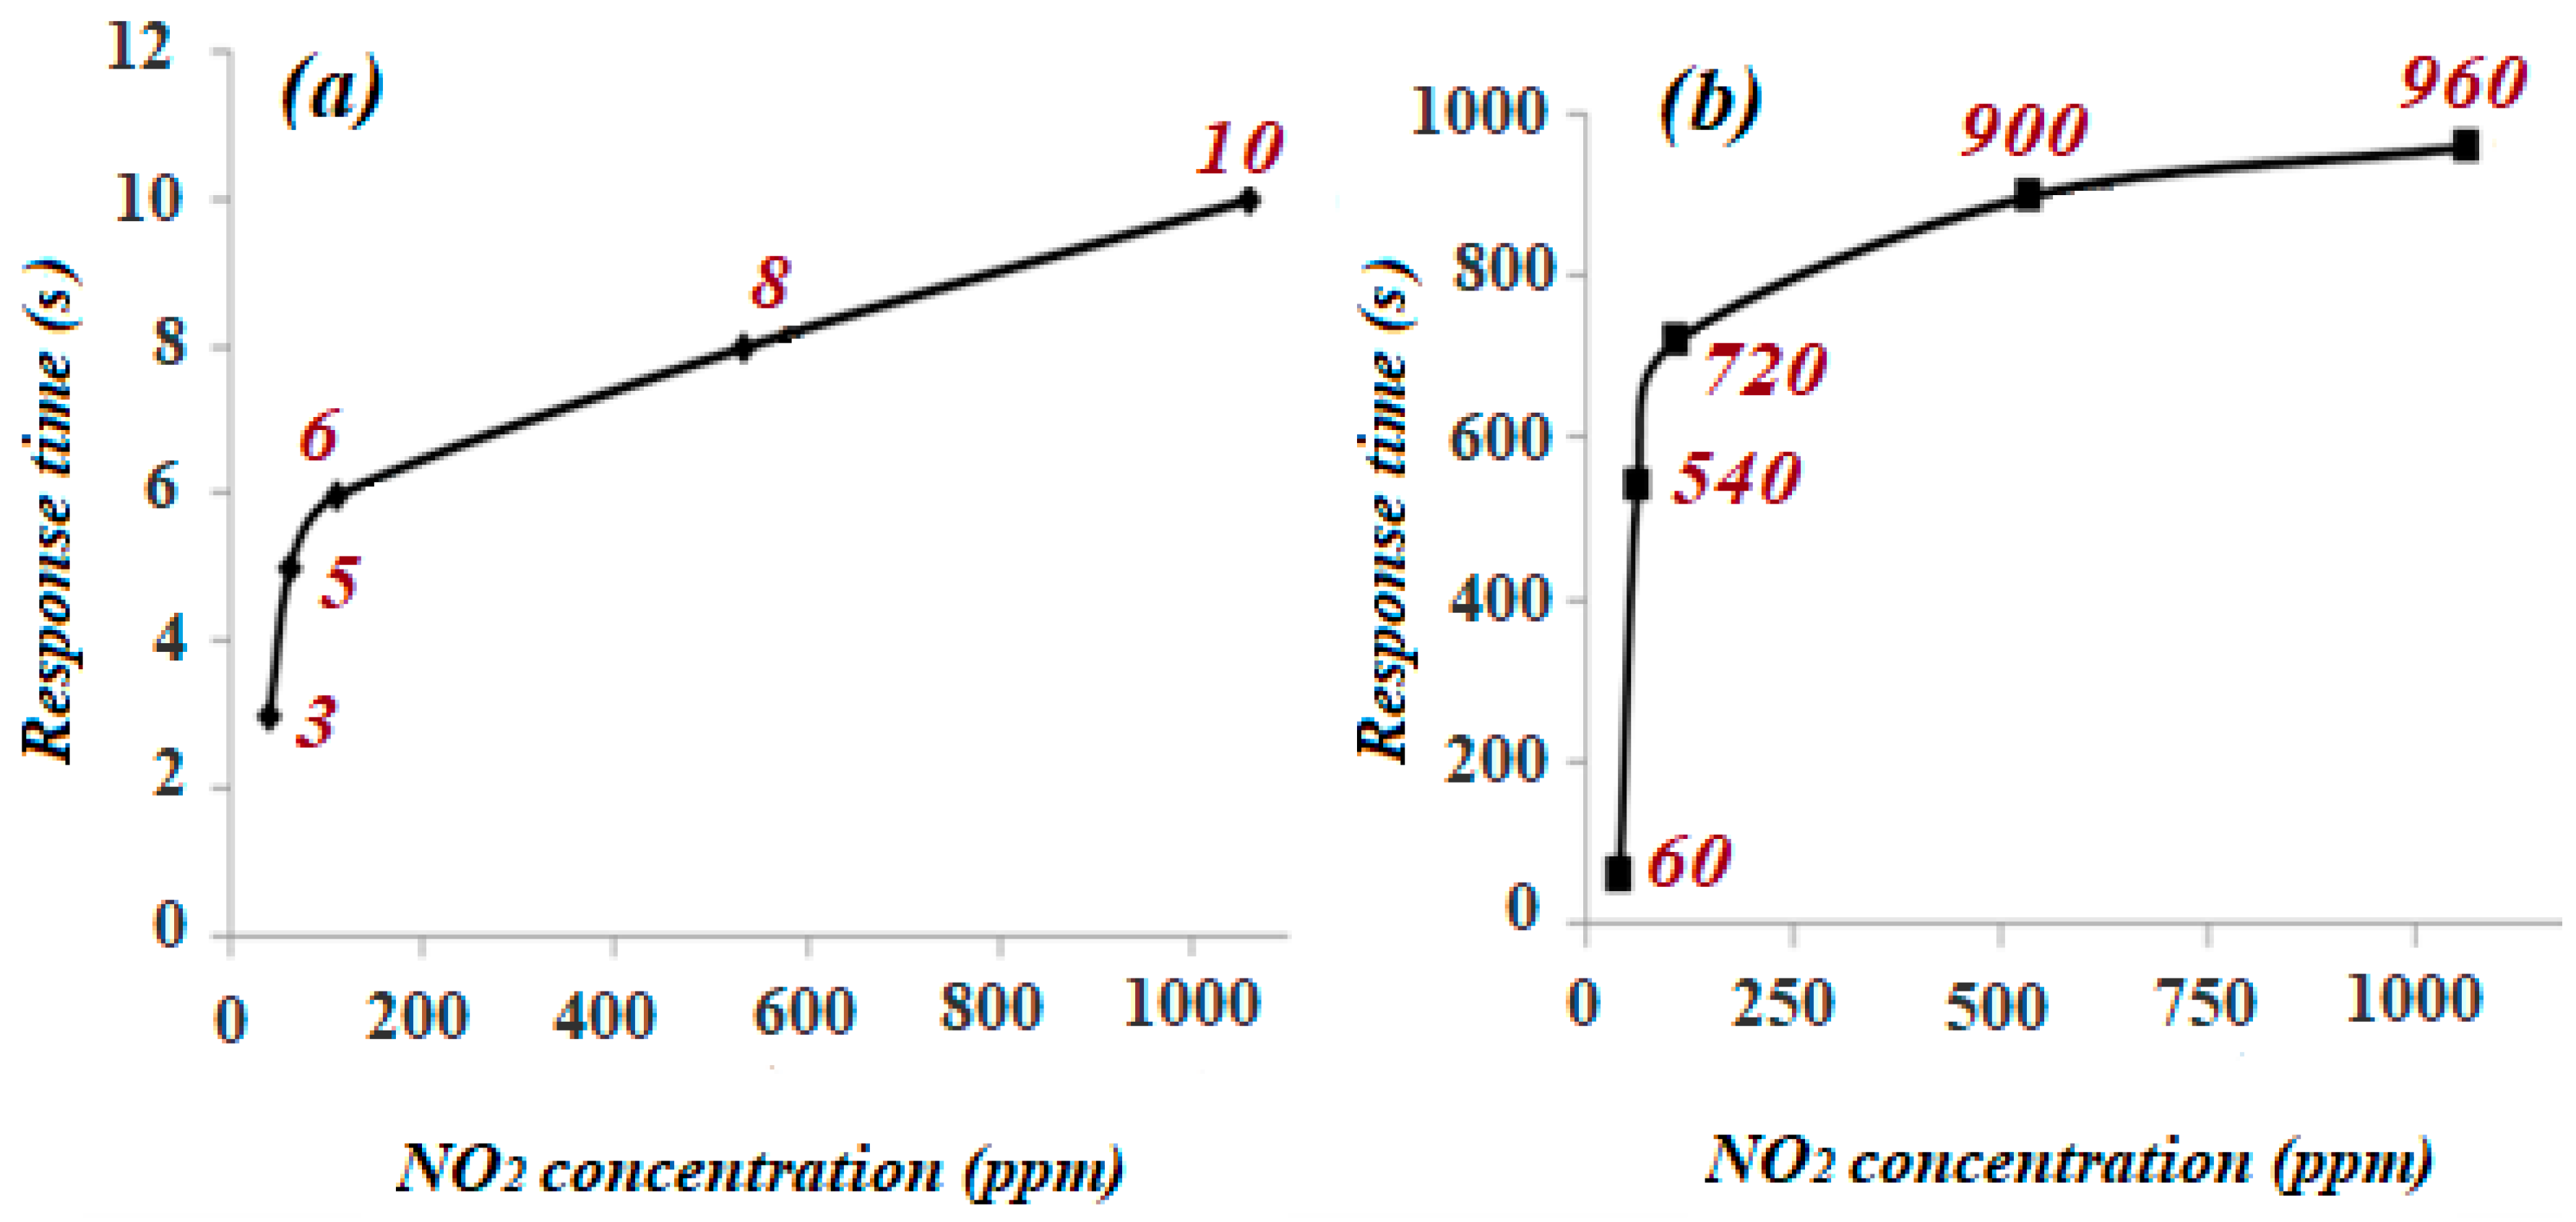
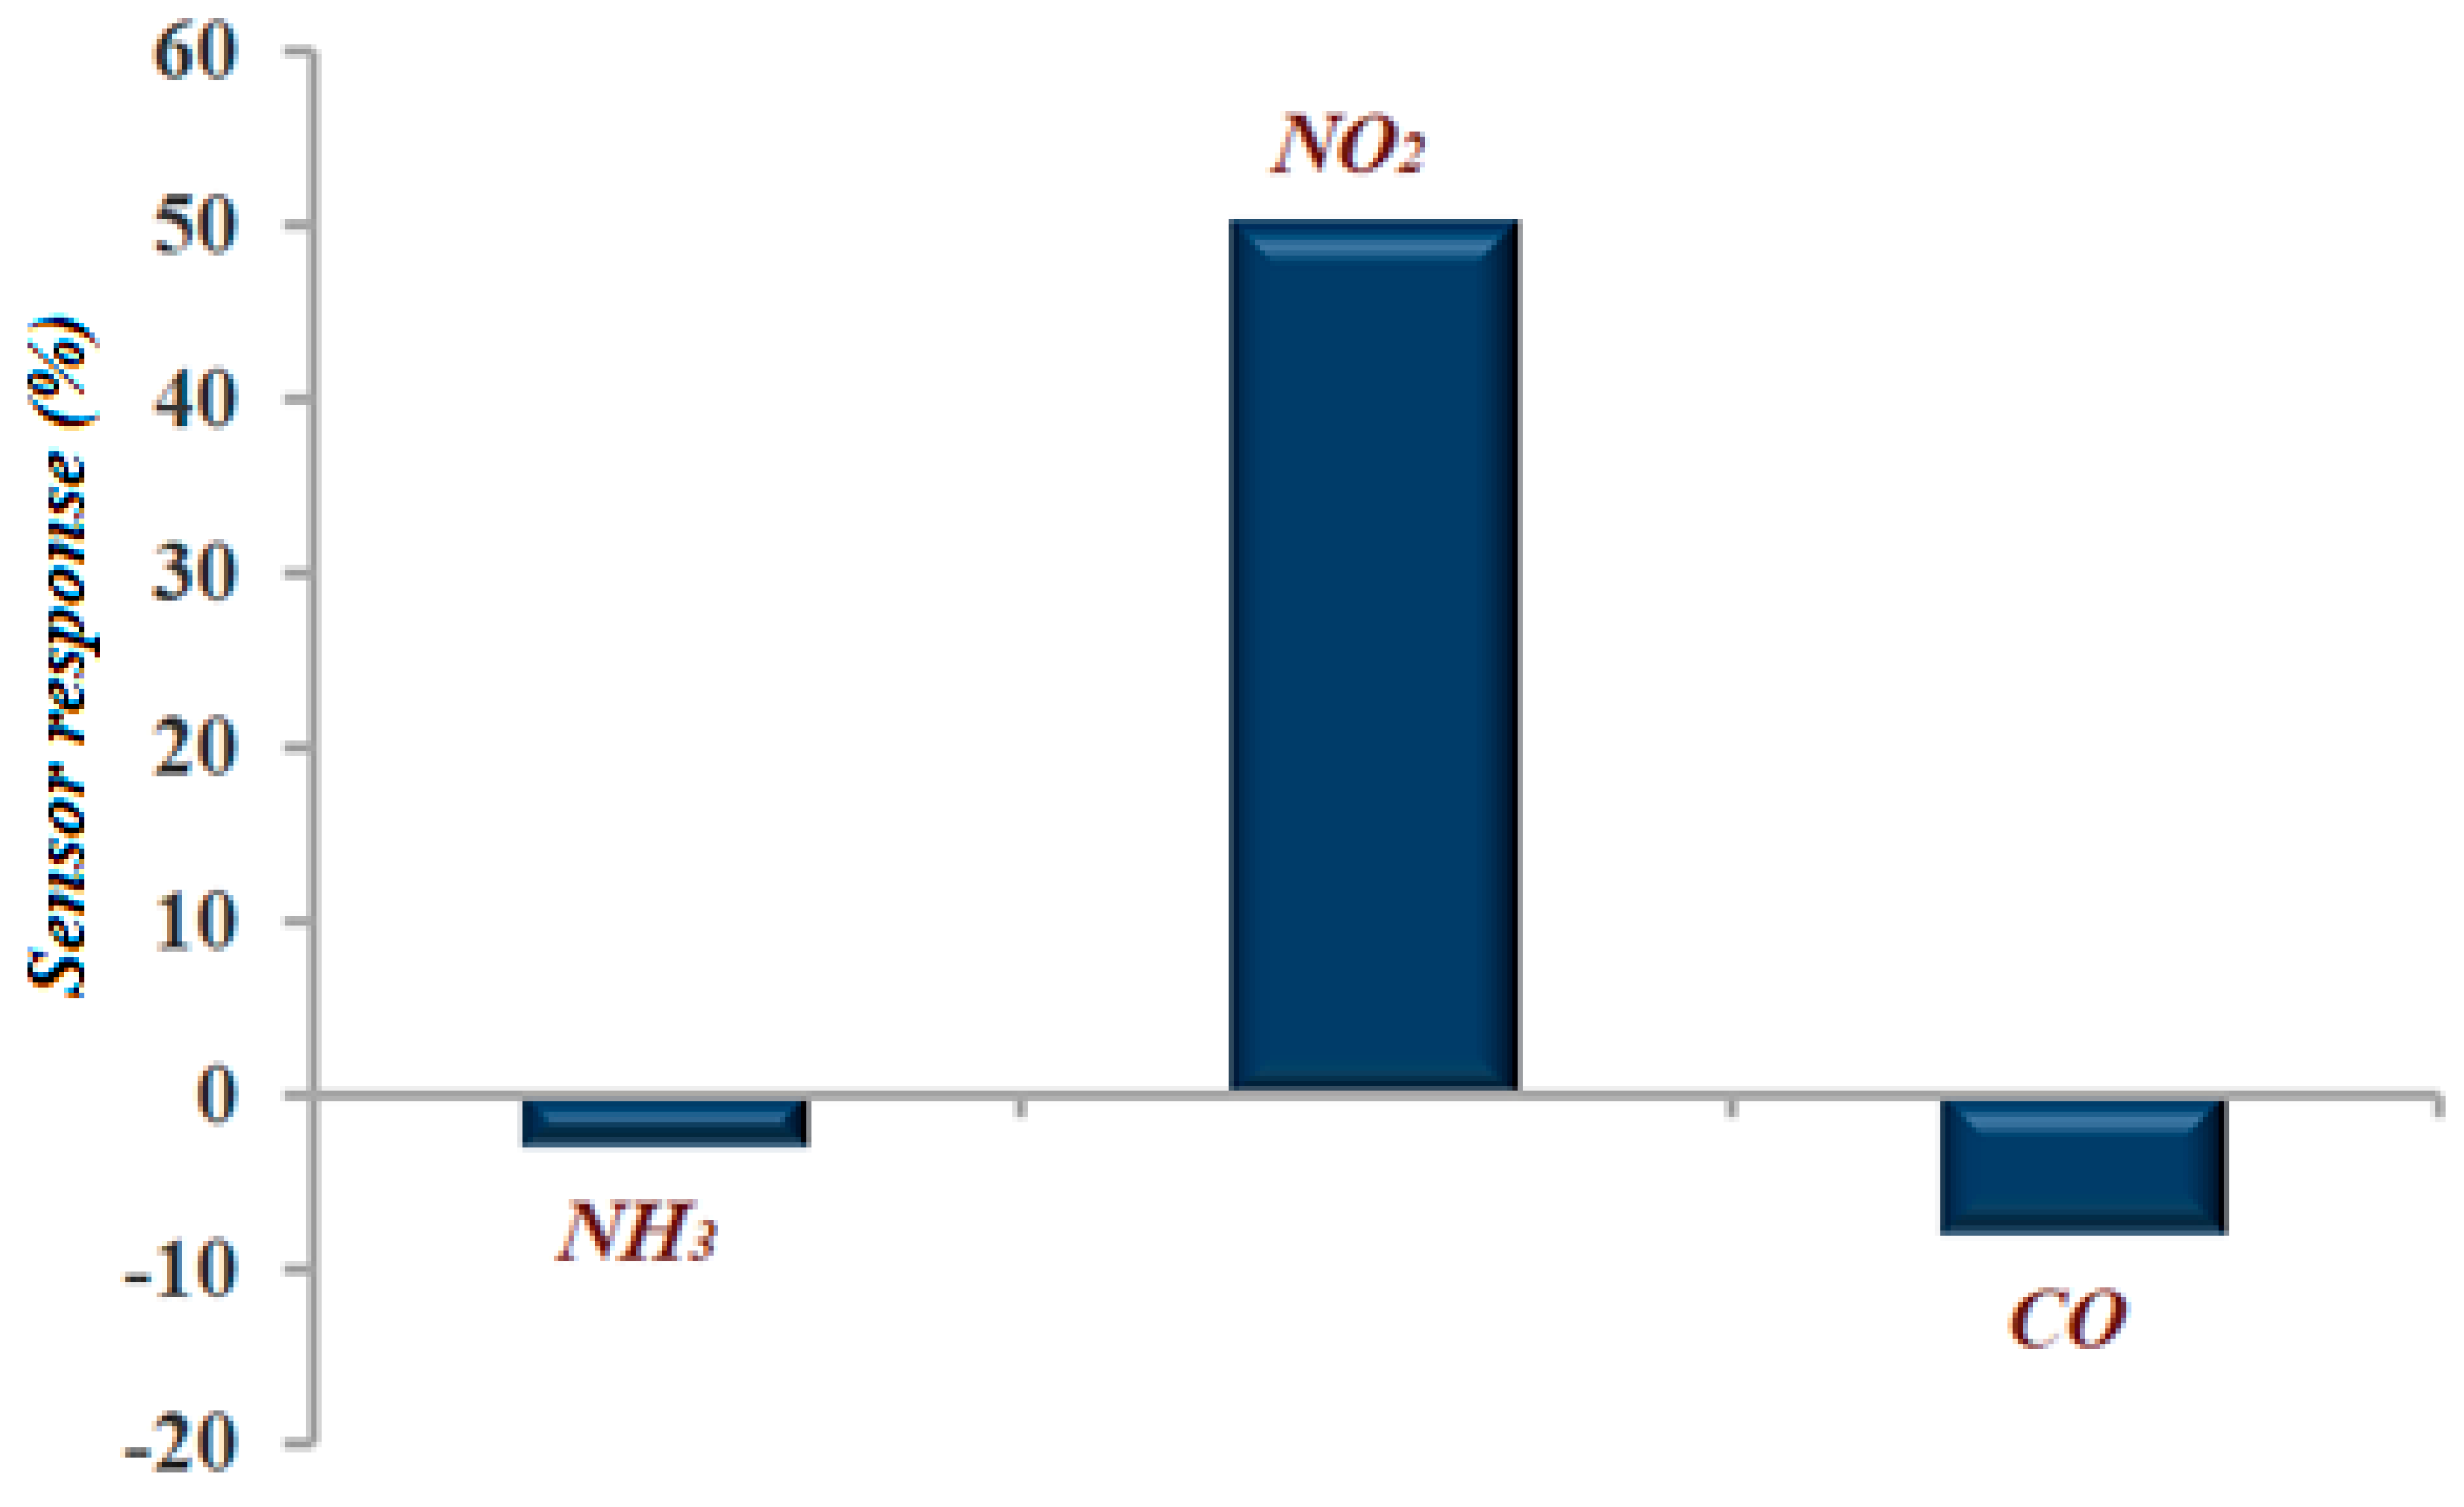
3.2. Gas Sensitivity Measurements

The film resistance was reversibly changed under NO2 exposure (Figure 5) with the characteristic response time to be found as 3, 5, 6, 8 and 10 s for 40 ppm, 62 ppm, 110 ppm, 534 ppm and 1060 ppm concentrations, respectively (Figure 6). The reaction was observed immediately after the gas flow in the test chamber and characterized by high stability and reproducibility. After purging the test chamber with air, the film resistance returned to the initial value. The quick response may be due to the faster oxidation of gas. The average recovery time depended on the gas concentration and was increased from 60 s to 960 s with gas concentration changing from 40 ppm to 1060 ppm (Figure 6b). So, we observed good recovery characteristics (16 min) even after the sensor was exposed to a large concentration of NO2 (1060 ppm).
The minimum NO2 concentration that was detected by the SiO2ZrO2-based sensor is 40 ppm, but the maximum is not limited by 1060 ppm as shown in Figure 5. Also, Figure 5 reveals that the response of the sensor based on the SiO2ZrO2 film thermally treated at 200 °C is worse than that treated at 500 °C. This is due to the fact that at low temperatures (100–200 °C), Zr(OH)2 and/or ZrOCl2·4H2O are more likely to form and the film structure is not stable. This fact also was proved by XRD analysis. According to [29], the thermolysis process of zirconium oxochloride is:
ZrOCl 2 · 8 H 2 0   40 80   ° C   ZrOCl 2 · 5 H 2 0   80 110   ° C   ZrOCl 2 · 4 H 2 0   110 130   ° C   Zr ( OH ) 2 · 0.7 H 2 0   400 480   ° C   Zr 0 2
Further investigations were done for the sample thermally treated at 500 °C.
To evaluate the selective nature of the sensor, it was exposed to various gases, namely NO2, NH3 and CO, and the observed response is shown in Figure 7. It reveals that the SiO2ZrO2-based sensor was highly selective to NO2 gas.
Figure 8 depicts the variation of the gas response with an operating temperature of the SiO2ZrO2 sensor for 1060 ppm. It is clear from the figure that the largest response is observed at 25 °C. The material would then adsorb the oxygen species at higher temperatures ( O 2 2 O O 2 ) and this process is competitive with NO2 adsorption.
Sensitivity under low temperatures is due to the gas sensitivity mechanism.

3.3. Gas Sensitivity Mechanism

The gas sensitivity mechanism of semiconductor sensors is based on the interaction of the surface with gas. The interaction occurs on the grain boundaries of metal–oxides and may include such processes as oxidation–reduction, gas adsorption and surface chemical reactions [31].
In our work, NO2 gas adsorbs to the surface of the p-type semiconductor and takes the electrons to the near-surface layer.
NO 2 ( g ) + e ¯ NO 2 ( ads )
So, a layer of L size is formed near the surface of the semiconductor, comparable to the Debye length (LD) with a high content of “holes” (HAL) [32]. In this case, for small grain sizes (D) such that D < 2 L, the entire volume of the nanocrystallite participates in this process [33]. The presence of a negative surface charge causes the zone to bend, which creates a potential barrier on the surface. Its height and depth depend on the surface charge, which in turn depends on the number and type of adsorbed molecules [34]. The smaller the crystallite size, the smaller the potential barrier. However, on crystallites that are too small, the barrier practically does not arise. The response of the sensor becomes unstable, as was observed in films annealed at 200 °C.
An increase in the content of “holes” during adsorption leads to an increase in conductivity, which is observed during the experiment. At operating sensor temperatures below 100 °C, there are a number of features at absorption.
Surface morphology significantly affects gas-sensitive properties [35]. In our case, a thin film of friable amorphous silicon dioxide and unformed zirconia promotes the penetration of gas molecules to the grain boundary of the nanocrystallite. Also, SEM and XRD investigations reveal the presence of ZrOCl2·6H2O grains with OH groups and adsorbed H2O molecules (H2O (ads)) on the film surface.
The authors [36] showed oxygen ionization as О2− (ads) at temperatures lower than 147 °С. According to [37], adsorbed oxygen occupies about 5% of the surface. With increasing temperature, the occupied area will grow and as stated earlier, this process is competitive with NO2 adsorption.
According to the above, the following processes occur:
4 NO 2 ( g ) + 3 e ¯ + 2 H 2 O ( ads ) + O 2 ( ads ) 4 NO 2 OH   ( ads )
NO 2 ( g ) + e ¯ + OH NO 2 OH ( ads )

3.4. Electrophysical Measurements

The literature has widely stated that pure ZrO2 is an indirect band gap semiconductor having refractive index r = 2 [38] and with high indicators of band gap energy width 5.0–5.2 eV [39] or 4.28–4.46 eV [38]. In our case, the estimation of the double-oxide film effective band gap energy from the optical spectra (Figure 9) reveals the value of 0.2–0.3 eV.
The semiconducting nature of the SiO2ZrO2 film is observed from the measurements of resistance with operating temperature (Figure 10). The semiconductivity of the film is due to the presence of ZrO2 and its large oxygen deficiency.
The current voltage characteristics of a sensor tell us much about its operation and can be a very useful tool in determining the operating characteristics by showing its possible combinations of current and voltage. Figure 11 depicts the I-V characteristics of the SiO2ZrO2 sensor. The asymmetrical nature of the I-V characteristics shows that the contacts are non-ohmic in nature. It is observed from Figure 11 that the resistivity of the film is high enough because zirconia is an ionic conductor.

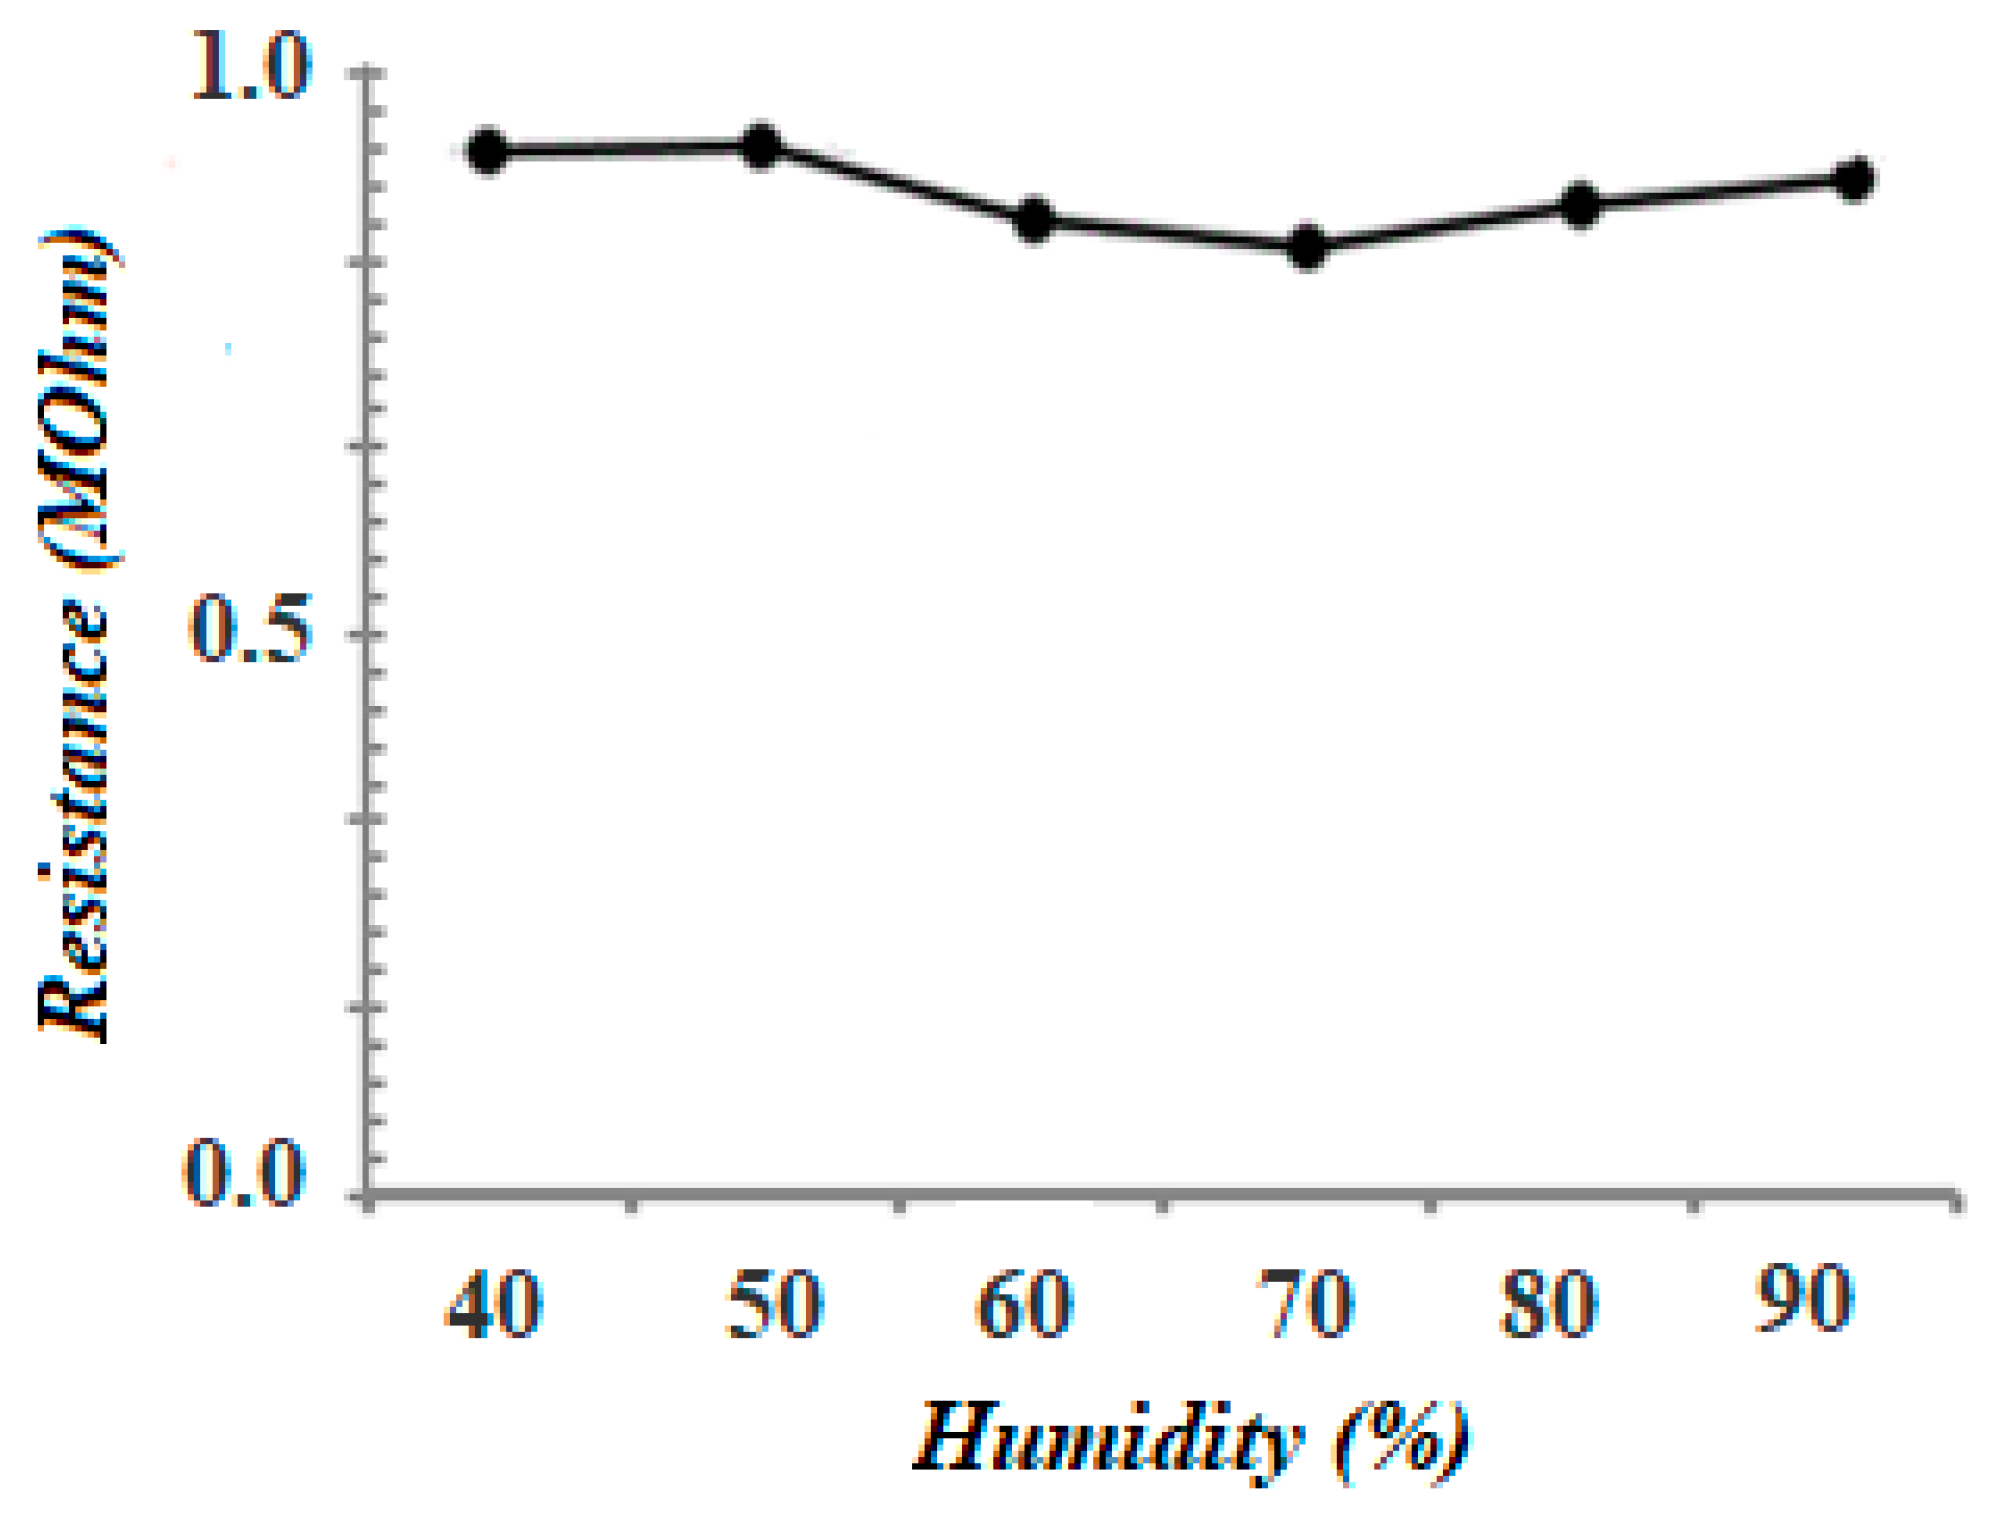
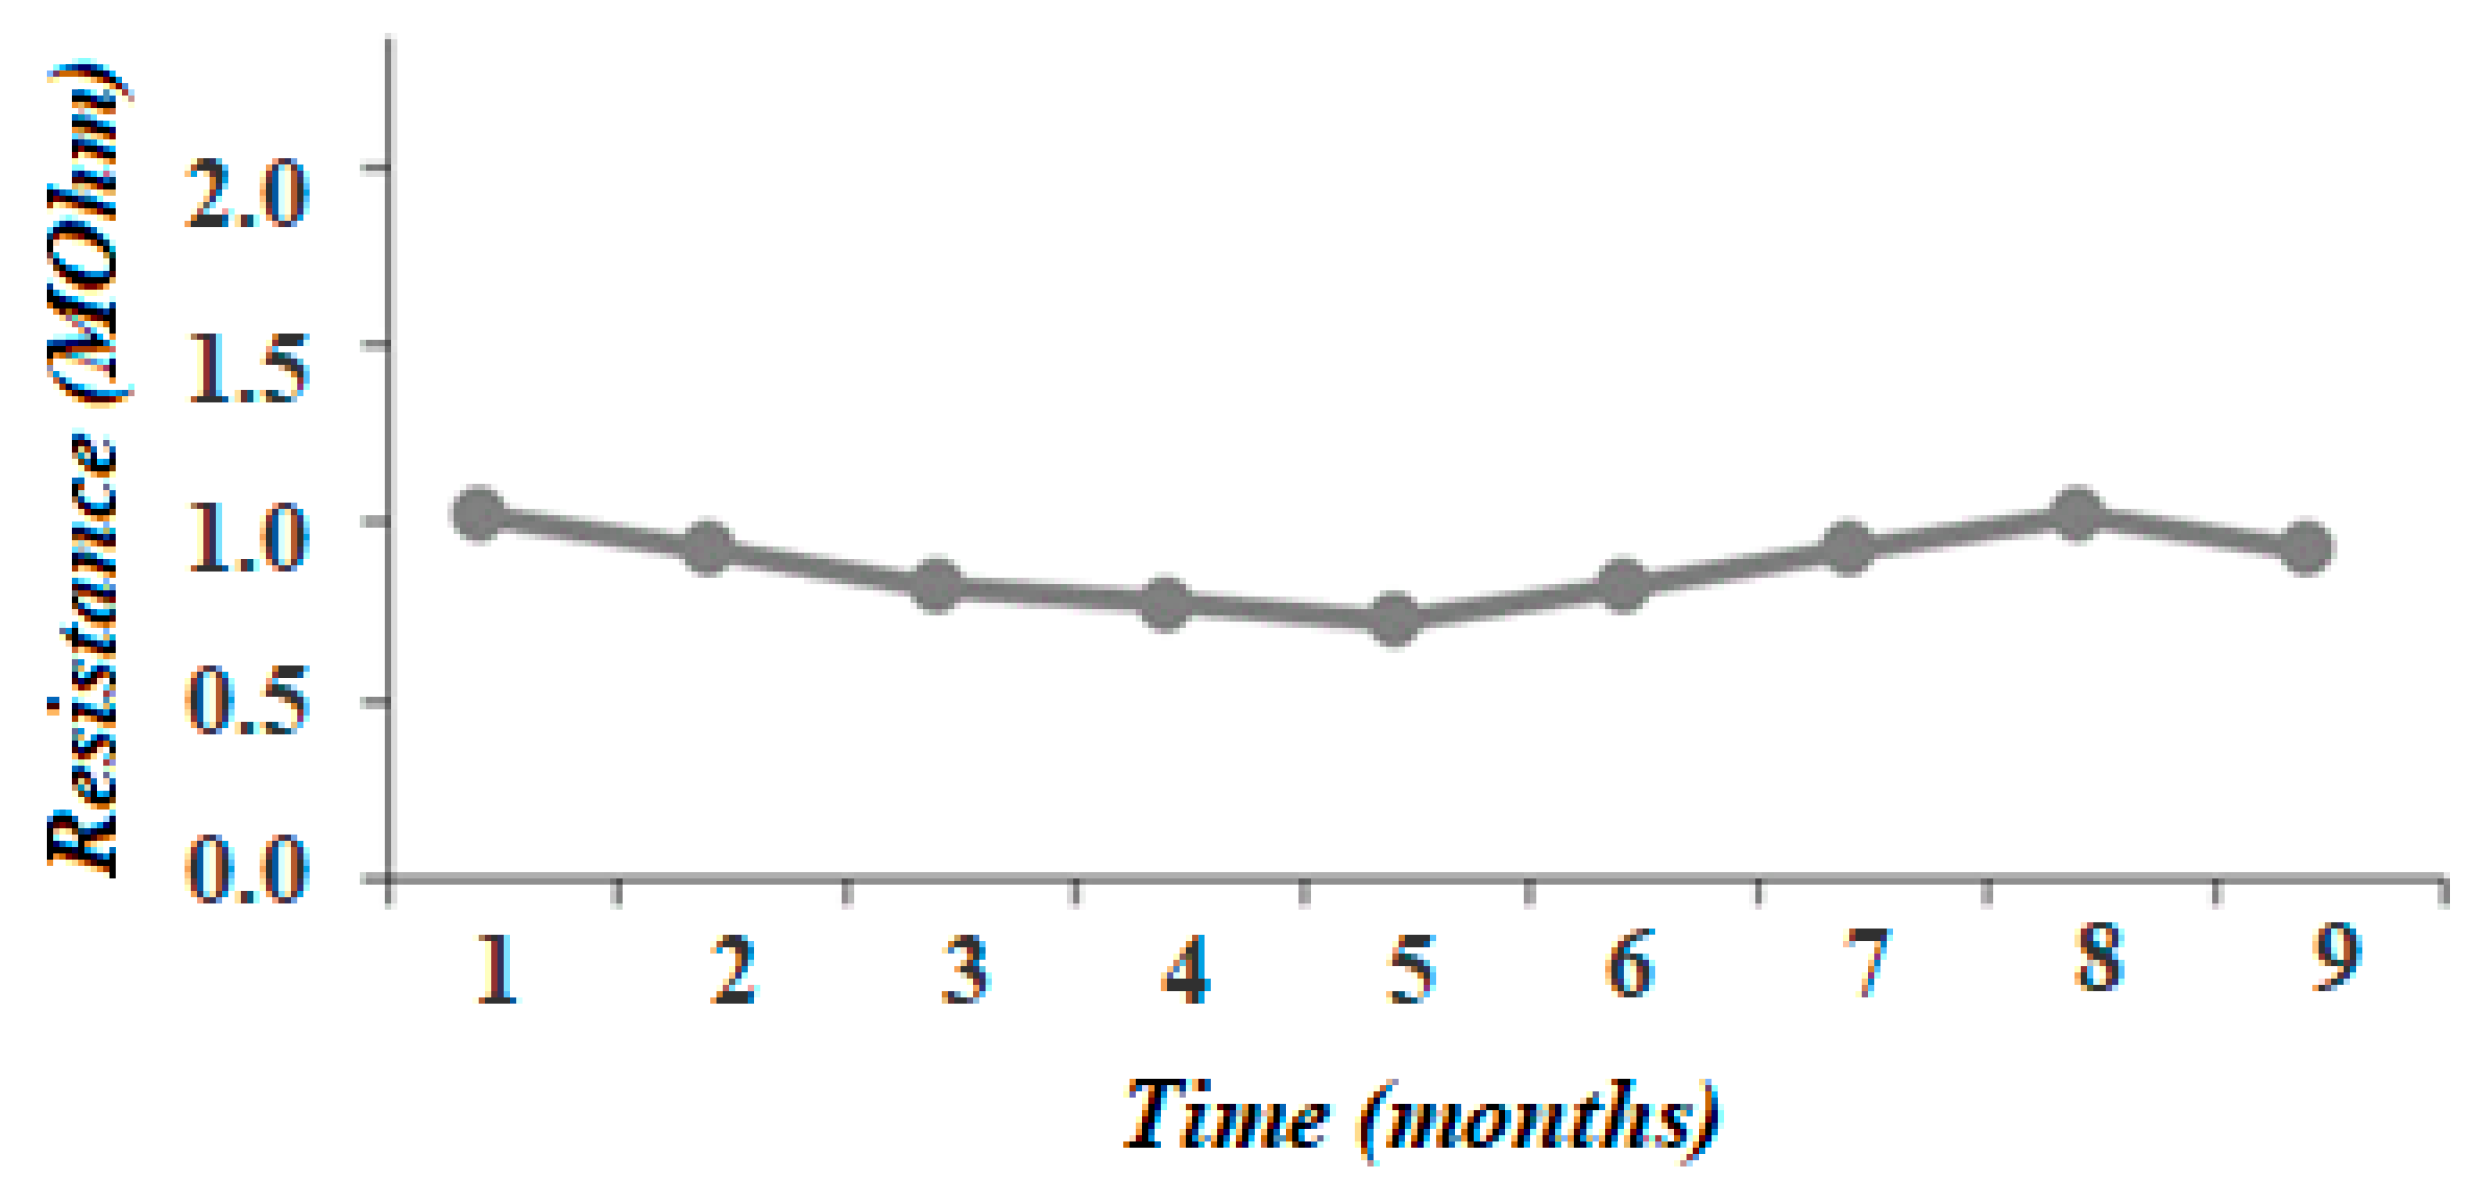
3.5. Stability Tests

It is known that one of the main reasons for parameter instability of gas sensors based on metal–oxide semiconductors is their high sensitivity to changes in ambient humidity. So, the effect of air humidity in the range of 40–90% on sensor response was investigated (Figure 12). The influence of air humidity on the sensor resistance was negligible with a drift of about 3%. In fact, ionic-type metal–oxides such as pure zirconia are the most common patterns for humidity gas sensors, but the sensor is stable to humidity exposure even at room temperature. This may be due to the presence of the silica matrix in the composite film [40].
The stability of semiconductor materials for gas sensor fabrication is one of the problem characteristics. Sensor devices are continuously in contact with aggressive substances. The accelerated stability tests of the initial resistance were performed by periodically exposing the fabricated sensors to NO2 at the operating temperature for nine months (Figure 13). The stability tests showed high stability and reproducibility of the sensors. The initial resistance drift is about 2–5%.
The comparative study of the resistive zirconia-based sensors showed that their working temperature is in the range from room temperature to 400 °C (Table 2) and the list of target gases includes CO2, O2, NO2, O3, and NH3. The NO2 sensor operating at 60 °C was produced in our previous work [22] from zirconium sources such as Zr(ONO3)2 and was characterized with the mixture of tetragonal, monoclinic, and cubic ZrO2 phases. The Zr5Si3 phase was also observed. The average crystallite size was about 35 nm. We reported the sensitivity to a small concentration of NO2 gas (1 ppm).
SiO2ZrO2 sensors are promising candidates for low-temperature NO2 gas sensors. Variation in the zirconium source allows for the production of sensors with different structures, morphologies, and crystallite size.

4. Conclusions

The SiO2ZrO2 films were fabricated using the sol-gel technique on silicon substrates and characterized by SEM, EDAX and XRD techniques.
The synthesis technique used leads to the formation of a complex, multiphase system in SiO2ZrO2 films. So, a stable monoclinic ZrO2 with an impurity of tetragonal phases was observed. Also, the film surface can be characterized by the presence of ZrOCl2·6H2O or ZrCl(OH)/ZrCl(OH)2 grains due to the introduction of silicon, which prevents the complete decomposition of ZrOCl2·8H2O and the removal of chlorine. The described structure determines the gas sensitivity mechanism at low operating temperatures.
The electrophysical studies showed the semiconducting nature of the SiO2ZrO2 film. Effective band gap energy evaluated from the optical spectra reveals the value of 0.2–0.3 eV, which is lower than for ZrO2 and may be responsible for the fast sensor response towards NO2.
The SiO2ZrO2-based sensor showed promising gas-sensitive properties to NO2 gas with fast response times at a low operating temperature (25 °C) and high stability of the initial resistance during a long-term period. The designed sensor may be used for the detection of high NO2 concentrations as a result of accidents in industrial enterprises.

Author Contributions

T.S.M. contributed to the design of the experiments and the data analysis. T.N.M. contributed data interpretation and wrote the manuscript. G.E.Y. and N.K.P provided a contribution to the discussion. All authors contributed to analyses of the results in the manuscript.

Funding

This work is financially supported by the Ministry of Education of Russia, under Contract No. 14.575.21.0126 (unique identifier of the contract is RFMEFI57517X0126).

Acknowledgments

Authors acknowledge the Center for collective use of "Microsystem Technology and Integrated Sensorics" (Southern Federal University (Russia)), on the basis of which the experiments were performed for work.

Conflicts of Interest

The authors declare no conflict of interest. The funders had no role in the design of the study in the collection, analyses, or interpretation of data; in the writing of the manuscript; or in the decision to publish the results.

References

  1. Mohsenin, V. Human exposure to oxides of nitrogen at ambient and supra-ambient concentrations. Toxicology 1994, 89, 301–312. [Google Scholar] [CrossRef]
  2. Mayorga, M.A. Overview of nitrogen dioxide effects on the lung with emphasis on military relevance. Toxicology 1994, 89, 175–192. [Google Scholar] [CrossRef] [Green Version]
  3. Baccile, N.; Babonneau, F.; Thomas, B.; Coradin, T. Introducing ecodesign in silica sol-gel materials. J. Mater. Chem. 2009, 19, 8537–8559. [Google Scholar] [CrossRef]
  4. Zhang, Y.; Pan, L.; Gao, C.; Zhao, Y. Synthesis of ZrO2–SiO2 mixed oxide by alcohol-aqueous heating method. J. Sol-Gel Sci. Technol. 2011, 58, 572–579. [Google Scholar] [CrossRef]
  5. Ponomareva, A.A.; Moshnikov, V.A.; Glöß, D.; Delan, A.; Kleiner, A.; Suchaneck, G. Metal-oxide-based nanocomposites comprising advanced gas sensing properties. J. Phys. Conf. Ser. 2012, 345, 012029. [Google Scholar] [CrossRef] [Green Version]
  6. Liu, Y.; Ping, Y.; Li, J.; Matras-Postolek, K.; Yue, Y.; Huang, B. Formation of SiO2-SnO2 Core-Shell Nanofibers and Their Gas Sensing Properties. RSC Adv. 2016, 6, 13371–13376. [Google Scholar] [CrossRef]
  7. Hirvonen, A.; Nowak, R.; Yamamoto, Y.; Sekino, T.; Niihara, K. Fabrication, structure, mechanical and thermal properties of zirconia-based ceramic nanocomposites. J. Eur. Ceram. Soc. 2006, 26, 1497–1505. [Google Scholar] [CrossRef]
  8. Ray, J.C.; Park, D.W.; Ahn, W.S. Chemical synthesis of stabilized nanocrystalline zirconia powders. J. Ind. Eng. Chem. 2006, 12, 142–148. [Google Scholar]
  9. Mokrushin, A.S.; Simonenko, E.P.; Simonenko, N.P.; Bukunov, K.A.; Sevastyanov, V.G.; Kuznetsov, N.T. Gas-sensing properties of nanostructured CeO2-xZrO2 thin films obtained by the sol-gel method. J. Alloys Compd. 2018, 773, 1023–1032. [Google Scholar] [CrossRef]
  10. Simonenko, E.P.; Mokrushin, A.S.; Popov, V.S.; Vasiliev, A.A.; Sevastyanov, V.G.; Kuznetsov, N.T. Thin films of the composition 8% Y2O3–92% ZrO2 (8YSZ) as gas-sensing materials for oxygen detection. Russ. J. Inorg. Chem. 2017, 62, 695–701. [Google Scholar] [CrossRef]
  11. Gao, X.J.; Fierro, L.G.; Wachs, I.E. Structural Characteristics and Catalytic Properties of Highly Dispersed ZrO2/SiO2 and V2O5/ZrO2/SiO2 Catalysts. Langmuir 1999, 15, 3169–3178. [Google Scholar] [CrossRef]
  12. Damyanova, S.; Grange, P.; Delmon, B. Surface Characterization of Zirconia-Coated Alumina and Silica Carriers. J. Catal. 1997, 168, 421–443. [Google Scholar] [CrossRef]
  13. Takada, T. Ozon detection by In2O3 thin films gas sensor. Chem. Sens. Technol. 1989, 2, 59–70. [Google Scholar]
  14. Traversa, E.; Sadaoka, Y.; Carotta, M.C.; Martinelli, G. Environmental monitoring field tests using screen-printed thick-film sensors based on semiconducting oxides. Sens. Actuators B Chem. 2000, 65, 181–185. [Google Scholar] [CrossRef]
  15. Schutze, A.; Pieper, N.; Zacheja, J. Quantitative ozone measurement using a phthalocyanine thin-film sensor and dynamic signal evaluation. Sens. Actuators B Chem. 1995, 23, 215–217. [Google Scholar] [CrossRef]
  16. Spirig, J.V.; Ramamoorthy, R.; Akbar, S.A.; Dutta, P.K. High temperature Zirconia Oxygen sensor with sealed metal/metal oxide internal reference. Sens. Actuators B Chem. 2007, 124, 192–201. [Google Scholar] [CrossRef]
  17. Zhuiykov, S. Electrochemistry of Zirconia Gas Sensors; CRC Press: Boca Raton, FL, USA, 2007. [Google Scholar]
  18. Myasoedova, T.N.; Yalovega, G.E.; Petrov, V.V.; Zabluda, O.V.; Shmatko, V.A.; Funik, A.O. Properties of SiO2CuOx Films for Nitrogen Dioxide Detection. Adv. Mater. Res. 2014, 834–836, 112–116. [Google Scholar]
  19. Wang, H.C.; Li, Y.; Yang, M.J. Fast response thin film SnO2 gas sensors operating at room temperature. Sens. Actuators B Chem. 2006, 119, 380–383. [Google Scholar] [CrossRef]
  20. Wei, B.Y.; Hsu, M.C.; Su, P.G.; Lin, H.M.; Wu, R.J.; Lai, H.J. A novel SnO2 gas sensor doped with carbon nanotubes operating at room temperature. Sens. Actuators B Chem. 2004, 101, 81–89. [Google Scholar] [CrossRef]
  21. Baratto, C.; Comini, E.; Faglia, G.; Sberveglieri, G.; Zha, M.; Zappettini, A. Metal oxide nanocrystals for gas sensing. Sens. Actuators B Chem. 2005, 109, 2–6. [Google Scholar] [CrossRef]
  22. Myasoedova, T.N.; Petrov, V.V.; Plugotarenko, N.K.; Sergeenko, D.V.; Yalovega, G.; Brzhezinskaya, M.M.; Shishlyanikova, E.N. SiO2ZrO2 Thin Films as Low Temperature NO2 and O3 Sensors. Adv. Mater. Res. 2015, 1088, 81–85. [Google Scholar] [CrossRef]
  23. Kaviyarasu, K.; Kotsedi, L.; Simo, A.; Fuku, X.; Mola, G.T.; Kennedy, J.; Maaza, M. Photocatalytic activity of ZrO2 doped lead dioxide nanocomposites: Investigation of structural and optical microscopy of RhB organic dye. Appl. Surf. Sci. 2017, 421, 234–239. [Google Scholar] [CrossRef]
  24. Rahulan, K.M.; Vinitha, G.; Devaraj, S.L.; Kanakam, C.C. Synthesis and optical limiting effects in ZrO2 and ZrO2-SiO2 core–shell nanostructures. Ceram. Int. 2013, 39, 5281–5286. [Google Scholar] [CrossRef]
  25. Petrov, V.V.; Nazarova, T.N.; Korolev, A.N.; Kopilova, N.F. Thin sol-gel SiO2-SnOx-AgOy films for low temperature ammonia gas sensor. Sens. Actuators B Chem. 2008, 133, 291–295. [Google Scholar] [CrossRef]
  26. Tanuma, T.; Okamoto, H.; Ohnishi, K.; Morikawa, S. Metal halide catalysts to synthesize dichloropentafluoropropanes by the reaction of dichlorofluoromethane with tetrafluoroethylene. Appl. Catal. A Gen. 2008, 348, 236–240. [Google Scholar] [CrossRef]
  27. Liao, W.-P.; Yang, R.; Kuo, W.-T.; Huang, J.-Y. The application of electrocoagulation for the conversion of MSWI flyash into nonhazardous materials. J. Environ. Manag. 2014, 137, 157–162. [Google Scholar]
  28. Yalovega, G.E.; Myasoedova, T.N.; Shmatko, V.A.; Brzhezinskaya, M.M.; Popov, Y.V. Influence of Cu/Sn mixture on the shape and structure of crystallites in copper-containing films: Morphological and X-ray spectroscopy studies. Appl. Surf. Sci. 2016, 372, 93–99. [Google Scholar] [CrossRef]
  29. Garadkar, K.M.; Shirke, B.S.; Pati, Y.B.; Patil, D.R. Nanostructured ZrO2 Thick film resistors operable at room temperature. Sens. Tranducers 2009, 110, 17–25. [Google Scholar]
  30. Nakanishi, K. Utilizing a phase separation mechanism as a pore forming principle. J. Porous Mater. 1997, 4, 67–112. [Google Scholar] [CrossRef]
  31. Barsan, N.; Simion, C.; Heine, T.; Pokhrel, S.; Weimar, U. Modeling of sensing and transduction for p-type semiconducting metal oxide based gas sensors. J. Electroceram. 2010, 25, 11–19. [Google Scholar] [CrossRef]
  32. Kim, H.-J.; Lee, J.-H. Highly sensitive and selective gas sensors using p-type oxide semiconductors: Overview. Sens. Actuators B Chem. 2014, 192, 607–627. [Google Scholar] [CrossRef]
  33. Bochenkov, V.E.; Sergeev, G.B. Preparation and chemiresistive properties of nanostructured materials. Adv. Colloid Interface Sci. 2005, 116, 245–254. [Google Scholar] [CrossRef] [PubMed]
  34. Dey, A. Semiconductor metal oxide gas sensors: A review. Mater. Sci. Eng. B 2018, 229, 206–217. [Google Scholar] [CrossRef]
  35. Gao, X.; Zhang, T. Facet-dependent metal oxide semiconductor gas sensors: An overview. Sens. Actuators B Chem. 2018, 277, 604–633. [Google Scholar] [CrossRef]
  36. Barsan, N.; Weimar, U. Conduction model of metal oxide gas sensors. J. Electroceram. 2001, 7, 143–167. [Google Scholar] [CrossRef]
  37. Zaera, F. Use of molecular beams for kinetic measurements of chemical reactions on solid surfaces. Surf. Sci. Rep. 2017, 72, 59–104. [Google Scholar] [CrossRef]
  38. International Center for Diffraction Data. PDF 83-0940; JCPDS Database; International Center for Diffraction Data: Newtown Square, PA, USA, 2003. [Google Scholar]
  39. Borilo, L.P.; Spivakova, L.N. Synthesis and Characterization of ZrO2 Thin Films. Am. J. Mater. Sci. 2012, 2, 119–124. [Google Scholar] [CrossRef]
  40. Borhade, A.V.; Tope, D.R.; Agashe, J.A. Synthesis, characterization and gas sensing performance of nanocrystalline ZrO2, 5%Y/ZrO2 and Ag–5%Y/ZrO2 catalyst. J. Mater. Sci. Mater. Electron. 2018, 29, 7551–7561. [Google Scholar] [CrossRef]
  41. Deshmukh, S.B.; Bari, R.H.; Patil, G.E.; Kajale, D.D.; Jain, G.H.; Patil, L.A. Preparation and characterization of zirconia based thick film resistor as a ammonia gas sensor. Int. J. Smart Sens. Intell. Syst. 2012, 5, 540–558. [Google Scholar] [CrossRef]
  42. Chen, C.-Y.; Chang, K.-H. Temperature independent resistive oxygen sensor prepared using zirconia-doped ceria powders. Sens. Actuators B Chem. 2012, 162, 68–75. [Google Scholar] [CrossRef]
Figure 1. Schematic diagram of the fabricated SiO2ZrO2-based sensor.
Chemosensors 06 00067 g001
Figure 2. Schematic diagram of the measurement setup. LED = light-emitting diode.
Chemosensors 06 00067 g002
Figure 3. Scanning electron microscopy (SEM) micrograph of the typical surface morphology (a); combined energy dispersive X-ray (EDX) and WDX spectra of crystallites (point 1), and EDX analysis of films surface (point 2) (b); the SiO2ZrO2 films thermally treated at 500 °C; SEM micrograph and EDX spectrum (insert) of the SiO2ZrO2 films thermally treated at 200 °C (c).
Chemosensors 06 00067 g003
Figure 4. X-ray diffraction (XRD) patterns of the SiO2ZrO2 films thermally treated at 500 °C and 200 °C.
Chemosensors 06 00067 g004
Figure 5. Dependences of sensor response on NO2 concentration (for the samples thermally treated at 200 °C (1) and 500 °C (2); operating temperature of 25 °C).
Chemosensors 06 00067 g005
Figure 6. Dependences of response (a) and recovery (b) time on the concentration of NO2.
Chemosensors 06 00067 g006
Figure 7. Selectivity of the sensor.
Chemosensors 06 00067 g007
Figure 8. Sensor response to 1060 ppm of NO2 as a function of operating temperature.
Chemosensors 06 00067 g008
Figure 9. The plot of (ahw)2 versus photon energy of the film thermally treated at 500 °C.
Chemosensors 06 00067 g009
Figure 10. Dependence of the sensor resistance on operating temperature (for the sample thermally treated at 500 °C).
Chemosensors 06 00067 g010
Figure 11. Current voltage characteristics of the SiO2ZrO2 film thermally treated at 500 °C.
Chemosensors 06 00067 g011
Figure 12. Dependence of sensor resistance on air humidity for the sample thermally treated at 500 °C (operating temperature = 25 °C).
Chemosensors 06 00067 g012
Figure 13. Dependence of the surface resistance of thin film sensors on time.
Chemosensors 06 00067 g013
Table 1. The relative content of elements in both points of SiO2ZrO2 films. Units = wt.%.
OSiClZrTotal
141.6710.700.8746.76100.00
247.6747.13 5.19100.00
Table 2. Comparative characteristics of resistive zirconia-based gas sensors.
MaterialProduction TechniqueTarget GasOperating TemperatureConcentration RangeSource
ZrO2
5%Y/ZrO2
Ag–5%Y/ZrO2
Hydrothermal synthesisCO2300–400 °C600–1000 ppm[40]
CeO2-xZrO2Sol-gelO2400 °C0.4–20%[9]
ZrO2Commercial ZrO2 powder with an organic binder (thick film resistor)NH3250–350 °C100 ppm[41]
Zirconia-doped ceriaThick film from the ceria–zirconia solid solution powderO2 10−5–1 atm[42]
ZrO2Sol-gel assisted by microwaveH2Room temperature50 ppm[29]
SiO2ZrO2Sol-gelNO2
O3
60 °C
30 °C
1 ppm
0.02 ppm
[22]

