Article

Long- and Short-Range Ordered Gold Nanoholes as Large-Area Optical Transducers in Sensing Applications

1
Institute for Microelectronics and Microsystems IMM-CNR, Campus Ecotekne, 73100 Lecce, Italy
2
Deparmento of Mathematics and Physics “Ennio De Giorgi”, University of Salento, via Arnesano, 73100 Lecce, Italy
*
Authors to whom correspondence should be addressed.
Chemosensors 2019, 7(1), 13; https://doi.org/10.3390/chemosensors7010013
Submission received: 14 February 2019 / Revised: 9 March 2019 / Accepted: 12 March 2019 / Published: 15 March 2019
(This article belongs to the Special Issue Hierarchical Nanostructures for Gas Sensors)

Abstract

:
Unconventional lithography (such as nanosphere lithography (NSL) and colloidal lithography (CL)) is an attractive alternative to sequential and very expensive conventional lithography for the low-cost fabrication of large-area nano-optical devices. Among these, nanohole (NH) arrays are widely studied in nanoplasmonics as transducers for sensing applications. In this work, both NSL and CL are implemented to fabricate two-dimensional distributions of gold NHs. In the case of NSL, highly ordered arrays of gold NHs distributed in a hexagonal lattice onto glass substrates were fabricated by a simple and reproducible approach based on the self-assembling of close-packed 500 nm diameter polystyrene particles at an air/water interface. After the transfer onto a solid substrate, the colloidal masks were processed to reduce the colloidal size in a controllable way. In parallel, CL was implemented with short-range ordered gold NH arrays onto glass substrates that were fabricated by electrostatically-driven self-assembly of negatively charged colloids onto a polydiallyldimethylammonium (PDDA) monolayer. These distributions were optimized as a function of the colloidal adsorption time. For both approaches, controllable and reproducible procedures are presented and discussed. The optical responses of the NH structures are related to the short-range ordering level, and their good performances as refractive index transducers are demonstrated.

1. Introduction

The recent widespread interest in nanomaterials has favored the development of nanofabrication techniques for fine control of their size-, shape-, and relative spacing-dependent properties. The top-down techniques routinely used to fabricate nanostructures with high degrees of repeatability and purity, periodic arrangements, and a few nanometer-sized features include electron beam lithography (EBL) [1], focused-ion beam lithography (FIB) [2,3], scanning tunneling microscopy [4], and atomic force microscopy [5]. These techniques are poorly cost effective, time-consuming, use very specialized equipment, require multiple processing steps, are unsuitable for large-area (larger than a few μm2) patterning, and are poorly massively parallel approaches. As a low-cost, simple, large-area and general in regard to materials and substrates alternative to these inherently serial processes nanosphere lithography (NSL) [6,7] and colloidal lithography (CL) [8,9] are receiving a considerable amount of interest in laboratories around the world. These approaches use self-assembly processes of polymer (silica, latex, or polystyrene) colloids at a liquid–liquid or liquid–solid interface, and they start with a suspension of commercial monodispersed colloids with sizes ranging from 30 nm to 250 µm in spherical diameter [10,11].
NSL is attracting a growing interest because of its compatibility with wafer-scale processes as well as its potential to manufacture a wide variety of nanostructured materials. It enables parallel surface patterning of large areas, hence, allowing the creation of complex nanostructured systems with variable shapes and distributions. Combining the major advantages of both top-down and bottom-up approaches, NSL enables the fabrication of nanostructured materials on a desired substrate. This is achieved by depositing metals through the small apertures of a low-cost lithographic mask composed of a compact array of polystyrene nanospheres. Under appropriate conditions, these nanospheres can self-assemble into a close packed array (CPA), which is a two-dimensional, crystal-like structure characterized by hexagonal geometry [12,13].
For applications demanding a homogeneous distribution of metal nanostructures on a very large area, CL is a valid alternative. Its working principle is the electrostatically-driven adsorption of likely-charged polymeric colloids onto a collector surface. The collector surface is preliminarily countercharged by depositing a polyelectrolyte multilayer. Adsorption and arrangement of the colloidal mask results from the interplay between several interactions, mainly colloid–substrate attraction, colloid–colloid repulsion, in-plane Brownian diffusion, and capillary lateral attractive forces present during drying [14,15,16].
The main difference between the colloidal arrangements resulting from NSL and CL is the degree of ordering, that is, long- and short-range ordering in the former and latter case, respectively. From an application standpoint, the colloidal distributions that are self-assembled by capillary and/or electrostatic interactions are used as evaporation and/or etching masks, and they are easily removed by tape stripping. Indeed, planar distributions of plasmonic nanostructures with tailored optical functionalities can be realized by depositing metals through the small apertures of the CPA. In particular, the as-deposited array of nanospheres can be exploited for the fabrication of highly ordered arrays of gold nanoprisms distributed in a hexagonal lattice [6,17,18,19,20,21]. However, several approaches have been recently developed to extend the possibilities offered by NSL for the realization of metal nanoantennas characterized by different geometrical properties [22]. The variety of shapes is especially important for plasmonics, in both fundamental studies and applications, because of the shape-dependence of localized surface plasmon resonances. The CPA of polystyrene (PS) particles deposited onto solid substrates can be modified in a post-treatment etching process, in which the diameter of the spheres can be reduced in a controllable way to a desired size. This process induces the formation of non-close packed arrays of nanospheres [23], which can be exploited for the fabrication of long-range ordered nanohole (NH) arrays into Au thin films [24].
Turning to CL, distributions of short-range ordered metal nanoantennas can be fabricated by etching the thin evaporated film, previously masked by an array of colloidal nanoparticles, followed by removal of the colloidal mask by UV-ozone treatment. Hole mask lithography is a variant of the same technique [25,26,27]. Otherwise, easy removal of the short-range ordered colloids, capped by a thermally evaporated film by tape-stripping, results in a supported perforated film [28].
Advantages of both NSL and CL are their low cost, high reproducibility, large area deposition, and the possibility to tune spacings and sizes of the adsorbed colloids using plasma etching [29].
The top-down, unconventional lithographic techniques described above are particularly interesting for the fabrication of nanoplasmonics systems (i.e., metal nanoantennas and nanohole (NH) arrays) [29,30,31,32,33]. In particular, metallic NH arrays are being widely studied to get a basic understanding and optimization of their optical, as well as their applications in several fields (for instance, sub-wavelength photolithography [34,35], nonlinear optics (interferometric plasmonic lensing) [36,37], surface-enhanced Raman scattering (SERS) [38,39], surface-enhanced fluorescence spectroscopy [40,41,42], and especially as chemical sensors and biosensors [28,43,44,45,46,47]).
The interest in NH arrays dates to the discovery of the extraordinary optical transmission phenomenon [48,49]. This is the occurrence of transmission resonances and enhancements unpredicted by Bethe’s classical theory [50] in sub-wavelength holes periodically arranged in an optically thick metal film. All of this was first attributed to resonant excitation of Bloch-wave surface plasmon polaritons (SPPs), where incident wave-grating coupling satisfies momentum- and energy-matching conditions [51,52]. According to this interpretation, transmission maxima were associated with Block wave SPPs. However, a red-shift of transmission maxima was experimentally reported, which was theoretically predicted by lattice-coupling mechanisms [2,3,4,5,6,7,8,9,10,11,12,13,14,15,16,17,18,19,20,21,22,23,24,25,26,27,28,29,30,31,32,33,34,35,36,37,38,39,40,41,42,43,44,45,46,47,48,49,50,51,52,53,54] as well as the correlation between transmission minima and propagating SPPs (PSPR modes) and between transmission maxima and localized surface plasmon modes (LSPR) [55]. Presently, LSPRs are of particular interest because of their practical convenience in easily fabricating short-range ordered NH systems by CL. On the other hand, since most research has focused on long-range ordered (periodic) metal NH arrays over the last decades, the effects of short-range ordering on the optical response of NH arrangements and the analogies between periodic/long-range situations deserves further investigation.
In this work, both NSL and CL are implemented to fabricate two-dimensional distributions of metal NHs onto flat substrates. To detail, the ordered NH array prepared by NSL was obtained by a very simple and reproducible bottom-up approach based on the preparation of self-assembled monolayers of close-packed polystyrene particles 500 nm in size on a liquid surface. This method enables the creation of highly ordered, colloidal crystals at the air/water interface over macroscopic areas, in the range of several square centimeters. Careful control of several parameters involved in the fabrication process (e.g., deposition rate, composition of the colloidal solution, glass slide deposition angle, humidity, and temperature) allowed for the colloidal suspension to be deposited on the liquid surface, inducing the formation of a floating, self-assembled monolayer of polystyrene particles. The assembled monolayer, easily transferred onto a flat glass substrate and subsequently modified by a post-treatment etching process in which the diameter of the spheres could be reduced in a controllable way to a desired size, thus allowed the fabrication of highly ordered, hexagonal lattice arrays of NHs.
In parallel, the CL method was also implemented by the adsorption of negatively charged polystyrene nanospheres from a salt-free aqueous solution onto a polydiallyldimethylammonium (PDDA) polyelectrolyte monolayer, rather than the conventional polyelectrolyte multilayer. By means of this simplified CL protocol, and by tuning the adsorption time of colloids, we demonstrate good quality NH distributions with negligible agglomeration effects from lateral capillary forces. We focus our discussion on the colloidal diameter of 80 nm, based on the evidence that field enhancement of NH arrangements is more homogeneous and confined to the NH region when the NH diameter is lower than 100 nm [56]. Hence, we fabricated short-range ordered NH arrays with NH diameters of 80 nm in optically thin (i.e., 20 nm thick) gold films, and we characterized them in terms of NH ordering (distribution and NH-to-NH average distance).
For both nanofabrication techniques, the choice of proper experimental conditions for the mask assembly is crucial for the resulting long- and short-range ordered NH distributions. Here, such conditions are discussed and correlated with the optical properties of the NH array, namely, the excitation and spectral identification of propagating and localized surface plasmon modes. For instance, the obtained short-range ordered NH distribution obtained by CL is demonstrated to yield transmission resonances, which can be related to surface plasmon modes (either propagating or localized) as observed in the periodic counterpart distributions. For both approaches, controllable and reproducible procedures are presented and discussed. Functional characterization related to the detection of refractive index changes in a liquid environment is reported, thus, paving the way for future perspectives in the biosensing field.

2. Materials and Methods

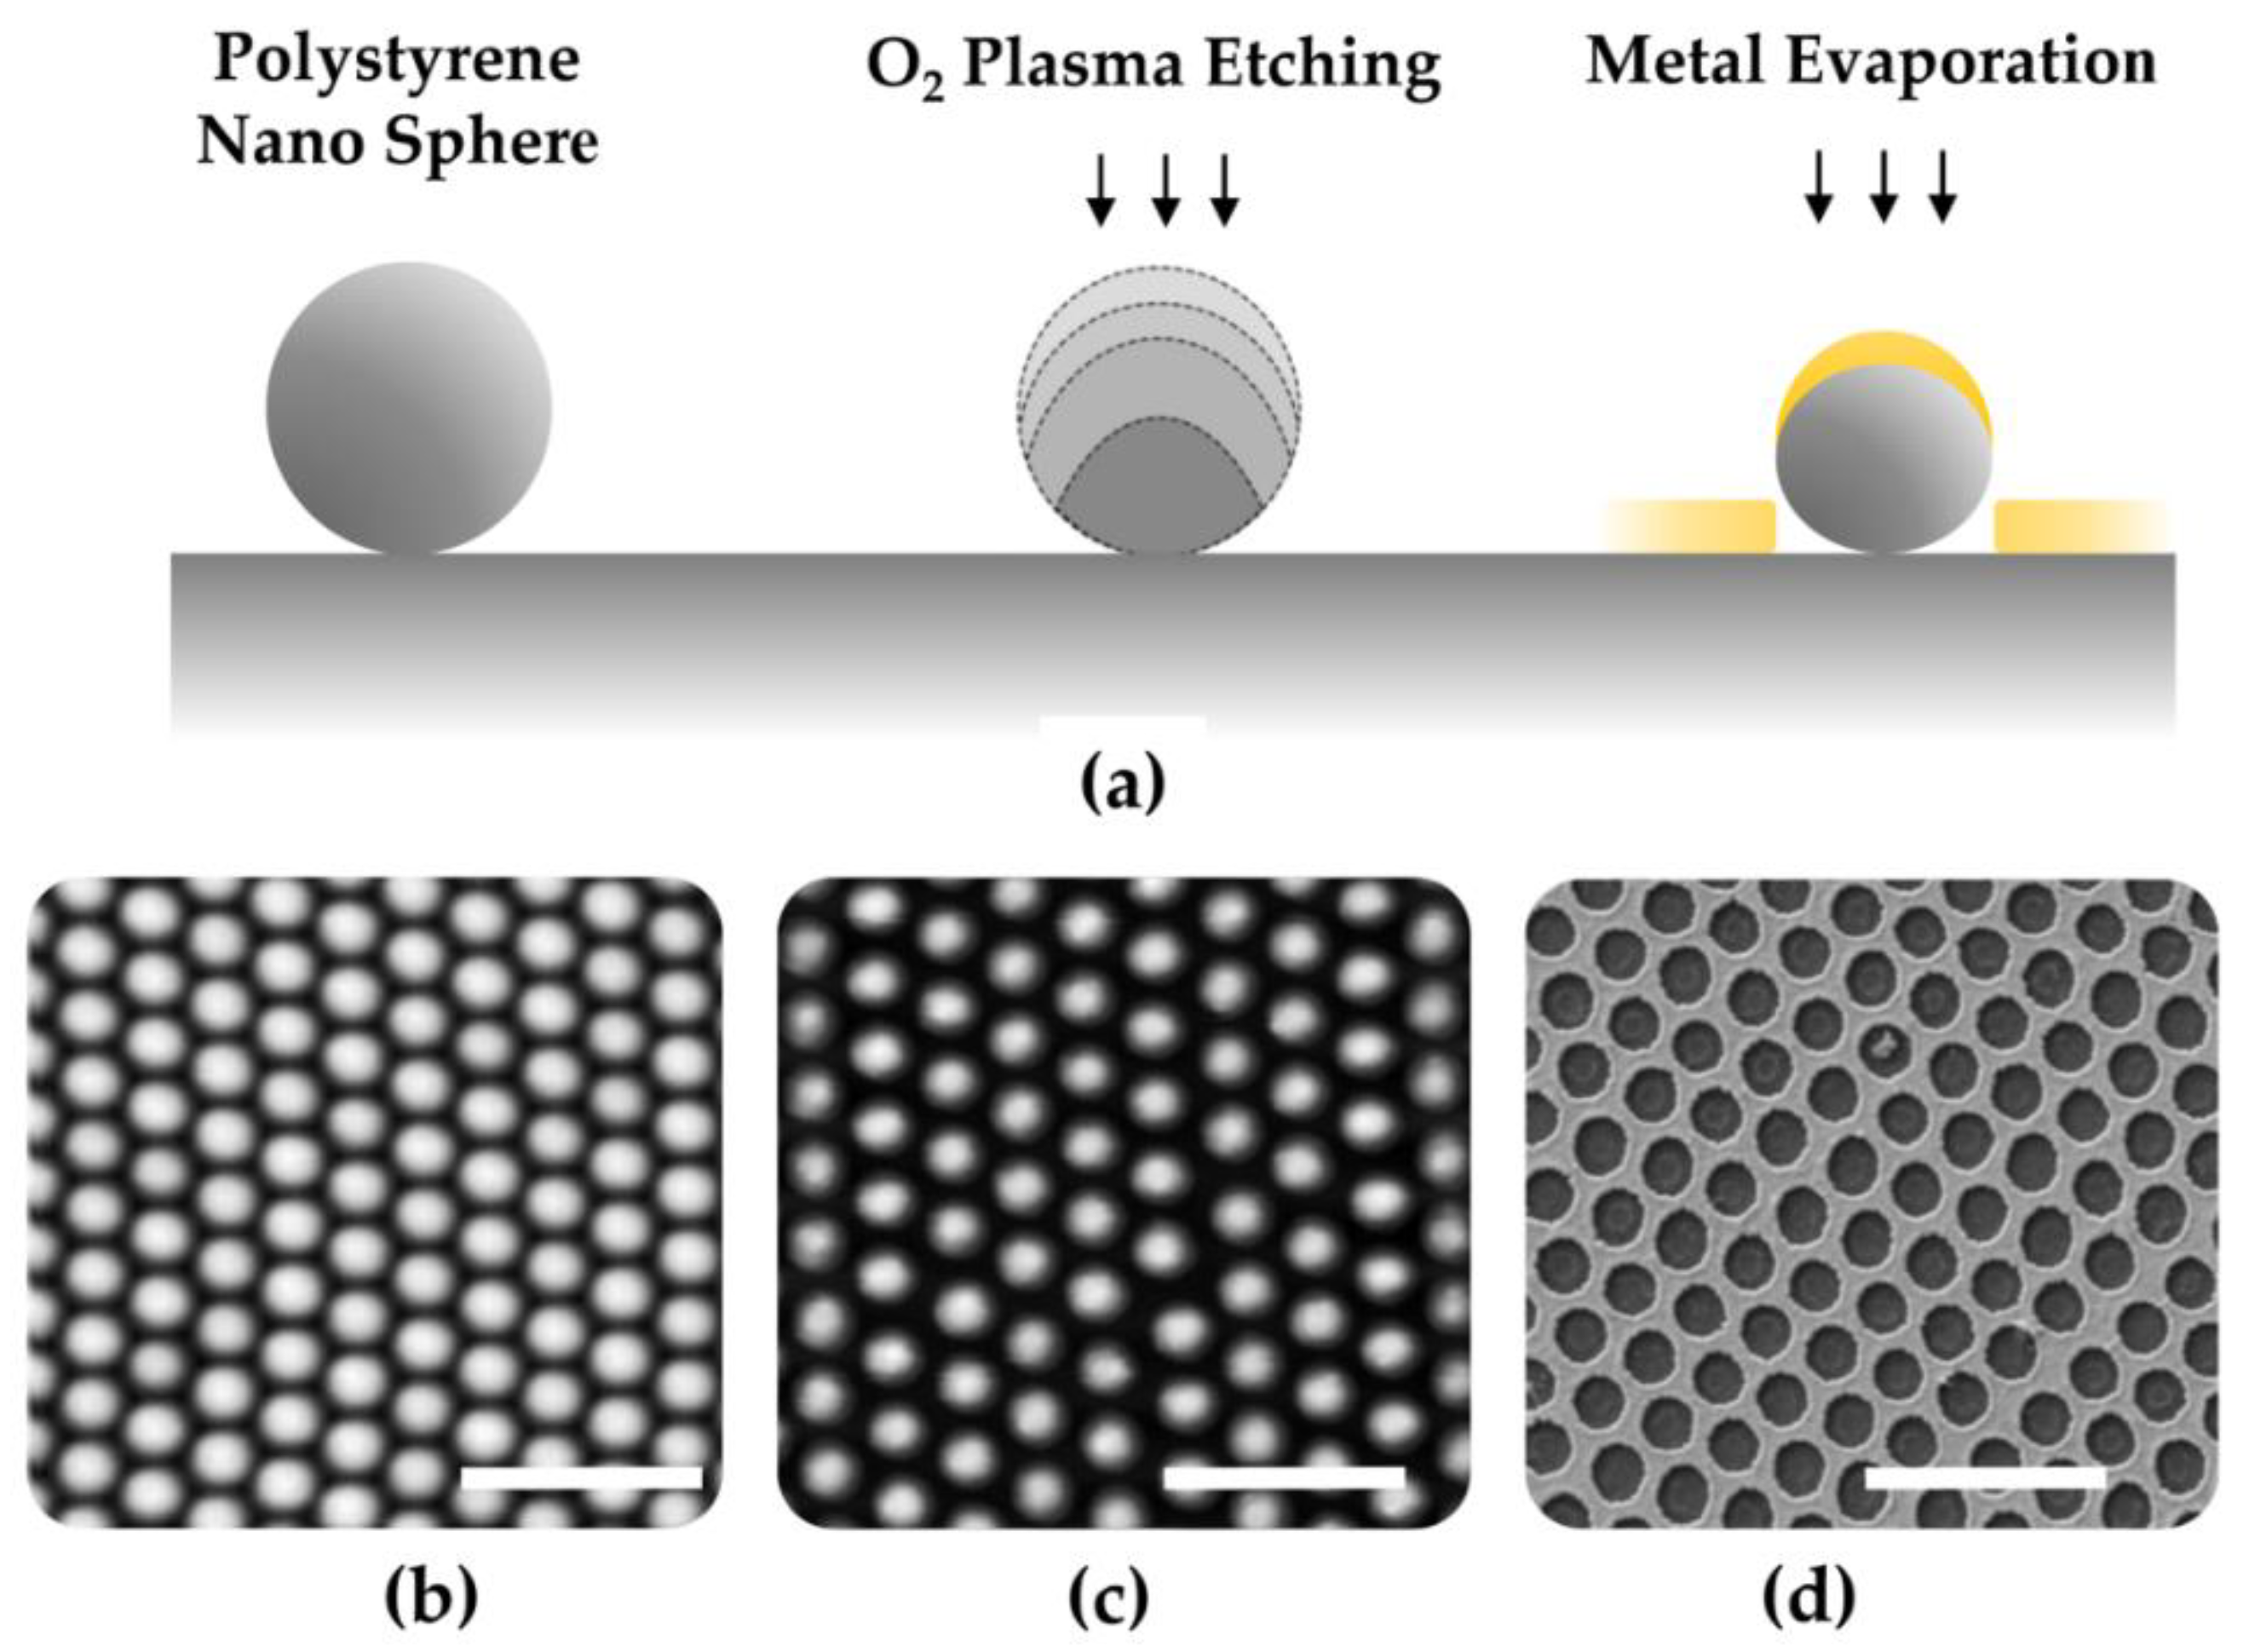
2.1. Long-Range Ordered Nanoholes: Fabrication Protocol by Nanosphere Lithography

The self-assembly of nanospheres at the air/water interface was carried out in a homemade apparatus, schematically reported in Figure 1a. The designed setup allowed for a slow dispense of the particle suspension, using a tilted glass slide partially immersed into the water. The colloidal mask fabrication was carried out in standard glass Petri dishes, with diameters between 5 and 10 cm, filled with deionized water. The tilt angle of the glass slide used to dispense particles at the air/water interface played a key role in the quality of the final monolayer. Therefore, in the assembled setup, a separate holder enabled precise control of the slide position. In our experiments, tilt angles in the range between 35° and 40° were chosen. Polystyrene particles with a nominal diameter of 500 nm were used in the experiments; the particles were purchased from Sigma-Aldrich in aqueous suspensions with a concentration of 10 wt%; the coefficient of variation (CV) was specified to be 2.4%, while the density of the PS particles was 1.05 g/cm3. In order to obtain a high-quality colloidal mask, an accurate control of the meniscus shape, where the lattice started forming, was required. To this purpose, the substrate must present a homogeneous hydrophilic surface, which can be achieved with the following procedure, compatible with a wide variety of surfaces (silicon, optical glass, and metal surfaces). After dicing, the substrates were pre-cleaned by five minutes of ultrasonication and rinsed with acetone, ethanol, and deionized water. Following this, a well-established hydrophilization process based on oxygen plasma treatment (Diener Atto, 1 mbar O2, 100 W, 5 min) was applied immediately before the deposition process. In order to trap the polystyrene nanosphere at the air/water interface, a mixture of alcohol and polystyrene water solution was employed. In this work, the polystyrene particle solution was diluted to a final concentration of 2.5 wt % in a 1:1 ratio with 2-butanol, which acted as a spreading agent on the water surface. A motorized syringe pump allowed a slow dispense of a controlled volume of colloidal solution onto the glass slide, with a deposition rate of 2 μL/min. After the close packed array formation at the air/water interface, the monolayer had to be transferred onto a solid support. In order to avoid monolayer damage, the transfer from the air/water interface to the substrate was realized by a two-step water removal, based on the use of a peristaltic pump and a self-vaporization step. After the transfer onto a solid substrate, a post-treatment process based on oxygen plasma etching could be applied in order to induce the polystyrene mask modification, as schematically reported in Figure 2. A commercially available plasma cleaning setup (Diener ATTO, Diener electronics) was used to investigate the etching process of polystyrene nanospheres on different kinds of solid substrates. Polystyrene spheres were etched using 100 W RF (i.e., radio-frequancy) power plasma at a pressure of 10 mTorr, and exposure times were increased (2–6 min). A constant oxygen flow of 5 sccm was maintained throughout the etching process. As an example, the obtained non-close packed monolayers were used as lithographic masks to fabricate a planar distribution of highly ordered gold nanoholes.

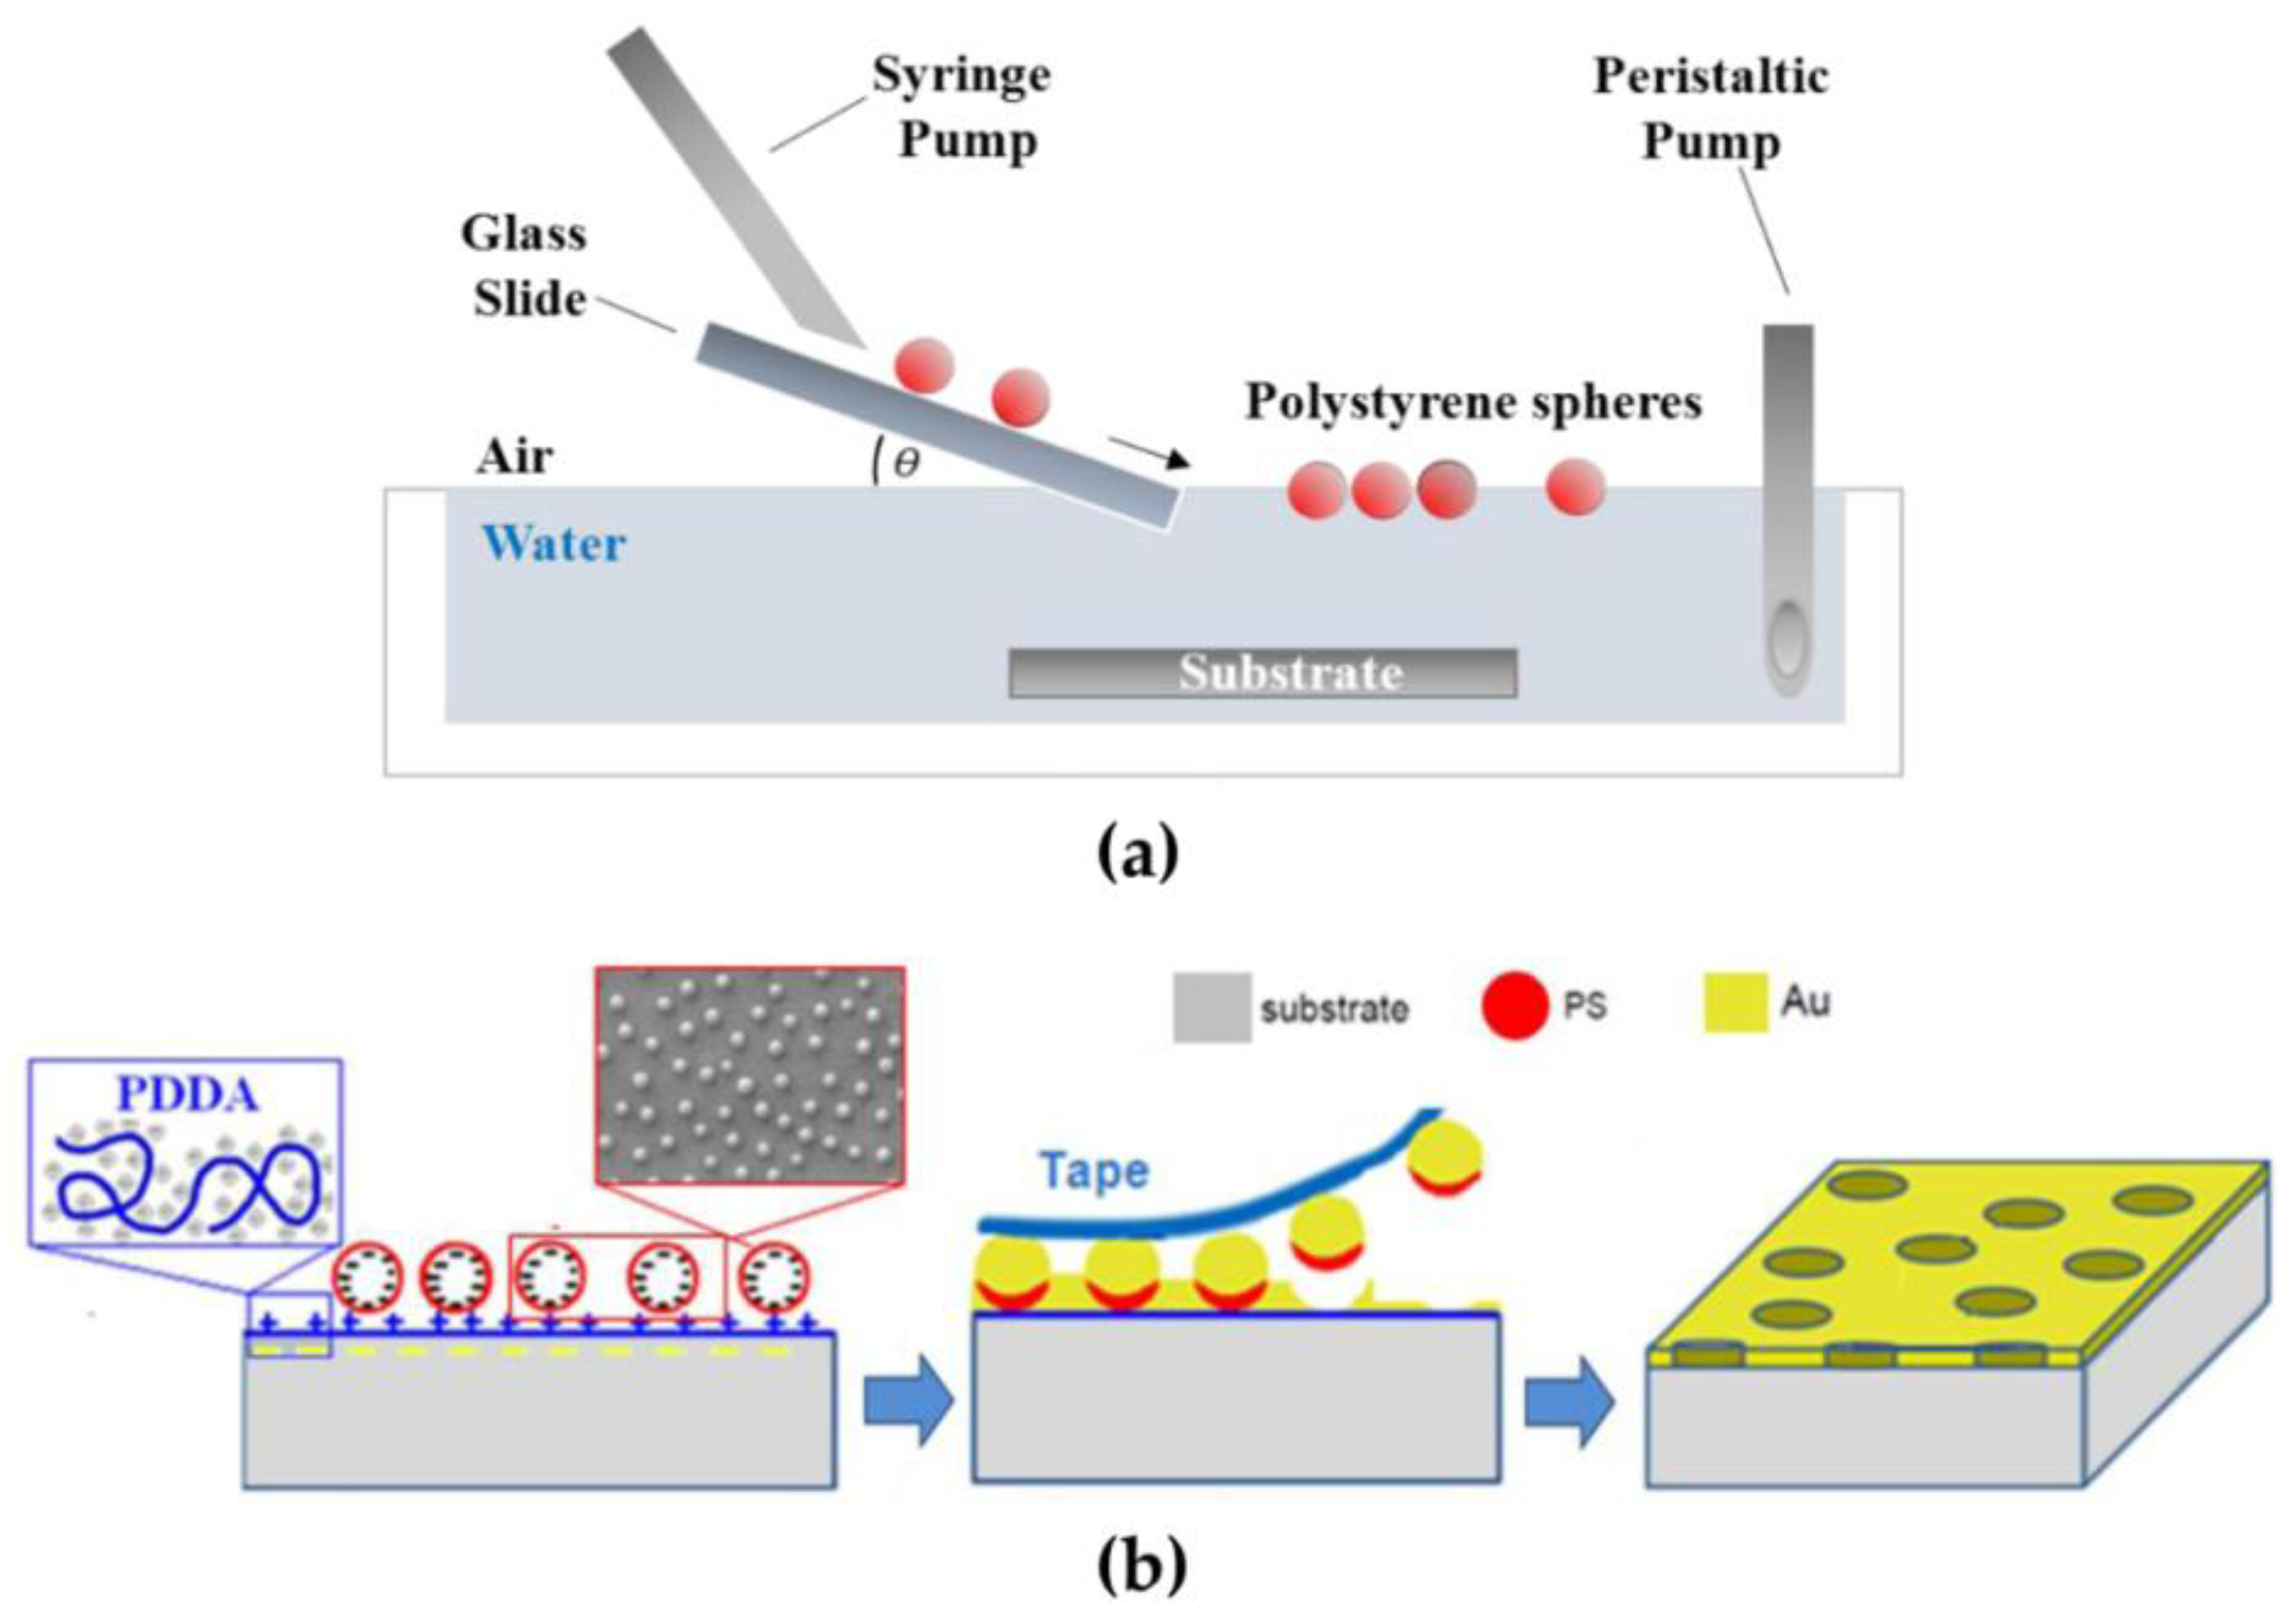
2.2. Short-Range Ordered Nanoholes: Fabrication Protocol by Colloidal Lithography

Microscope glass slides, carefully cleaned by successive sonication in acetone and isopropanol, were used to fabricate supported gold (Au) NH arrays based on the following experimental procedure. The glass substrates were treated under oxygen plasma (100 sccm, 100 Watt, 250 mTorr for 60 s) to create a negatively charged surface that acted as an electrostatic binder of the positively charged polydiallyldimethylammonium (PDDA) (MW 200,000–350,000, Sigma Aldrich, Saint Louis, MO, USA polyelectrolyte. A salt-free and low concentration (0.2% in Milli-Q water) solution of PDDA [55] was adsorbed onto the plasma-processed glass substrates for ΔtPDDA = 40 s [57,58,59]. Prior to blow-drying with an N2-stream, the obtained PDDA monolayers were carefully rinsed with Milli-Q water to remove any excess and weakly bounded PDDA chains. Subsequently, the PDDA monolayers were immersed in salt-free colloidal solutions containing negatively charged commercial sulfate stabilized polystyrene beads (Thermo Fisher, 0.1 in Mili-Q water) with a concentration of CPS = 0.1% (diameter of 80 nm). The adsorption time ΔtPS of the polystyrene beads was tuned from 25 s to 10 min, then, each sample was carefully rinsed with Milli-Q water, immersed for 1min in a water bath heated at 100 °C [9], and blow-dried with N2. The experimental procedure described above yielded distributions of polystyrene nanospheres self-assembled onto a PDDA monolayer (Figure 1b, left panel) that were used as colloidal masks for the fabrication of short-range ordered NHs. In detail, an optically thin (20 nm Au) film was thermally evaporated over the colloidal masks. Then, the removal of the Au-capped polystyrene nanospheres by tape stripping (Figure 1b, middle panel) yielded a glass-supported Au film perforated with short-range ordered NHs (Figure 1b, right panel).
Based on the deposition parameters, the distributions of Au-capped polystyrene nanospheres will be referred to as PSDPS (ΔtPDDA − ΔtPS), where PS stands for “polystyrene”, DPS is the colloidal diameter, ΔtPDDA and ΔtPS refer to the adsorption time of PDDA and polystyrene beads, respectively, and CPS = 0.1% is understood. Straightforwardly, the associated Au NH array (Figure 1b, right panel) will be termed NHDPS (ΔtPDDA − ΔtPS). Table 1 lists the fabricated samples, named by the above detailed nomenclature and the associated fabrication parameters.

2.3. Topography, Spectral, and Refractometric Sensing Characterizations

According to the experimental method described above, a colloidal mask and the associated NH system shared ordering and interparticle distances. Hence, topography analysis of the colloidal masks provided complete information on the distribution of the counterpart NH arrays. On this basis, scanning electron microscopy (SEM) and atomic force microscopy (AFM) analyses were performed on the fabricated samples.
The SEM setup consisted of a Zeiss NVISION 40 (Jena, Germany) dual-beam focused ion beam (FIB) system, equipped with a high-resolution SEM Gemini column and an Oxford 350 x-act Energy Dispersive X-ray Spectrometer (EDS) (Oxford Instruments, Wiesbaden, Germany). Statistical analysis of the SEM images provided information on interparticle average distance and fractional coverage. The shown SEM micrographs were representative of the distribution features, as a result of SEM inspection of several areas of each sample.
The topography analyses of the NH distributions were performed by atomic force microscopy (AFM NT-MDT Spectralight, Moscow, Russia), and the topographic height signal images in semicontact mode were obtained.
Spectral characterization of the NH structures was performed based on (i) zero-order transmission and integration of sphere-based diffuse reflectance (R) spectra, recorded by a Cary 500 UV-VIS-NIR Spectrometer (Varian, Palo Alto, CA, USA) in air at normal illumination of the sample by a white light source, and (ii) angle-dependent transmittance measured in air for incidence angles varying from zero (normal incidence) to 50° by the same spectrophotometer integrated with a manually driven rotating stage. The presented zero-order transmittance was acquired over the 400–1000 nm spectral range and normalized to the transmission of a bare glass substrate. All spectra were acquired with a spectral resolution Δλ = 1 nm.
The functional characterization of the transducer for sensing applications was performed in a liquid environment with a compact optical fiber system equipped with a deuterium halogen light source, a portable spectrometer (Thorlabs CCS100/M, Munich, Germany, wavelength ranging between 350–700 nm), and optical fibers in a transmission configuration. White light (450–700 nm) emerging from the first optical fiber immersed into the liquid environment had a perpendicular incidence on the sample. The transmitted signal was coupled into a detection fiber and analyzed by a compact UV-vis spectrometer. The sample of interest was immersed in liquid environments with a refractive index (RI) that was increased from 1.33 (water) to 1.40 (50% v/v mixtures of glycerol and water). Under these conditions the spectral shift of the wavelength position of the transmission features was detected and used to evaluate the bulk sensitivity Sb = Δλ/ΔRI.

3. Results

3.1. Distribution Characterization

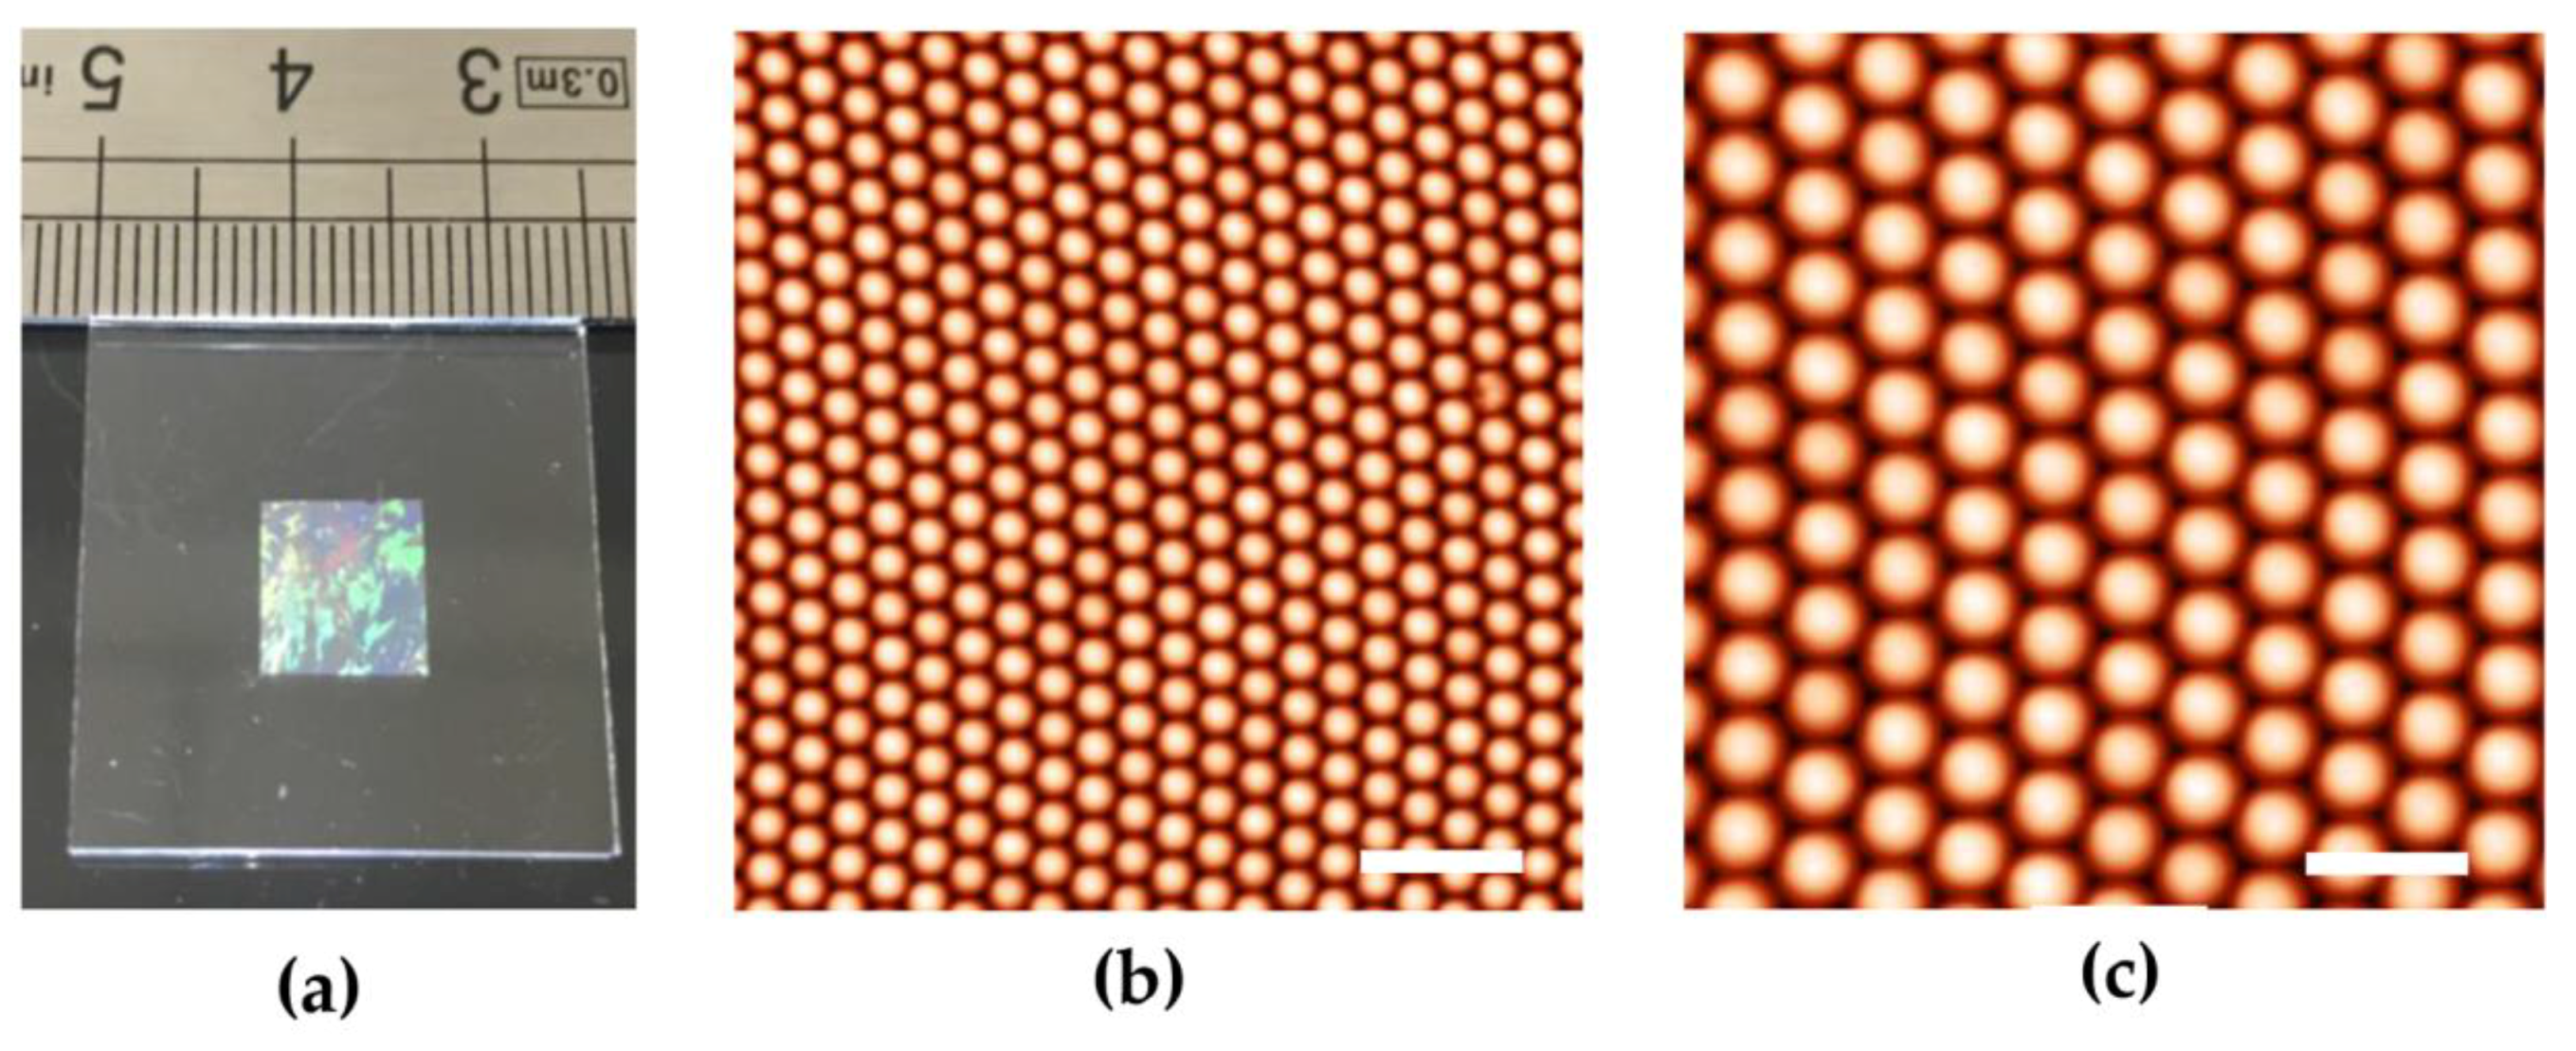
3.1.1. Long-Range Ordered Distributions

Figure 3a shows a photograph of the CPA self-assembled monolayer after the transfer onto a glass substrate. The formation of a crystal-like structure by the appearance of iridescent colors under white light illumination was demonstrated. Figure 3b displays the typical AFM images of the assembled monolayer of polystyrene particles, with a diameter of 500 nm. As can be observed, the developed deposition technique enabled the realization of a uniform monolayer of polystyrene nanospheres arranged with a long-range order and few lattice defects. In addition, the higher resolution images reported in Figure 3c clearly displayed the formation of close-packed hexagonal ordered arrangements of polystyrene nanospheres. Non-close packed arrays of polystyrene nanospheres were obtained by applying the oxygen plasma etching process, detailed in the experimental section, for increasing exposure times. As sketched in Figure 2a, polystyrene particles with starting diameters of 500 nm were etched at a constant power setting for 2 min, removed from the plasma reactor, and analyzed by AFM microscopy. As can be noticed in the AFM image reported in Figure 2c, a non-close packed array of polystyrene particles with average diameters of 350 nm and a constant period of 500 nm were obtained following the previously described etching procedure. By exploiting the geometry of this low-cost lithographic mask, highly ordered array of gold nanoholes distributed in a hexagonal lattice on a very large area has been fabricated. A two-step metal evaporation process was adopted, with 2 nm of Ti followed by a thin Au layer and a nominal thickness of 50 nm. After the colloidal-mask removal, an array of gold NHs characterized by a circular shape was revealed on the substrate, as noted in Figure 2d.

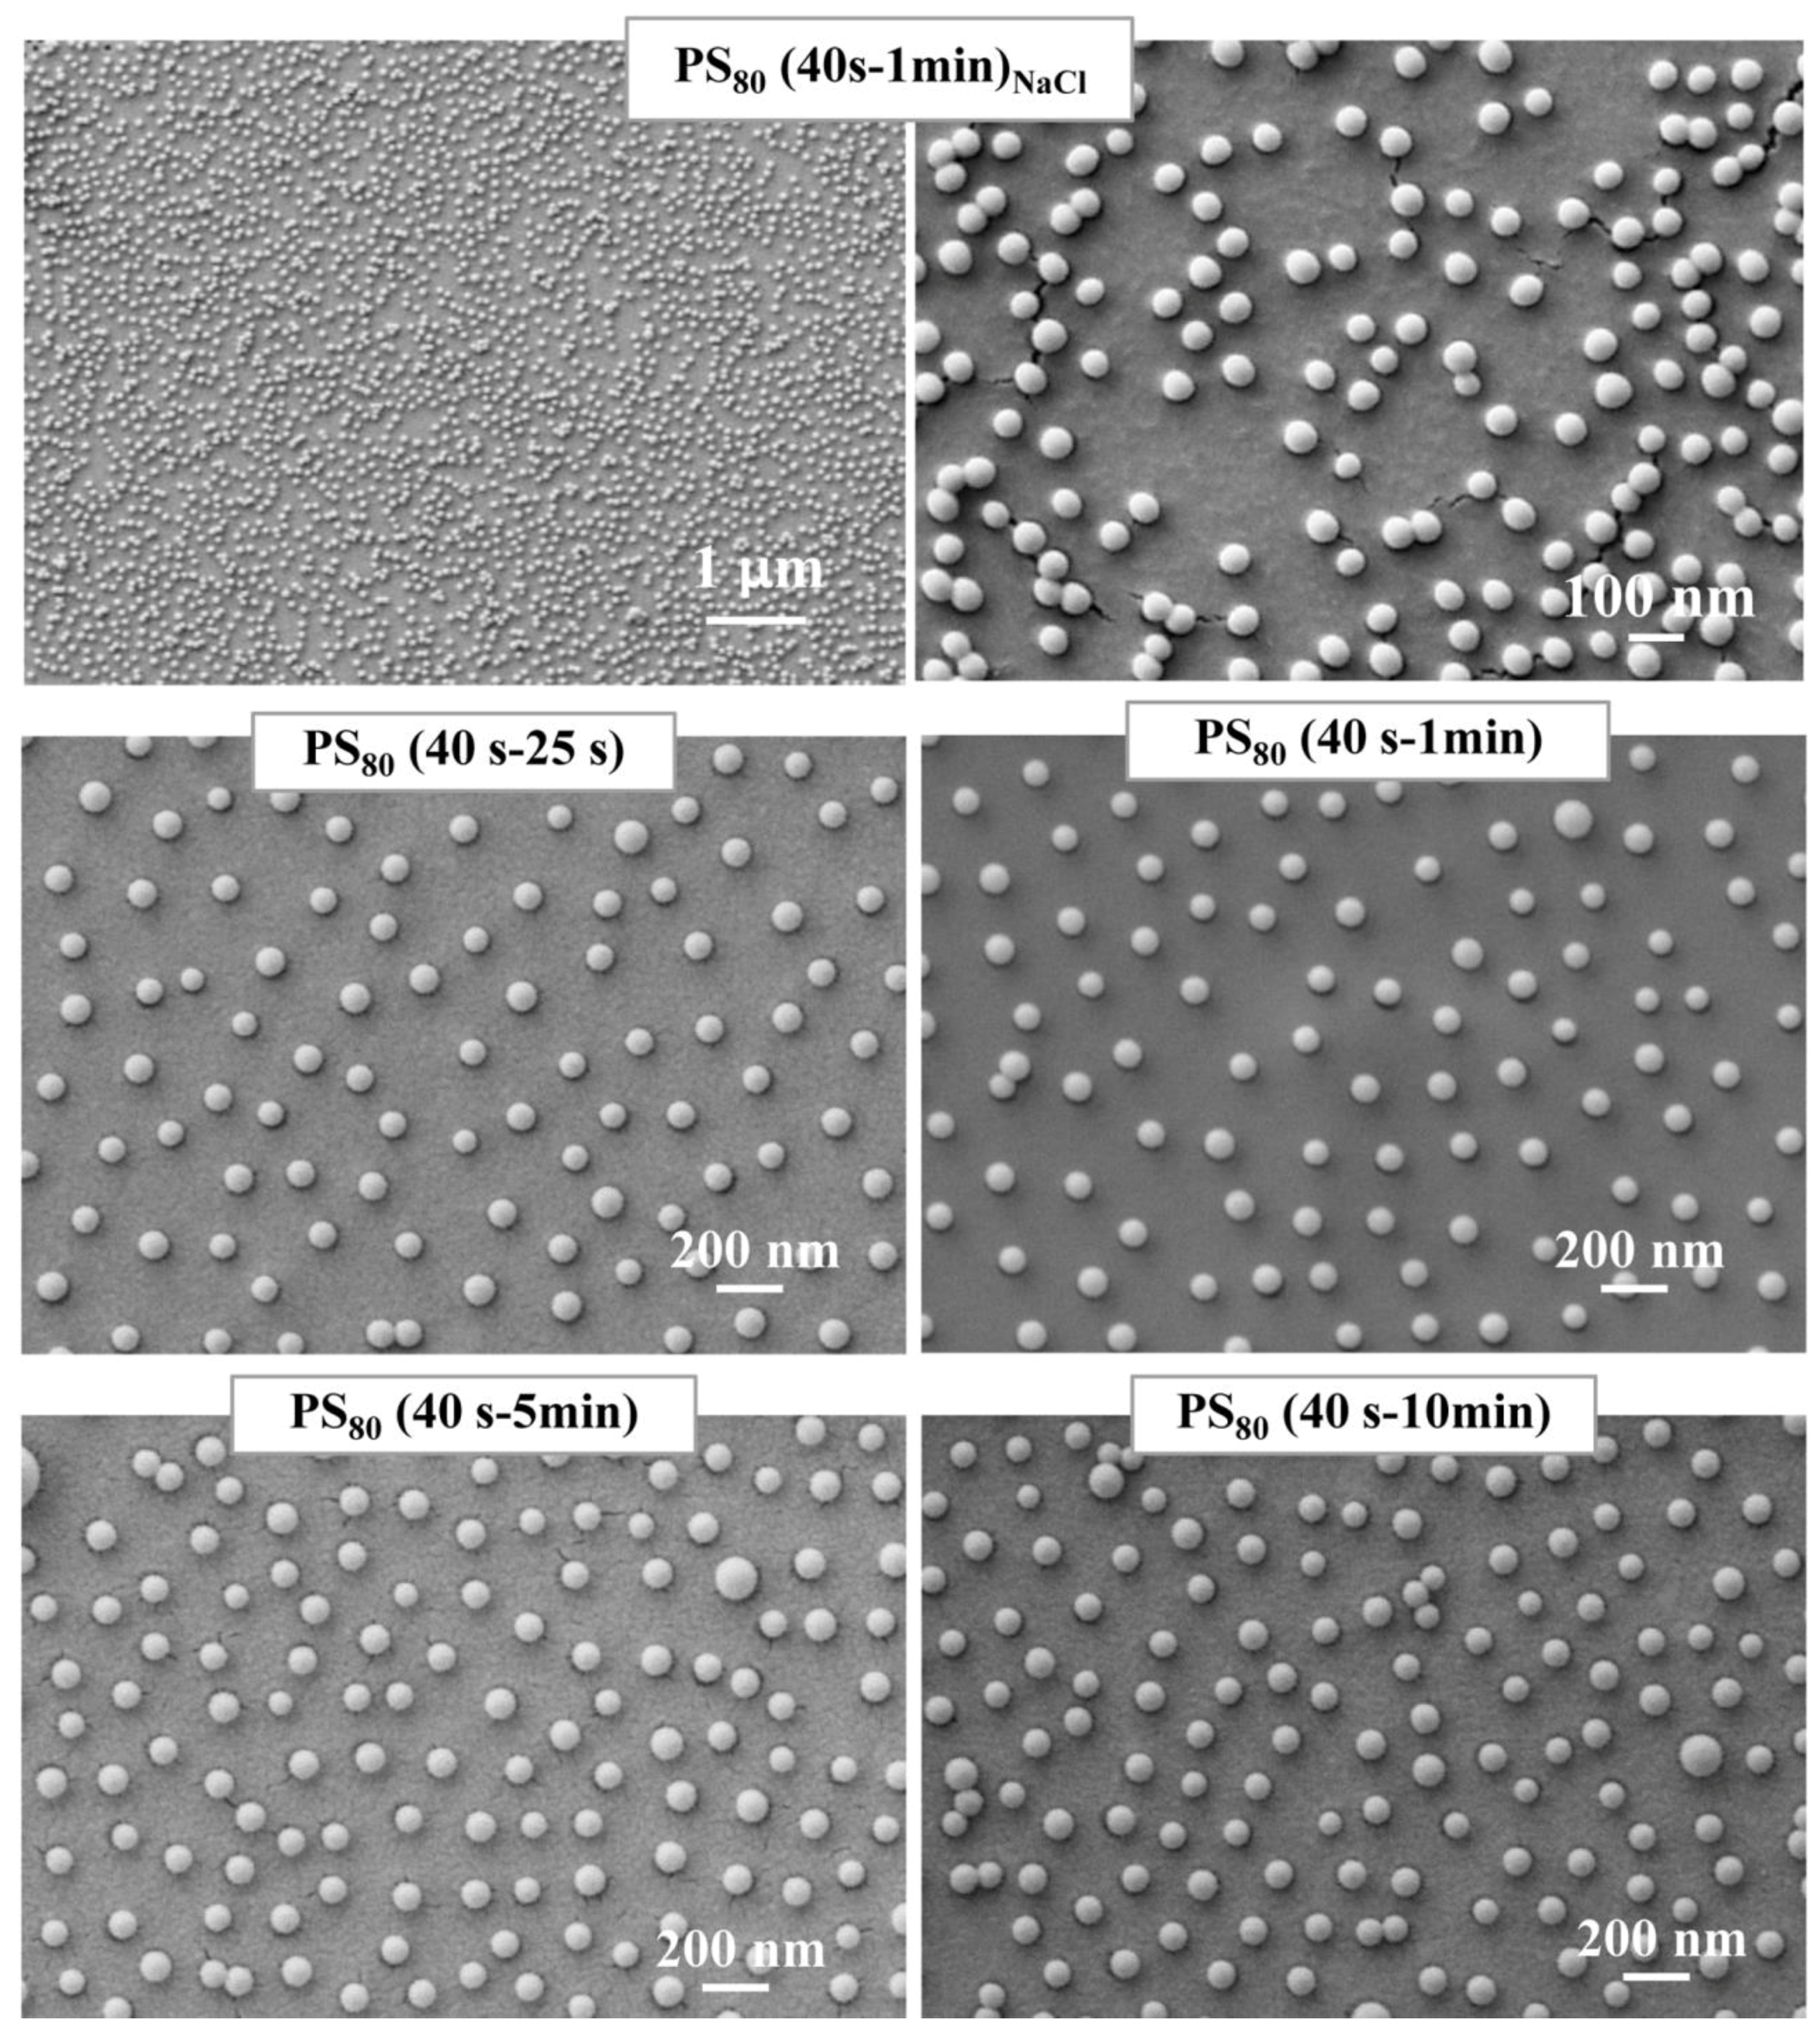
3.1.2. Short-Range Ordered Distributions

The topmost panel of Figure 4 shows plan-view SEM images of the sample, fabricated by setting ΔtPDDA = 40 s and ΔtPS = 1 min as the times of exposure of polyelectrolyte and the PS NPs aqueous solutions, respectively, the latter was prepared with an NaCl content of 2 mM. This was the reason why this last sample was named PS80 (40 s–1 min)NaCl, as reported in Figure 4.
The middle and bottom panels of Figure 4 shows SEM images of the samples deposited in short-time adsorption (i.e., PS80 (40–25 s) and PS80 (40 s–1 min)) and long-time adsorption (i.e., PS80 (40 s–5 min) and PS80 (40 s–10 min)) conditions, respectively.
In the presence of NaCl, electrostatic screened interbead repulsion, extended empty areas, locally disordered particle arrangements, and the formation of small agglomerates can be clearly observed. Because of the nonhomogeneity of the arrangement, no statistical analysis could be accurately performed in this case.
On the contrary, salt-free samples exhibited nearly uniform arrangements of the polystyrene nanospheres with minimal agglomeration effects, favored by a relatively low coverage. As a result of the statistical analysis, the average spacing between polystyrene nanospheres was estimated to be dNN = (212 ± 30) nm, corresponding to a fractional coverage of 11.4%.
The comparison between PS80 (40 s–1 min)NaCl and PS80 (40 s–1 min) indicated that shielded interparticle electrostatic repulsion could adversely impact the level of ordering of the colloidal mask.
Therefore, salt-free colloidal suspensions are considered hereafter. In this respect, once given ΔtPDDA = 40 s, the middle and bottom panels of Figure 4 show colloidal masks with good ordering, good separation of polystyrene nanospheres, and a negligible presence of agglomerates. In regard to short-time adsorption conditions, ΔtPS prolonged from 25 s to 1 min demonstrated no effective influence on the distributions, which were characterized by very similar arrangements of the polystyrene nanospheres and comparable interparticle spacing (dNN = (202 ± 31) nm for PS80 (40–25 s) versus dNN = (203 ± 31) nm for PS80 (40 s–1 min)). Upon increasing ΔtPS up to 5 min, an increased coverage was induced while well-isolated and uniformly distributed polystyrene nanospheres were retained with rare occurrences of dimers. Similar distributions (apart from the occurrence of sparse dimers in PS80 (40 s–10 min)) and comparable interparticle spacing was found (dNN = (161 ± 32) nm for PS80 (40 s–5 min) and dNN = (156 ± 32) nm for PS80 (40 s–10 min)).
Notably, under short-time adsorption conditions (ΔtPS = 25 s, 1 min), the comparable value of dNN meant no effective improvements in the number of the adsorbed colloids versus time. On the other hand, under long-time adsorption conditions (ΔtPS = 5 min, 10 min), the comparable value of dNN meant that the saturated adsorption coverage was achieved at nearly ΔtPS = 5 min.

3.2. Spectral Characterization

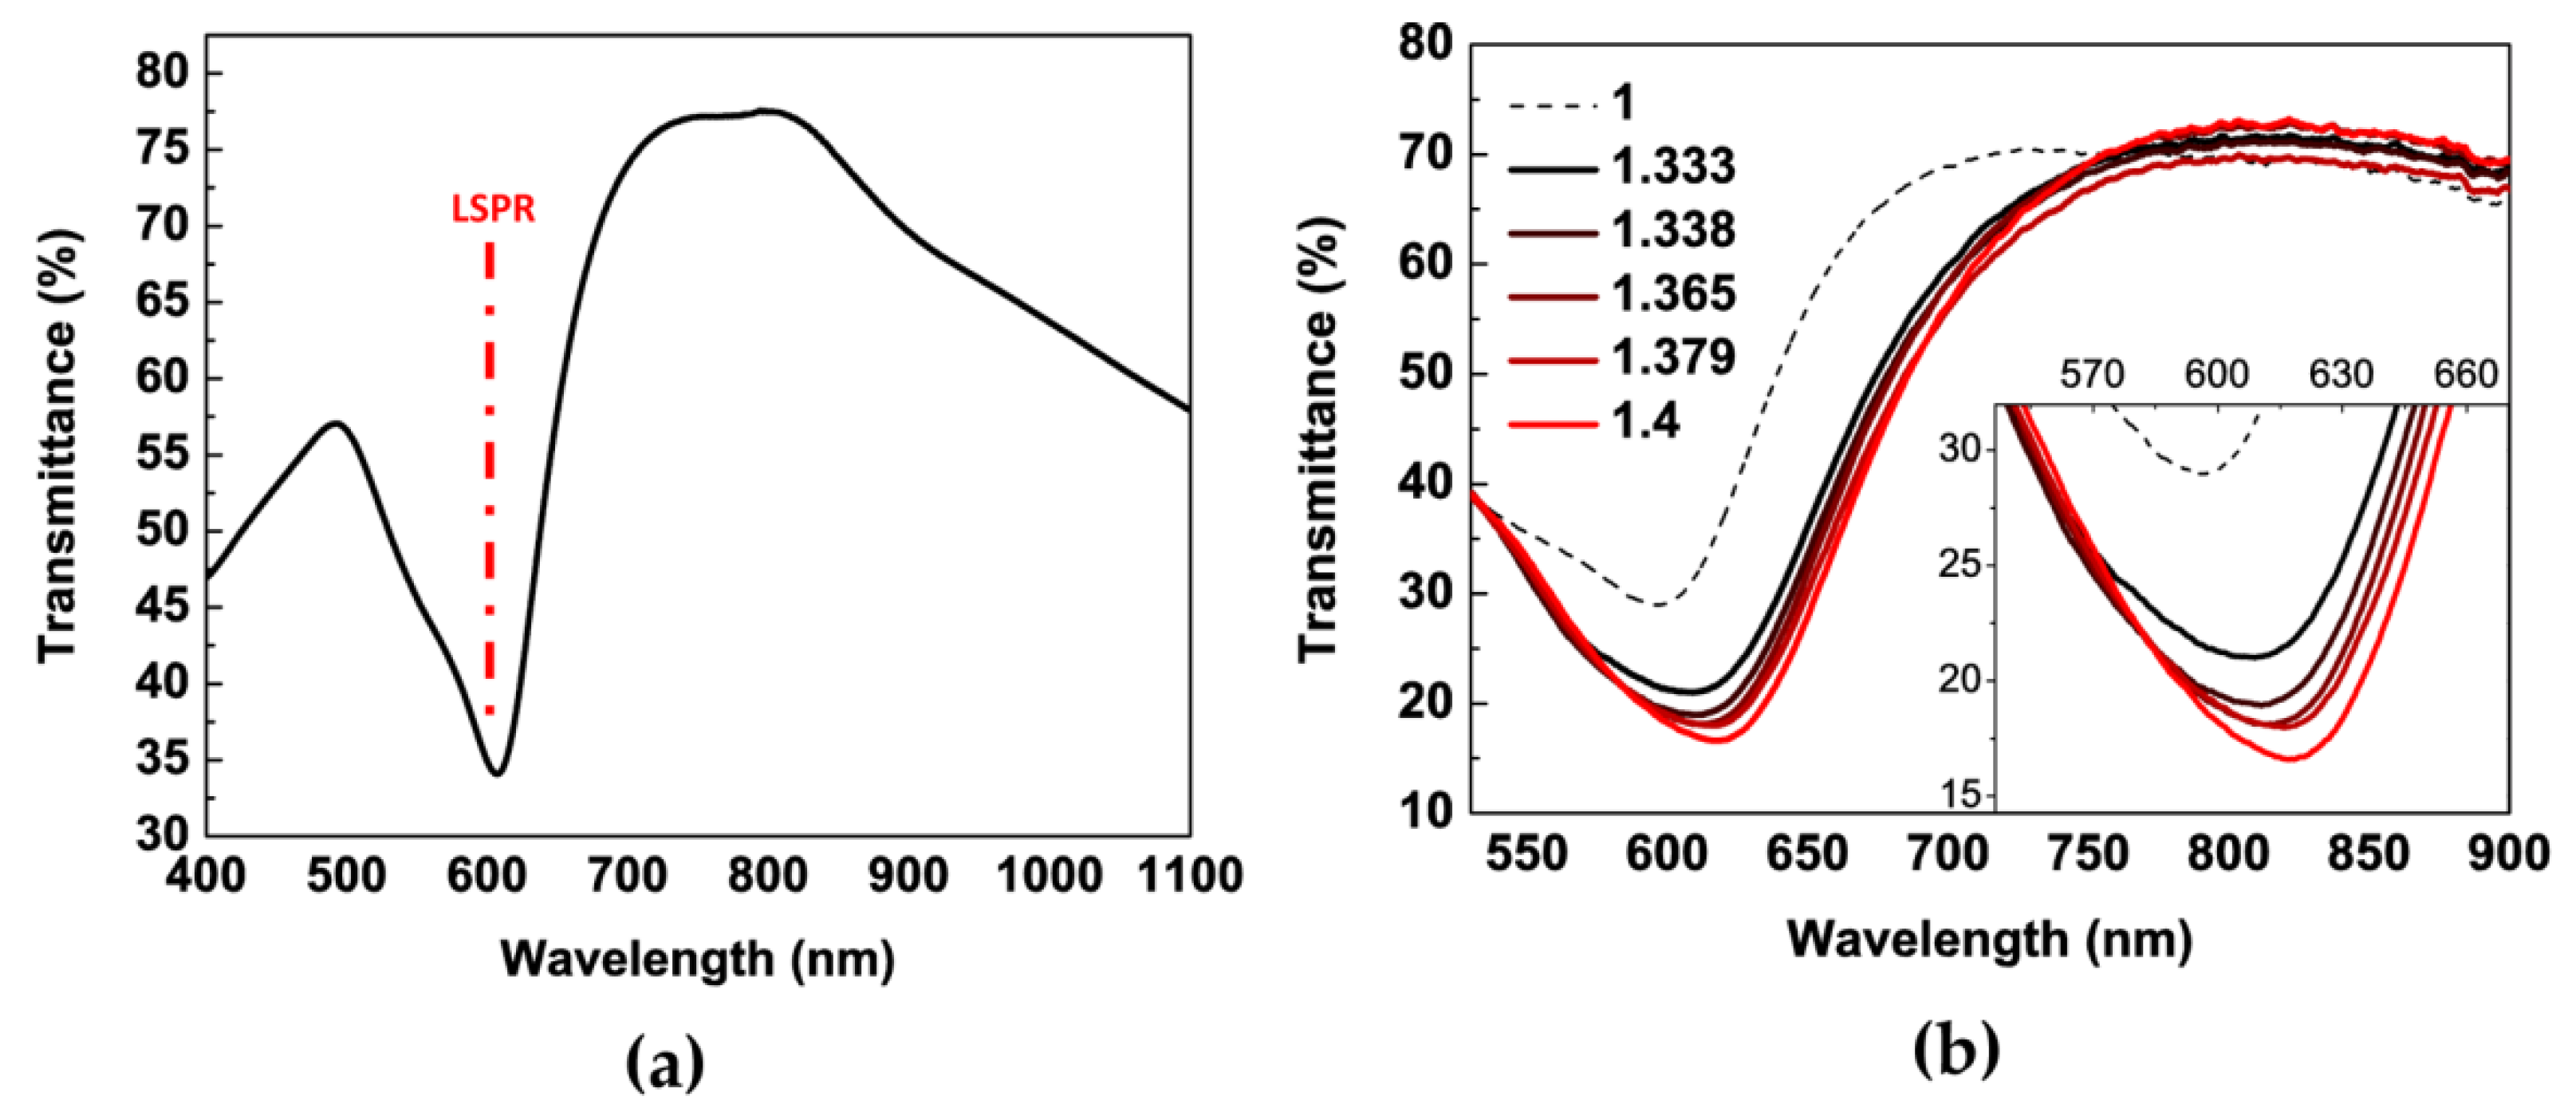
3.2.1. Long-Range Ordered Nanohole Distributions

Gold NH arrays support both localized and propagating surface plasmon resonances (PSPR and LSPR modes). Both of these optical modes can be tuned across the Vis to near-IR spectral range by simply modifying the periodicity, diameter of the hole, or the composition of the metal layer. In this work, the diameter of NH fabricated by NSL and the thickness of the deposited gold layer were carefully chosen in order to obtain a long-range ordered distribution of metal NH that exhibited LSPR and SPP resonant modes in the same spectral region of the short-range ordered NH distributions. For both the fabricated NH arrays, transmittance and/or reflectance spectra were recorded in air, exhibiting interesting optical features in the Vis-NIR spectral range. As an example, the zero-order transmittance spectrum of long-range ordered distributions of NH realized on a 50 nm thick Au layer in the 400–1100 nm spectral range is reported in Figure 5. The fabricated NHs were characterized by a diameter of 350 nm and a periodicity of 500 nm. Owing to the excitation of the LSPR mode, the transmittance signal of these nanostructures exhibited a pronounced dip in the visible spectral range located at 595 nm. However, if the ordered NH array presented a sufficient periodicity, propagating surface plasmon polariton (SPP) modes can also be excited by the incident light, leading to an extraordinary optical transmission (EOT) of the sample [48,60]. In particular, owing to the grating-like nature of the fabricated nanohole array, an increased optical transmission band can be noticed around 750 nm, which can be attributed to the excitation of SPP modes.

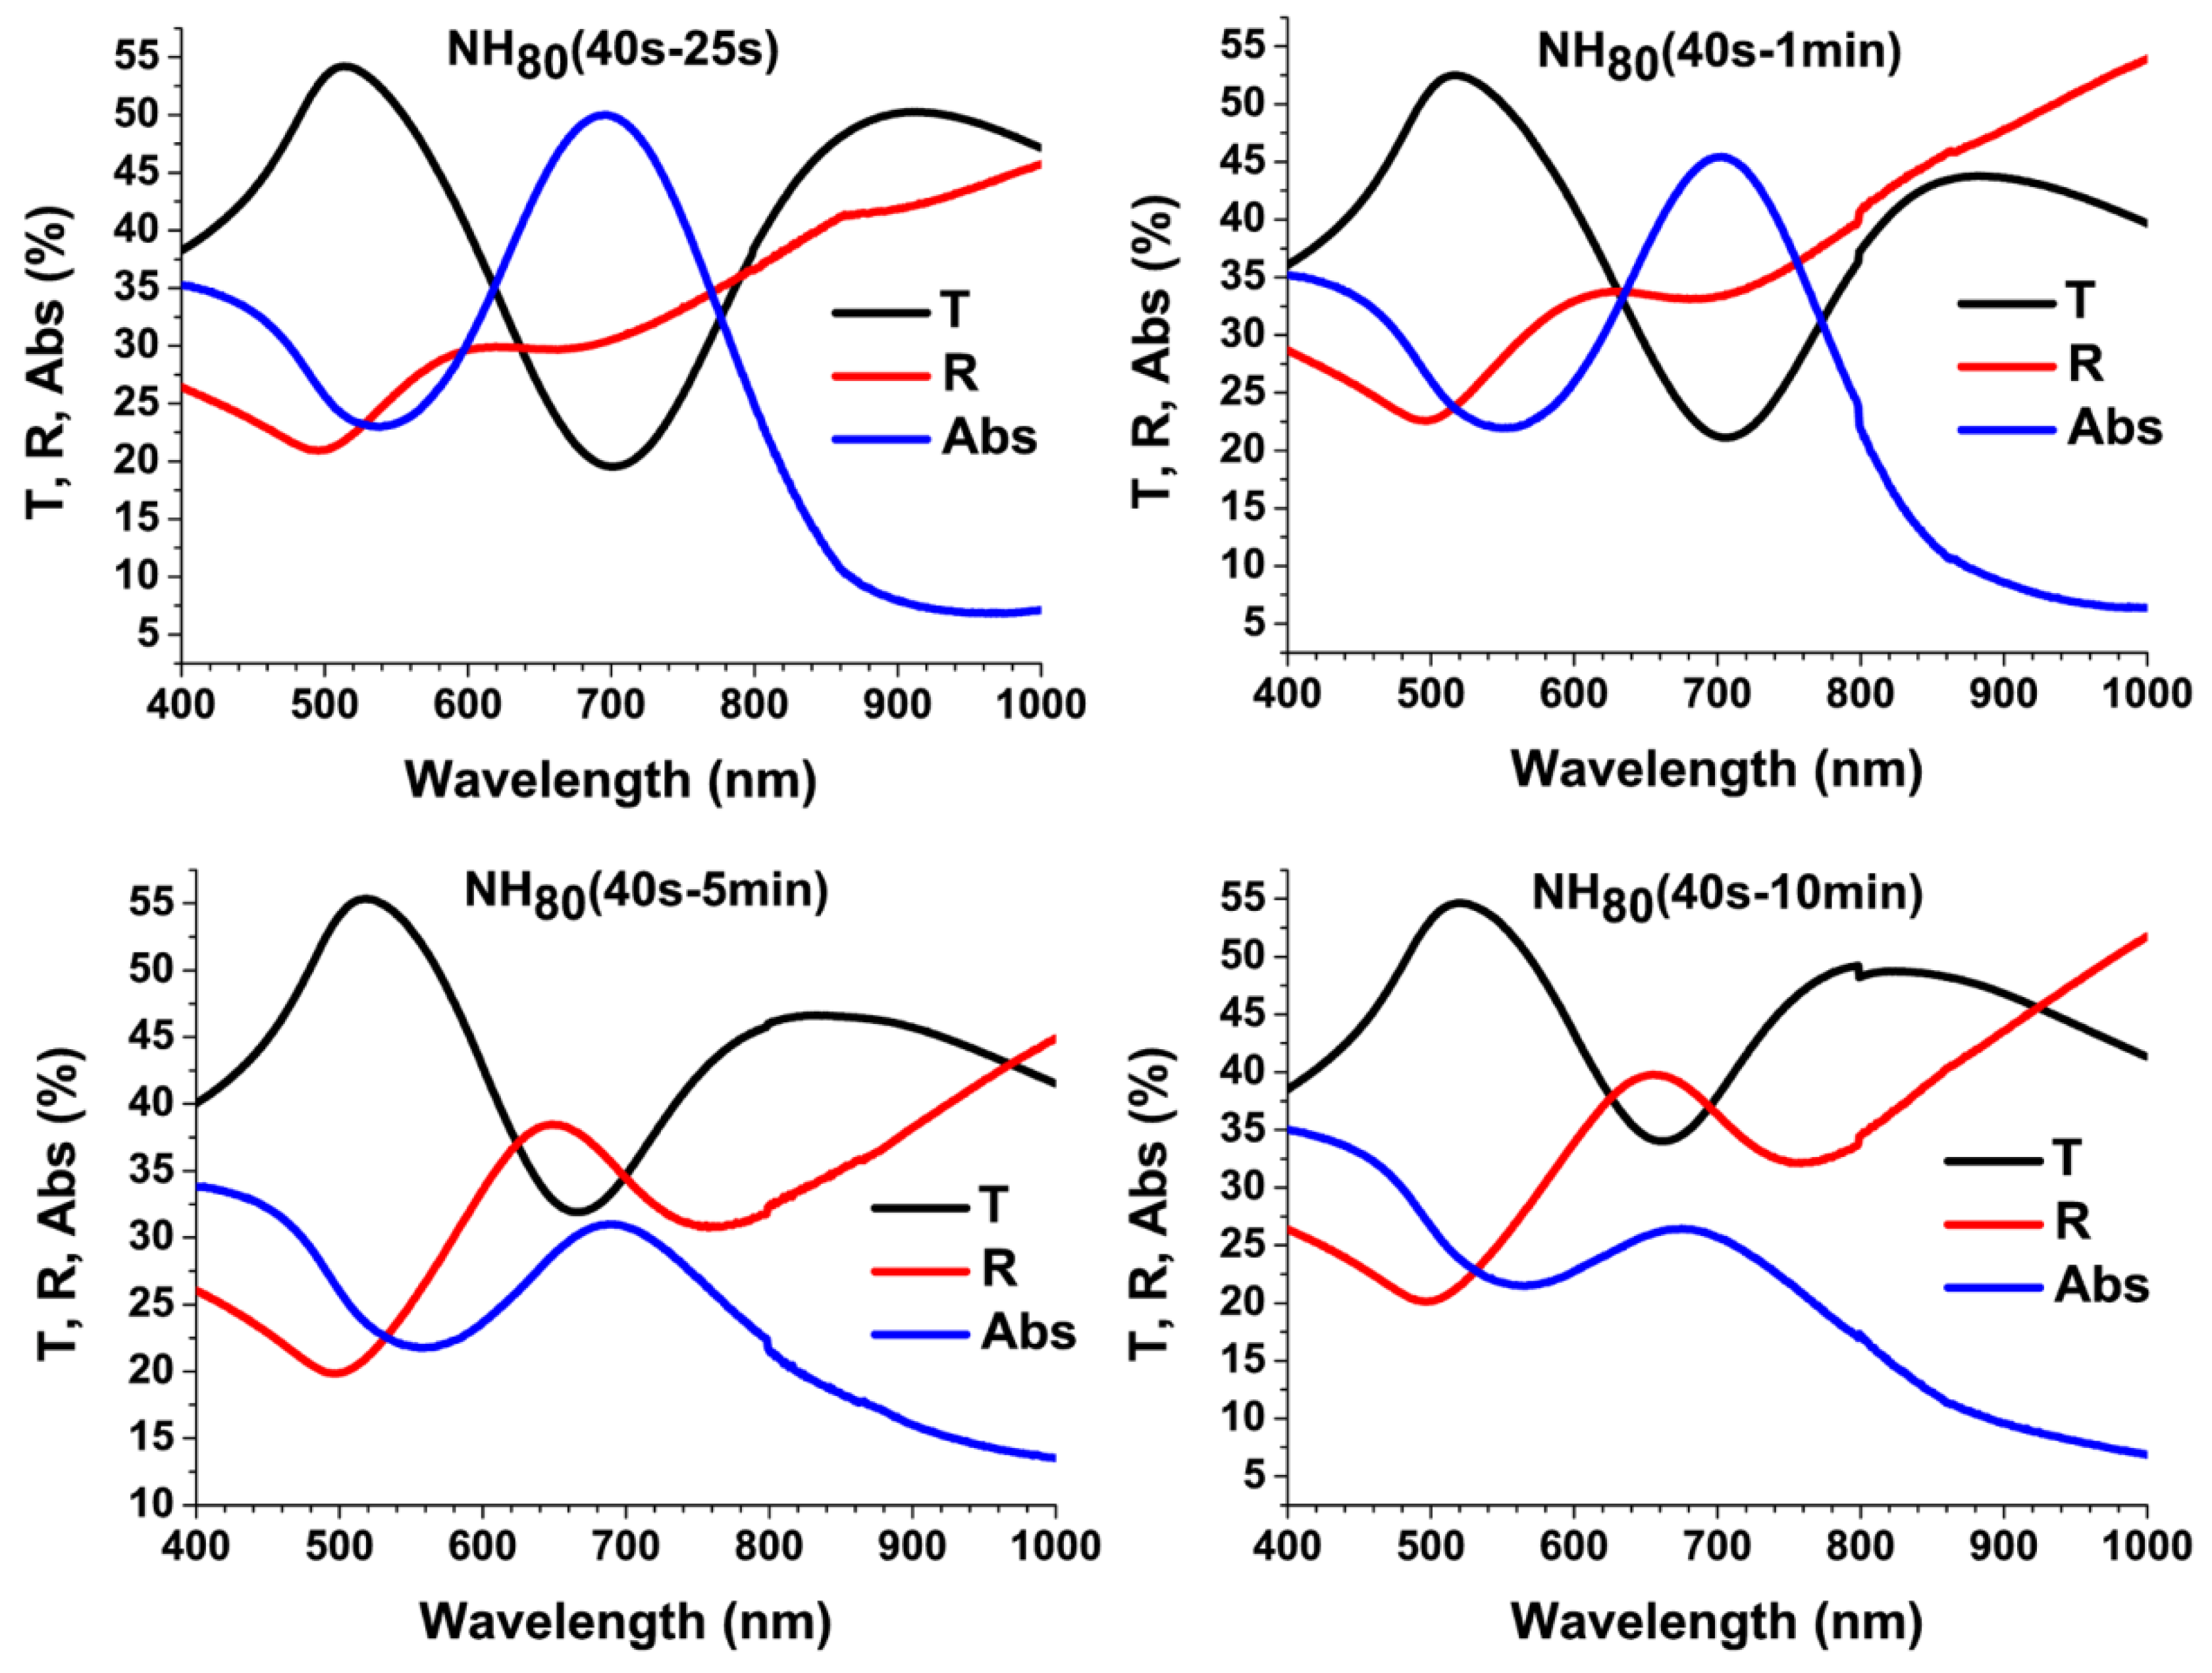
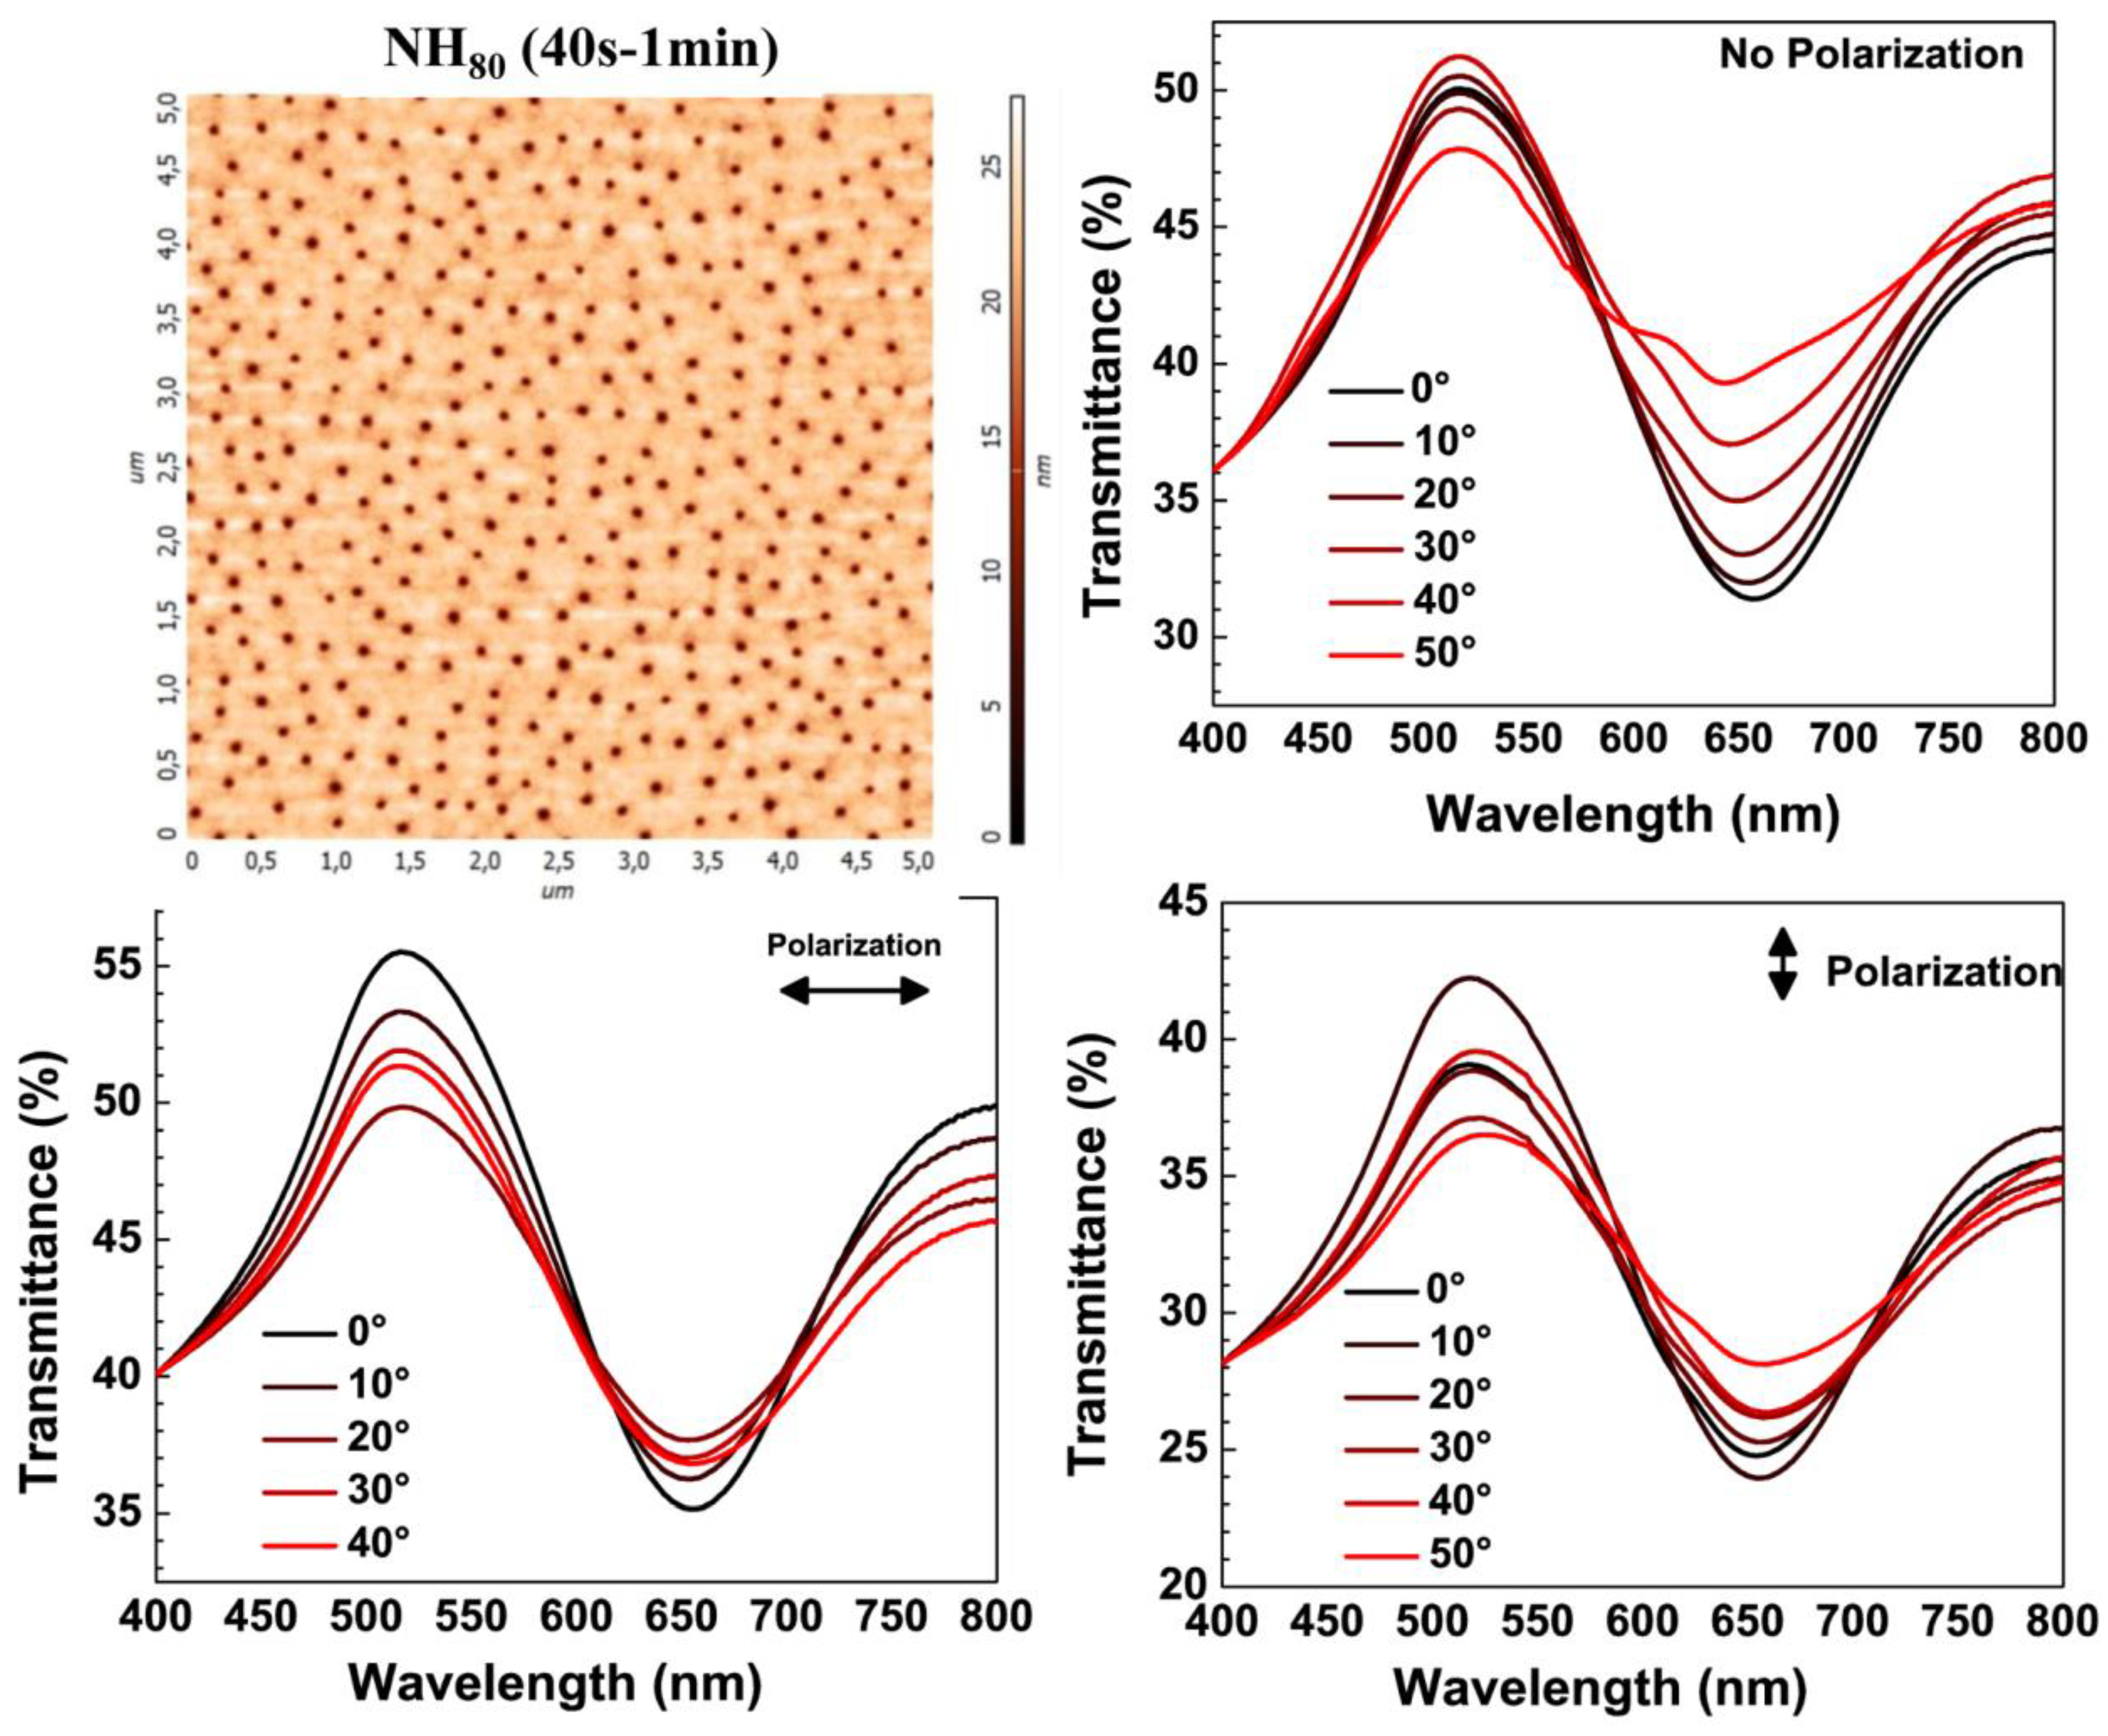
3.2.2. Short-Range Ordered Nanohole Distributions.

Figure 6 shows the zero-order transmittance measured under normal incidence, the reflectance, and the calculated (Abs = 100-R-T) absorbance curves of the NH samples NH80 (40–25 s), NH80 (40 s–1 min), NH80 (40 s–5 min), and NH80 (40 s–10 min) that were fabricated from the starting colloidal masks PS80 (40–25 s), PS80 (40 s–1 min), PS80 (40 s–5 min), and PS80 (40 s–10 min), respectively, according to the protocol sketched in Figure 1b.
The transmission peak was spectrally located at 513 nm for NH80 (40–25 s) and at 519 nm for NH80 (40 s–1 min), NH80 (40 s–5 min), and NH80 (40 s–10 min). These spectral positions were blue-shifted with respect to the broad transmission band that peaked at 532 nm that we measured for a 20 nm-thick gold film. The transmission maximum intensity was found to slightly increase on increasing the NH coverage, while it was lower than the transmission efficiency of the reference Au film because of the suppressed transmission of NH arrays in ultrathin metal films [61]. Regarding the transmission minimum, it showed a linear blue-shift for decreasing NH-to-NH spacing (i.e., dNN). This behavior was consistent with the theoretically predicted relationship between the lattice constant and the wavelength of the transmission resonance associated with a PSPR mode in periodic NH arrays.
Turning to the reflectance spectra, minimum transmittance and maximum reflectance were spectrally close to each other as well as maximum transmittance and minimum reflectance. Unlike minimum reflectance at ~496 nm that was independent on dNN, maximum reflectance was sensitive to dNN changes exactly as the minimum transmittance was. The absorbance peak was also spectrally close to the transmittance minimum. These characteristics of the measured spectra would indicate that the transmittance maximum and minimum could be associated with a LSPR and PSPR mode, respectively [55,62,63,64,65].
In general, the transmission peaks of long-range ordered NH systems were associated with Block-wave SPPs excited by grating-coupling mechanisms and, because the momentum relationships matched, they were dependent on the incidence angle of the exciting photons. Hence, in order to assign the modes of our short-range ordered NH arrangements to either PSPR modes (which spectrally shift versus the incidence angle) or PSPR modes (which are almost insensitive to changes of the incidence angle) [55,62,63,64,65], transmittance spectra, as a function of the incident angle of the exciting light that was varied from zero (normal incidence) to 50°, were acquired. In this respect, Figure 7 shows the AFM topography of NH80 (40 s–1 min) (top-most left panel), considered as a representative sample, and the corresponding transmittance spectrum depending on incidence angle (top- most right panel) and polarization (bottom line panels).
It can be observed how the spectral position of the transmission maximum was quite insensitive to changes in the incidence angle, and the transmission maximum linearly blue-shifted. These experimental findings support the assignment of the transmission peak and dip to the excitation of a propagating and localized plasmonic mode, respectively, in the NH system [53]. As a further confirmation of this identification, we also measured the transmittance spectra versus changes of the incident angle of p-polarized and s-polarized exciting light (Figure 7, bottom row panels). According to the literature, in our short-range ordered NH distribution we found a negligible red-shift of the transmission minimum under p-polarized exciting light and no spectral shift under s-polarized incident exciting light for increasing incidence angles [66].
Definitively, the spectral characterization analyses described above allowed us to assign the transmission maxima and minima of our short-range ordered NH arrays to an LSPR and PSPR mode. In particular, as asymmetric NH structures in optically thin films (thickness below 50 nm) can only support the strongly damped short range SPP mode associated with a transmission minimum [65], the transmission minimum of our samples can be associated with an LSPR mode of the short range SPP kind.

3.3. Refractometric Sensing Characterization

3.3.1. Long-Range Ordered Nanohole Distributions

As proof of concept, the ability of the fabricated nanostructures to detect even small changes in the refractive index (RI) of the external environment was investigated. We analyzed the functional properties of the fabricated long-range NH array. The optical transmission of the system was monitored after immersion in different glycerol solutions. Five refractive index standard solutions were prepared by glycerol diluted in deionized water, allowing the calibration of the optical response to several bulk RI changes in the range from 1.333 to 1.400. Exploiting a homemade micro-fluidic chip, we monitored the variations of the LSPR transmission dip when the system was covered with the prepared solutions. As reported in Figure 5b, the effect of the high-index dielectric surrounding was a spectral shift of the resonance toward higher wavelengths. A linear dependence of LSPR response on the RI of the environment was measured, thus confirming the ability of the transducer to detecting even small bulk refractive index changes. From the slopes of the calibration curve, a bulk refractive index sensitivity of about (200 ± 30) nm/RIU (RIU = Refractive index unit) (R2 = 92%) was calculated.

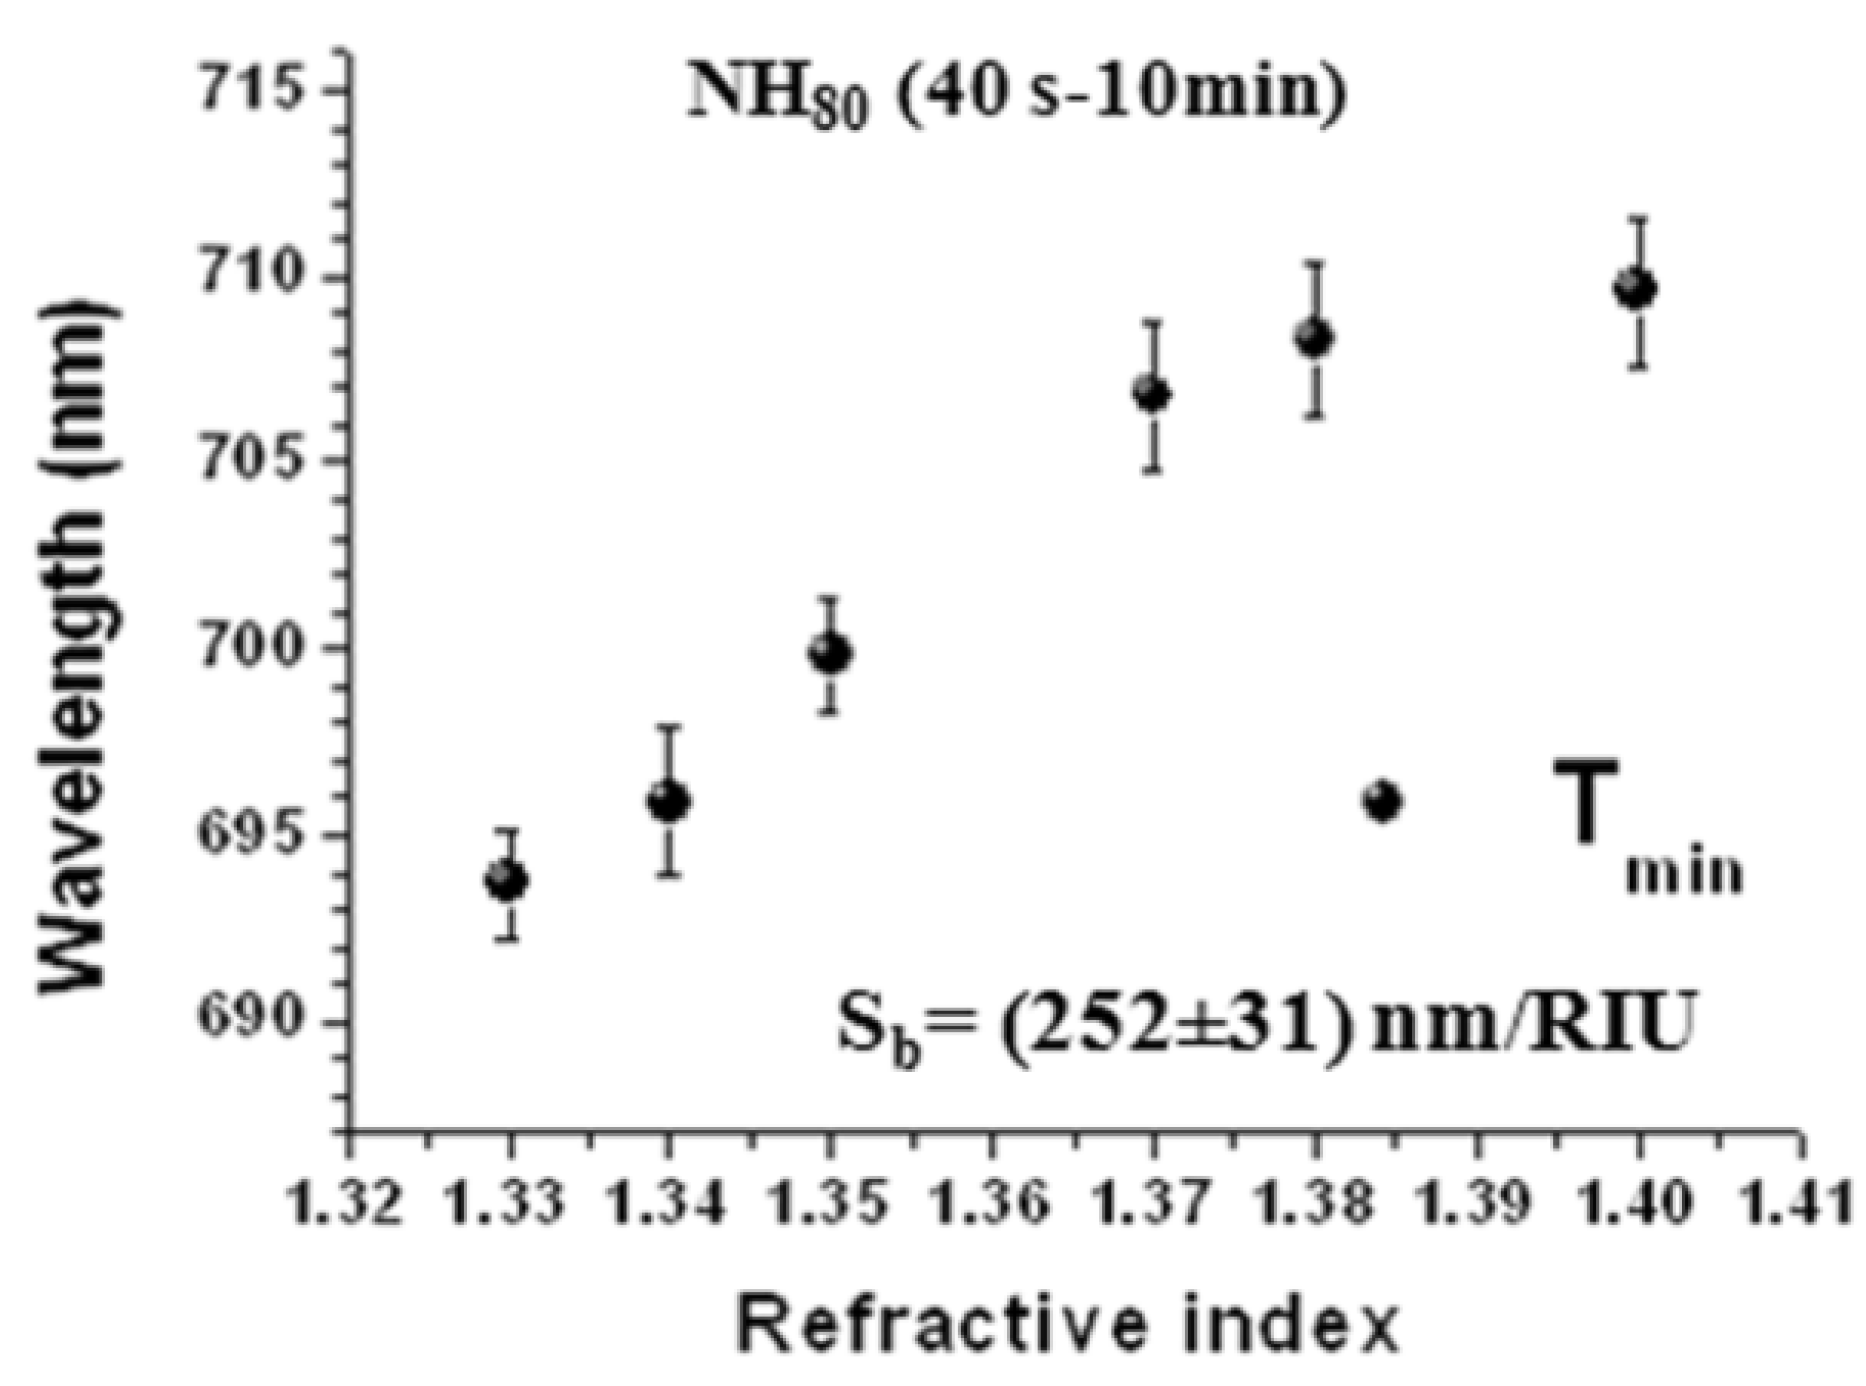
3.3.2. Short-Range Ordered Nanohole Distributions

In order to estimate the refractometric sensing performances of the NH distributions with DNH = 80 nm, we measured the zero-order transmittance spectra of NH80 (40 s–10 min), which corresponded to the saturation adsorption conditions, versus changes of the surrounding refractive index (Figure 8). A linear red-shift versus increasing refractive index of the transmittance minimum wavelength was found, which was associated with a propagating mode by means of spectral characterization. On the basis of a linear fit, bulk sensitivity was calculated to be (252 ± 31) nm/RIU (R2 = 94%) for the transmission minimum of NH80 (40 s–10 min) (Figure 8). The sensing performance of our short-range ordered NH samples were comparable with, or even better than, the results reported in the literature [29,45,46,55,67,68,69,70,71].

4. Discussion

4.1. Long-Range Ordered Nanohole Distributions

Highly ordered arrays of plasmonic nanostructures have been fabricated by developing a simple and reproducible approach based on nanosphere lithography (NSL). This cost-effective method is based on the self-assembling of close-packed polystyrene particles at air/water interfaces, and enables the fabrication of colloidal masks characterized by a high-quality crystal structure. Periodic arrays of metal nanostructures can be easily prepared on large area by exploiting the geometry of this low-cost lithographic mask. In particular, highly ordered arrays of gold nanoholes distributed in a hexagonal lattice on glass substrates have been fabricated. The realization of a high-quality monolayer of polystyrene particles is crucial for the fabrication of large areas and defect-free arrays of long-range ordered nanostructures. Therefore, a deep understanding of the self-assembling process of colloidal particles at air/water interfaces is required.
As recently suggested by Nikolaides et al. [72], this process is based on a fine balance between different forces, including inter-particle electrostatic forces and flotation capillary forces. A fine balance between these repulsive and attractive interactions is necessary to achieve long-range order in the self-assembling CPA. The first observable effect confirming the formation of a crystal-like structure is the appearance of iridescent colors under white light illumination. Known as structural color, this effect arises from the Br agg reflection of light on periodic structures. A divergent light source was used during and after the deposition process in order to investigate the existence of structural ordering in the PS nanosphere monolayer. As an example, a CPA of a PS nanosphere with a diameter of 500 nm deposited on a glass substrate has been reported in Figure 2a. Depending on the colloidal mask quality, one or more iridescent colors can be found on the sample surface, owing to the presence of crystal domains characterized by different orientations.
In this work, we integrated a conventional NSL fabrication strategy with a reactive ion etching (RIE) process for the fabrication of long-range ordered NHs arrays into Au thin films. Based on an appropriate oxygen plasma etching process, this post-deposition treatment is a key step in the controlled preparation of non-close packed monolayers of polystyrene particles. The volume and the composition of the applied gases can vary depending on the size and nature of the chosen nanospheres. For polystyrene particles around 500 nm in diameter, a shorter and more aggressive etching process based on the use of oxygen gas is suggested. Figure 3c shows an AFM image of a non-close packed array of polystyrene particles with average diameters of 350 nm and a constant period of 500 nm, which was obtained following the etching procedure detailed in the experimental paragraph. As recently reported by Plettl et al. [73] and Blattler et al. [74], the size of polystyrene nanospheres decreased almost linearly with increasing etching time until a saturation state, in which the periodicity of the polystyrene monolayer could be irreversibly damaged. Therefore, the mean nanohole diameter could be tuned by varying the duration of the oxygen etching process. In addition, by choosing polystyrene nanoparticles of different diameters, the period of nanostructures can also be tuned. Compared with the short-range counterparts, the long-range ordered metal NHs arrays should present better regularity and narrower plasmon resonance bands from the far-field coupling effects among arrays [75,76]. Furthermore, these kind of nanostructured metal films are able to support the simultaneous excitation of localized (LSP) and propagating surface plasmon (SPP) under Kretschmann configurations, combining the advantages of high electric field enhancement generated by LSP and the large volume investigated by an SPP field. These advantages make them very attractive for several applications such as SERS- and SPR-based sensors.

4.2. Short-Range Ordered Nanohole Distributions

Distributions of negatively charged polystyrene nanospheres with a diameter DPS = 80 nm were made to adsorb a salt-free suspension onto a PDDA monolayer with a PDDA adsorption time of ΔtPDDA = 40 s and for varying adsorption times of the polystyrene nanospheres from a short time (ΔtPS = 25 s, 1 min) to a long time adsorption (ΔtPS = 5 min, 10 min).
Hereafter, we rationalize our choice of the experimental conditions and discuss their impact on distribution and ordering of the colloidal masks under examination in this study. This is a very important issue in order to correctly relate optical and structural responses. Indeed, disordered NH distributions, where uncorrelated disorder occurs, do not present transmission resonances. Instead, quasi-periodic and short-range ordered NH systems exhibit correlated disorders that yield transmission resonances, as observed in the periodic counterpart systems [77].
In our experiments we planned to use salt-free colloidal suspensions to maximize the interbead electrostatic repulsion and stabilize the distribution at a larger interparticle spacing. According to the most widely used model for picturing the kinetics of formation of a likely-charged colloidal monolayer, the extended random sequential adsorption (RSA) model [15,78], colloidal particles adsorb randomly onto the collector countercharged surface until excluded-area effects dominate as a result of the electrostatic repulsion between the already adsorbed and the attempting-to-adsorb colloids.
The net effect of the interparticle coulomb repulsion and the zeta potential of the polyelectrolyte collector surface determines the final fractional coverage and ordering of the colloidal mask [14]. When no more colloids can be accommodated onto the collector surface, a saturated coverage is achieved, and the distribution is electrostatically stabilized.
The interparticle spacing of this arrangement strongly depends on the ionic strength of the colloidal suspension as well as the surface charge of the colloids. In our experiments, the colloids with a diameter DPS = 80 nm have a surface charge of 1.2 µC/cm2, and no intentional addition of an electrolyte to the colloidal solution rules out screening effects of this surface charge. As a consequence, the distance of closest approach of the polystyrene nanospheres is dictated by the surface charge, that is, the colloids adsorb further apart. Hence, control of the ionic strength of the colloidal solution is a simple way to tune the distance between the adsorbed particles. Salt-free solutions offer an effective mean to limit the detrimental influence of the lateral attractive capillary forces during the drying of the colloidal mask. Indeed, unlike coulomb repulsion, closely spaced particles favor agglomeration effects driven by the attractive capillary interaction [15,16,79]. Unlike NSL, capillary forces impact adversely on the short-range ordering of colloidal masks prepared by CL, which demands careful control of the deposition approach to limit agglomerates.
According to the above background, the absence of agglomerates observed in the case of the salt-free samples reported in Figure 4 can be ascribed to the use of salt-free colloidal suspensions and the effective surface charge of the colloids. Consistently with this conclusion, the distribution of PS80 (40 s–1 min)NaCl suffers from agglomeration effects due to NaCl-induced electrostatic screening. Further control experiments in the presence of electrostatic screening demonstrated sparsely distributed colloids with large void areas in low coverage conditions and more severe agglomeration in high coverage areas. Moreover, clustered colloids would result in defective NH arrangements, with detrimental effects on the spectral properties and losses of the PSPR mode [80]. Notably, in the perspective of using the colloidal masks for fabricating short-range ordered arrangements of NHs, the interparticle spacing dNN should be tuned in such a way to get a proper NH diameter-to-periodicity ratio (DNH/dNN, where DNH = DNH refers to the diameter of a NH). Owing to the literature, the RI sensitivity of an NH array increases linearly with an increasing DNH/dNN ratio and can be improved for DNH/dNN = 0.5 [81]. This is the choice made in this work.
To summarize, salt-related progressive shortening of the electrostatic decay length could be unnecessary for applications involving NH arrays, and it would favor the formation of agglomerates. The degree of correlated disorder can be more effectively controlled using salt-free colloidal suspensions. On the other hand, field enhancement of NH arrangements was reported to be more homogeneous and confined to the NH location for DNH < 100 nm [56].
Definitively, DNH = 80 nm and salt-free colloidal suspensions are, in principle, suitable experimental conditions for fabricating NH arrays acting as large-area functional transducers for sensing applications.
In regard to the colloidal assembly process, likely-charged colloids adsorb and arrange onto a countercharged collecting surface from an aqueous solution in a two-stage process. This process is dominated by attractive particle–adsorptive substrate interactions in its early stage and by interbead repulsion upon increasing coverage up to the electrostatically stabilized distribution in its later stage [14]. Therefore, interplay between the adsorption time of PDDA (that affects the adsorption efficiency of the collector surface) and the adsorption time of the colloids (that leads to increasing influence of the coulomb repulsion according to the RSA model) are expected to impact the distribution of the mask and can be studied by short- and long-time adsorption conditions.
On the basis of the evidence that the deposition of PDDA achieves 90% saturation in 40 s and slows down over 60 s [59], we considered ΔtPDDA = 40 s as a control value. Notably, preliminary investigation on the morphology of the PDDA monolayer provided evidence of a very smooth surface, which means there is an absence of surface features that would impact the adsorption kinetics of the colloidal mask. This result was expected based on the low concentration and absence of salt of the PDDA aqueous solution, which favors extended chains and no chain conformational changes [57].
For given ΔtPDDA = 40 s and DPS = 80 nm, we prolonged ΔtPS from 25 s to 10 min and were able to fabricate colloidal masks with a good correlated disorder (uniform arrangements of isolated polystyrene nanospheres without agglomerates). The average interparticle spacing was found to range from ~203 nm under short-time adsorption (Figure 4, samples PS80 (40–25 s) and PS80 (40 s–1 min)) to ~156 nm under long-time adsorption (Figure 4, samples PS80 (40 s–5 min) and PS80 (40 s–10 min)). The counterpart NH samples yield a DNH/dNN ratio equal to 0.40 for NH80 (40–25 s), 0.39 for NH80 (40 s–1 min), 0.48 for NH80 (40 s–5 min), and 0.51 for NH80 (40 s–10 min).
While presenting our results about the spectral characterization of the short-range ordered NH arrays with DNH = 80 nm (Figure 6 and Figure 7) we pointed out complementary transmission, reflectance, and absorbance resonances as well as spectral responses dependent on the incidence angles and polarization of the exciting photons, fully consistent with what expected in optically thin metal films patterned with sub-wavelength NHs. The refractometric sensing measurements demonstrated good bulk RI sensitivity performances too. Definitively, both spectral and sensing response of our samples confirm that the experimental conditions applied for fabricating 80 nm-diameter short-range NH distributions in optically thin Au-film effectively leads to a good correlated disorder.

5. Conclusions

In this paper we have presented large area NH distributions fabricated by NSL, which yields periodic patterns, and by CL, which yields arrangements with correlated disorder. The periodic hexagonal lattice with non-closely packed arrays have been fabricated onto glass substrates by a simple and reproducible NSL approach consisting of the following steps: (i) the self-assembly of close-packed polystyrene particles with diameters of 500 nm at an air/water interface, (ii) their transfer onto a solid substrate to form a colloidal mask, and (iii) the modification of this mask by a post-treatment etching process to reduce the diameter of the nanospheres to a desired size (i.e., 350 nm). The effect of the high-index dielectric surrounding the NH array gives rise to a spectral shift of the resonance toward higher wavelengths, and a calibration curve was measured, thus, confirming the ability of the transducer to detect even small bulk refractive index changes (200 ± 30) nm/RIU). Further significant improvements in the sensing performances could be easily achieved by optimization of their geometrical properties.
The short-range ordering NH distributions have been prepared by a simplified CL protocol using a single polyelectrolyte layer, rather than the conventional polyelectrolyte multilayer. Polystyrene nanospheres with diameters of 80 nm and negative surface charges have been adsorbed from a salt-free colloidal solution onto a PDDA monolayer. This was demonstrated as the changing adsorption times from the colloids impact on the coverage of the colloidal mask. We have investigated the properties of the samples by SEM analyses. Statistical evaluation of coverage and NH-to-NH average distances show their structural evolution depending on the deposition conditions. Distributions with a high level of correlated disorder, well-separated colloids, and absence of agglomerates (due to capillary forces) have been shown and discussed on the basis of the working principle of CL.
Turning to the optical response, transmittance, reflectance, and absorbance spectra of the fabricated short-range ordered NH arrays have been discussed in terms of the occurrence of propagating and localized plasmon modes. Also, good refractometric sensing performances (bulk sensitivity of (252 ± 31) nm/RIU) have been shown, thus demonstrating that short-range ordered metal NH arrays are promising functional transducers for refractive index changes in liquid environments. In this appealing, applicative scenario, the results presented here can be an analytical tool for guiding the choice of geometrical parameters in the realization of metal NH arrays by non-conventional fabrication techniques. This is a first step towards their implementation for monitoring of molecular binding events. The future perspective is to optimize further the sensing performances of the proposed nano-optical transducers, using the large amount of literature in this field [43,82,83,84], and achieve their easy integration in the imaging system leading to compact, low-cost, fully integrated, and multiple-detection lab-on-a-chip devices [85].

Author Contributions

This manuscript was written through contributions of all authors. M.C. designed and performed the CL experiments, discussed the short-ordered structures and wrote the most of the paper; A.C. performed the NSL experiments as well as spectral and sensing measurements and discussed the long-range ordered systems; D.L. performed AFM analyses and relative discussion; A.T. performed SEM analyses and statistical analysis; E.M. performed the metal deposition in the clean room facilities; R.R. and M.G.M. contributed to the discussion of data and supervised the activities. All authors have revised and given their approval to the final version of the manuscript.

Funding

This research was funded by a grant from the Ministry of Education, University and Research for the scientific program SIR2014Scientific Independence of young Researcher (RBSI1455LK).

Acknowledgments

The authors acknowledge Maria Concetta Martucci (IMM-CNR, Lecce) for the oxygen plasma treatments.

Conflicts of Interest

The authors declare no conflict of interest. The funders had no role in the design of the study; in the collection, analyses, or interpretation of data; in the writing of the manuscript, or in the decision to publish the results.

References

  1. Ito, T.; Okazaki, S. Pushing the limits of lithography. Nature 2000, 406, 1027–1031. [Google Scholar] [CrossRef] [PubMed]
  2. Duan, H.; Fernández-Domínguez, A.I.; Bosman, M.; Maier, S.A.; Yang, J.K.W. Nanoplasmonics: Classical down to the nanometer scale. Nano Lett. 2012, 12, 1683–1689. [Google Scholar] [CrossRef] [PubMed]
  3. Scholder, O.; Jefimovs, K.; Shorubalko, I.; Hafner, C.; Sennhauser, U.; Bona, G.L. Helium focused ion beam fabricated plasmonic antennas with sub-5 nm gaps. Nanotechnology 2013, 24, 395301. [Google Scholar] [CrossRef] [PubMed]
  4. Stroscio, J.A.; Eigler, D.M. Atomic and Molecular Manipulation with the Scanning Tunneling Microscope. Science 1991, 254, 1319–1326. [Google Scholar] [CrossRef] [PubMed]
  5. Piner, R.D.; Zhu, J.; Xu, F.; Hong, S.; Mirkin, C.A. “Dip-Pen” Nanolithography. Science 1999, 283, 661–663. [Google Scholar] [CrossRef] [PubMed]
  6. Haynes, C.L.; Van Duyne, R.P. Nanosphere lithography: A versatile nanofabrication tool for studies of size-dependent nanoparticle optics. J. Phys. Chem. B 2001, 105, 5599–5611. [Google Scholar] [CrossRef]
  7. Duval Malinsky, M.; Kelly, K.L.; Schatz, G.C.; Van Duyne, R.P. Nanosphere Lithography: Effect of Substrate on the Localized Surface Plasmon Resonance Spectrum of Silver Nanoparticles. J. Phys. Chem. B 2001, 105, 2343–2350. [Google Scholar] [CrossRef]
  8. Prikulis, J.; Hanarp, P.; Olofsson, L.; Sutherland, D.; Käll, M. Optical Spectroscopy of Nanometric Holes in Thin Gold Films. Nano Lett. 2004, 4, 1003–1007. [Google Scholar] [CrossRef]
  9. Hanarp, P.; Sutherland, D.S.; Gold, J.; Kasemo, B. Control of nanoparticle film structure for colloidal lithography. Colloids Surf. A Physicochem. Eng. Asp. 2003, 214, 23–36. [Google Scholar] [CrossRef]
  10. Xia, Y.; Gates, B.; Yin, Y.; Lu, Y. Monodispersed colloidal spheres: Old materials with new applications. Adv. Mater. 2000, 12, 693–713. [Google Scholar] [CrossRef]
  11. Burmeister, F.; Schäfle, C.; Keilhofer, B.; Bechinger, C.; Boneberg, J.; Leiderer, P. From Mesoscopic to Nanoscopic Surface Structures: Lithography with Colloid Monolayers. Adv. Mater. 1998, 10, 495–497. [Google Scholar] [CrossRef] [Green Version]
  12. Zhang, G.; Wang, D. Colloidal Lithography—The Art of Nanochemical Patterning. Chem. Asian J. 2009, 4, 236–245. [Google Scholar] [CrossRef] [PubMed]
  13. Colson, P.; Henrist, C.; Cloots, R. Nanosphere lithography: A powerful method for the controlled manufacturing of nanomaterials. J. Nanomater. 2013, 2013, 948510. [Google Scholar] [CrossRef]
  14. Gray, J.J.; Bonnecaze, R.T. Adsorption of colloidal particles by Brownian dynamics simulation: Kinetics and surface structures. J. Chem. Phys. 2001, 114, 1366–1381. [Google Scholar] [CrossRef]
  15. Adamczyk, Z.; Warszyński, P. Role of electrostatic interactions in particle adsorption. Adv. Colloid Interface Sci. 1996, 63, 41–149. [Google Scholar] [CrossRef]
  16. Thill, A.; Spalla, O. Aggregation due to capillary forces during drying of particle submonolayers. Colloids Surf. A Physicochem. Eng. Asp. 2003, 217, 143–151. [Google Scholar] [CrossRef]
  17. Whitney, A.V.; Myers, B.D.; Van Duyne, R.P. Sub-100 nm Triangular Nanopores Fabricated with the Reactive Ion Etching Variant of Nanosphere Lithography and Angle-Resolved Nanosphere Lithography. Nano Lett. 2004, 4, 1507–1511. [Google Scholar] [CrossRef]
  18. Freunscht, P.; Van Duyne, R.P.; Schneider, S. Surface-enhanced Raman spectroscopy of trans-stilbene adsorbed on platinum- or self-assembled monolayer-modified silver film over nanosphere surfaces. Chem. Phys. Lett. 1997, 281, 372–378. [Google Scholar] [CrossRef]
  19. Hulteen, J.C.; Young, M.A.; Van Duyne, R.P. Surface-Enhanced Hyper-Raman Scattering (SEHRS) on Ag Film over Nanosphere (FON) Electrodes: Surface Symmetry of Centrosymmetric Adsorbates. Langmuir 2006, 22, 10354–10364. [Google Scholar] [CrossRef] [PubMed]
  20. Stuart, D.A.; Yuen, J.M.; Shah, N.; Lyandres, O.; Yonzon, C.R.; Glucksberg, M.R.; Walsh, J.T.; Van Duyne, R.P. In Vivo Glucose Measurement by Surface-Enhanced Raman Spectroscopy. Anal. Chem. 2006, 78, 7211–7215. [Google Scholar] [CrossRef] [PubMed]
  21. Zhang, X.; Zhao, J.; Whitney, A.V.; Elam, J.W.; Van Duyne, R.P. Ultrastable Substrates for Surface-Enhanced Raman Spectroscopy: Al2O3 Overlayers Fabricated by Atomic Layer Deposition Yield Improved Anthrax Biomarker Detection. J. Am. Chem. Soc. 2006, 128, 10304–10309. [Google Scholar] [CrossRef] [PubMed]
  22. Zheng, Y.B.; Wang, S.J.; Huan, A.C.H.; Wang, Y.H. Fabrication of tunable nanostructure arrays using ion-polishing-assisted nanosphere lithography. J. Appl. Phys. 2006, 99, 034308. [Google Scholar] [CrossRef]
  23. Vogel, N.; Goerres, S.; Landfester, K.; Weiss, C.K. A Convenient Method to Produce Close- and Non-close-Packed Monolayers using Direct Assembly at the Air–Water Interface and Subsequent Plasma-Induced Size Reduction. Macromol. Chem. Phys. 2011, 212, 1719–1734. [Google Scholar] [CrossRef]
  24. Kelf, T.A.; Sugawara, Y.; Cole, R.M.; Baumberg, J.J.; Abdelsalam, M.E.; Cintra, S.; Mahajan, S.; Russell, A.E.; Bartlett, P.N. Localized and delocalized plasmons in metallic nanovoids. Phys. Rev. B 2006, 74, 245415. [Google Scholar] [CrossRef] [Green Version]
  25. Hanarp, P.; Käll, M.; Sutherland, D.S. Optical Properties of Short Range Ordered Arrays of Nanometer Gold Disks Prepared by Colloidal Lithography. J. Phys. Chem. B 2003, 107, 5768–5772. [Google Scholar] [CrossRef]
  26. Langhammer, C.; Yuan, Z.; Zorić, I.; Kasemo, B. Plasmonic Properties of Supported Pt and Pd Nanostructures. Nano Lett. 2006, 6, 833–838. [Google Scholar] [CrossRef] [PubMed]
  27. Fredriksson, H.; Alaverdyan, Y.; Dmitriev, A.; Langhammer, C.; Sutherland, D.S.; Zäch, M.; Kasemo, B. Hole-mask colloidal lithography. Adv. Mater. 2007, 19, 4297–4302. [Google Scholar] [CrossRef]
  28. Rindzevicius, T.; Alaverdyan, Y.; Dahlin, A.; Höök, F.; Sutherland, D.S.; Käll, M. Plasmonic Sensing Characteristics of Single Nanometric Holes. Nano Lett. 2005, 5, 2335–2339. [Google Scholar] [CrossRef] [PubMed]
  29. Murray-Methot, M.P.; Menegazzo, N.; Masson, J.F. Analytical and physical optimization of nanohole-array sensors prepared by modified nanosphere lithography. Analyst 2008, 133, 1714–1721. [Google Scholar] [CrossRef] [PubMed]
  30. Park, J.-E.; Jung, Y.; Kim, M.; Nam, J.-M. Quantitative Nanoplasmonics. ACS Cent. Sci. 2018, 4, 1303–1314. [Google Scholar] [CrossRef] [PubMed]
  31. Junesch, J.; Sannomiya, T.; Dahlin, A.B. Optical properties of nanohole arrays in metal-dielectric double films prepared by mask-on-metal colloidal lithography. ACS Nano 2012, 11, 10405–10415. [Google Scholar] [CrossRef] [PubMed]
  32. Patoka, P.; Giersig, M. Self-assembly of latex particles for the creation of nanostructures with tunable plasmonic properties. J. Mater. Chem. 2011, 21, 16783–16796. [Google Scholar] [CrossRef]
  33. Ai, B.; Zhao, Y. Glancing angle deposition meets colloidal lithography: A new evolution in the design of nanostructures. Nanophotonics 2018. [Google Scholar] [CrossRef]
  34. Alkaisi, M.M.; Blaikie, R.J.; McNab, S.J.; Cheung, R.; Cumming, D.R.S. Sub-diffraction-limited patterning using evanescent near-field optical lithography. Appl. Phys. Lett. 1999, 75, 3560–3562. [Google Scholar] [CrossRef]
  35. Luo, X.; Ishihara, T. Subwavelength photolithography based on surface-plasmon polariton resonance. Opt. Express 2004, 12, 3055–3065. [Google Scholar] [CrossRef] [PubMed]
  36. Gong, Y.; Joly, A.G.; El-Khoury, P.Z.; Hess, W.P. Interferometric Plasmonic Lensing with Nanohole Arrays. J. Phys. Chem. Lett. 2014, 5, 4243–4248. [Google Scholar] [CrossRef] [PubMed]
  37. Huang, F.M.; Zheludev, N.; Chen, Y.; de Abajo, F. Focusing of light by a nanohole array. Appl. Phys. Lett. 2007, 90, 091119. [Google Scholar] [CrossRef] [Green Version]
  38. Stuart, D.A.; Haes, A.J.; Yonzon, C.R.; Hicks, E.M.; Duyne, R.P. Van Biological applications of localised surface plasmonic phenomenae. IEE Proc. Nanobiotechnol. 2005, 152, 13–32. [Google Scholar] [CrossRef] [PubMed]
  39. Anderson, D.J.; Moskovits, M. A SERS-Active System Based on Silver Nanoparticles Tethered to a Deposited Silver Film. J. Phys. Chem. B 2006, 110, 13722–13727. [Google Scholar] [CrossRef] [PubMed]
  40. Liu, Y.; Blair, S. Fluorescence enhancement from an array of subwavelength metal apertures. Opt. Lett. 2003, 28, 507–509. [Google Scholar] [CrossRef] [PubMed]
  41. Garrett, S.H.; Smith, L.H.; Barnes, W.L. Fluorescence in the presence of metallic hole arrays. J. Mod. Opt. 2005, 52, 1105–1122. [Google Scholar] [CrossRef]
  42. Brolo, A.G.; Kwok, S.C.; Moffitt, M.G.; Gordon, R.; Riordon, J.; Kavanagh, K.L. Enhanced Fluorescence from Arrays of Nanoholes in a Gold Film. J. Am. Chem. Soc. 2005, 127, 14936–14941. [Google Scholar] [CrossRef] [PubMed]
  43. Blanchard-Dionne, A.-P.; Meunier, M. Sensing with periodic nanohole arrays. Adv. Opt. Photonics 2017, 9, 891–940. [Google Scholar] [CrossRef]
  44. Yesilkoy, F.; Terborg, R.A.; Pello, J.; Belushkin, A.A.; Jahani, Y.; Pruneri, V.; Altug, H. Phase-sensitive plasmonic biosensor using a portable and large field-of-view interferometric microarray imager. Light Sci. Appl. 2018, 7, 17152. [Google Scholar] [CrossRef] [PubMed] [Green Version]
  45. Gordon, R.; Sinton, D.; Kavanagh, K.L.; Brolo, A.G. A New Generation of Sensors Based on Extraordinary Optical Transmission. Acc. Chem. Res. 2008, 41, 1049–1057. [Google Scholar] [CrossRef] [PubMed]
  46. Brolo, A.G.; Gordon, R.; Leathem, B.; Kavanagh, K.L. Surface Plasmon Sensor Based on the Enhanced Light Transmission through Arrays of Nanoholes in Gold Films. Langmuir 2004, 20, 4813–4815. [Google Scholar] [CrossRef] [PubMed]
  47. Dahlin, A.; Zäch, M.; Rindzevicius, T.; Käll, M.; Sutherland, D.S.; Höök, F. Localized Surface Plasmon Resonance Sensing of Lipid-Membrane-Mediated Biorecognition Events. J. Am. Chem. Soc. 2005, 127, 5043–5048. [Google Scholar] [CrossRef] [PubMed]
  48. Ebbesen, T.W.; Lezec, H.J.; Ghaemi, H.F.; Thio, T.; Wolff, P.A. Extraordinary optical transmission through sub-wavelength hole arrays. Nature 1998, 391, 667–669. [Google Scholar] [CrossRef]
  49. Genet, C.; Ebbesen, T.W. Light in tiny holes. Nature 2007, 445, 39–46. [Google Scholar] [CrossRef] [PubMed]
  50. Bethe, H.A. Theory of Diffraction by Small Holes. Phys. Rev. 1944, 66, 163–182. [Google Scholar] [CrossRef]
  51. Garcia-Vidal, F.J.; Martin-Moreno, L.; Ebbesen, T.W.; Kuipers, L. Light passing through subwavelength apertures. Rev. Mod. Phys. 2010, 82, 729–787. [Google Scholar] [CrossRef] [Green Version]
  52. Ghaemi, H.F.; Thio, T.; Grupp, D.E.; Ebbesen, T.W.; Lezec, H.J. Surface plasmons enhance optical transmission through subwavelength holes. Phys. Rev. B 1998, 58, 6779–6782. [Google Scholar] [CrossRef]
  53. Sarrazin, M.; Vigneron, J.-P.; Vigoureux, J.-M. Role of Wood anomalies in optical properties of thin metallic films with a bidimensional array of subwavelength holes. Phys. Rev. B 2003, 67, 085415. [Google Scholar] [CrossRef]
  54. Genet, C.; van Exter, M.P.; Woerdman, J.P. Fano-type interpretation of red shifts and red tails in hole array transmission spectra. Opt. Commun. 2003, 225, 331–336. [Google Scholar] [CrossRef] [Green Version]
  55. Sannomiya, T.; Scholder, O.; Jefimovs, K.; Hafner, C.; Dahlin, A.B. Investigation of Plasmon Resonances in Metal Films with Nanohole Arrays for Biosensing Applications. Small 2011, 7, 1653–1663. [Google Scholar] [CrossRef] [PubMed]
  56. Xiong, K.; Emilsson, G.; Dahlin, A.B. Biosensing using plasmonic nanohole arrays with small, homogenous and tunable aperture diameters. Analyst 2016, 141, 3803–3810. [Google Scholar] [CrossRef] [PubMed]
  57. Doskaliuk, N.M.; Fochuk, P.M.; Khalavka, Y.B. Effect of Conditions for Formation of Nanocomposite Films of Poly (Diallyldimethylammonium Chloride)—CdTe/CdS Nanocrystals on Their Structure and Optical Density. Theor. Exp. Chem. 2016, 52, 85–89. [Google Scholar] [CrossRef]
  58. Syrenova, S.; Wadell, C.; Langhammer, C. Shrinking-Hole Colloidal Lithography: Self-Aligned Nanofabrication of Complex Plasmonic Nanoantennas. Nano Lett. 2014, 14, 2655–2663. [Google Scholar] [CrossRef] [PubMed]
  59. Lvov, Y.M.; Rusling, J.F.; Thomsen, D.L.; Papadimitrakopoulos, F.; Kawakami, T.; Kunitake, T. High-speed multilayer film assembly by alternate adsorption of silica nanoparticles and linear polycation. Chem. Commun. 1998, 1229–1230. [Google Scholar] [CrossRef]
  60. Zheng, P.; Cushing, S.K.; Suri, S.; Wu, N. Tailoring plasmonic properties of gold nanohole arrays for surface-enhanced Raman scattering. Phys. Chem. Chem. Phys. 2015, 17, 21211–21219. [Google Scholar] [CrossRef] [PubMed] [Green Version]
  61. Braun, J.; Gompf, B.; Kobiela, G.; Dressel, M. How Holes Can Obscure the View: Suppressed Transmission through an Ultrathin Metal Film by a Subwavelength Hole Array. Phys. Rev. Lett. 2009, 103, 203901. [Google Scholar] [CrossRef] [PubMed]
  62. Murray, W.A.; Astilean, S.; Barnes, W.L. Transition from localized surface plasmon resonance to extended surface plasmon-polariton as metallic nanoparticles merge to form a periodic hole array. Phys. Rev. B 2004, 69, 165407. [Google Scholar] [CrossRef]
  63. Spevak, I.S.; Nikitin, A.Y.; Bezuglyi, E.V.; Levchenko, A.; Kats, A.V. Resonantly suppressed transmission and anomalously enhanced light absorption in periodically modulated ultrathin metal films. Phys. Rev. B 2009, 79, 161406. [Google Scholar] [CrossRef]
  64. Parsons, J.; Hendry, E.; Burrows, C.P.; Auguié, B.; Sambles, J.R.; Barnes, W.L. Localized surface-plasmon resonances in periodic nondiffracting metallic nanoparticle and nanohole arrays. Phys. Rev. B 2009, 79, 73412. [Google Scholar] [CrossRef] [Green Version]
  65. Yang, F.; Sambles, J.R.; Bradberry, G.W. Long-range surface modes supported by thin films. Phys. Rev. B 1991, 44, 5855–5872. [Google Scholar] [CrossRef]
  66. Reilly, T.H.; Tenent, R.C.; Barnes, T.M.; Rowlen, K.L.; van de Lagemaat, J. Controlling the Optical Properties of Plasmonic Disordered Nanohole Silver Films. ACS Nano 2010, 4, 615–624. [Google Scholar] [CrossRef] [PubMed]
  67. Lee, S.H.; Lindquist, N.C.; Wittenberg, N.J.; Jordan, L.R.; Oh, S.-H. Real-time full-spectral imaging and affinity measurements from 50 microfluidic channels using nanohole surface plasmon resonance. Lab Chip 2012, 12, 3882–3890. [Google Scholar] [CrossRef] [PubMed]
  68. Malinsky, M.D.; Kelly, K.L.; Schatz, G.C.; Van Duyne, R.P. Chain Length Dependence and Sensing Capabilities of the Localized Surface Plasmon Resonance of Silver Nanoparticles Chemically Modified with Alkanethiol Self-Assembled Monolayers. J. Am. Chem. Soc. 2001, 123, 1471–1482. [Google Scholar] [CrossRef]
  69. Ohno, T.; Wadell, C.; Inagaki, S.; Shi, J.; Nakamura, Y.; Matsushita, S.; Sannomiya, T. Hole-size tuning and sensing performance of hexagonal plasmonic nanohole arrays. Opt. Mater. Express 2016, 6, 1594–1603. [Google Scholar] [CrossRef]
  70. Bochenkov, V.E.; Frederiksen, M.; Sutherland, D.S. Enhanced refractive index sensitivity of elevated short-range ordered nanohole arrays in optically thin plasmonic Au films. Opt. Express 2013, 21, 14763–14770. [Google Scholar] [CrossRef] [PubMed]
  71. Cheng, K.; Wang, S.; Cui, Z.; Li, Q.; Dai, S.; Du, Z. Large-scale fabrication of plasmonic gold nanohole arrays for refractive index sensing at visible region. Appl. Phys. Lett. 2012, 100, 253101. [Google Scholar] [CrossRef]
  72. Nikolaides, M.G.; Bausch, A.R.; Hsu, M.F.; Dinsmore, A.D.; Brenner, M.P.; Gay, C.; Weitz, D.A. Electric-field-induced capillary attraction between like-charged particles at liquid interfaces. Nature 2002, 420, 299–301. [Google Scholar] [CrossRef] [PubMed]
  73. Plettl, A.; Enderle, F.; Saitner, M.; Manzke, A.; Pfahler, C.; Wiedemann, S.; Ziemann, P. Non-close packed crystals from self-assembled polystyrene spheres by isotropic plasma etching: Adding flexibility to colloidal lithography. Adv. Funct. Mater. 2009, 19, 3279–3284. [Google Scholar] [CrossRef]
  74. Blattler, T.M.; Binkert, A.; Zimmermann, M.; Textor, M.; Vörös, J.; Reimhult, E. From particle self-assembly to functionalized sub-micron protein pattern. Nanotechnology 2008, 19, 075301. [Google Scholar] [CrossRef] [PubMed]
  75. Qin, L.D.; Zou, S.L.; Xue, C.; Atkinson, A.; Schatz, G.C.; Mirkin, C.A. Designing, fabricating and imaging Raman hot spots. Proc. Natl. Acad. Sci. USA 2006, 103, 13300–13303. [Google Scholar] [CrossRef] [PubMed]
  76. Zhao, L.L.; Kelly, K.L.; Schatz, G.C. The extinction spectra of silver nanoparticles arrays: Influence of array structure on plasmon resonance wavelength and width. J. Phys. Chem. B 2003, 107, 7343–7350. [Google Scholar] [CrossRef]
  77. Pacifici, D.; Lezec, H.J.; Sweatlock, L.A.; Walters, R.J.; Atwater, H.A. Universal optical transmission features in periodic and quasiperiodic hole arrays. Opt. Express 2008, 16, 9222–9238. [Google Scholar] [CrossRef] [PubMed]
  78. Oberholzer, M.R.; Stankovich, J.M.; Carnie, S.L.; Chan, D.Y.C.; Lenhoff, A.M. 2-D and 3-D interactions in Random Sequential Adsorption of charged particles. J. Colloid Interface Sci. 1997, 194, 138–153. [Google Scholar] [CrossRef] [PubMed]
  79. Rakers, S.; Chi, L.F.; Fuchs, H. Influence of the evaporation rate on the packing order of polydisperse latex monofilms. Langmuir 1997, 13, 7121–7124. [Google Scholar] [CrossRef]
  80. Kumar, R.; Mujumdar, S. Intensity correlations in metal films with periodic-on-average random nanohole arrays. Opt. Commun. 2016, 380, 174–178. [Google Scholar] [CrossRef]
  81. Correia-Ledo, D.; Gibson, K.F.; Dhawan, A.; Couture, M.; Vo-Dinh, T.; Graham, D.; Masson, J.-F. Assessing the location of surface plasmons over nanotriangle and nanohole arrays of different size and periodicity. J. Phys. Chem C 2012, 116, 6884–6892. [Google Scholar] [CrossRef] [PubMed]
  82. Blanchard-Dionne, A.-P.; Meunier, M. Multiperiodic nanohole array for high precision sensing. Nanophotonics 2019, 8, 325–329. [Google Scholar] [CrossRef]
  83. Carney, D.J.; Svavarsson, H.G.; Hemmati, H.; Fannin, A.; Yoon, J.W.; Magnusson, R. Refractometric Sensing with Periodic Nano-Indented Arrays: Effect of Structural Dimensions. Sensors 2019, 19, 897. [Google Scholar] [CrossRef] [PubMed]
  84. Lopez, G.A.; Estevez, M.C.; Soler, M.; Lechuga, L.M. Recent advances in nanoplasmonic biosensors: Applications and lab-on-a-chip integration. Nanophotonics 2017, 6, 123–136. [Google Scholar] [CrossRef]
  85. Escobedo, C. On-chip nanohole array based sensing: A review. Lab Chip 2013, 13, 2445–2463. [Google Scholar] [CrossRef] [PubMed]
Figure 1. (a) Schematic illustration of the self-assembly at an air/water interface. The water surface is used as a medium to facilitate the self-assembly, then a peristaltic pump is used to slowly remove the water and transfer the ordered close packed array (CPA) monolayer onto a solid substrate located on the bottom of the trough. (b) Sketch of the multistep colloidal lithography protocol implemented to fabricate short-range ordered NH arrangements. Left panel: distributions of polystyrene nanospheres self-assembled electrostatically onto a collector PDDA monolayer. Middle panel: removal of the gold-capped colloids by tape stripping. Right panel: supported gold film perforated with short-range ordered nanoholes (NHs).
Chemosensors 07 00013 g001
Figure 2. (a) Plasma processing to reduce the size of the adsorbed colloids and metal evaporation. (b,c) Atomic force microscopy (AFM) and (d) scanning electron microscopy (SEM) images of the polystyrene masks resulting from the treatments in figure (a). The scale bar is 2 µm.
Chemosensors 07 00013 g002
Figure 3. (a) Photograph of the CPA self-assembled monolayer after the transfer onto a glass substrate. AFM images at low (b) and high (c) magnifications of a CPA of polystyrene (PS) particles with a diameter of 500 nm. The scale bars are 2 and 1 μm, respectively.
Chemosensors 07 00013 g003
Figure 4. SEM plan view images of colloidal mask consisting of 80 nm diameter polystyrene spheres deposited under different conditions. Topmost panel: ΔtPDDA = 40 s, ΔtPS = 1 min, and NaCl-added colloidal solution (PS80 (40 s–1 min)NaCl). Middle panel: short-time adsorption of the colloidal mask (PS80 (40–25 s), PS80 (40 s–1 min)). Bottom panel: long-time adsorption of the colloidal mask (PS80 (40 s–5 min), PS80 (40 s–10 min)) leading to saturated adsorption.
Chemosensors 07 00013 g004
Figure 5. (a) Zero-order transmittance spectrum. (b) Dependence on the refractive index of the wavelength position of the transmittance minimum of the of long-range ordered distribution of NHs, with a diameter of 350 nm and periodicity of 500 nm, realized on a 50 nm-thick Au layer.
Chemosensors 07 00013 g005
Figure 6. Transmittance (T), diffused reflectance (R), and absorbance (A = 100-R-T) spectra of the NH samples NH80 (40 s–25 s) (topmost left panel), NH80 (40–1 min) (topmost right panel), NH80 (40 s–5 min) (bottom left panel) and NH80 (40 s–10 min) (bottom right panel), measured under normal incidence conditions.
Chemosensors 07 00013 g006
Figure 7. AFM topography of NH80 (40 s–1 min) (topmost-left panel). Transmittance spectra versus incidence angle of unpolarized exciting light (top-most right panel). Transmission spectra versus incidence angle for two orthogonal linear polarizations of the exciting light (bottom row panels).
Chemosensors 07 00013 g007
Figure 8. Plots showing the linear dependence on the refractive index of the wavelength position of the transmittance minimum of NH80 (40 s–10 min). The estimated sensitivity values are also reported.
Chemosensors 07 00013 g008
Table 1. Colloidal masks deposited by colloidal lithography with the corresponding experimental details and available results of the statistical analysis.
Colloidal MaskDPSΔtPDDAΔtPSdNN
PS80 (40 s–1 min)NaCl80 nm40 s1 minNA
PS80 (40–25 s)80 nm40 s25 s(202 ± 31) nm
PS80 (40 s–1 min)80 nm40 s1 min(203 ± 31) nm
PS80 (40 s–5 min)80 nm40 s5 min(161 ± 32) nm
PS80 (40 s–10 min)80 nm40 s10 min(156 ± 32) nm

