An Electronic Nose Technology to Quantify Pyrethroid Pesticide Contamination in Tea
by
Xiaoyan Tang
1,2, 
Wenmin Xiao
3,
Tao Shang
4,
Shanyan Zhang
1,2,
Xiaoyang Han
1,2,*,
Yuliang Wang
5 and
Haiwei Sun
3 1
College of Horticulture Science and Engineering, Shandong Agriculture University, Taian 271000, China
2
State Key Laboratory of Crop Biology, Taian 271000, China
3
Taian Academy of Agricultural Sciences, Taian 271000, China
4
Taian for Food and Drug Inspection and Detection Institute, Taian 271000, China
5
College of Mechanical and Electronic Engineering, Shandong Agriculture University, Taian 271000, China
*
Author to whom correspondence should be addressed.
Chemosensors 2020, 8(2), 30; https://doi.org/10.3390/chemosensors8020030
Submission received: 18 March 2020
/
Revised: 7 April 2020
/
Accepted: 21 April 2020
/
Published: 23 April 2020
(This article belongs to the Special Issue Chemosensors and Biosensors for Food Quality and Safety)
Abstract
:The contamination of tea with toxic pesticides is a major concern. Additionally, because of improved detection methods, importers are increasingly rejecting contaminated teas. Here, we describe an electronic nose technique for the rapid detection of pyrethroid pesticides (cyhalothrin, bifenthrin, and fenpropathrin) in tea. Using a PEN 3 electronic nose, the text screened a group of metal oxide sensors and determined that four of them (W5S, W1S, W1W, and W2W) are suitable for the detection of the same pyrethroid pesticide in different concentrations and five of them (W5S, W1S, W1W, W2W, and W2S) are suitable for the detection of pyrethroid pesticide. The models for the determination of cyhalothrin, bifenthrin, and fenpropathrin are established by PLS method. Next, using back propagation (BP) neural network technology, we developed a three-hidden-layer model and a two-hidden-layer model to differentiate among the three pesticides. The accuracy of the three models is 96%, 92%, and 88%, respectively. The recognition accuracies of the three-hidden-layer BP neural network pattern and two-hidden-layer BP neural network pattern are 98.75% and 97.08%, respectively. Our electronic nose system accurately detected and quantified pyrethroid pesticides in tea leaves. We propose that this tool is now ready for practical application in the tea industry.
1. Introduction
Awareness of the importance of food safety is growing [1,2,3]. In China, the contamination of tea with toxic pesticides has become a major concern. Additionally, improved methods for the detection of these contaminants have enabled increased testing [4], the stringency of tests, and the rejection of contaminated foods by importers. As the world’s largest producer of tea leaves, exporting ~3 million tons annually, Chinese producers and authorities should be focused on avoiding tea leaf contamination [5]. However, this problem has been largely ignored [6,7,8,9].
Among the pesticides applied to tea crops, pyrethroids are widely used to control smaller green leafhopper, blackthorn whitefly, and aphid pests [10,11]. Gas chromatography (GC), high-performance liquid chromatography (HPLC), and ultra-high-performance liquid chromatography-tandem mass spectrometry are typically used for the detection of pyrethroids contamination in tea products [12,13,14,15,16]. However, these methods are expensive and technically challenging, and therefore are not widely applied.
Electronic nose methods are bionic detection methods that simulate biological olfactory systems. Following further development, these methods are now regarded as fast, simple, and cheap approaches, and they are being adopted in food quality and safety settings, principally in the detection of agricultural residues in fruits and vegetables [17,18,19,20]. Electronic nose methods have not yet been applied to the discovery of pesticide residues in tea.
Here, we investigate the possibility of using electronic nose technology to detect pyrethroid pesticides contamination in tea. We propose an easy-to-use electronic nose system that can detect, differentiate, and quantify three pyrethroid pesticides (cyhalothrin, bifenthrin, and fenpropathrin), which we believe is now ready for industry use.
2. Materials and Methods
2.1. Test Materials
The raw materials of tea tree for test were from antaishan agricultural Co., Ltd. of Taian City, Shandong Province. The samples used in the experiment were fresh tea leaves with one bud and two leaves, which had not been previously sprayed with pesticides. These samples were sprayed with cyhalothrin (2.5% effective content, Nuopuxin Agrochemical Co., Ltd., Shenzhen, China.), bifenthrin (10% effective content, Langfang Pesticide Pilot Plant of the Plant Protection Institute of Chinese Academy of Agricultural Sciences, Langfang, China.), or fenpropathrin (20% effective content, Meilan Agricultural Development Co., Ltd., Haikou, China.). The electronic nose tests were performed immediately after spraying.
2.2. Selection and Optimization of the Electronic Nose Sensor
In the test, the spraying concentration was the maximum residue limit concentration of pesticides in tea, as specified in the three national drug standards (GB 2763-2019) [21]. To test the convenience and accuracy of sampling, this test used a quantitative sampling method, where 3 mL of pesticide was sprayed onto 5 g of tea samples at a time. The erlenmeyer flask was placed in an oven for drying before the start of the test. The drying temperature was 120 degrees, and the drying time was 30 mins. After drying, the absorbent paper and Na2CO3 (use after drying) were put in the bottle to absorb the water in the bottle. Immediately after picking, the tea samples were placed in a conical flask and sealed with tin foil, and the gas detection analysis was performed using the PEN3 portable bionic electronic nose system (PEN3, Airsense Analytics GmbH, Schwerin, Germany ) by headspace aspiration method.
In reference [22], sample quality was controlled at (5.0 ± 1.0) g, the volume of gas collector was 50 mL, headspace preheating temperature was 30°C, headspace time was 30 min, electronic nose detection parameters were sensor cleaning time of 100s, automatic zero setting time was 10 s, sample preparation time was 5 s, sample determination interval time was 1s, internal flow rate was 300 mL/min, and injection flow rate was 300 mL/min. The method described in reference [22] with the parameters of the headspace aspiration method modified was used: the headspace time was 10 min, the volume of the container was 50 mL, and the headspace temperature was 25 °C. The laboratory temperature was about 25°C, the humidity was about 50%, and the atmospheric pressure was 101.325 kpa. The electronic nose detection parameters were sensor cleaning time, 120 s; auto-zero time, 10 s; sample preparation time, 5 s; sample measurement interval, 1 s; internal flow, 300 mL/min; injection flow, 300 mL/min; measurement time, 150 s; and the signal at 145–147 s was used as the time point for sensor signal analysis. The sensor was cleaned and standardized before and after each measurement. Screening and optimization of sensors were performed using load-loading analysis.
2.3. Test Design
As the standards, we used the maximum pesticide residue limit for tea pesticides specified in the national standard [21], and four treatments were set for each pesticide. Cyhalothrin was set at 5, 15, 30, and 60 mg/kg, and bifenthrin and fenpropathrin were set at 2, 5, 10, and 20 mg/kg. Distilled water was used as the control group. Samples were measured using the PEN3 electronic nose system, and each group was repeated five times.
2.4. Data Extraction, Processing, and Model Establishment
2.4.1. Extraction of Data Eigenvalues of the Electronic Nose Sensor
The following electronic nose sensor response value expression method was used: Ri = G/G0, where Ri was the signal ratio of the i-th sensor input, G was the resistance (Ω) of the sensor after contacting the sample volatiles, and G0 was the resistance of the sensor in zero gas (the gas was filtered by standard activated carbon) (Ω).
2.4.2. Data Processing
Loading analysis (LA) was done using the Winmuster software for electronic nose systems. SPSS 16.0 software was used to perform the Principal Component Analysis (PCA) of the optimized sensor response characteristic values, and a Partial Least Squares Regression Algorithm (PLS) was used to establish a prediction model for the concentration of pyrethroids and pesticides. One-way ANOVA analysis by LSD method and t-tests were applied. The BP neural network technology was used to distinguish the types of pyrethroid pesticides.
2.4.3. Model Establishment and Verification
Four concentration gradients were used for each pesticide category, five samples were selected for each concentration gradient, and five samples were selected for the control group (so that 25 samples were used to establish multiple concentration prediction models for the same pyrethroid pesticide). Additionally, 25 samples were randomly selected to verify the correctness of the model. SPSS 16.0 software was used to establish a linear regression model for the concentration gradient discrimination of the same pesticide. By comparing the predicted value of the model with the measured value, we were able to establish the accuracy of the prediction model.
3. Results
3.1. Optimization of the Electronic Nose Sensor
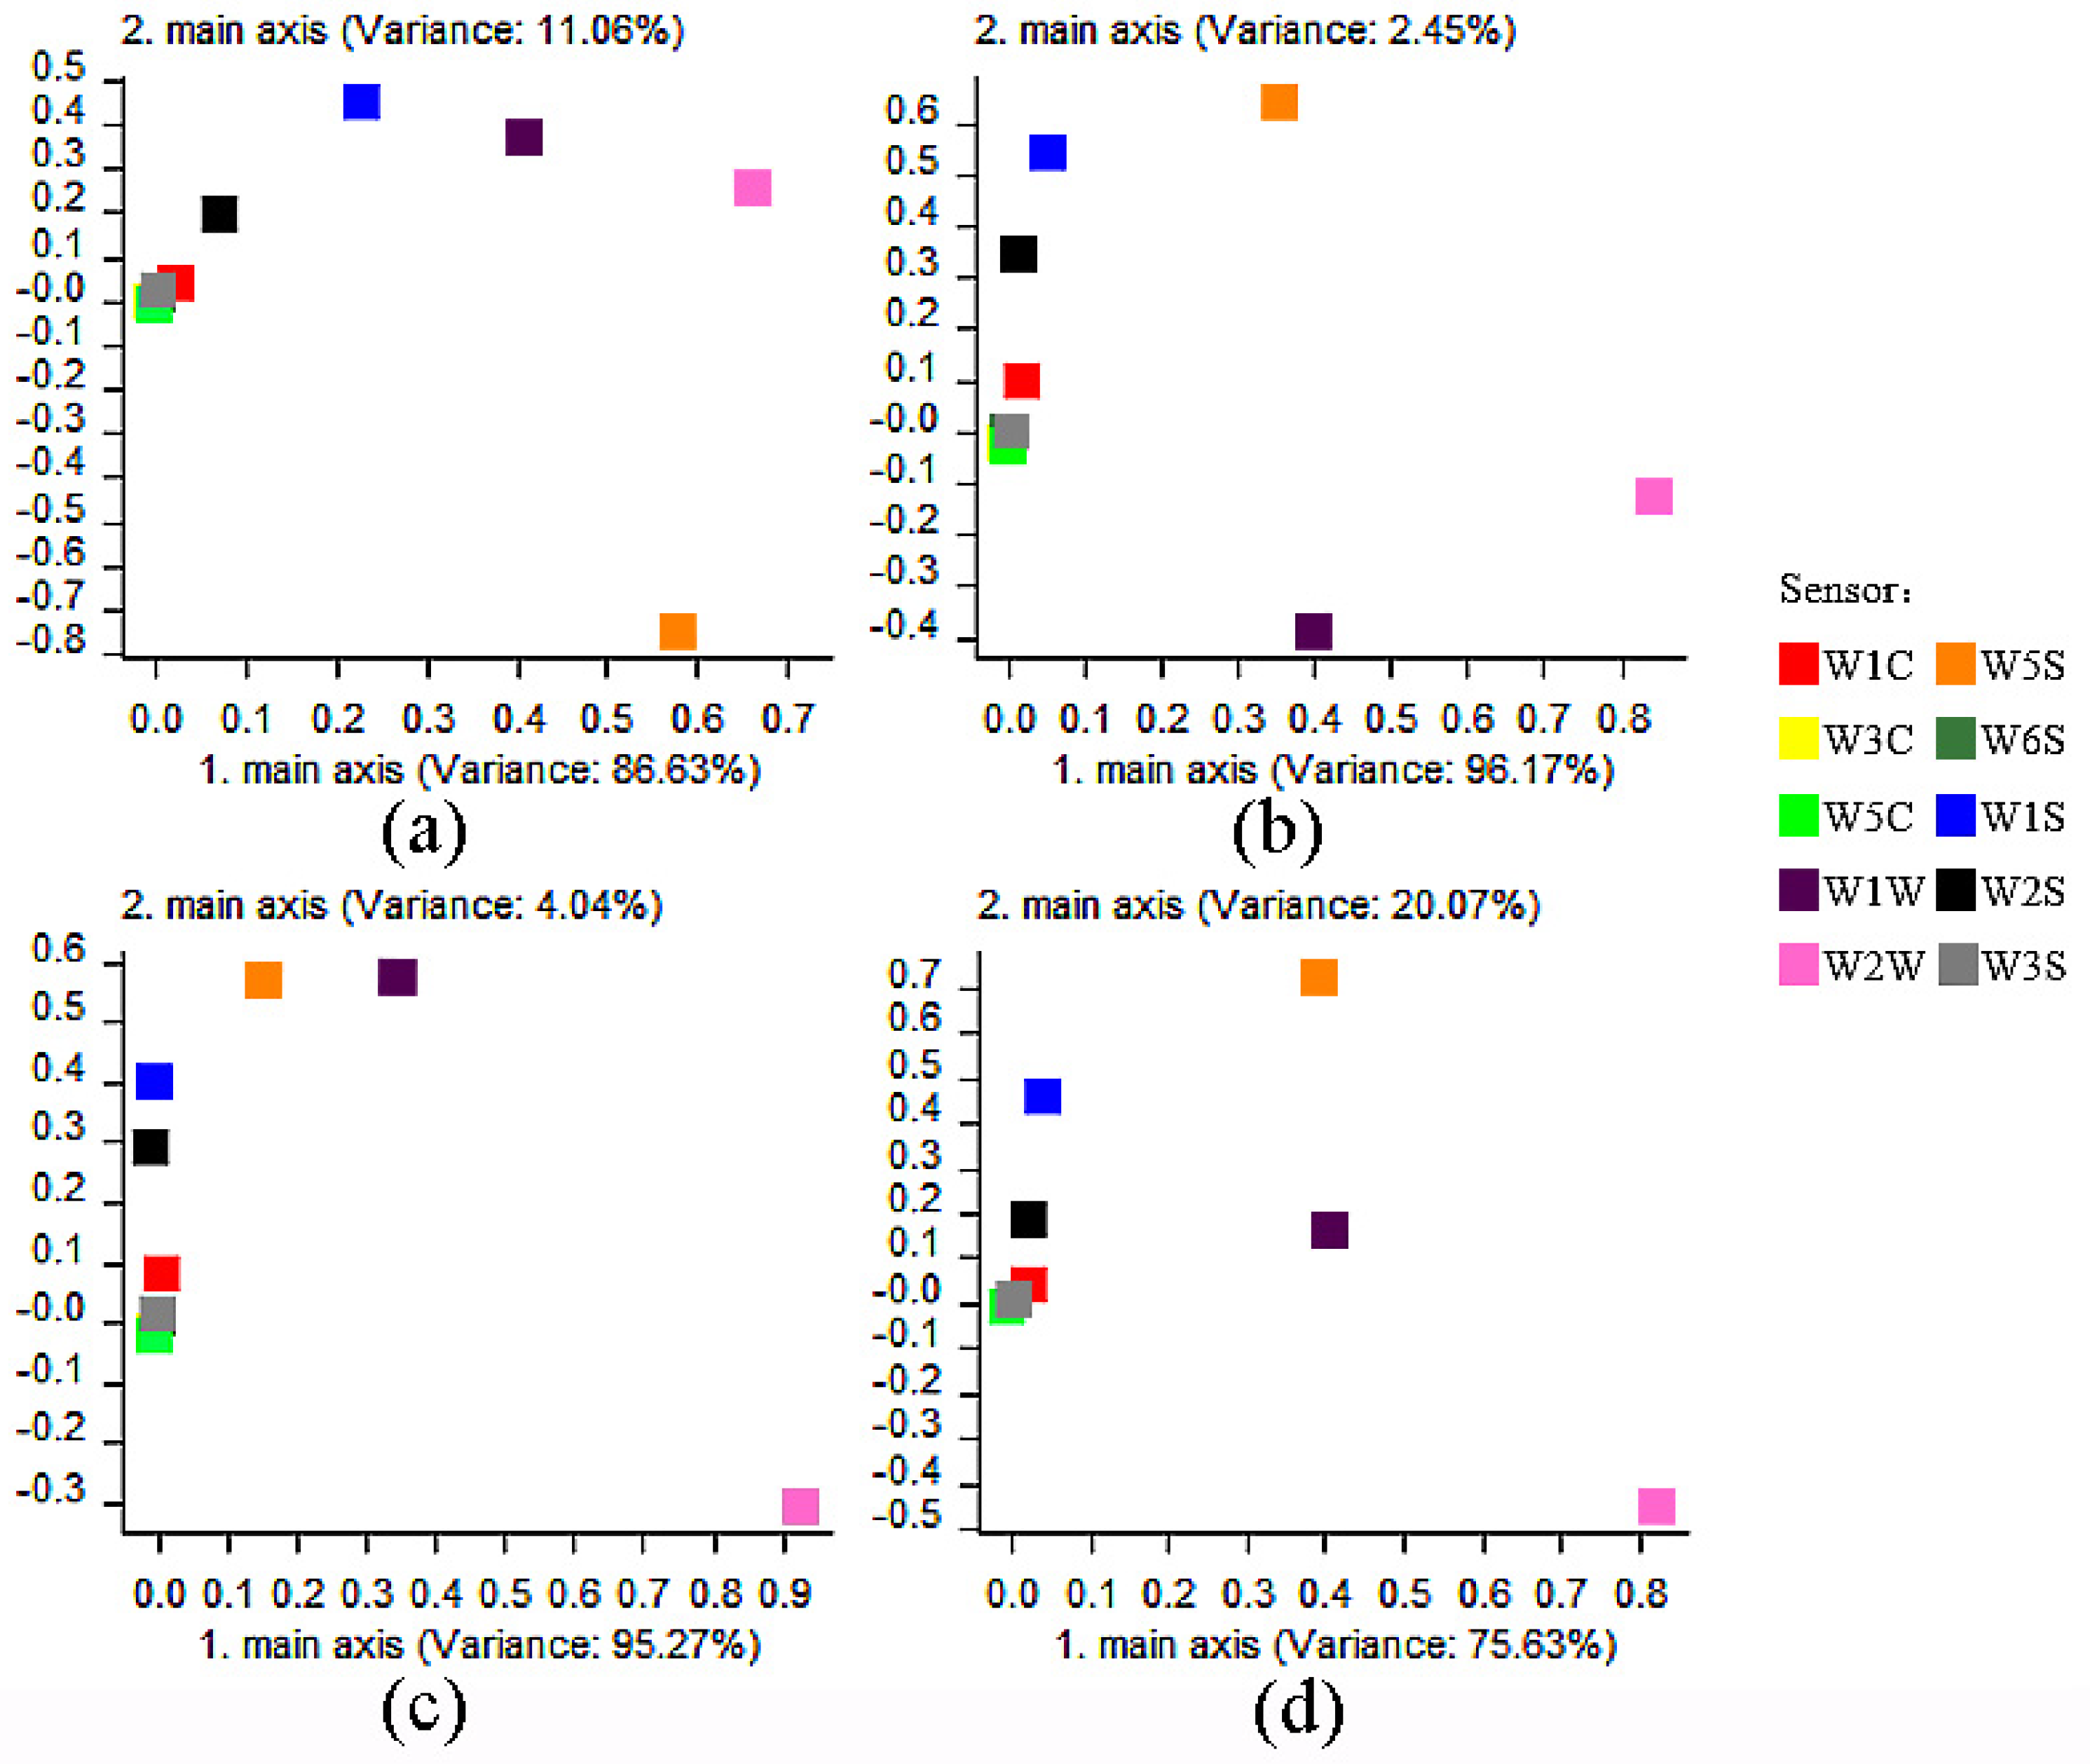
There were 10 metal oxide sensors in the PEN3 electronic nose (designated as W1C, W5S, W3C, W6S, W5C, W1S, W1W, W2S, W2W, and W3S) (Table 1). Loading analysis (LA) was used to investigate the effect of sensors on the spatial distribution of the PCA data, and the sensors’ pesticide distinguishing abilities were determined. Generally, the farther the coordinate value of a sensor was from the origin (0,0), the larger the contribution it had [22]. In LA analysis of three kinds of single pesticides, W5S, W1S, W1W, and W2W sensors were far from the origin, followed by the W2S sensor, while W1C, W3C, W6S, W5C, and W3S sensors were close to the origin (Figure 1a–d). According to the LA analysis, the W5S, W1S, W1W, and W2W sensors made a substantial contribution to the concentration gradient differentiation of cyhalothrin, bifenthrin, and fenpropathrin (Figure 1a–c).
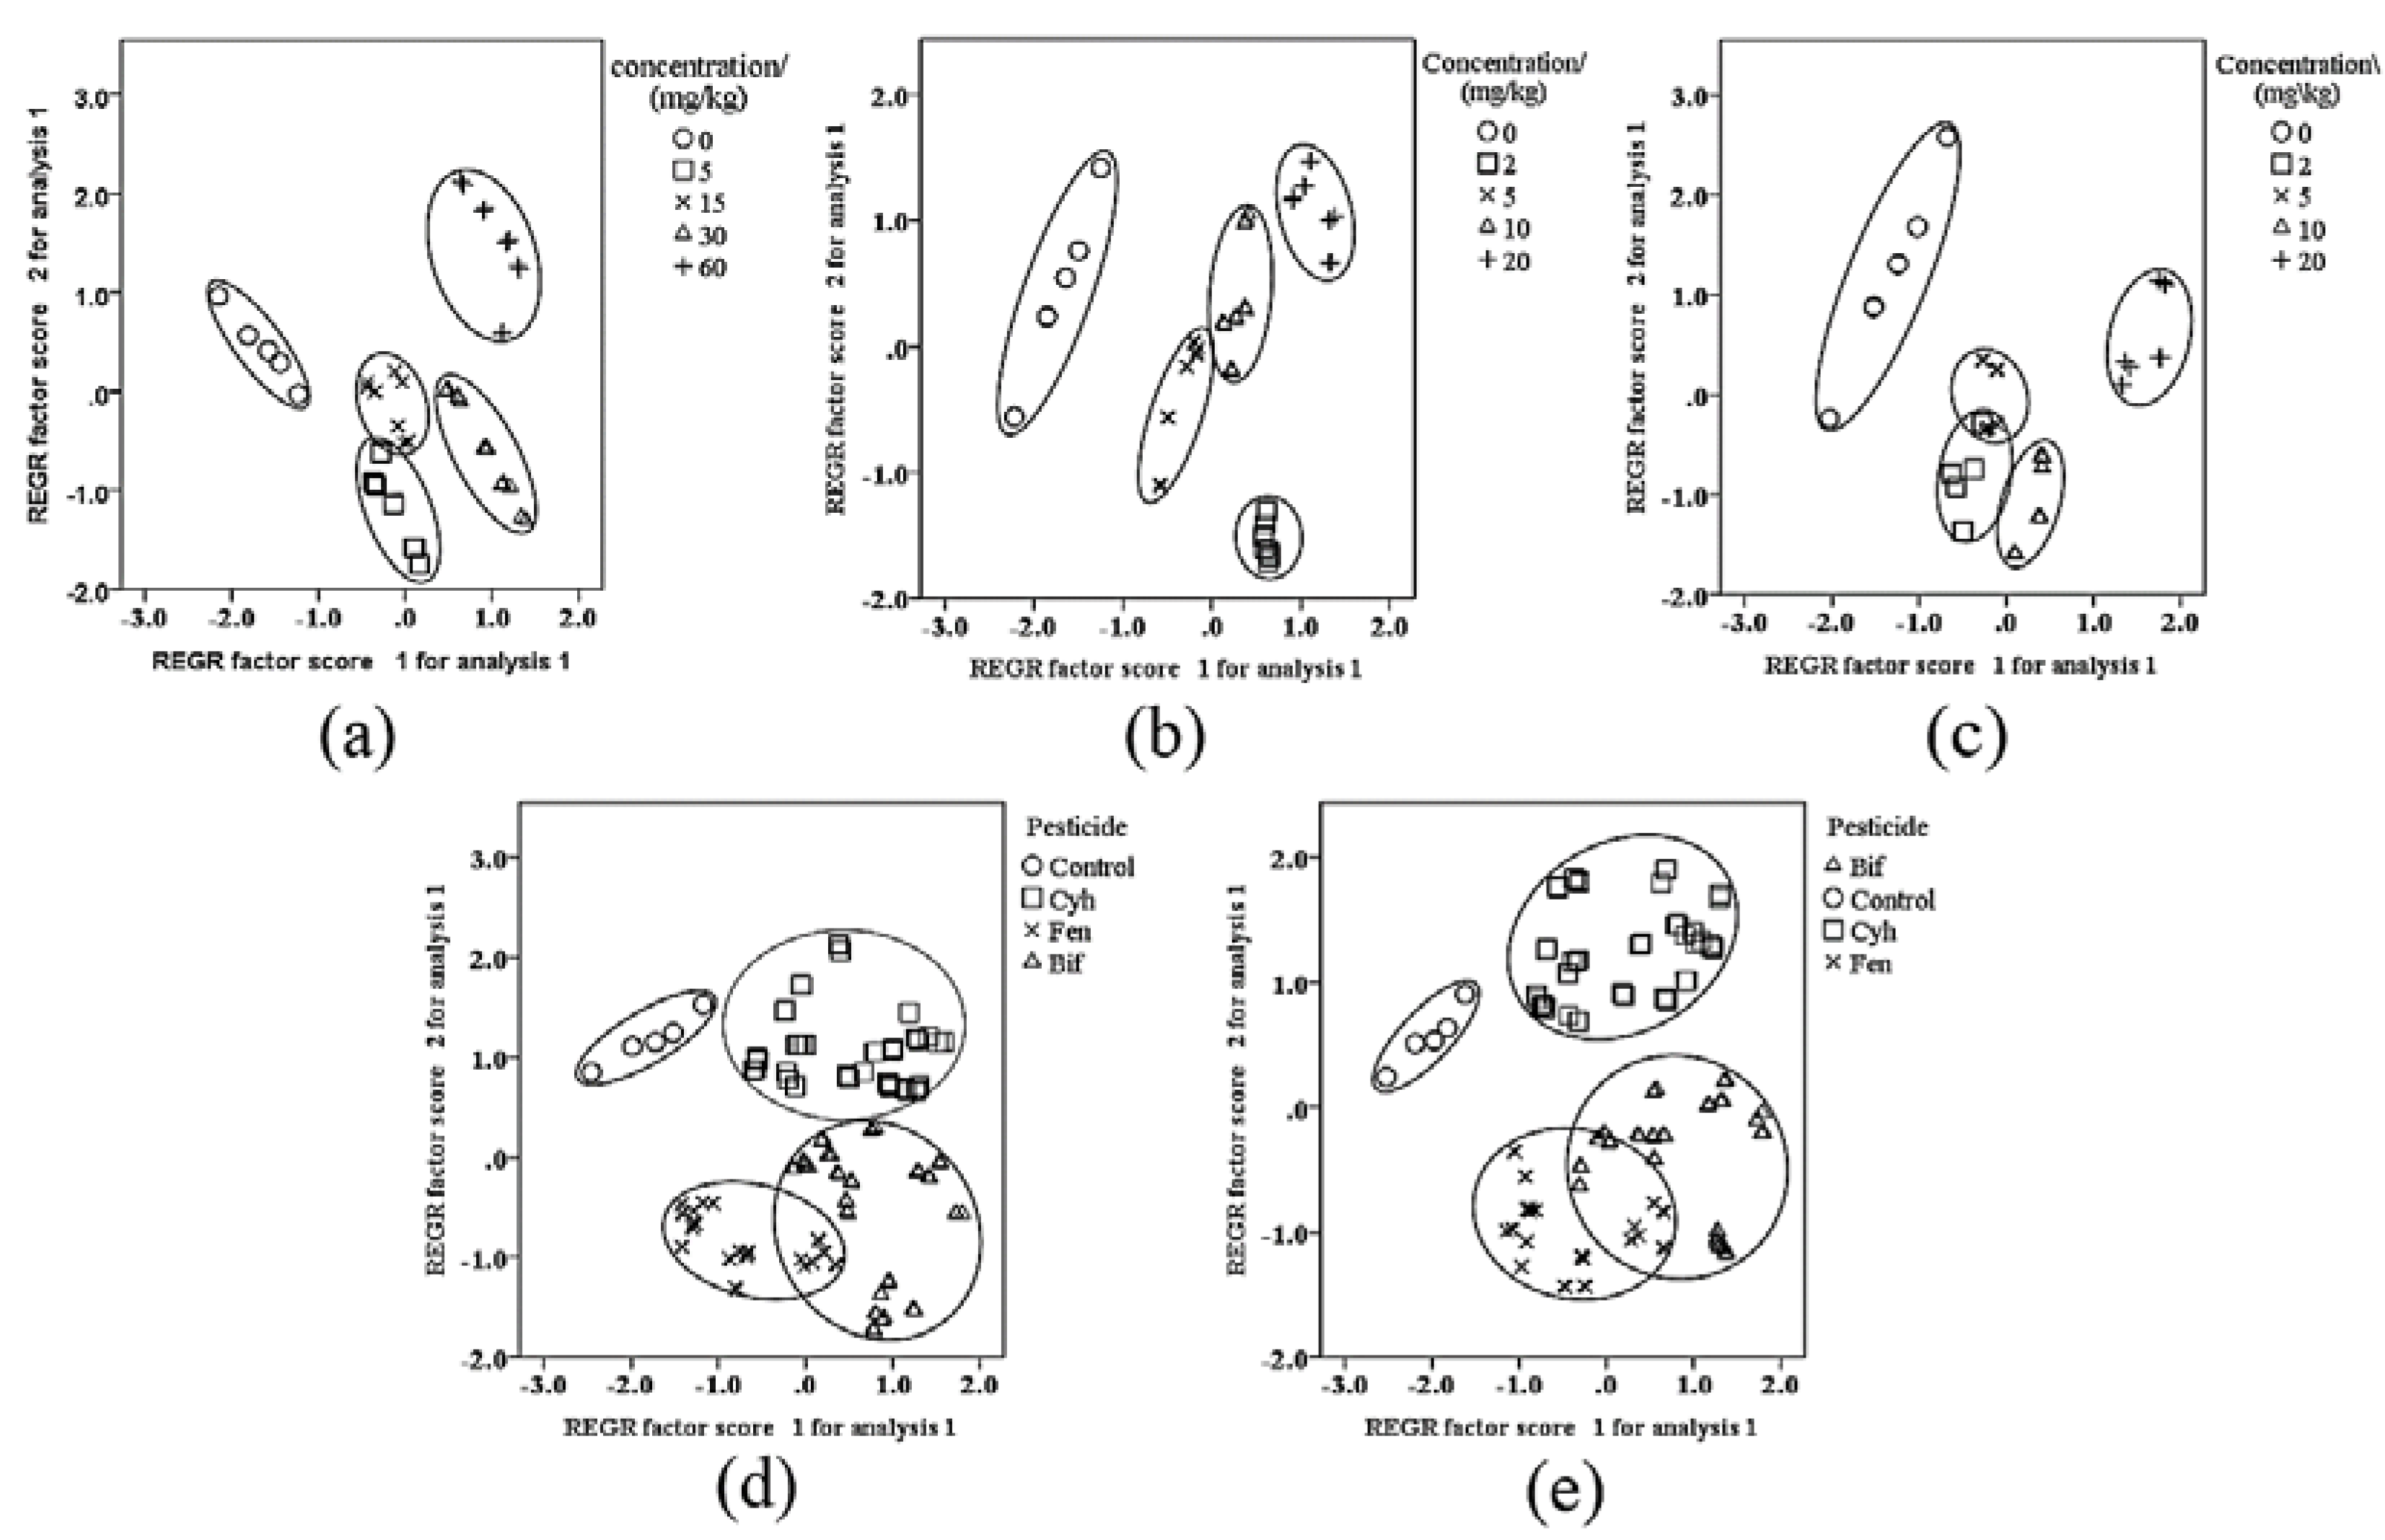
To further verify the accuracy of these sensors, four sensors were used to analyze three pesticides at various concentrations. The W5S, W1S, W1W, and W2W sensors could effectively distinguish the different types and levels of pesticide (Figure 2a–c). Based on this data, we propose that the sensors W5S, W1S, W1W, and W2W could be used as an metal oxide sensor array for concentration discrimination.
Regarding the classification of the three tested pesticides, the sensors W5S, W1S, W1W, and W2W had a larger contribution rate (Figure 1d). To increase the recognition of the sensor, the sensor W2S was added to the observation to distinguish the mixed types. Using PCA analysis to verify the performance of the sensor array, it was found that the overlap area of bifenthrin and fenpropathrin after adding the sensor W2S (Figure 2d) was smaller than that without adding (Figure 2e). Therefore, sensors W5S, W1S, W1W, W2S, and W2W were selected as the sensor arrays for the mixed types.
3.2. Establishment of A Concentration Prediction Model of Pyrethroids
Those sensors with larger response values (W5S, W1S, W1W, and W2W) were selected, and a prediction model of different concentration gradients of the same pesticide was established by the partial least square method (PLS).
- Model I (Cyhalothrin): Y1 = −10.361 + 4.214 G/G0 W5S − 2.951 G/G0 W1S + 0.58 G/G0 W1W + 1.15 G/G0 W2W
- Model II (Bifenthrin): Y2 = −2.459 + 0.038G/G0 W5S + 2.351G/G0 W1S − 4.271G/G0 W1W + 2.364G/G0 W2W
- Model III (Fenpropathrin): Y3 = −5.3.74 + 3.462G/G0 W5S − 2.423G/G0 W1S + 1.386G/G0 W1W − 0.334G/G0 W2W
In the formula, G/G0 W5S, G/G0 W1S, G/G0 W1W, and G/G0 W2W represent the signal response values of the W5S, W1S, W1W, and W2W sensors at the detection time of 145–147 s, respectively. Bringing the sensor response value into the above formula, the Y value obtained was judged as the specific concentration of the pyrethroid pesticide. By Anova, the p-values of models I, II, and III were all less than 0.001 (Table 2), indicating that the PLS regression models were extremely significant.
3.3. Validation of the Content Prediction Model
The accuracies of models I, II, and III were verified using 25 samples of the same pesticide at different concentrations (Table 3). The accuracies of the three models were 96%, 92%, and 88%, respectively. These data show that the model could accurately predict the concentration of pyrethroid pesticide residues in tea leaves.
3.4. Identification of Pesticides by BP Neural Network
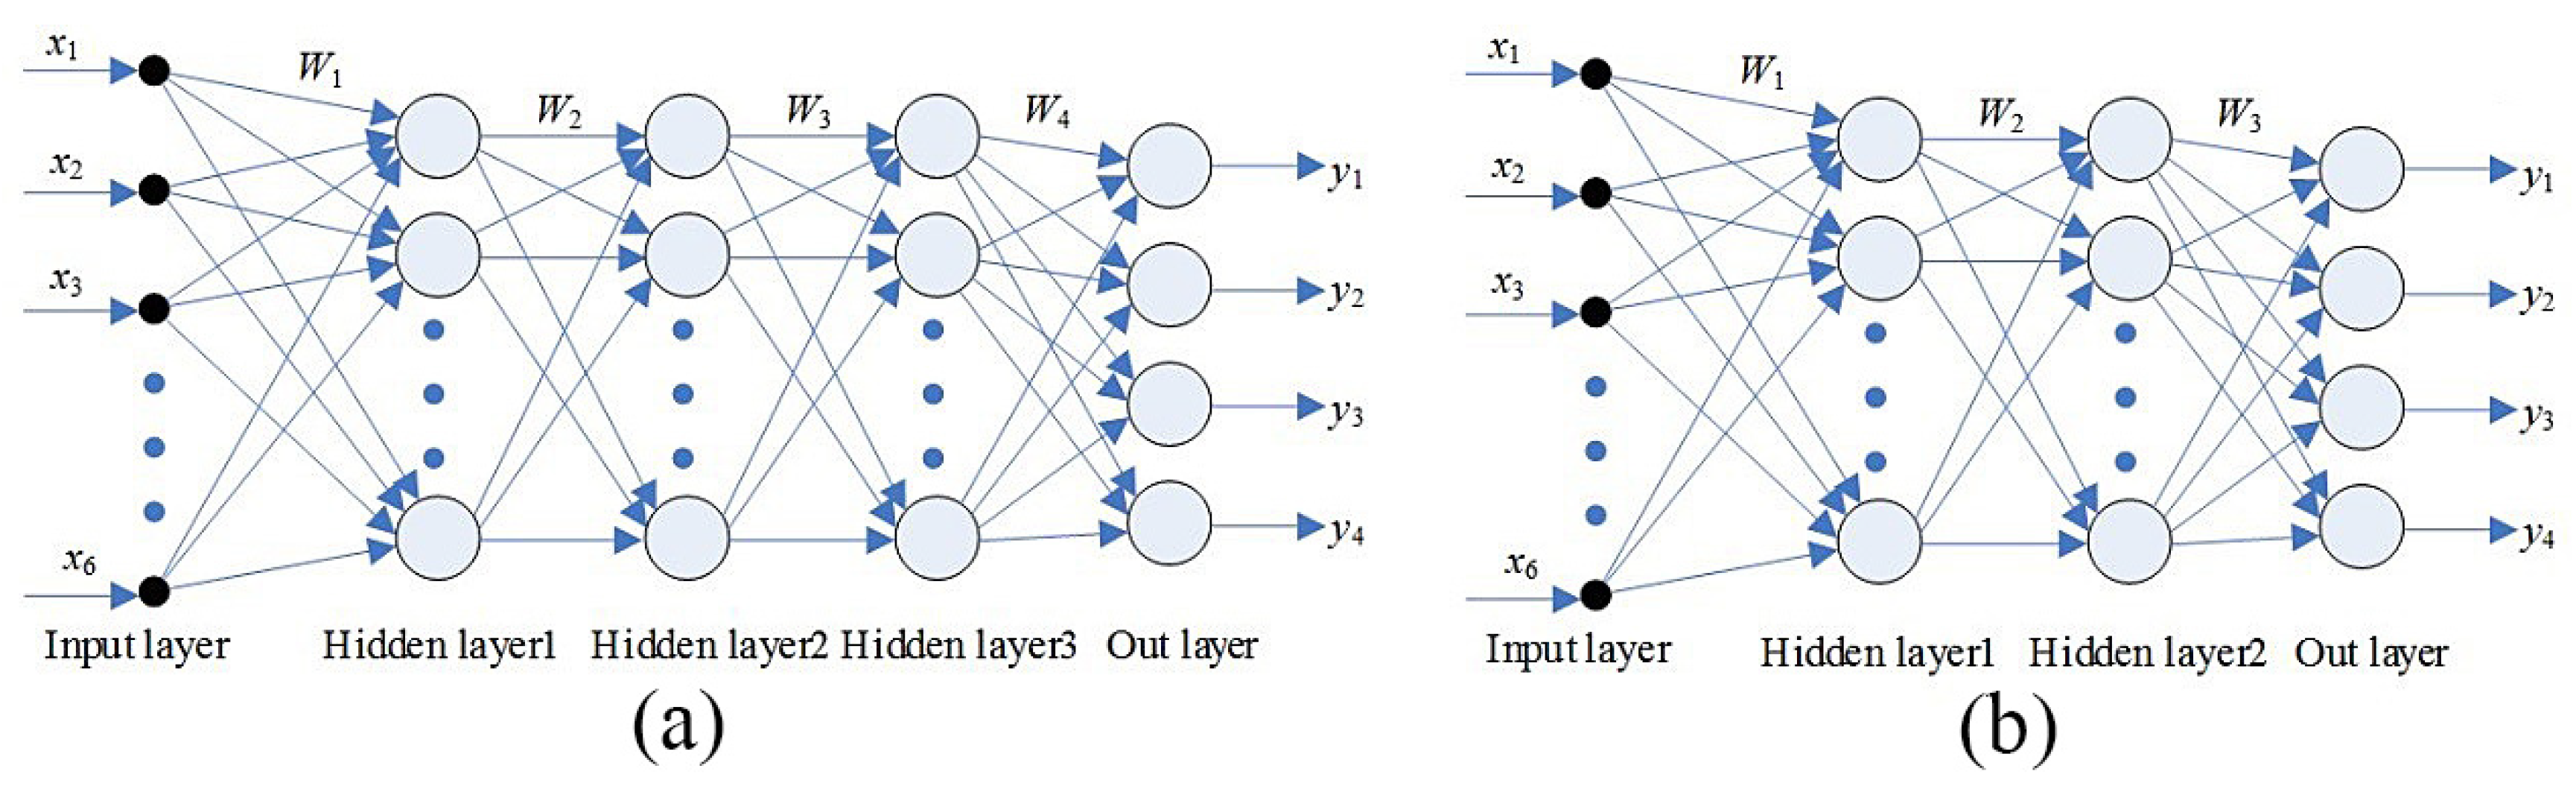
The response values of the five characteristic sensors (W5S, W1S, W1W, W2S, and W2W) were used as the eigenvectors of the BP network. The three-hidden-layer BP neural networks of 6-10-10-10-4 (Figure 3a) and the two-hidden-layer BP neural networks of 6-10-10-4 (Figure 3b) were constructed. The topological structure is shown in Figure 3.
Each processing sample extracts 50 sample feature parameters to normalize the principal component data of sample features. Cross-stored input variables X6 × 200 were used as inputs for three different networks (the sample data of each variety were stored into the input variable X, one by one), and the output variable Y4 × 200 was the variety of the sample corresponding to the input variable X. The network was trained using the momentum descent method and the adaptive learning rate gradient descent method. After 10,000 loop iterations, the characteristic data obtained from the analysis were used to test the trained BP neural network. There was no misrecognition event in the untrained samples in two different BP neural network models, and the number of misrecognition events of training samples when using the three-hidden-layer model was less than that with the two-hidden-layer model (Table 4). Therefore, the method performed the best at the identification of three pyrethroid pesticides.
4. Discussion
So far, electronic nose methods have been mostly limited to the detection of organic phosphorus pesticides [17,18,19] and organic chloride pesticides [20] in fruits and vegetables, achieving detection rates of 80–100%.
Here, we describe an electronic nose system to detect contaminating pyrethroid pesticides in tea leaves. The detection data were analyzed using PCA and BP neural networks, and models were developed to quantify and differentiate among the pyrethroid pesticides. By this approach, optimized electronic nose sensor system could accurately quantify the levels of cyhalothrin, bifenthrin, and fenpropathrin contamination (success rates of 96%, 92%, and 88%) and differentiate among these three pyrethroids (success rates of 98.75% and 97.08% when using three-hidden-layer and two-hidden-layer models, respectively).
During optimization of the electronic nose system, we identified four sensors (designated as W5S, W1S, W1W, and W2W) with higher response values for cyhalothrin, bifenthrin, and fenpropathrin. Although, according to the loading analysis, the characteristic response values of the sensors W2S were all around 0.2–0.3, and the response values were small. However, in the PCA chart without the W2S sensor, the overlap area of bifenthrin and fenpropathrin was larger than that added, so the sensors W5S, W1S, W1W, W2S, and W2W were selected as the primary sensors for better discrimination (Figure 2).
The analysis of the data from the sensor array was divided into two steps: feature extraction and model classification. The feature extraction step describes the entire evolution of the sensor response signal, thus obtaining detailed information about the test sample. The second step relies on classification modeling, an approach that allows robust and reliable inferences to be made for the characteristics of the measured samples [23,24]. However, the current analysis of the latest sensor array data was still not in the created model maintain universality and plasticity [25]. Because the model was strictly related to the sensor, it needed to be replaced or added to the existing primary sensor array [26] for calibration [27]. Therefore, the W2S sensor was selected as one of the primary sensors for the discrimination test of pyrethroid pesticides in this test.
Tea is rich in aromatic substances [28], with more than 80 kinds of volatile aroma substances in fresh tea leaves [29]. Additionally, after picking and spreading, the aromatic substances in tea leaves transform continuously [30,31,32,33]. These naturally occurring volatile aroma substances in tea leaves might interfere with the detection of contaminating pesticides by an electronic nose. Furthermore, current electronic nose systems are susceptible to interference from changes in ambient temperature, humidity, and atmospheric pressure [34]. In this test, the temperature, humidity, and atmospheric pressure of the laboratory were controlled at 25 °C, 50%, and 101.325 kpa, respectively. The picked fresh leaves were tested immediately after treatment to shorten the in vitro time, in order to reduce the interference of fresh leaf odor and environmental changes on the sample.
Therefore, in future work, we intend to test fresh tea leaves using multiple spreading times, analyze the influence of aroma components of fresh leaves on pesticide detection, further optimize the sensor detection system, shorten the measurement time difference between samples, and improve the efficiency of the electronic nose test. These further works will enhance the stability and accuracy of electronic nose technology in tea residue detection. Additionally, we will expand the scope of testing, increase the number of pesticides tested, and use our electronic nose technology to establish a traceability system for pesticide residues in tea.
5. Conclusions
Here, we describe an easy-to-use electronic nose system that can detect, differentiate, and quantify pyrethroid pesticides, which we believe is now ready for industry use. This system is based on four sensors (designated as W5S, W1S, W1W, and W2W) and could quantify cyhalothrin, bifenthrin, and fenpropathrin concentrations, achieving success rates of 96%, 92%, and 88%. Based on five sensors (W5S, W1S, W1W, W2W, and W2S), the BP neural network recognition technology was used to identify the three pesticides. The newly developed three-hidden-layer model and two-hidden-layer model were used to identify the three pesticides, with accuracies of 98.75% and 97.08%, respectively.
Author Contributions
Conceptualization, X.H.; methodology, X.T. and Y.W.; software, Y.W.; validation, H.S.; formal analysis, X.H. and X.T.; investigation, X.T.; W.X. and S.Z.; resources, T.S.; writing-original draft preparation, X.H. and X.T.; writing-review and editing, X.H.; project administration, X.H.; funding acquisition, X.H. All authors have read and agreed to the published version of the manuscript.
Funding
This work was supported by Natural Science Foundation of Shandong Province (No. ZR201807060561), Bonus funds “Double First-Class” initiative of Shandong Province.
Acknowledgments
We would like to thank TopEdit (www.topeditsci.com) for English language editing of this manuscript.
Conflicts of Interest
The authors declare no conflict of interest.
References
- Wong, J.W.; Hennessy, M.K.; Hayward, D.G.; Krynitsky, A.J.; Cassias, I.; Schenck, F.J. Analysis of organophosphorus pesticides in dried ground ginseng root by capillary gas chromatography-mass spectrometry and -flame photometric detection. J. Agric. Food Chem. 2007, 55, 1117–1128. [Google Scholar] [CrossRef] [PubMed]
- Wong, J.W.; Zhang, K.; Shi, F.; Hayward, D.G.; Makovi, C.M.; Krynitsky, A.J.; Tech, K.; Di Benedetto, A.L.; Lee, N.S. Multiresidue Pesticide Analysis of Ginseng and Other Botanical Dietary Supplements. ACS Symp. Ser. 2011, 1081, 333–350. [Google Scholar]
- Feng, J.; Tang, H.; Chen, D.Z.; Li, L. Monitoring and Risk Assessment of Pesticide Residues in Tea Samples from China. Hum. Ecol. Risk Assess. 2015, 21, 169–183. [Google Scholar] [CrossRef]
- Ding, Y.N.; Tong, X.L.; Lai, G.Y.; Xu, D.M.; Lin, L.Y.; Huang, Y.J.; Zhang, Z.G. Study on the limit standards of pesticide residues in tea at home and abroad and the safety of exported tea. Food Safe Qual. Detec. Technol. 2019, 10, 8140–8145. [Google Scholar]
- Liu, Y.; Gao, L. On the problem of pesticide residue limits in expanding tea export and legal countermeasures. Anhui Agric. Sci. Bull. 2017, 23, 3–7. [Google Scholar]
- Zheng, L.Z. Studies on the Impact Factors of Tea Farmers’ Application of Pesticides. Ph.D. Thesis, Fujian agricultural and Forestry University, Fuzhou, China, 2009. [Google Scholar]
- An, Z.Y. Problems in the safe use of pesticides in tea gardens and scientific methods of use. Agric. Dev. Equip. 2016, 3, 143–144. [Google Scholar]
- Wei, G.X.; Huang, J.K.; Yang, J. The impacts of food safety standards on China’s tea exports. China Econ. Rev. 2012, 23, 253–264. [Google Scholar] [CrossRef]
- Chen, J.; Rui, J.M.; Liu, X.R. Analysis of Tea pesticide residue standards and testing methods. In Proceedings of the 2016 6th International Conference on Machinery, Materials, Environment, Biotechnology and Computer (MMEBC), Tianjin, China, 11–12 June 2016; Volume 88, pp. 876–879. [Google Scholar]
- Hua, N.Z. Progress and trend of pyrethroid pesticide. Pestic. Mark. News 2015, 2, 26–28. [Google Scholar]
- Zeng, M.S.; Xia, H.L.; Ma, X.J. Dynamics of degradation of bifenthrin residues in tea plantations and their varieties and regional differences. In Proceedings of the 2012 Agricultural Product Safety and Quality Control Exchange Seminar, BeiJing, China, 16 November 2012. [Google Scholar]
- Kanrar, B.; Mandal, S.; Bhattacharyya, A. Validation and uncertainty analysis of a multiresidue method for 42 pesticides in made tea, tea infusion and spent leaves using ethyl acetate extraction and liquid chromatography-tandem mass spectrometry. J. Chromatogr. A 2010, 1217, 1926–1933. [Google Scholar] [CrossRef]
- Zhang, X.; Mobley, N.; Zang, J.G.; Zheng, X.M.; Lu, L.; Ragin, O.; Smith, C.J. Analysis of Agricultural Residues on Tea Using d-SPE Sample Preparation with GC-NCI-MS and UHPLC-MS/MS. J. Agric. Food Chem. 2010, 58, 11553–11560. [Google Scholar] [CrossRef]
- Deng, X.J.; Guo, Q.J.; Chen, X.P.; Xue, T.; Wang, H.; Yao, P. Rapid and effective sample clean-up based on magnetic multiwalled carbon nanotubes for the determination of pesticide residues in tea by gas chromatography-mass spectrometry. Food Chem. 2014, 145, 853–858. [Google Scholar] [CrossRef] [PubMed]
- Wu, C.C. Multiresidue method for the determination of pesticides in Oolong tea using QuEChERS by gas chromatography-triple quadrupole tandem mass spectrometry. Food Chem. 2017, 229, 530–538. [Google Scholar] [CrossRef] [PubMed]
- Wang, F.Q.; Li, S.H.; Feng, H.; Yang, Y.J.; Xiao, B.; Chen, D.W. An enhanced sensitivity and cleanup strategy for the nontargeted screening and targeted determination of pesticides in tea using modified dispersive solid-phase extraction and cold-induced acetonitrile aqueous two-phase systems coupled with liquid chromatography-high resolution mass spectrometry. Food Chem. 2019, 275, 530–538. [Google Scholar] [PubMed]
- Tan, S.L.; Teo, H.S.; Garcia-Guzman, J. E-nose Screening of Pesticide Residue on Chilli and Double-checked Analysis through Different Data-recognition Algorithms. In Proceedings of the 7th IEEE Electronics, Robotics and Automotive Mechanics Conference(CERMA), SEP 28-OCT 01, Cuernavaca, Mexico, 28 September–1 October 2010. [Google Scholar]
- Wang, C.L.; Huang, W.Y. Electronic nose system for the recognition of pesticides based on the characteristic ratios method. J. Transduct. Technol. 2006, 3, 573–576, 580. [Google Scholar]
- Wang, G.M. Research on Feature Extraction Method in Detection of Pesticide Residues in Vegetables Based on Electronic Nose. Master’s Thesis, Henan University of science and technology, Luoyang, China, 2009. [Google Scholar]
- Ortiz, J.; Gualdron, O.; Duran, C. Detection of pesticide in fruits using an electronic nose. AJBAS 2016, 10, 107–113. [Google Scholar]
- GB 2763-2019 National Food Safety Standard-Maximum Residue Limits for Pesticides in Food. Available online: http://www.nbgen.com/index.php?case=archive&act=show&aid=138 (accessed on 15 March 2020).
- Fu, J.M.; Geng, Q.; Wang, M.K.; Huang, X.Q.; Han, X.Y. Diagnosis of nitrogen nutrition in fresh tea leaves with electronic nose and spectrophotometer. Plant Nutr. Fert. Sci. 2019, 25, 1413–1421. [Google Scholar]
- Gutierrez-Osuna, R.; Nagle, H.T. A method for evaluating data-preprocessing techniques for odor classification with an array of gas sensors. IEEE Trans. Syst. Man Cybern. Part B-Cybern. 1999, 29, 626–632. [Google Scholar] [CrossRef] [Green Version]
- Rogers, P.H.; Benkstein, K.D.; Semancik, S. Machine Learning Applied to Chemical Analysis: Sensing Multiple Biomarkers in Simulated Breath Using a Temperature-Pulsed Electronic-Nose. Anal. Chem. 2012, 84, 9774–9781. [Google Scholar] [CrossRef]
- Martinelli, E.; Magna, G.; Vergara, A.; Di Natale, C. Cooperative classifiers for reconfigurable sensor arrays. Sens. Actuators B Chem. 2014, 199, 83–92. [Google Scholar] [CrossRef]
- Liu, Y.; Wang, F.L.; Chang, Y.Q. Reconstruction in integrating fault spaces for fault identification with kernel independent component analysis. Chem. Eng. Res. Des. 2013, 91, 1071–1084. [Google Scholar] [CrossRef]
- Sisk, B.C.; Lewis, N.S. Comparison of analytical methods and calibration methods for correction of detector response drift in arrays of carbon black-polymer composite vapor detectors. Sens. Actuators B Chem. 2005, 104, 249–268. [Google Scholar] [CrossRef]
- Zheng, X.Q.; Li, Q.S.; Xiang, L.P.; Liang, Y.R. Recent advances in volatiles of teas. Molecules 2016, 21, 338. [Google Scholar] [CrossRef] [PubMed]
- Peluso, I.; Serafini, M. Antioxidants from black and green tea: From dietary modulation of oxidative stress to pharmacological mechanisms. Brit. J. Pharmacol. 2017, 174, 1195–1208. [Google Scholar] [CrossRef] [PubMed] [Green Version]
- Zhang, Z.Z.; Wan, X.C.; Shi, Z.P.; Gao, L.P. Variations of respiration rate, β-Glucosidase activity, volatiles, and glycosidic aroma precursors during spreading fresh tea leaves. Plant Physiol. Comm. 2003, 39, 134–137. [Google Scholar]
- Zheng, P.P.; Ye, F.; Gao, S.W.; Wang, X.P.; Gong, Z.M. Effect of spreading time on aroma components in fresh tea leaves. Chin. Agric. Sci. Bull. 2011, 27, 334–338. [Google Scholar]
- Ho, C.T.; Zheng, X.; Li, S.M. Tea aroma formation. Food Sci. Hum. Wellness 2015, 4, 9–27. [Google Scholar] [CrossRef] [Green Version]
- Han, Z.X.; Rana, M.M.; Liu, G.F.; Gao, M.J.; Li, D.X.; Wu, F.G.; Li, X.B.; Wan, X.C.; Wei, S. Green tea flavour determinants and their changes over manufacturing processes. Food Chem. 2016, 212, 739–748. [Google Scholar] [CrossRef]
- Zhang, W.L.; Tian, F.C.; Song, A.; Hu, Y.W. Research on electronic nose system based on continuous wide spectral gas sensing. Microchem. J. 2018, 140, 1–7. [Google Scholar] [CrossRef]
Figure 1.
Loadings analysis (LA) of 10 sensors for different kinds of pesticides. (a–d) are the load loading analysis of three pyrethroids, i.e., cyhalothrin, bifenthrin, fenpropathrin, and mixture.
Figure 1.
Loadings analysis (LA) of 10 sensors for different kinds of pesticides. (a–d) are the load loading analysis of three pyrethroids, i.e., cyhalothrin, bifenthrin, fenpropathrin, and mixture.

Figure 2.
Principal component analysis (PCA) of odor data of electronic nose at 145-147s. This figure is the principal component analysis of the odor data of electronic nose at 145-147s. (a–c) are PCA analysis charts of cyhalothrin, bifenthrin, and fenpropathrin, respectively. (d) is PCA analysis diagram of pyrethroid pesticide types with sensors W5S, W1S, W1W, W2S, and W2W as main sensors. (e) is PCA analysis diagram of pyrethroid pesticide types with sensors W5S, W1S, W1W, and W2W as main sensors. Control group with distilled water instead of pesticide, Cyh—Cyhalothrin, Fen—Fenpropathrin, and Bif—Bifenthrin.

Figure 3.
Back propogation (BP) neural network structure diagram. (a) is the three-hidden-layer BP neural network pattern structure diagram and (b) is the two-hidden-layer BP neural network pattern structure diagram.
Figure 3.
Back propogation (BP) neural network structure diagram. (a) is the three-hidden-layer BP neural network pattern structure diagram and (b) is the two-hidden-layer BP neural network pattern structure diagram.


Table 1.
Sensor sensitivities of the PEN3 e-nose.
| Sensor Name | Performance Description |
|---|---|
| W1C | Sensitive to aromatic compounds |
| W5S | Very sensitive to oxynitride |
| W3C | Sensitive to ammonia and aromatic compounds such as benzene |
| W6S | Sensitive to hydrogen |
| W5C | Sensitive to alkane such as propane and aromatic compounds |
| W1S | Sensitive to methane |
| W1W | Sensitive to sulfur compounds such as hydrogen sulfide |
| W2S | Sensitive to alcohols and aldehydes and ketones |
| W2W | Sensitive to aromatic compounds and organic sulfur compounds |
| W3S | Sensitive to alkane such as methane |
Table 2.
Analysis of variance of concentration prediction model of pyrethroids. Model I—Cyhalothrin; Model II—Bifenthrin; Model III—Fenpropathrin.
Table 2.
Analysis of variance of concentration prediction model of pyrethroids. Model I—Cyhalothrin; Model II—Bifenthrin; Model III—Fenpropathrin.
| Prediction Model | Item | Square Sum | df | Mean Square | F | P |
|---|---|---|---|---|---|---|
| Model Ⅰ | Regression | 34268.483 | 4 | 8567.121 | 879.946 | 0.000 |
| Residue | 681.517 | 70 | 9.736 | |||
| Total | 34950.000 | 74 | ||||
| Model Ⅱ | Regression | 3741.735 | 4 | 935.434 | 759.061 | 0.000 |
| Residue | 86.265 | 70 | 1.232 | |||
| Total | 3828.000 | 74 | ||||
| Model Ⅲ | Regression | 3765.806 | 4 | 941.451 | 1059.609 | 0.000 |
| Residue | 62.194 | 70 | 0.888 | |||
| Total | 3828.000 | 74 |
Table 3.
Validation of the prediction model of tea pyrethroid pesticide content. Model I—Cyhalothrin; Model II—Bifenthrin; Model III—Fenpropathrin. * Means greater difference between the predicted and measured values.
Table 3.
Validation of the prediction model of tea pyrethroid pesticide content. Model I—Cyhalothrin; Model II—Bifenthrin; Model III—Fenpropathrin. * Means greater difference between the predicted and measured values.
| Sample | ModelⅠ (Cyhalothrin) | ModelⅡ (Bifenthrin) | ModelⅢ (Fenpropathrin) | Actual Concentration (Model Ⅰ\Ⅱ\Ⅲ) |
|---|---|---|---|---|
| 1 | −0.29 | 0.54 | −0.78 | 0\0\0 |
| 2 | 0.77 | −0.23 | 0.51 | 0\0\0 |
| 3 | 0.72 | −0.32 | 0.50 | 0\0\0 |
| 4 | −0.253 | 2.34 * | −0.53 | 0\0\0 |
| 5 | 0.723 | −0.47 | −0.44 | 0\0\0 |
| 6 | 3.25 | 2.33 | −0.05 * | 5\2\2 |
| 7 | 3.78 | 2.54 | 1.56 | 5\2\2 |
| 8 | 3.56 | 2.13 | 2.54 | 5\2\2 |
| 9 | 6.08 | 2.57 | 2.41 | 5\2\2 |
| 10 | 4.47 | 2.33 | 2.62 | 5\2\2 |
| 11 | 15.62 | 4.32 | 5.24 | 15\5\5 |
| 12 | 15.50 | 6.45 | 4.74 | 15\5\5 |
| 13 | 15.03 | 5.87 | 8.32 * | 15\5\5 |
| 14 | 15.59 | 5.38 | 6.12 | 15\5\5 |
| 15 | 14.52 | 4.76 | 5.98 | 15\5\5 |
| 16 | 31.83 | 7.22 * | 10.73 | 30\10\10 |
| 17 | 31.79 | 10.04 | 10.98 | 30\10\10 |
| 18 | 30.93 | 9.61 | 12.04 * | 30\10\10 |
| 19 | 29.33 | 9.76 | 9.17 | 30\10\10 |
| 20 | 29.68 | 9.95 | 9.03 | 30\10\10 |
| 21 | 61.99 | 20.33 | 19.25 | 60\20\20 |
| 22 | 60.67 | 19.44 | 20.97 | 60\20\20 |
| 23 | 60.93 | 20.27 | 20.82 | 60\20\20 |
| 24 | 63.13 * | 19.98 | 19.70 | 60\20\20 |
| 25 | 60.11 | 19.15 | 19.59 | 60\20\20 |
| Accuracy rate: | 96% | 92% | 88% | \ |
Table 4.
Neural network recognition of three kinds of pyrethroid pesticides.
| BP Neural Network Model | Amount of Samples | Number of Training Samples | Number of Untrained Samples | Number of Training Sample Error Recognition | Number of Untrained Sample Error Recognition | Recognition Accuracy/% |
|---|---|---|---|---|---|---|
| Three-hidden-layer | 240 | 200 | 40 | 3 | 0 | 98.75 |
| Two-hidden-layer | 240 | 200 | 40 | 7 | 0 | 97.08 |
© 2020 by the authors. Licensee MDPI, Basel, Switzerland. This article is an open access article distributed under the terms and conditions of the Creative Commons Attribution (CC BY) license (http://creativecommons.org/licenses/by/4.0/).
Share and Cite
MDPI and ACS Style
Tang, X.; Xiao, W.; Shang, T.; Zhang, S.; Han, X.; Wang, Y.; Sun, H. An Electronic Nose Technology to Quantify Pyrethroid Pesticide Contamination in Tea. Chemosensors 2020, 8, 30. https://doi.org/10.3390/chemosensors8020030
AMA Style
Tang X, Xiao W, Shang T, Zhang S, Han X, Wang Y, Sun H. An Electronic Nose Technology to Quantify Pyrethroid Pesticide Contamination in Tea. Chemosensors. 2020; 8(2):30. https://doi.org/10.3390/chemosensors8020030
Chicago/Turabian StyleTang, Xiaoyan, Wenmin Xiao, Tao Shang, Shanyan Zhang, Xiaoyang Han, Yuliang Wang, and Haiwei Sun. 2020. "An Electronic Nose Technology to Quantify Pyrethroid Pesticide Contamination in Tea" Chemosensors 8, no. 2: 30. https://doi.org/10.3390/chemosensors8020030
Note that from the first issue of 2016, this journal uses article numbers instead of page numbers. See further details here.