
Cost-Effective Real-Time Metabolic Profiling of Cancer Cell Lines for Plate-Based Assays


Department of Physiology, Anatomy & Genetics, University of Oxford, Oxford OX1 3PT, UK
*
Author to whom correspondence should be addressed.
†
These authors contributed equally to this work.
Chemosensors 2021, 9(6), 139; https://doi.org/10.3390/chemosensors9060139
Submission received: 18 May 2021
/
Revised: 10 June 2021
/
Accepted: 11 June 2021
/
Published: 13 June 2021
(This article belongs to the Collection pH Sensors, Biosensors and Systems)
Abstract
:A fundamental phenotype of cancer cells is their metabolic profile, which is routinely described in terms of glycolytic and respiratory rates. Various devices and protocols have been designed to quantify glycolysis and respiration from the rates of acid production and oxygen utilization, respectively, but many of these approaches have limitations, including concerns about their cost-ineffectiveness, inadequate normalization procedures, or short probing time-frames. As a result, many methods for measuring metabolism are incompatible with cell culture conditions, particularly in the context of high-throughput applications. Here, we present a simple plate-based approach for real-time measurements of acid production and oxygen depletion under typical culture conditions that enable metabolic monitoring for extended periods of time. Using this approach, it is possible to calculate metabolic fluxes and, uniquely, describe the system at steady-state. By controlling the conditions with respect to pH buffering, O2 diffusion, medium volume, and cell numbers, our workflow can accurately describe the metabolic phenotype of cells in terms of molar fluxes. This direct measure of glycolysis and respiration is conducive for between-runs and even between-laboratory comparisons. To illustrate the utility of this approach, we characterize the phenotype of pancreatic ductal adenocarcinoma cell lines and measure their response to a switch of metabolic substrate and the presence of metabolic inhibitors. In summary, the method can deliver a robust appraisal of metabolism in cell lines, with applications in drug screening and in quantitative studies of metabolic regulation.
1. Introduction
Cell growth and proliferation is ultimately powered by metabolic pathways that harness energy from substrates such as glucose [1,2]. Ever since the discovery that deregulated energetics is a hallmark of cancer [3], metabolic phenotyping has become a pillar of cancer research [3,4,5]. The two main energy-yielding pathways are glycolysis and respiration, and their rates can be gauged from the production of lactic acid and consumption of oxygen, respectively [6]. In tumors, glycolytic and respiratory fluxes can be very large, which explains their characteristic acidotic and hypoxic signatures [7,8,9]. Glycolytic and respiratory rates can be probed using dedicated platforms, such as Seahorse XF [10,11,12], or bespoke plates imprinted with pH and/or O2 sensors for use with fluorescence or absorbance readers [13,14,15,16,17,18]. However, acid production and oxygen consumption are rarely measured under culture conditions over extended periods of time and then reported in terms of molar fluxes per cell. The Seahorse XF analyzer, for example, takes a snapshot of metabolic rates within a small but poorly controlled catchment of cells [19]. Data generated in this way are prone to measurement error, and as a result, comparisons between laboratories or even consecutive runs may not be advisable [20]. Measurements of pH or O2 in bulk media require additional calculations to derive fluxes, but these are not always performed or reported [21,22]. Given that metabolism is a cellular process, it would be prudent to normalize these flux estimates to the number of cells [23,24]. A concern for many laboratories are the prohibitive costs associated with metabolic profiling, which can make continuous or high-throughput measurements impractical, despite a strong scientific justification [17,25,26]
Here, we describe a simple, fluorescence-based protocol for measuring pH and O2 simultaneously and in real-time using standard culture plates. We demonstrate how the method can determine acid production (Jacid) and oxygen consumption (Joxygen) fluxes per cell as a function of time, including their approach to the steady-state. The method uses commercially available chemical sensors that reduce the cost of fluorescence substances to under 5 cents per plate. We also present a workflow for calculating fluxes from pH and O2 time courses, and illustrate the utility of our approach in metabolically phenotyping various cancer cell lines using pancreatic ductal adenocarcinoma (PDAC) cells as an example. With the aid of this accessible and simple approach, our intention is to standardize the process of metabolic phenotyping. In doing so, our overarching objective is to improve data quality, exchange, and reproducibility.
2. Materials and Methods
2.1. Plates and Plate Readers
Suitable plates for metabolic phenotyping are those designed for use with fluorescence readers. For illustrative purposes, this study used flat-bottom, black 96-well plates (655090, Greiner, Kremsmünster, Austria) that can be read using a Cytation 5 device (BioTek, Agilent, Winooski, VT, USA) [27]. Excitation was provided by a monochromator, and fluorescence emission was detected sequentially at five wavelengths, which were optimized for the dye combination used. Optimal settings on our system were excitation wavelengths of 400, 416, 450, 460, and 540 nm, and the corresponding emissions were 510, 510, 620, 510, and 580 nm. For improved signal-to-noise ratio, fluorescence can be acquired in time-resolved mode (e.g., delay: 0 µs; acquisition: 500 µs).
2.2. Fluorescent Dyes and Drugs
HPTS (8-Hydroxypyrene-1,3,6-trisulfonic acid trisodium salt) and RuBPY (tris(bipyridine)ruthenium(II) chloride) were purchased from Sigma-Aldrich (H1529 and 224758, St Louis, MO, USA) and dissolved in water at stocks of 4 and 100 mM, respectively. To maintain a consistent molar ratio of HPTS and RuBPY, stocks were mixed accordingly (1:1 v/v) and stored at −20 °C. CellTracker Orange CMRA (CTO) was obtained from Invitrogen (C34551) and kept in DMSO stock (sc-202581, Santa Cruz Biotechnology). Rotenone (R8875, Sigma-Aldrich) was dissolved in DMSO and stored at −20 °C.
2.3. Media
Powdered DMEM medium was obtained from Sigma-Aldrich (D5030). This formulation was chosen because it could be supplemented with buffers, as desired [28]. HEPES (H3375), MES (M3671), glucose (G7021), galactose (G5388), and NaCl (S7653) were obtained from Sigma-Aldrich. Low-buffer medium was prepared by dissolving Phenol Red-Free DMEM 5030 powder in deionized water, then adding 2 mM HEPES, 2 mM MES, 40 mM NaCl, 25 mM glucose, 10% FBS, 1% penicillin–streptomycin mixture, 1% GlutaMAX, and 1% sodium pyruvate. After the ingredients dissolved completely, the medium was tittered to pH 7.4, at 37 °C with 0.4 M NaOH and filtered (0.22 µm pore). High-buffer media were prepared similarly, with the exception that 20 mM HEPES was used instead of 2 mM HEPES plus 2 mM MES, and NaCl was reduced to 25 mM NaCl.
2.4. Cells
Pancreatic ductal adenocarcinoma (PDAC) cell lines AsPC1, MIA-PaCa-2 and PANC1 were a gift from Prof. Anna Trauzold (Christian-Albrecht University, Kiel, Germany), maintained in RPMI (Sigma-Aldrich, R0883) supplemented with 10% FBS, 1% penicillin–streptomycin mixture, 1% GlutaMAX (35050-038, Gibco, Waltham, MA, USA), 1% sodium pyruvate (11360-039, Gibco, Waltham, MA, USA), and used within passage 3–8 [29,30]. Adult mouse myocytes were isolated from Langendorff-perfused mice hearts using a previously published method [31,32]. Mice were killed humanely by an approved Schedule 1 method following ASPA regulations and University guidelines. Cells were kept in media for up to 20 h after isolation.
3. Results
3.1. Selecting Cost-Effective pH and Oxygen Probes for Assaying Glycolysis and Respiration
The criteria for appropriate pH- and O2-sensitive dyes for a metabolic assay system are (i) low cost, (ii) non-toxicity to cells, (iii) impermeability to measure extracellular levels, (iv) temporal stability, (v) spectral compatibility, and (vi) ability to produce a calibrated signal. Furthermore, the ensemble spectral properties of the dye-pair must reserve a wavelength range for assessing cell numbers using fluorescent dyes, such as those of the CellTracker family. There are multiple pH-sensitive dyes available, including commonly used cSNARF derivatives [33,34], BCECF [35,36], and HPTS [37,38,39]. Of the three, HPTS has a superior value for money ($0.05 per µmole). Furthermore, HPTS is a ratiometric dye that can be calibrated, and its spectrum is shifted towards low wavelengths, giving spectral space for red-shifted O2 sensors [40]. Conveniently, HPTS is membrane impermeable, chemically stable, and produces a very strong signal, which means that concentrations below 10 µM are usually sufficient. There are a number of O2-sensing dyes, including those that are quenched by molecular oxygen [18,41,42,43]. A cost-effective dye that emits fluorescence in a range that has no overlap with HPTS is RuBPY.
The spectral characterization of HPTS and RuBPY was performed in a 96-well plate using a fluorescence plate reader. The degree of spectral overlap between HPTS and RuBPY fluorescence was measured in DMEM-based media buffered with 10 mM HEPES and 10 mM MES, and titrated to pH 6.0, 7.0, or 8.0 with 0.4 M NaOH and 0.5 N HCl. Excitation was delivered at wavelengths previously reported as suitable for HPTS in dual excitation mode (400 nm and 460 nm) and RuBPY in a single-excitation model (450 nm). The spectra, shown in Figure 1A, show a clear distinction between the dyes. Moreover, fluorescence emitted by HPTS, but not RuBPY, was pH-sensitive. To confirm that the choices of excitation wavelengths were optimal in the biological context of culture media, excitation spectra were probed at emission peaks of 510 nm for HPTS and 620 nm for RuBPY. The spectrum for HPTS was measured over a range of pH, from 6 to 8 (Figure 1B); the peaks producing maximal pH sensitivity for ratiometry were 400 nm and 460 nm. Excitation spectra intersected at 416 nm, which defines the pH-insensitive wavelength. This so-called isosbestic point is a useful reference point that relates to the concentration of HPTS. Unlike HPTS, RuBPY is not ratiometric, and its single excitation peak was 450 nm (Figure 1C). The lack of an oxygen-insensitive reference wavelength makes it difficult to calibrate RuBPY fluorescence into units of dissolved O2. However, as the HPTS:RuBPY concentration ratio can be fixed by careful and consistent mixing, the HPTS isosbestic point could serve as a convenient reference point to O2-sensitive RuBPY fluorescence. This is particularly useful for offsetting the effects of changes in volumes, such as evaporation, where both isosbestic HPTS and RuBPY would be affected equally.
In order to use the dyes in combination, it is first necessary to determine the concentrations that produce comparable peaks for best resolving power. HPTS and RuBPY were mixed in various molar ratios, and the emission spectra above 480 nm were recorded with 450 nm excitation—a wavelength that is sufficiently close to the excitation peaks of both dyes. A suitable combination of HPTS and RuBPY that produced a bimodal spectrum was determined empirically to be 2 µM and 50 µM, respectively. At this molar ratio, the spectral distinction between the dyes was >100 nm, and the optimal emission peaks for the pH- and O2-sensitive channels were 510 nm and 620 nm, respectively (Figure 1D).
Based on the optimization experiments performed, the most suitable measurements settings were determined to be:
- Ch1: Excitation 400 nm/emission 510 nm, optimized for HPTS fluorescence at low pH;
- Ch2: Excitation 460 nm/emission 510 nm, optimized for HPTS fluorescence at high pH;
- Ch3: Excitation 416 nm/emission 510 nm, optimized for pH-insensitive HPTS fluorescence as an O2-insensitive reference to O2-sensitive RuBPY;
- Ch4: Excitation 450 nm/emission 620 nm, optimized for RuBPY fluorescence, which is quenched by oxygen, i.e., inversely related to oxygen tension.
Ratios Ch2/Ch1 and Ch3/Ch4 increase with a rise in pH and oxygen, respectively. In order for these ratios to provide a truly selective measure of pH and O2, the fluorescence emitted by one dye cannot bleed-through to another’s wavelength range. To test for bleed-through at the optimized settings, measurements were performed in wells that contained one dye only, and recordings on all four fluorescence channels are presented in Figure 1E. These data show that RuBPY-emitted fluorescence detected at the three, nominally HPTS channels (Ch1-3) is small (<5%) compared to the fluorescence emitted from HPTS-containing wells. This indicates minimal bleed-through and does not warrant a correction. Similarly, HTPS-emitted fluorescence detected at the RuBPY channel (Ch4) was <7% of the signal measured in RuBPY-containing wells. Again, there was no requirement to implement any correction factor for this minimal bleed-through.
3.2. Calibration of Signals to Units of pH and Oxygen Tension
Having optimized the wavelengths for detecting a pH-sensitive ratio (RpH = Ch2/Ch1) and an O2-sensitive ratio (RO2 = Ch3/Ch4), calibration curves were obtained by carefully titrating culture media pH to a value over the range 5–8 and altering O2 tension. Media were buffered with 10 mM HEPES and 10 mM MES, but no bicarbonate because calibrations were performed in the absence of CO2. The calibration curves were measured in atmospheric O2 (21%) and then in hypoxia (<1% O2). In order to maintain oxygen tension during the measurement period, wells were covered with 150 µL of mineral oil, which serves as a diffusion barrier to minimize oxygen ingress during the brief recording period. The calibration curves are presented in Figure 2.
HPTS provides a highly pH-sensitive ratio across the physiological range. The calibration curves in normoxia and hypoxia were superimposable, indicating that HPTS is insensitive to oxygen and reports a pH-selective signal (Figure 2A). The best-fit equation is the Grinkiewicz type:
RuBPY fluorescence was pH-insensitive but responded to hypoxia, which is consistent with the quenching effect of oxygen (Figure 2B). The ratio of isosbestic HPTS to RuBPY fluorescence was deemed adequately O2-sensitive, and its calibration curve can be described using a modification of the Stern-Volmer equation (Figure 2C):
The value for Rnormoxia at 21% O2, i.e., atmospheric, can be obtained in cell-free wells measured in parallel to wells that include cells. In contrast, ranoxia must be obtained in separate experimental reads by placing plates in an O2-free environment. In our system, the best-fit values are listed in Table 1. It is important that calibrations are determined for each laboratory individually to account for differences in equipment.
3.3. Converting pH and Oxygen Time Courses into Fluxes
The convertion of pH or O2 time courses to molar fluxes must consider chemical buffering and whether the system being studied is open (i.e., can exchange freely with the atmosphere) or closed.
3.3.1. Buffering
Fluorescent dyes such as HPTS and RuBPY probe the level of free ligands, i.e., H+ ions and O2, respectively. It is, however, common for chemical systems to manifest buffering: pH buffering takes the form of H+-binding weak acid/base pairs, whereas O2 buffering can involve chelators such as hemoglobin. Fluxes of H+ or O2 caused by glycolysis and respiration should refer to the total concentration rather than the free pool. Thus, flux is best described as the product of buffering capacity and rate of change. Buffering can be quantified in terms of a buffer ratio (B), such as the number of molecules bound to buffer per free molecule. In most culture media, O2 buffering is close to zero, and therefore the rate of change of measured O2 gives an adequate estimate of flux. This can be used to describe oxygen flux (JO2):
H+ ions, in contrast, can be heavily buffered; indeed, that is the rationale of including buffers such as HEPES in media formulations. By convention, pH buffering is described in terms of a buffering capacity (β) that may vary in a pH-dependent manner. Whilst it is appropriate to express acid flux in terms of H+ ions, free H+ ions are, by convention, reported as pH. Thus, the corresponding definition of buffering capacity is the concentration of acid added, divided by the pH change. Therefore, the acid flux (JH+) is defined as follows:
Medium buffering capacity can be measured by adding known amounts of HCl or NaOH and measuring the resulting pH change. Figure 3A shows an exemplar recording of pH after sequential additions of 0.5 mM HCl to media from an alkaline starting pH and 0.5 mM NaOH to media from an acidic starting pH. For this experiment, media contained 2 mM HEPES and 2 mM MES to provide a low level of buffering. The calculated buffering capacity is plotted in Figure 3B.
3.3.2. Open and Closed Systems
In a closed system, a change in O2 or pH can be attributed to an internal process, such as respiration and glycolysis. Lactic acid is an example of a non-volatile acid, and media with glycolytic cells can be considered a closed system with respect to pH. Oxygen, in contrast, is gaseous, and any system that consumes (or produces) O2 should be considered an open system in dynamic equilibrium with its immediate atmosphere. The exchange of O2 between the well and its atmosphere introduces an additional flux that can be described by a permeability constant (PO2) and gradient:
Thus, O2 dynamics in a well that (i) contains respiring cells and (ii) is open to the atmosphere should be described as follows:
Using Equation (6), it is possible to calculate the respiratory flux from O2 measurements once passive O2 exchange is factored in. In order to calculate the latter, an a priori estimate of permeability is required. This will depend on various parameters, among which is oxygen diffusivity in media and the height of the column of a medium. A column of medium can support relatively fast gas diffusion, which risks that any change in medium O2 would be difficult to resolve. To impose a controlled restriction on gas diffusion, media in wells were covered with a layer of mineral oil (Sigma-Aldrich, M5904, St Louis, MO, USA). The ensemble permeability PO2 across media and oil can be estimated in cell-free wells that had been pre-equilibrated in hypoxia (e.g., 0.1% O2). Returning plates to the normal atmosphere of the plate reader drives O2 ingress, which was reported using RuBPY (Figure 4A). The time course of re-oxygenation gives a measure of time constant, inversely related to PO2 (Figure 4B). This experiment was performed for a range of oil volumes to vary the diffusive restriction (Figure 4C). These data provide an estimate of the time constant of O2 diffusion in the media and the effect that oil has on restricting gas diffusion. For 150 µL of mineral oil, PO2 is 0.029 min−1. Applying this to Equation (6) enables real-time measurements of respiratory fluxes.
3.4. Implementation of Assay to Metabolically Phenotype Cancer Cells
Proof-of-principle studies of glycolytic and respiratory fluxes were performed on pancreatic adenocarcinoma cell lines (AsPC1, MIA-PaCa-2, PANC1). Reported fluxes will depend on the density of cells; therefore, it was necessary to obtain a measure of cell count for normalization purposes.
3.4.1. Normalizing for Cell Number
The number of cells in a well can be estimated using fluorescent dyes loaded to cells; a higher signal would indicate higher density. The appropriate dye is required to be stable, membrane impermeant once loaded, spectrally non-overlapping with HTPS and RuBPY, as well as pH- and O2-insensitive. Suitable candidates for cell counting are CellTracker dyes, and the optimal choice considering the spectral constraints is CellTracker Orange (CTO). The CTO emission spectrum is shown in Figure 5A. CTO fluorescence is resolvable from HPTS and RuBPY, as it is excited at a considerably higher wavelength (540 nm vs. <460 nm) (Figure 5B). As determined using serially-diluted human red blood cells, the CTO signal is linearly related to cell number (Figure 5C). A similar calibration curve can be obtained for adherent cells grown at the bottom of wells, as is shown for MIA-PaCa-2 and AsPC1 (Figure 5D). Note that the fluorescence per PDAC cell (0.455 F.U.) is higher than per red blood cell (0.19 F.U.) because the latter is smaller in size and contains hemoglobin, which absorbs some fluorescence.
The degree to which CTO is pH- and O2-sensitive was determined experimentally by loading MIA PaCa-2 cells with the dye at 12.5 µM for 15 min, followed by superfusion maneuvers that change pH or O2 levels. Cells were plated in LabTek slides that are suitable for superfusion. Superfusates contained 125 mM NaCl, 4.5 mM KCl, 11 mM glucose, 1 mM CaCl2, 1 mM MgCl2, and 20 mM HEPES, titrated to either pH 6.4 or 7.4. To make anoxic superfusates, solutions were bubbled in 100% N2, and anoxia was stabilized chemically by the addition of 1 mM sodium dithionite, an oxygen scavenger. Superfusates were delivered to cells by a peristaltic pump and heated to 37 °C. Images were taken on a Leica confocal microscope using settings optimized previously for CTO. Fluorescence was first imaged under baseline conditions (normoxia of 21% O2 and pH 7.4), and then after a change in pH to 6.4 (Figure 5E), allowing 10 min for equilibration, or change in O2 tension to anoxic levels (Figure 5F), allowing 2 min for equilibration. Finally, superfusion was returned to baseline conditions. No effect of hypoxia or acidity was observed, indicating that CTO provides a stable fluorescence signal.
3.4.2. Real-Time Monitoring of Metabolic Fluxes
To monitor glycolytic and respiratory fluxes in real-time, AsPC1, MIA-PaCa2, and PANC1 cells were plated in 96-well plates at various cell densities (30k, 50k 70k) and left to adhere overnight. Next, the cells were loaded with 25 µM CTO for 15 min, after which media were replaced with 100 µL of a low-buffer formulation containing 2 µM HPTS and 50 µM RuBPY. Wells were immediately covered with a layer of mineral oil (150 µL), and the plate was inserted into a reader for recordings at regular intervals (e.g., 10 min). Some wells had no cells in order to measure background changes to pH during incubation and for obtaining reference values for normoxia (Rnormoxia). Figure 6A shows a time course of pH and O2 for various densities of cells (30, 50, and 70k per well), including cell-free wells. This information was used to calculate cumulative acid production (CH+) and oxygen consumption (CO2), where V is the volume of the well:
The time courses of CH+ and CO2 are shown in Figure 6B. The three PDAC cells presented strikingly different phenotypes: AsPC1 had low glycolytic and respiratory rates; MIA-PaCa2 had elevated glycolysis, whereas PANC1 had raised glycolysis and a very high respiratory rate. The relationship between cell number and end-point O2 and pH, and cumulative O2 consumption and H+ production are shown in Figure 6C. The approach can therefore monitor glycolysis and respiration in real-time, investigate their interplay and the effect of cell density, delivering information that has hitherto been largely inaccessible to many researchers.
3.4.3. Measuring Metabolic Responses
The imaging system can be used to study the effect of changing respiratory substrate on glycolytic and respiratory fluxes. MIA-PaCa-2 and PANC1 cells were seeded at 70k per well and left to adhere overnight. Standard medium was then replaced with 100 µL of a high-buffering formulation that contained either 25 mM glucose or 25 mM galactose as a primary substrate, plus fluorescent dyes (2 µM HPTS and 50 µM RuBP). After covering each well with 150 µL of mineral oil, the plate was immediately transferred into the plate-reader for measurements. Consistent with the literature, galactose is less effective as a glycolytic substrate, which re-routes energetic flows towards respiration, as shown by the increase in O2 consumption (Figure 7A).
The method can also study responses to inhibitors, such as the effect of blocking mitochondrial respiration with electron transport chain inhibitors (e.g., rotenone) [44]. To measure the metabolic responses to mitochondrial inhibition in real-time, MIA-PaCa2 and PANC1 cells were plated at 70k per well and left to attach overnight. Next, the medium was replaced with 100 µL of the low-buffering formulation containing 2 µM HPTS and 50 µM RuBP, with or without 10 µM rotenone. Then, 150 µL of mineral oil was added to each well, and the plate was transferred into the plate-reader for measurements (Figure 8). As expected, pharmacological inhibition of the electron transport chain resulted in a shift from O2 consumption towards a higher level of glycolysis, which verifies the assay’s ability to report responses to metabolic inhibition.
3.5. Proof-of-Principle Measurements on Non-Adherent Cells
This plate-based assay can also measure O2 and pH in suspensions of cells, such as non-adherent primary cells. As proof-of-principle, ventricular myocytes, freshly isolated from a mouse heart, were re-suspended in low-buffer media and aliquoted into wells of a plate for measurements according to the methods described for cancer cells. Myocytes have a high respiratory rate, as shown by the extent to which O2 is depleted. A smaller but significant rate of glycolysis was observed (Figure 9). Thus, the system can be used to characterize the metabolism of non-cancer cells, including primary non-adherent cells.
4. Discussion
This article presents a complete workflow for assaying the metabolic fluxes in cells. Most experiments were performed on cultured cancer cell lines, but the system can also be used to measure metabolic rate in primary non-adherent cells, as illustrated using ventricular myocytes. The key advantages of our method relate to its (i) low running costs and (ii) delivery of direct measurements of molar fluxes of H+ and O2 in real-time and under culture conditions over an extended period of time.
The protocol can be readily implemented using a suitable fluorescence plate reader, which is standard equipment in many laboratories. The running costs are very low thanks to the choice of sensors optimized for the assay. RuBPY is available for the list price of £33 for 250 mg, and the cost per plate, assuming a working concentration of 50 µM across 96 wells, is £0.05. HPTS is available at a list price of £70 for 1 g, and the equivalent cost per plate is £0.0068. Greiner plates are available at £5 per unit, which means an assay can be performed for £5.05 per plate. The cost will increase if normalization using CTO is required for specific experiments.
The protocol’s workflow includes a step-by-step guide to calculating glycolytic and respiratory fluxes and normalizing these to the cell number. These calculations consider buffering for H+ ions as well as O2 ingress in the open system of plate wells. Molar H+ and O2 fluxes are the most direct readouts of the state of metabolism and we recommend that they are adopted as the reporting standard to facilitate data sharing, exchange, and comparison between studies. Fluxes normalized to cell number are less prone to measurement error than raw measurements such as pH or O2. In principle, these values can be compared between runs and even between laboratories, as they are characteristic of cell lines under a given state and not subject to errors that arise from the lack of adequate normalization or flawed calculations.
The ability to follow metabolism in real-time and for extended periods (e.g., many hours) is a major advantage as it allows time for cells to implement more complete biological responses, e.g., to inhibitors or substrates. Critically, cells can be maintained in appropriate cell culture media as required, provided that these are characterized with respect to pH buffering and O2 diffusivity. Importantly, longer-term follow-up can include the attainment of steady-state between pH, O2, and metabolism, which is rarely reported in metabolic studies in vitro. Such a steady-state represents the balance of fluxes and may relate accurately to the in vivo scenario. Understanding the steady-state can explain the genesis of particular levels of pH and O2 tension in tissues.
The ability to perform metabolic assays cheaply and on a large scale opens opportunities for high-throughput studies. Combining this with molar flux measurements and integrating the data over longer time periods can supply high-quality data for mechanistic studies on cancer and other disciplines of life science.
5. Appendix: Step-by-Step Protocol
- (1)
- Dissolve HPTS and RuBPY in sterile, deionized water to obtain stocks of 4 and 100 mM, respectively. Mix both dyes in a 1:1 ratio, divide them into aliquots, and store them at −20 °C. Avoid multiple thaw-freeze cycles.
- (2)
- Seed cells onto a black, fluorescence-compatible, flat-bottom 96-well plate at the desired density and leave to attach overnight. Higher densities will produce larger and more resolvable fluxes. When planning the plate, ensure that some wells are cell-free (blanks) to serve as reference points for pH and O2. Recommendation: Add PBS to the outermost wells to help maintain humidity and prevent evaporation in the remainder of the plate.
- (3)
- Thaw and vortex the dye mixture. Dissolve (1:1000 v/v) in Phenol Red-free medium of choice. Allow aliquots of 100 µL per well.
- (4)
- Replace media that had bathed cells during the settling period with the dye-containing medium of the desired composition (e.g., pH, buffering, inhibitors etc). Whilst tilting the plate slightly, gently add 150 µL of mineral oil to each well to cover the medium and introduce a controlled diffusion barrier to gas exchange. Volumes of medium and mineral oil should be optimized for the given oxygen consumption and acid production rate.
- (5)
- Place the plate into the plate-reader, keeping the lid on. Start collecting the data immediately to capture the initial state.
- (6)
- Perform calculations according to the equations described herein. Note: Media prepared for the assay must be characterized in separate experiments in terms of buffering capacity and oxygen diffusivity.
Author Contributions
Conceptualization, P.S.; methodology, W.B., Z.T. and P.S.; collecting data and analysis, W.B. and Z.T.; resources, P.S.; writing P.S., W.B. and Z.T. All authors have read and agreed to the published version of the manuscript.
Funding
This research was funded by the European Research Council, grant number SURVIVE, and the Marie Skłodowska-Curie Innovative Training Network (ITN) (grant Agreement number: 813834—pHioniC—H2020-MSCA-ITN-2018).
Institutional Review Board Statement
The study was conducted according to the guidelines of the Declaration of Helsinki, and approved by Oxford University ethical review board.
Informed Consent Statement
Not applicable.
Data Availability Statement
All data relevant to the work has been presented herein. Raw traces are available on request made to the corresponding author.
Acknowledgments
We thank Kyung Chan (KC) Park for isolating ventricular myocytes.
Conflicts of Interest
The authors declare no conflict of interest. The funders had no role in the design of the study; in the collection, analyses, or interpretation of data; in the writing of the manuscript, or in the decision to publish the results.
References
- Birsoy, K.; Possemato, R.; Lorbeer, F.K.; Bayraktar, E.C.; Thiru, P.; Yucel, B.; Wang, T.; Chen, W.W.; Clish, C.B.; Sabatini, D.M. Metabolic determinants of cancer cell sensitivity to glucose limitation and biguanides. Nature 2014, 508, 108–112. [Google Scholar] [CrossRef] [Green Version]
- Nowell, P.C. The clonal evolution of tumor cell populations. Science 1976, 194, 23–28. [Google Scholar] [CrossRef]
- Hanahan, D.; Weinberg, R.A. Hallmarks of cancer: The next generation. Cell 2011, 144, 646–674. [Google Scholar] [CrossRef] [Green Version]
- Li, Z.; Wang, Z.; Tang, Y.; Lu, X.; Chen, J.; Dong, Y.; Wu, B.; Wang, C.; Yang, L.; Guo, Z.; et al. Liquid biopsy-based single-cell metabolic phenotyping of lung cancer patients for informative diagnostics. Nat. Commun. 2019, 10, 3856. [Google Scholar] [CrossRef] [Green Version]
- Ke, C.; Li, A.; Hou, Y.; Sun, M.; Yang, K.; Cheng, J.; Wang, J.; Ge, T.; Zhang, F.; Li, Q.; et al. Metabolic phenotyping for monitoring ovarian cancer patients. Sci. Rep. 2016, 6, 23334. [Google Scholar] [CrossRef] [Green Version]
- Jain, M.; Nilsson, R.; Sharma, S.; Madhusudhan, N.; Kitami, T.; Souza, A.L.; Kafri, R.; Kirschner, M.W.; Clish, C.B.; Mootha, V.K. Metabolite profiling identifies a key role for glycine in rapid cancer cell proliferation. Science 2012, 336, 1040–1044. [Google Scholar] [CrossRef] [Green Version]
- San-Millan, I.; Brooks, G.A. Reexamining cancer metabolism: Lactate production for carcinogenesis could be the purpose and explanation of the Warburg Effect. Carcinogenesis 2017, 38, 119–133. [Google Scholar] [CrossRef] [PubMed]
- Mayer, A.; Vaupel, P. Hypoxia, lactate accumulation, and acidosis: Siblings or accomplices driving tumor progression and resistance to therapy? Adv. Exp. Med. Biol. 2013, 789, 203–209. [Google Scholar] [CrossRef]
- Kato, Y.; Ozawa, S.; Miyamoto, C.; Maehata, Y.; Suzuki, A.; Maeda, T.; Baba, Y. Acidic extracellular microenvironment and cancer. Cancer Cell Int. 2013, 13, 89. [Google Scholar] [CrossRef] [Green Version]
- Sun, C.; Liu, X.; Wang, B.; Wang, Z.; Liu, Y.; Di, C.; Si, J.; Li, H.; Wu, Q.; Xu, D.; et al. Endocytosis-mediated mitochondrial transplantation: Transferring normal human astrocytic mitochondria into glioma cells rescues aerobic respiration and enhances radiosensitivity. Theranostics 2019, 9, 3595–3607. [Google Scholar] [CrossRef]
- O’Neill, S.; Porter, R.K.; McNamee, N.; Martinez, V.G.; O’Driscoll, L. 2-Deoxy-D-Glucose inhibits aggressive triple-negative breast cancer cells by targeting glycolysis and the cancer stem cell phenotype. Sci. Rep. 2019, 9, 3788. [Google Scholar] [CrossRef] [Green Version]
- Guo, J.; Su, Y.; Zhang, M. Circ_0000140 restrains the proliferation, metastasis and glycolysis metabolism of oral squamous cell carcinoma through upregulating CDC73 via sponging miR-182-5p. Cancer Cell Int. 2020, 20, 407. [Google Scholar] [CrossRef]
- John, G.T.; Goelling, D.; Klimant, I.; Schneider, H.; Heinzle, E. PH-sensing 96-well microtitre plates for the characterization of acid production by dairy starter cultures. J. Dairy Res. 2003, 70, 327–333. [Google Scholar] [CrossRef] [PubMed]
- Heux, S.; Philippe, B.; Portais, J.C. High-throughput workflow for monitoring and mining bioprocess data and its application to inferring the physiological response of Escherichia coli to perturbations. Appl. Environ. Microbiol. 2011, 77, 7040–7049. [Google Scholar] [CrossRef] [Green Version]
- Wu, S.; Wu, S.; Yi, Z.; Zeng, F.; Wu, W.; Qiao, Y.; Zhao, X.; Cheng, X.; Tian, Y. Hydrogel-Based Fluorescent Dual pH and Oxygen Sensors Loaded in 96-Well Plates for High-Throughput Cell Metabolism Studies. Sensors 2018, 18, 564. [Google Scholar] [CrossRef] [PubMed] [Green Version]
- Kieninger, J.; Aravindalochanan, K.; Sandvik, J.A.; Pettersen, E.O.; Urban, G.A. Pericellular oxygen monitoring with integrated sensor chips for reproducible cell culture experiments. Cell Prolif. 2014, 47, 180–188. [Google Scholar] [CrossRef] [PubMed]
- Steinegger, A.; Wolfbeis, O.S.; Borisov, S.M. Optical Sensing and Imaging of pH Values: Spectroscopies, Materials, and Applications. Chem. Rev. 2020, 120, 12357–12489. [Google Scholar] [CrossRef]
- Wang, X.D.; Wolfbeis, O.S. Optical methods for sensing and imaging oxygen: Materials, spectroscopies and applications. Chem. Soc. Rev. 2014, 43, 3666–3761. [Google Scholar] [CrossRef] [Green Version]
- Nonnenmacher, Y.; Palorini, R.; Hiller, K. Determining Compartment-Specific Metabolic Fluxes. Methods Mol. Biol. 2019, 1862, 137–149. [Google Scholar] [CrossRef]
- Zhang, J.; Zhang, Q. Using Seahorse Machine to Measure OCR and ECAR in Cancer Cells. Methods Mol. Biol. 2019, 1928, 353–363. [Google Scholar] [CrossRef]
- Hynes, J.; Swiss, R.L.; Will, Y. High-Throughput Analysis of Mitochondrial Oxygen Consumption. Methods Mol. Biol. 2018, 1782, 71–87. [Google Scholar] [CrossRef] [PubMed]
- Naciri, M.; Kuystermans, D.; Al-Rubeai, M. Monitoring pH and dissolved oxygen in mammalian cell culture using optical sensors. Cytotechnology 2008, 57, 245–250. [Google Scholar] [CrossRef] [PubMed] [Green Version]
- Arguello, R.J.; Combes, A.J.; Char, R.; Gigan, J.P.; Baaziz, A.I.; Bousiquot, E.; Camosseto, V.; Samad, B.; Tsui, J.; Yan, P.; et al. SCENITH: A Flow Cytometry-Based Method to Functionally Profile Energy Metabolism with Single-Cell Resolution. Cell Metab. 2020, 32, 1063–1075.e1067. [Google Scholar] [CrossRef] [PubMed]
- Tanumihardja, E.; Slaats, R.H.; van der Meer, A.D.; Passier, R.; Olthuis, W.; van den Berg, A. Measuring Both pH and O2 with a Single On-Chip Sensor in Cultures of Human Pluripotent Stem Cell-Derived Cardiomyocytes to Track Induced Changes in Cellular Metabolism. ACS Sens. 2021, 6, 267–274. [Google Scholar] [CrossRef] [PubMed]
- Diepart, C.; Verrax, J.; Calderon, P.B.; Feron, O.; Jordan, B.F.; Gallez, B. Comparison of methods for measuring oxygen consumption in tumor cells in vitro. Anal. Biochem. 2010, 396, 250–256. [Google Scholar] [CrossRef] [PubMed]
- Ge, X.; Hanson, M.; Shen, H.; Kostov, Y.; Brorson, K.A.; Frey, D.D.; Moreira, A.R.; Rao, G. Validation of an optical sensor-based high-throughput bioreactor system for mammalian cell culture. J. Biotechnol. 2006, 122, 293–306. [Google Scholar] [CrossRef]
- Alim Uysal, B.A.; Kotan, G.; Guneser, M.B.; Dincer, A.N.; Senturk, H.; Rafiqi, A.M. Investigation of the effect of different chelation solutions on penetration of resin-based and bioceramic sealers with a novel method. Microsc. Res. Tech. 2021. [Google Scholar] [CrossRef]
- Michl, J.; Park, K.C.; Swietach, P. Evidence-based guidelines for controlling pH in mammalian live-cell culture systems. Commun. Biol. 2019, 2, 144. [Google Scholar] [CrossRef]
- Yao, J.; Czaplinska, D.; Ialchina, R.; Schnipper, J.; Liu, B.; Sandelin, A.; Pedersen, S.F. Cancer Cell Acid Adaptation Gene Expression Response Is Correlated to Tumor-Specific Tissue Expression Profiles and Patient Survival. Cancers 2020, 12, 2183. [Google Scholar] [CrossRef]
- Forciniti, S.; Dalla Pozza, E.; Greco, M.R.; Amaral Carvalho, T.M.; Rolando, B.; Ambrosini, G.; Carmona-Carmona, C.A.; Pacchiana, R.; Di Molfetta, D.; Donadelli, M.; et al. Extracellular Matrix Composition Modulates the Responsiveness of Differentiated and Stem Pancreatic Cancer Cells to Lipophilic Derivate of Gemcitabine. Int. J. Mol. Sci. 2020, 22, 29. [Google Scholar] [CrossRef]
- Ford, K.L.; Moorhouse, E.L.; Bortolozzi, M.; Richards, M.A.; Swietach, P.; Vaughan-Jones, R.D. Regional acidosis locally inhibits but remotely stimulates Ca2+ waves in ventricular myocytes. Cardiovasc. Res. 2017, 113, 984–995. [Google Scholar] [CrossRef]
- Chung, Y.J.; Luo, A.; Park, K.C.; Loonat, A.A.; Lakhal-Littleton, S.; Robbins, P.A.; Swietach, P. Iron-deficiency anemia reduces cardiac contraction by downregulating RyR2 channels and suppressing SERCA pump activity. JCI Insight 2019, 4, e125618. [Google Scholar] [CrossRef]
- Hulikova, A.; Harris, A.L.; Vaughan-Jones, R.D.; Swietach, P. Regulation of intracellular pH in cancer cell lines under normoxia and hypoxia. J. Cell Physiol. 2013, 228, 743–752. [Google Scholar] [CrossRef]
- Jo, J.; Lee, C.H.; Kopelman, R.; Wang, X. In vivo quantitative imaging of tumor pH by nanosonophore assisted multispectral photoacoustic imaging. Nat. Commun. 2017, 8, 471. [Google Scholar] [CrossRef] [Green Version]
- Contreras-Baeza, Y.; Sandoval, P.Y.; Alarcon, R.; Galaz, A.; Cortes-Molina, F.; Alegria, K.; Baeza-Lehnert, F.; Arce-Molina, R.; Guequen, A.; Flores, C.A.; et al. Monocarboxylate transporter 4 (MCT4) is a high affinity transporter capable of exporting lactate in high-lactate microenvironments. J. Biol. Chem. 2019, 294, 20135–20147. [Google Scholar] [CrossRef] [PubMed]
- Bachmeier, C.J.; Trickler, W.J.; Miller, D.W. Drug efflux transport properties of 2′,7′-bis(2-carboxyethyl)-5(6)-carboxyfluorescein acetoxymethyl ester (BCECF-AM) and its fluorescent free acid, BCECF. J. Pharm. Sci. 2004, 93, 932–942. [Google Scholar] [CrossRef] [PubMed]
- Lucien, F.; Harper, K.; Pelletier, P.P.; Volkov, L.; Dubois, C.M. Simultaneous pH measurement in endocytic and cytosolic compartments in living cells using confocal microscopy. J. Vis. Exp. 2014, 86, 51395. [Google Scholar] [CrossRef] [PubMed] [Green Version]
- Hinton, A.; Sennoune, S.R.; Bond, S.; Fang, M.; Reuveni, M.; Sahagian, G.G.; Jay, D.; Martinez-Zaguilan, R.; Forgac, M. Function of a subunit isoforms of the V-ATPase in pH homeostasis and in vitro invasion of MDA-MB231 human breast cancer cells. J. Biol. Chem. 2009, 284, 16400–16408. [Google Scholar] [CrossRef] [Green Version]
- Ray, A.; Koo Lee, Y.E.; Epstein, T.; Kim, G.; Kopelman, R. Two-photon nano-PEBBLE sensors: Subcellular pH measurements. Analyst 2011, 136, 3616–3622. [Google Scholar] [CrossRef]
- Willoughby, D.; Schwiening, C.J. Electrically evoked dendritic pH transients in rat cerebellar Purkinje cells. J. Physiol. 2002, 544, 487–499. [Google Scholar] [CrossRef] [PubMed]
- Lima, S.; Bonifacio, R.L.; Azzellini, G.C.; Coichev, N. Ruthenium(II) tris(bipyridyl) ion as a luminescent probe for oxygen uptake on the catalyzed oxidation of HSO3-. Talanta 2002, 56, 547–556. [Google Scholar] [CrossRef]
- Zhou, C.; Zhao, W.X.; You, F.T.; Geng, Z.X.; Peng, H.S. Highly Stable and Luminescent Oxygen Nanosensor Based on Ruthenium-Containing Metallopolymer for Real-Time Imaging of Intracellular Oxygenation. ACS Sens. 2019, 4, 984–991. [Google Scholar] [CrossRef] [PubMed]
- Jiang, Z.; Yu, X.; Zhai, S.; Hao, Y. Ratiometric Dissolved Oxygen Sensors Based on Ruthenium Complex Doped with Silver Nanoparticles. Sensors 2017, 17, 548. [Google Scholar] [CrossRef] [PubMed] [Green Version]
- Scholler-Mann, A.; Matt, K.; Hochecker, B.; Bergemann, J. Ex vivo Assessment of Mitochondrial Function in Human Peripheral Blood Mononuclear Cells Using XF Analyzer. Bio. Protoc. 2021, 11, e3980. [Google Scholar] [CrossRef]
Figure 1.
Spectral analyses of HPTS and RuBPY. (A) Emission spectra for HPTS and RuBPY measured separately in DMEM-based media buffered with 10 mM HEPES/10 mM MES and titrated to either pH 6.0, 7.0, or 8.0. (B) The excitation spectrum for HPTS fluorescence collected at its optimal emission (510 nm). Isosbestic point is the wavelength at which fluorescence is pH-insensitive. (C) The excitation spectrum for RuBPY fluorescence collected at its optimal emission (620 nm). Note the pH insensitivity. (D) Concentrations of HTPS (2 µM) and RuBPY (50 µM) determined empirically in DMEM-based media to produce comparable emission peaks when excited at 450 nm. (E) Test for fluorescence bleed-through between recording channels. Media contained either HTPS (2 µM) or RuBPY (50 µM) at pH 7.3, and measurement protocols were performed to obtain signals across all four channels sequentially (Ch1–Ch4). Ch1–Ch3 are nominally HPTS channels and found to detect a predominantly HPTS-emitted signal. Ch4 is nominally a RuBPY channel and detects a predominantly RuBPY-emitted signal.
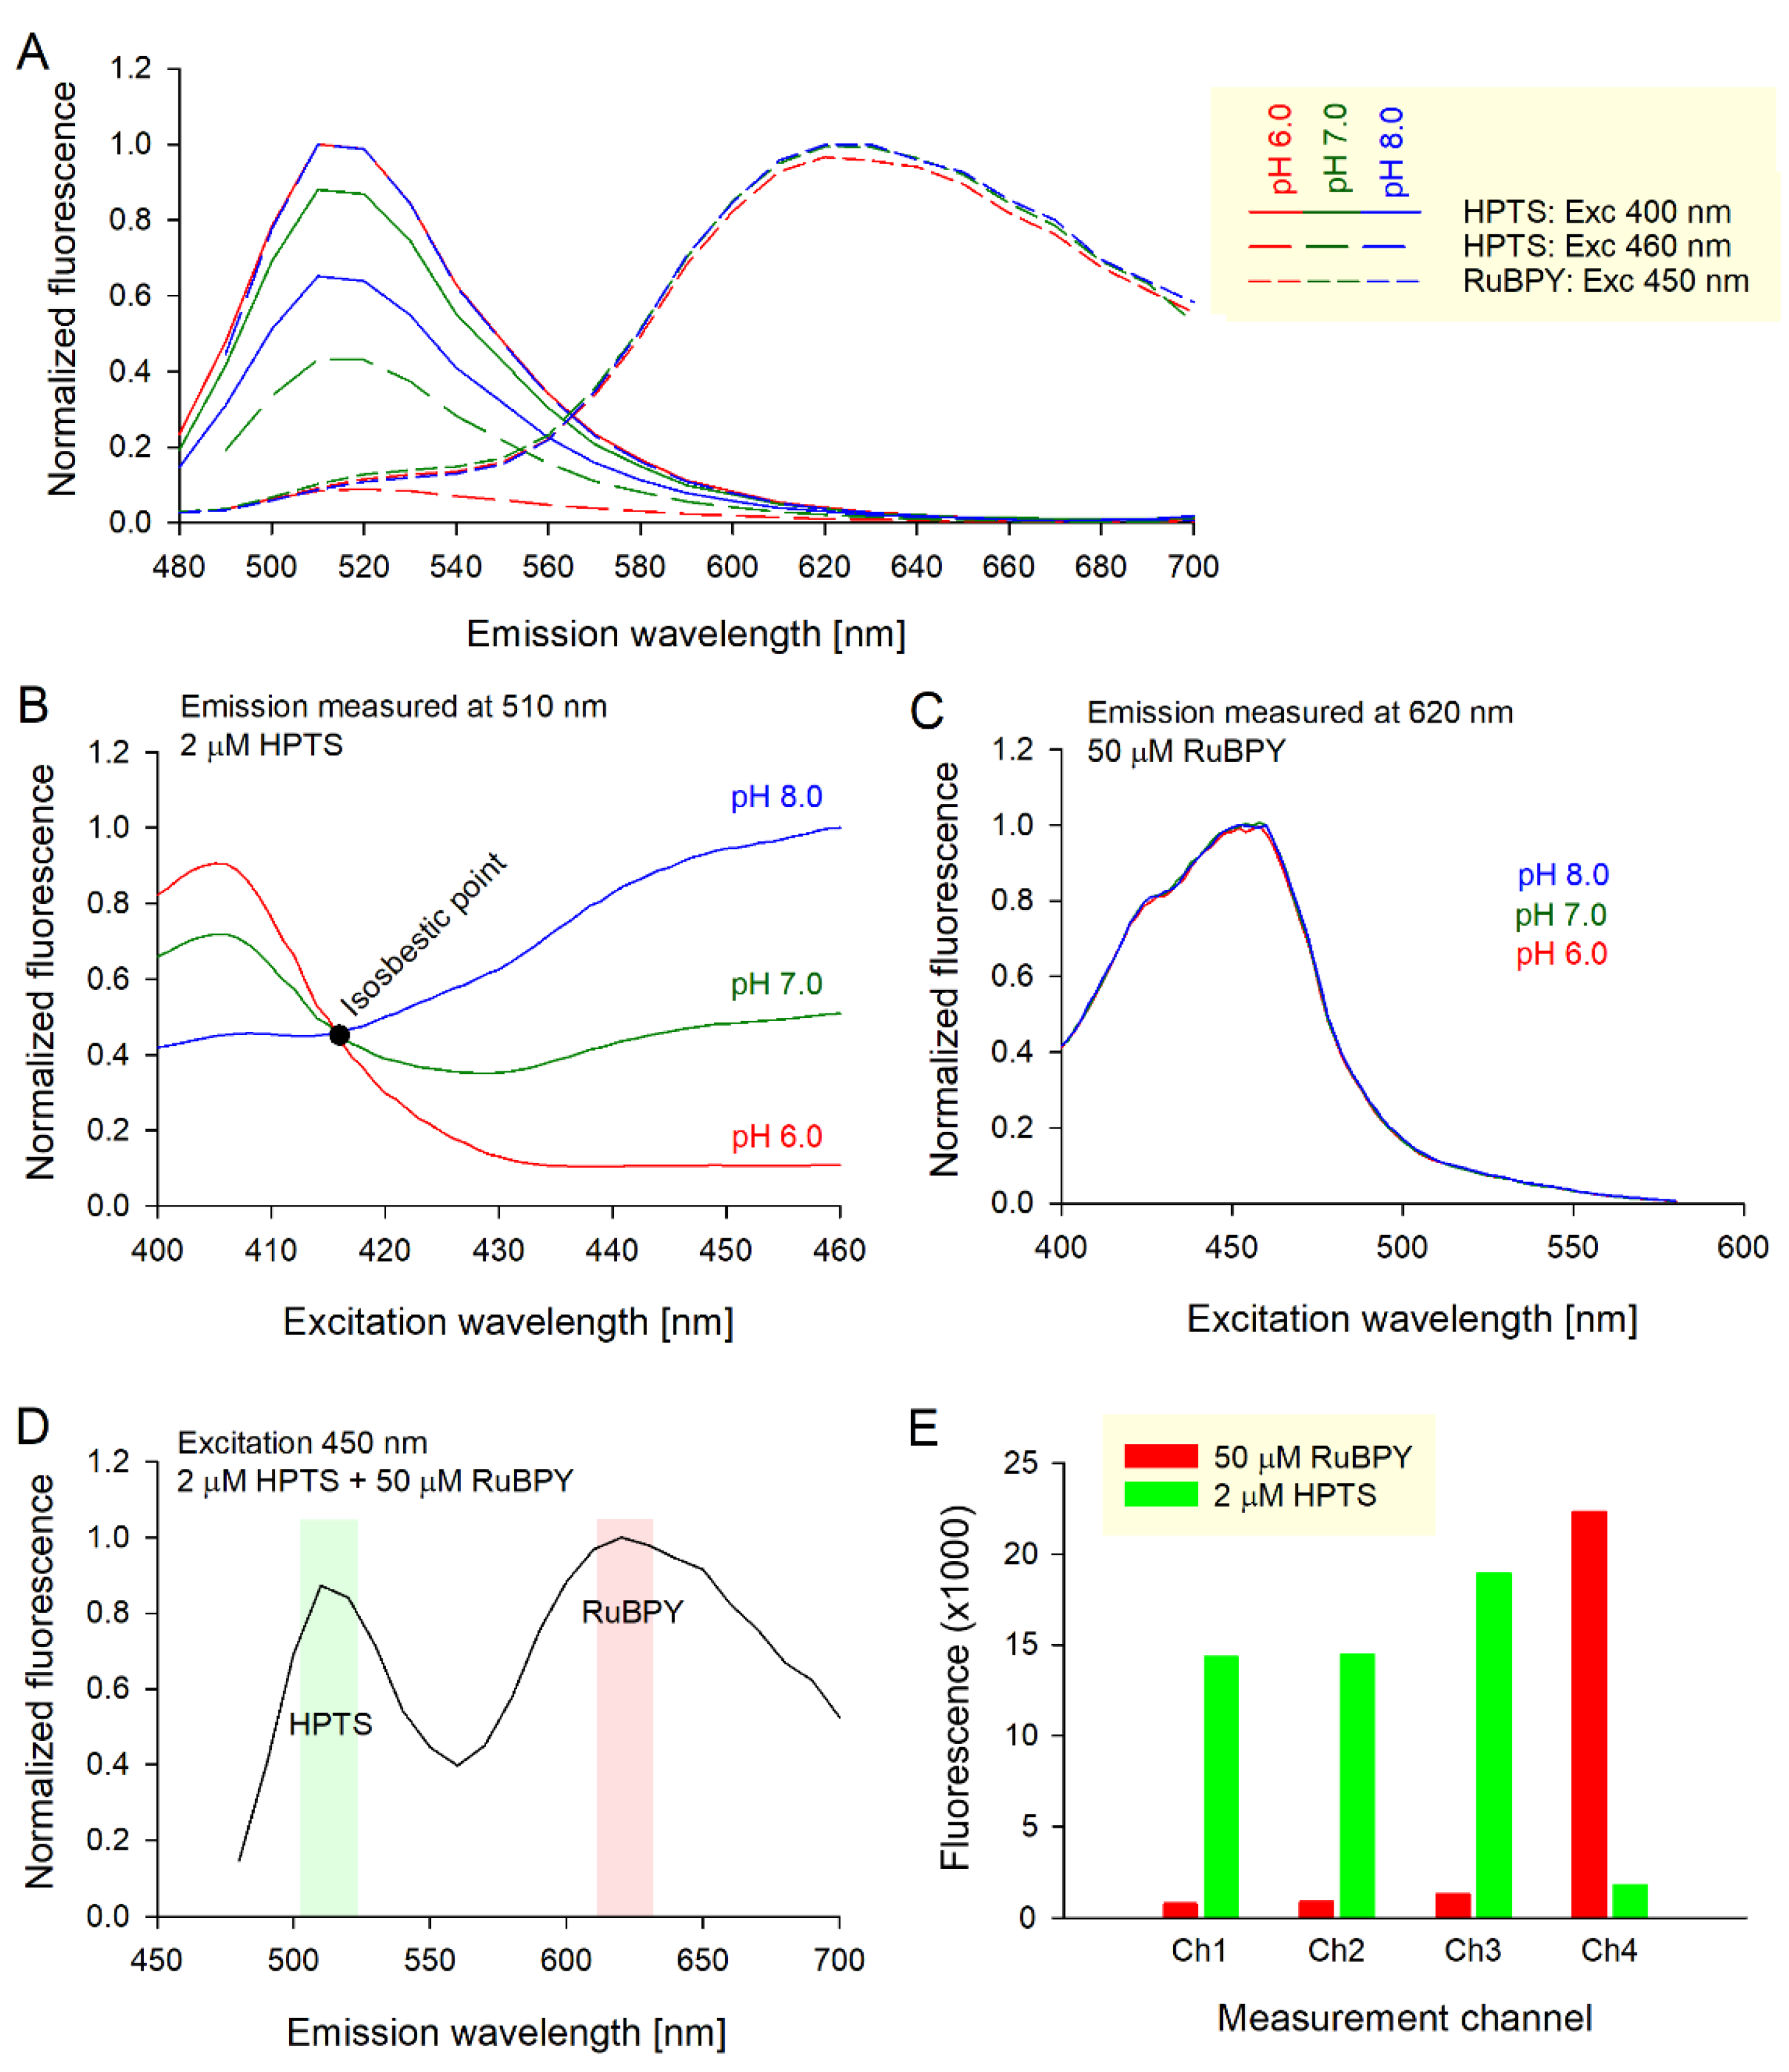
Figure 2.
(A) The calibration curve for the HPTS ratio (Ch2/Ch1) in normoxic and hypoxic conditions. Best-fit to Equation (1) with constants listed in Table 1. (B) Hypoxia-sensitive ratio of isosbestic HPTS to RuBPY (as Ch3/Ch4). Hypoxia (<1% O2) reduces the Ch3/Ch4 ratio but is pH-insensitive. (C) Three-point calibration for 0.1%, 10%, and 21% O2.
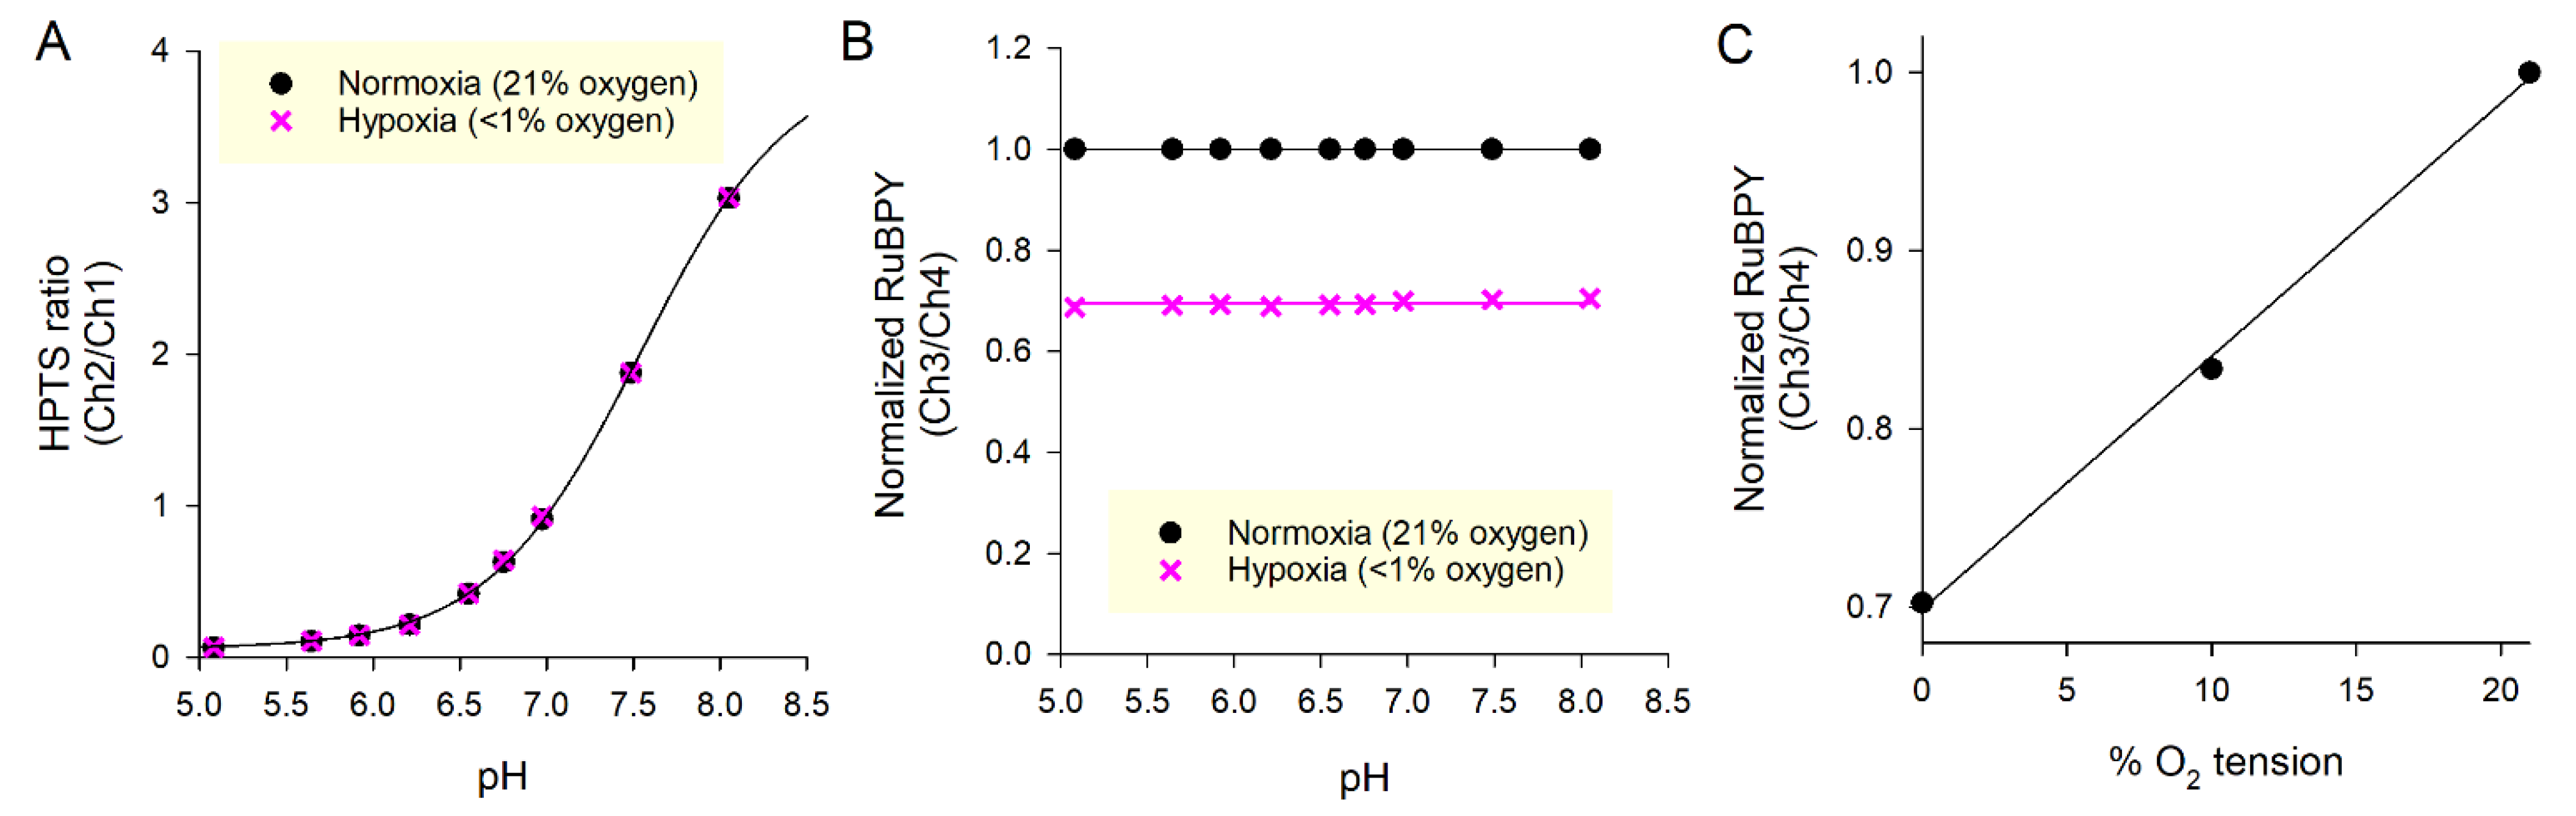
Figure 3.
Measuring the pH buffering capacity. (A) Stepwise addition of 0.5 mM HCl or NaOH to media of undetermined buffering capacity. The inverse of the slope gives average buffering capacity for the entire pH range. (B) Buffering capacity expressed as the ratio of HCl (or NaOH) added to pH change, plotted against the midpoint of the pH change. The best fit line accounts for pH-sensitivity of buffering capacity. This function should be used whenever converting between pH changes and H+ fluxes.
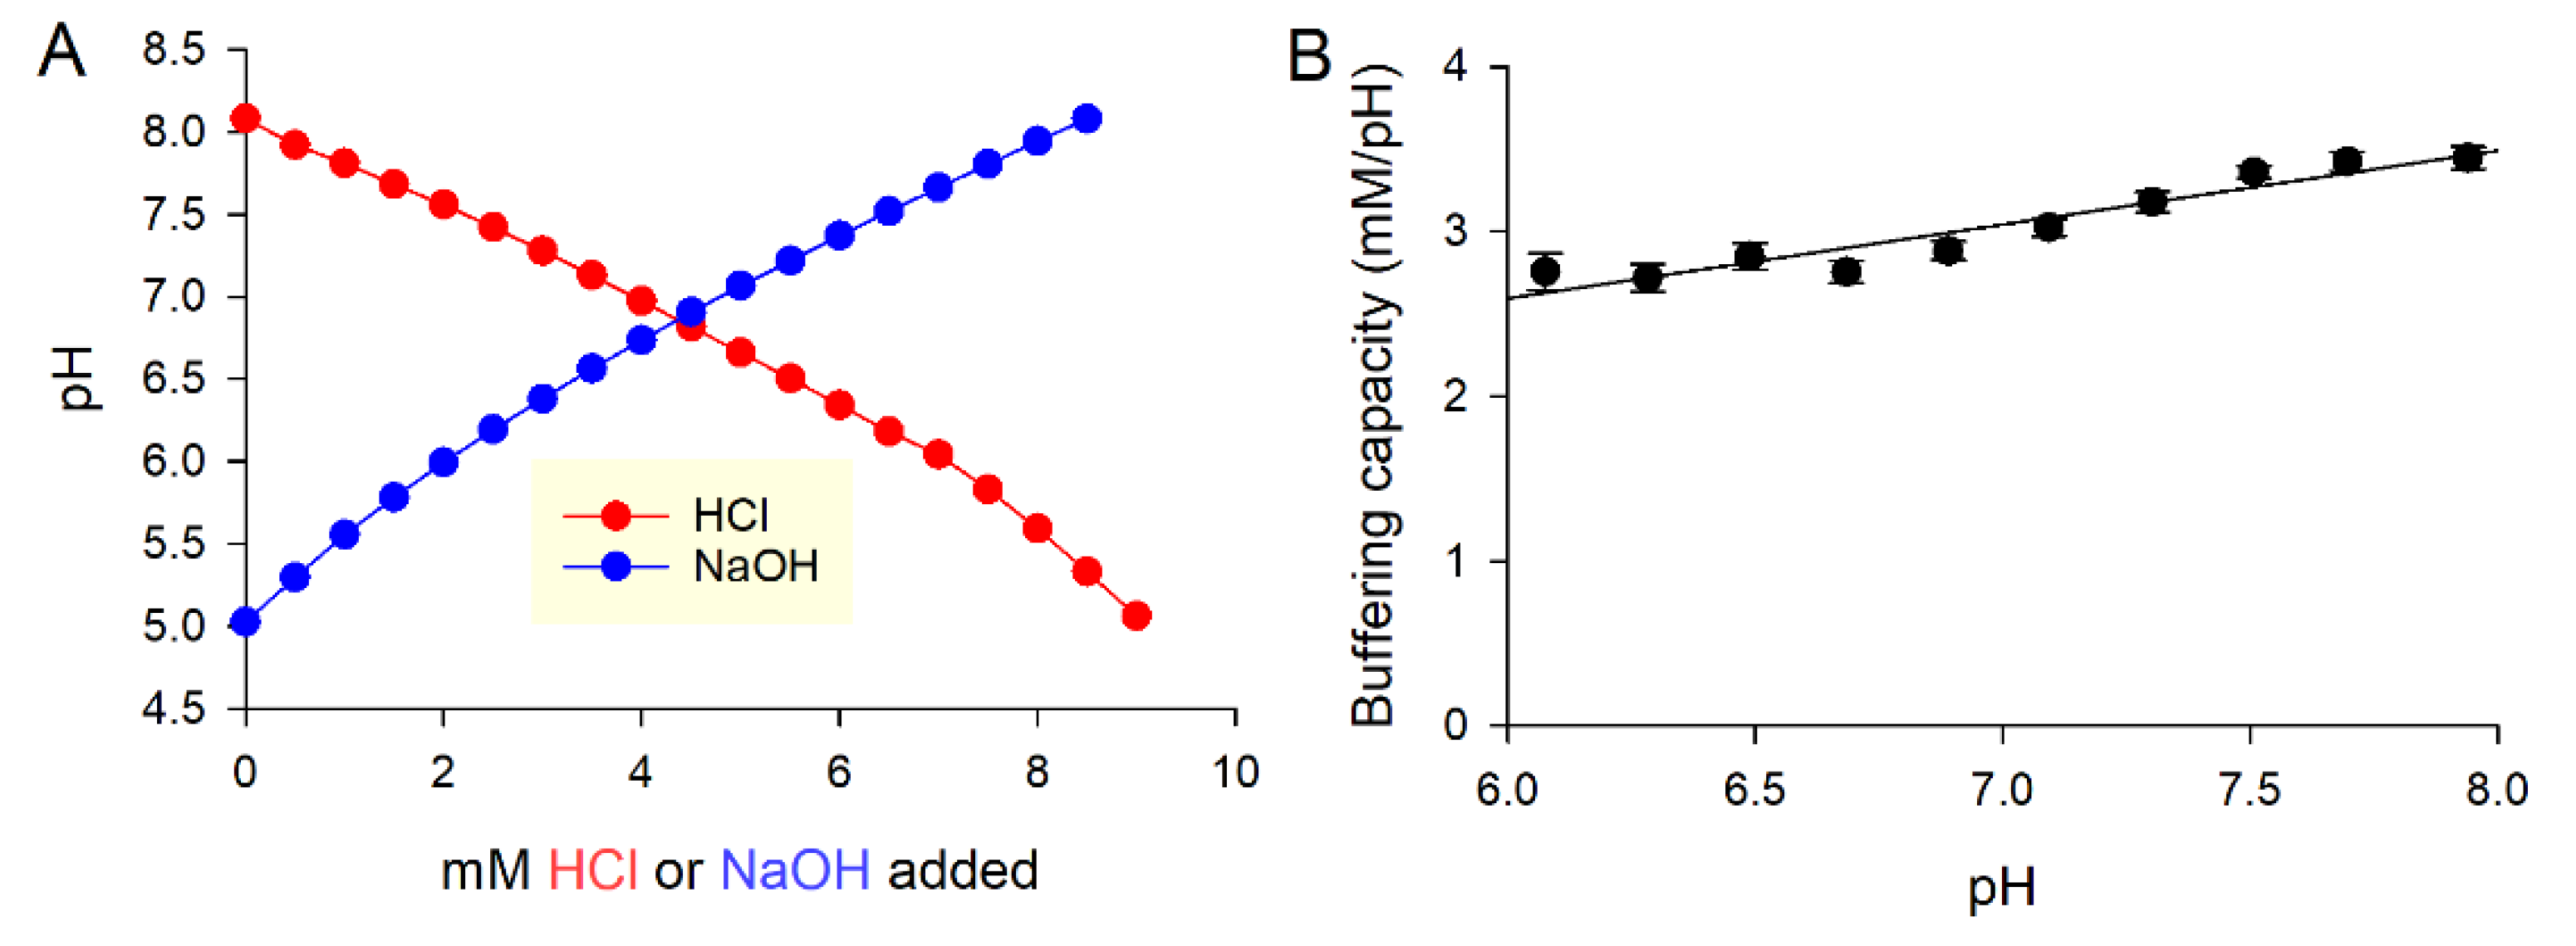
Figure 4.
Characterizing the open system with respect to O2 dynamics. (A) The protocol for measuring O2 permeability across a layer of medium (typically 100 µL) and oil (varied between 0 and 150 µL). (B) Exemplar time course from well covered with 150 µL oil. Transferring a plate to an atmosphere of normal oxygen in the reader triggers re-oxygenation, which was monitored every 10 min. The best fit gives a time constant, which is inversely related to O2 permeability. (C) Relationship between the time constant of O2 ingress and the volume of oil added to wells. Red shading denotes time constant attributable to medium, and gray denotes that due to diffusion through oil.
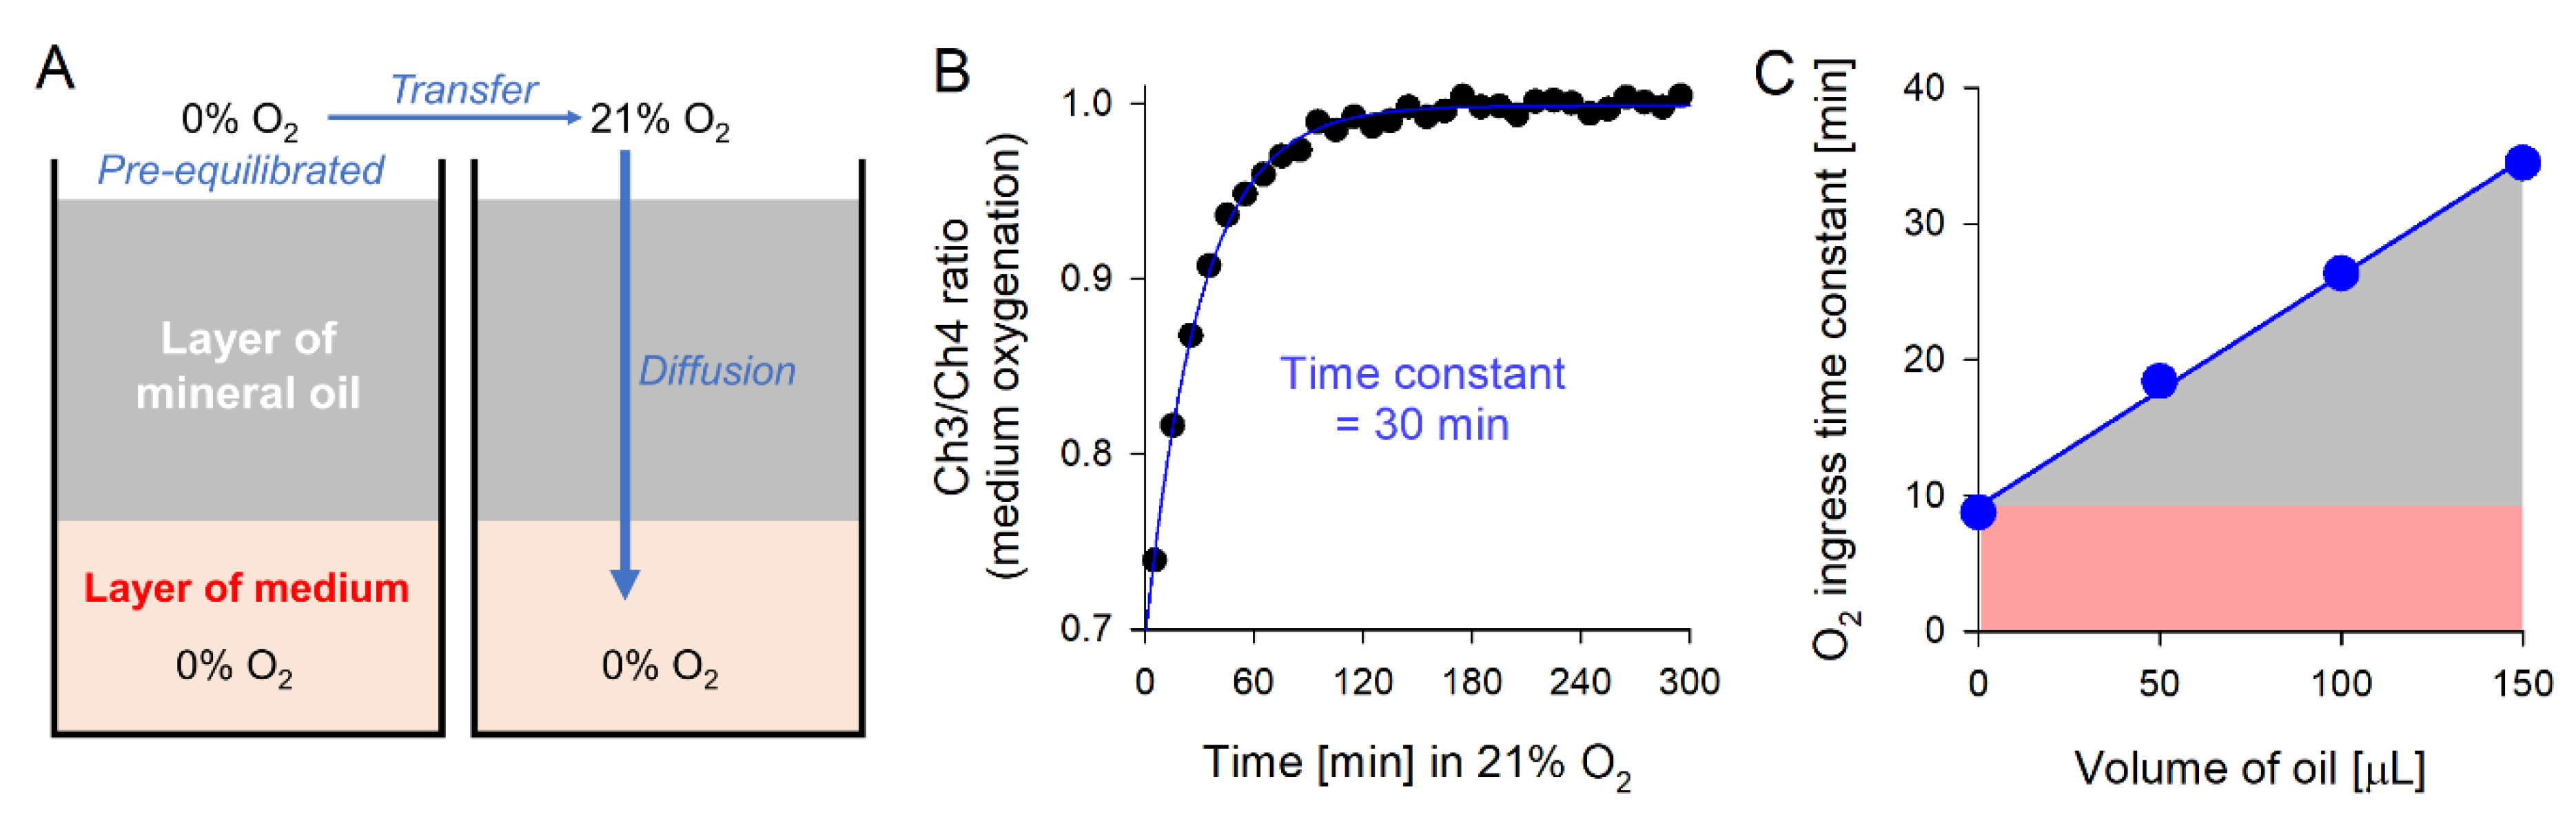
Figure 5.
Using CellTracker Orange (CTO) to normalize for cell number. (A) The emission spectrum of CTO, excited at 540 nm. (B) The optimal CTO excitation is 540 nm, which ensures that the signal is resolvable from HPTS and RuBPY. (C) The correlation between CTO fluorescence and count of human red blood cells. (D) The correlating CTO signal with the number of plated AsPC1 and MIA-PaCa2 cells in wells of a 96-well plate. (E) Superfused MIA-PaCa2 cells imaged confocally. Fluorescence images taken during superfusion at pH 7.4 (baseline; 20 mM HEPES-buffered solution), after 10 min of superfusion at pH 6.4, and 10 min after returning to normal pH. Two exemplar experiments are shown. (F) Fluorescence images taken during superfusion in normoxic solution (baseline), after 2 min of superfusion in anoxic conditions (superfusate contained 1 mM dithionite, 100% N2), and 2 min after returning to normoxia. Two exemplar experiments shown.

Figure 6.
Metabolic profiling of PDAC cell lines. (A) Time courses of pH and O2 for AsPC1 (blue), MIA-PaCa2 (red), and PANC1 (green) plated at 30, 50, or 70k cells per well. Thicker lines denote higher cell density. Blank time courses were obtained from cell-free wells. Media were prepared using DMEM 5030 and contained 2 mM HEPES and 2 mM MES, 25 mM glucose, supplemented with 10% FBS, 1% penicillin–streptomycin mixture. (B) Cumulative H+ production and O2 consumption, calculated using Equations (7) and (8). (C) Data from a and b replotted as a function of cell number, measured by CTO fluorescence. Plots with white background relate to end-point pH and O2, and plots with gray background relate to cumulative H+ production and O2 consumption. The black star symbol denotes data from cell-free wells. Plots represent a mean of 3 biological repeats.
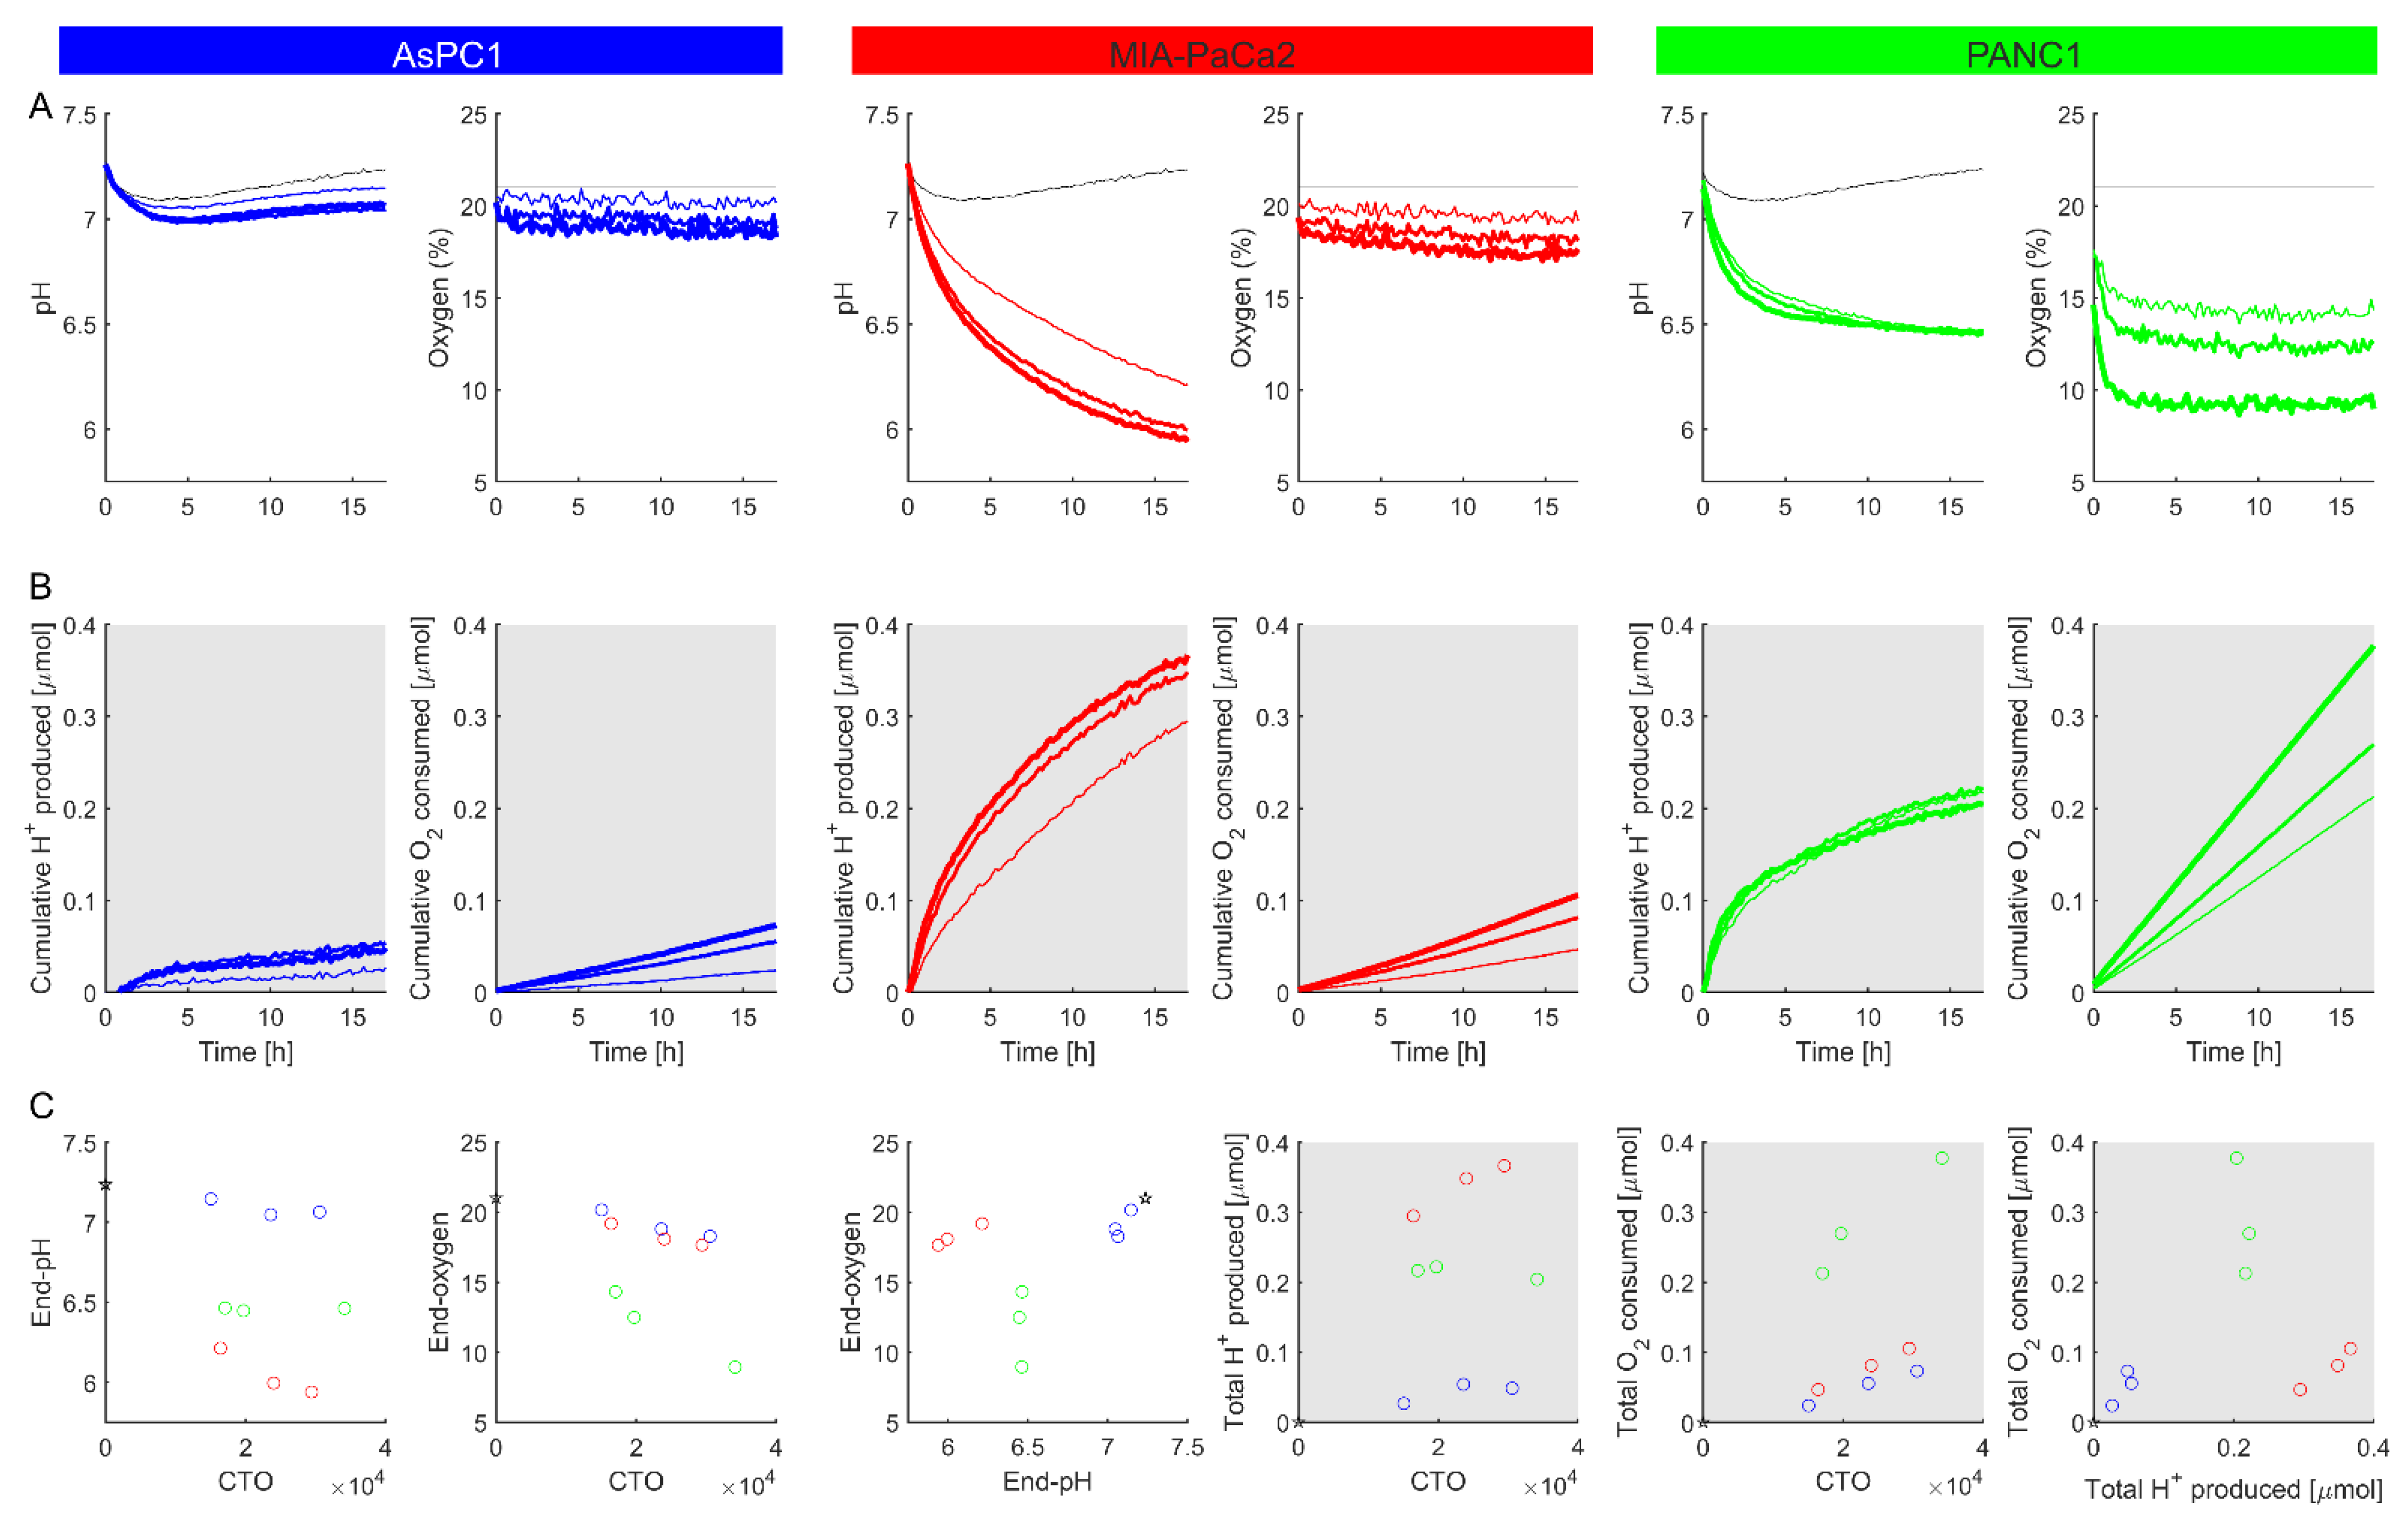
Figure 7.
Using the method to study the response to a change in metabolic substrate. (A) Time courses of pH and O2 measured for MIA-PaCa2 (red) and PANC1 (green) plated at 70k cells per well. Thick dashed lines denote media containing galactose (25 mM) in place of glucose. Media contained 20 mM HEPES, 25 mM glucose or galactose, 25 mM NaCl and was supplemented with 10% FBS, 1% penicillin–streptomycin mixture, 1% GlutaMAX, and 1% sodium pyruvate. (B) The cumulative H+ production and O2 consumption, calculated using Equations (7) and (8). Plots represent a mean of 3 biological repeats.
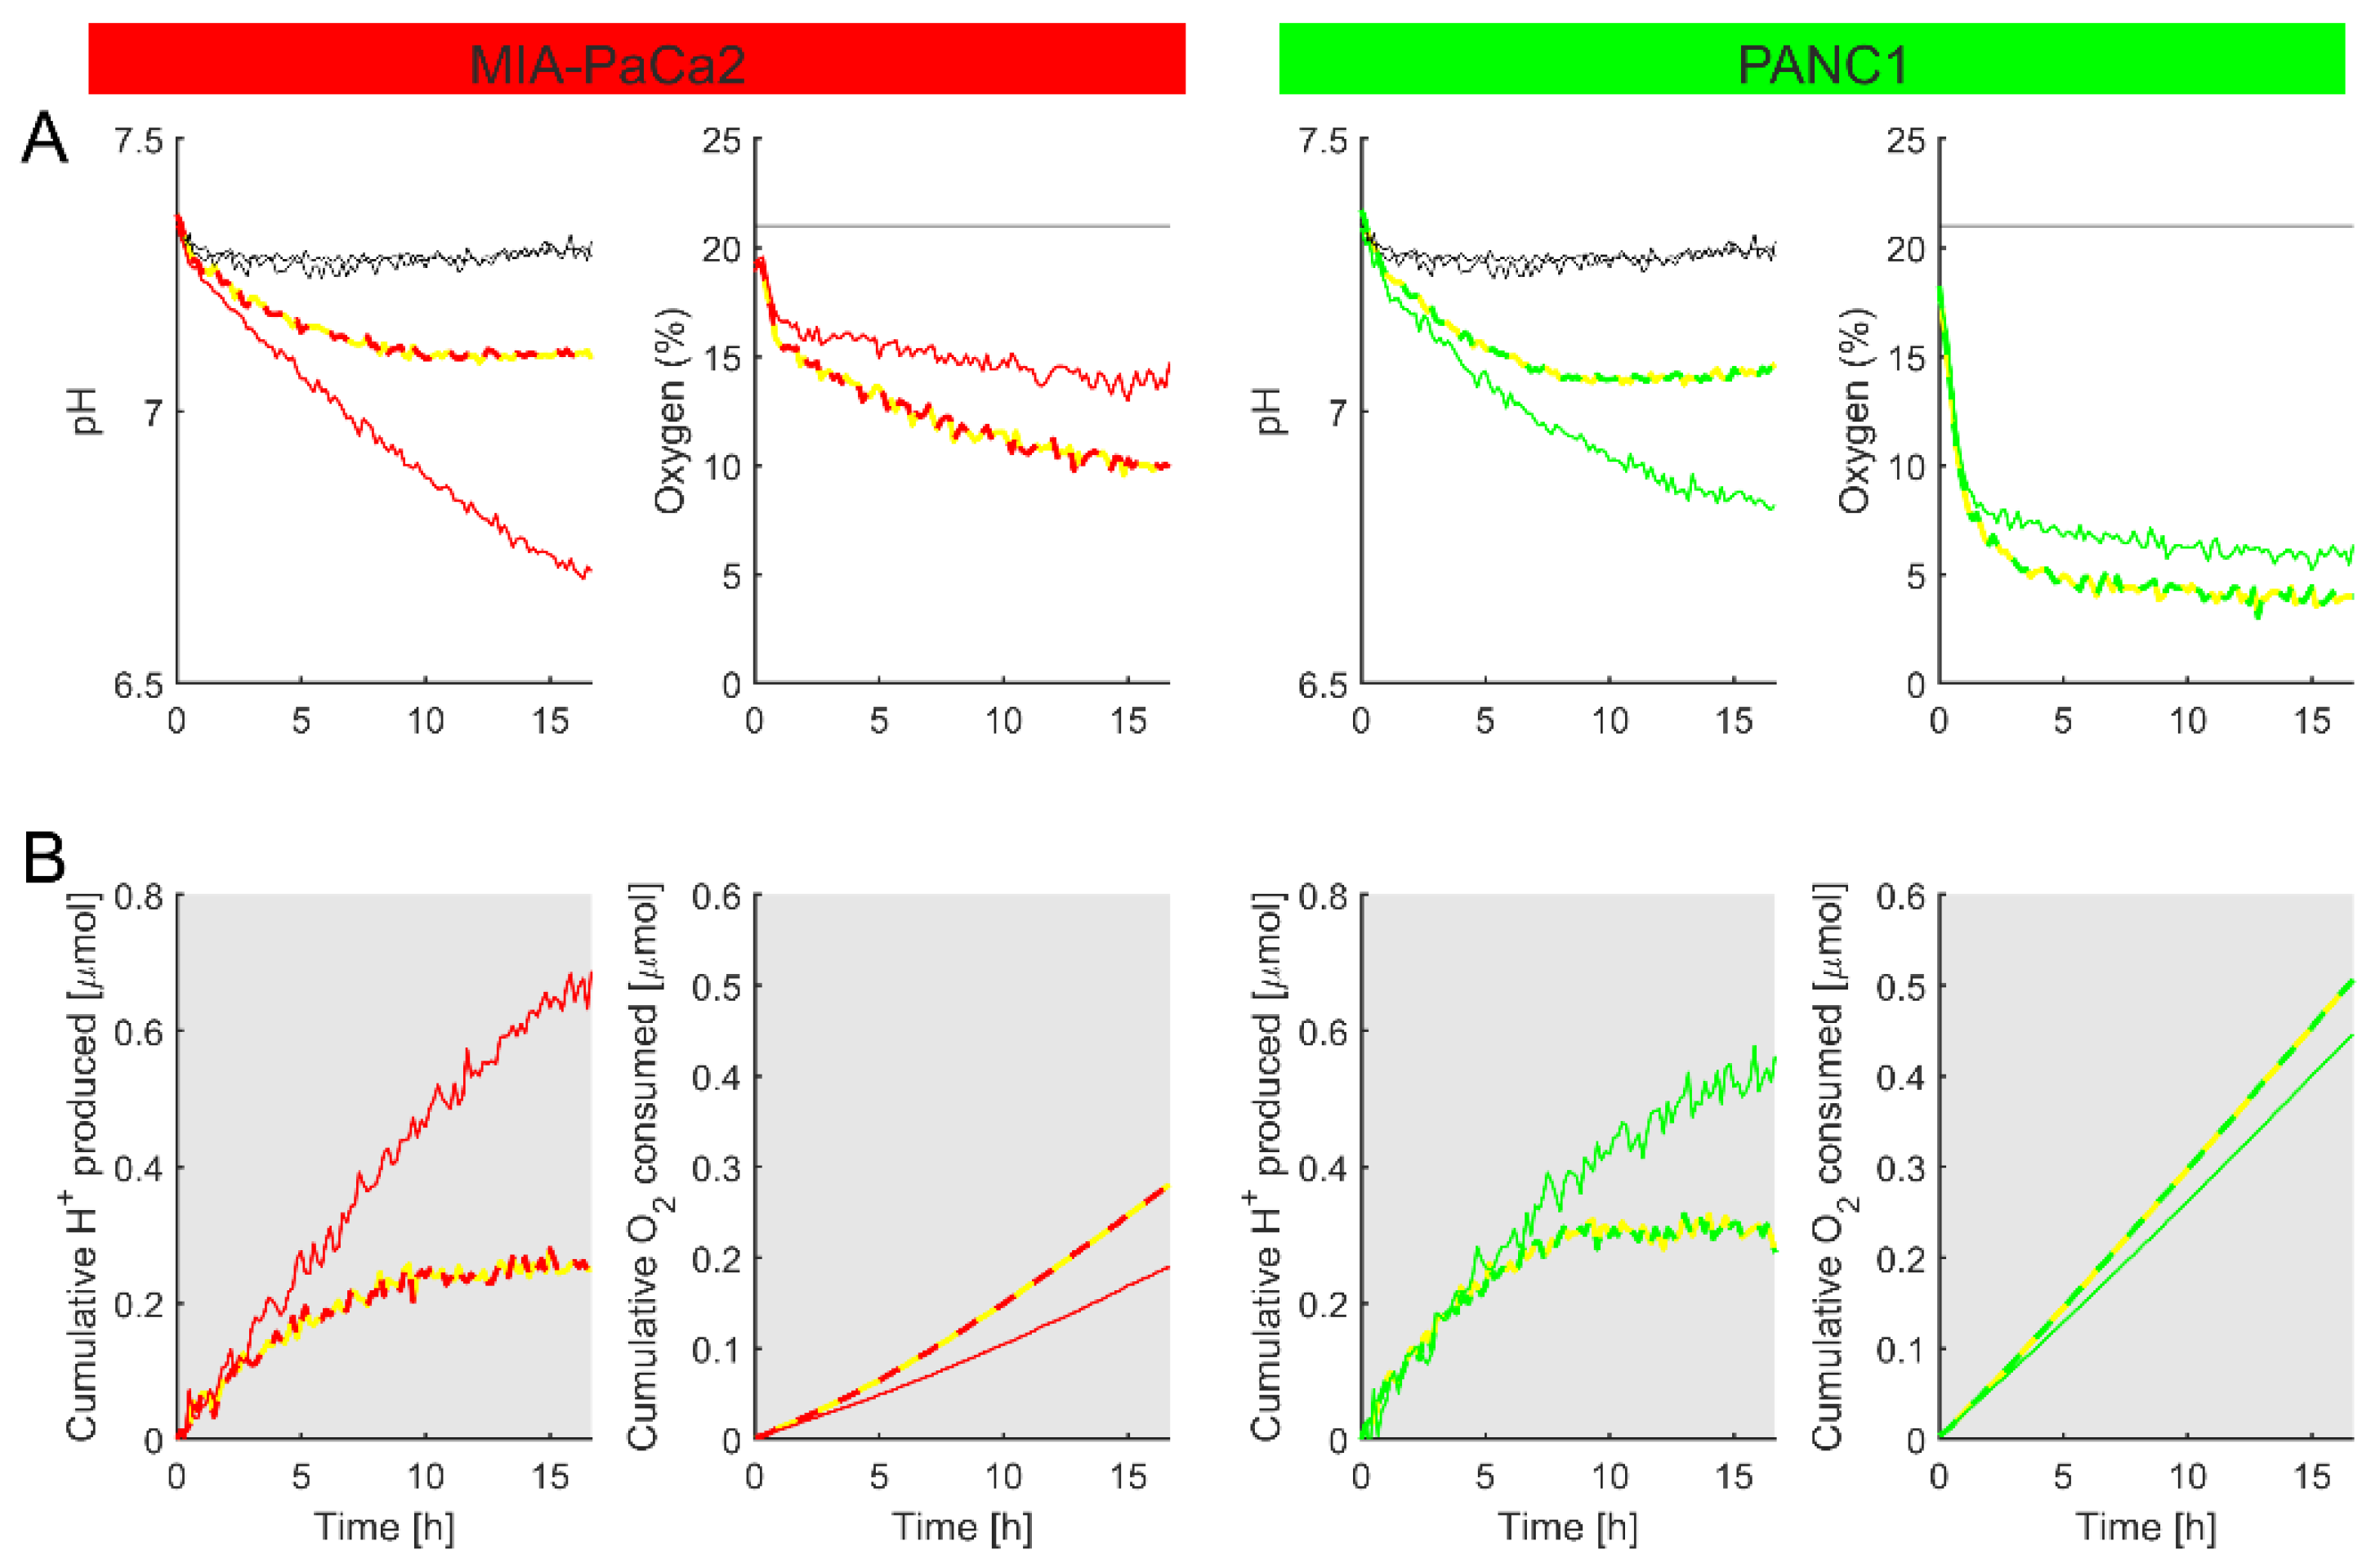
Figure 8.
Using the method to study the effect of metabolic inhibitors. (A) Time courses of pH and O2 for MIA-PaCa2 (red) and PANC1 (green) plated at 70k cells per well. The metabolic substrate was glucose throughout. Media contained 2 mM HEPES and 2 mM MES, 25 mM glucose, supplemented with 10% FBS, 1% penicillin–streptomycin mixture, 1% GlutaMAX, and 1% sodium pyruvate. Thick dashed lines indicate the effect of 10 µM rotenone. (B) The cumulative H+ production and O2 consumption, calculated using Equations (7) and (8). Plots represent a mean of 3 biological repeats.
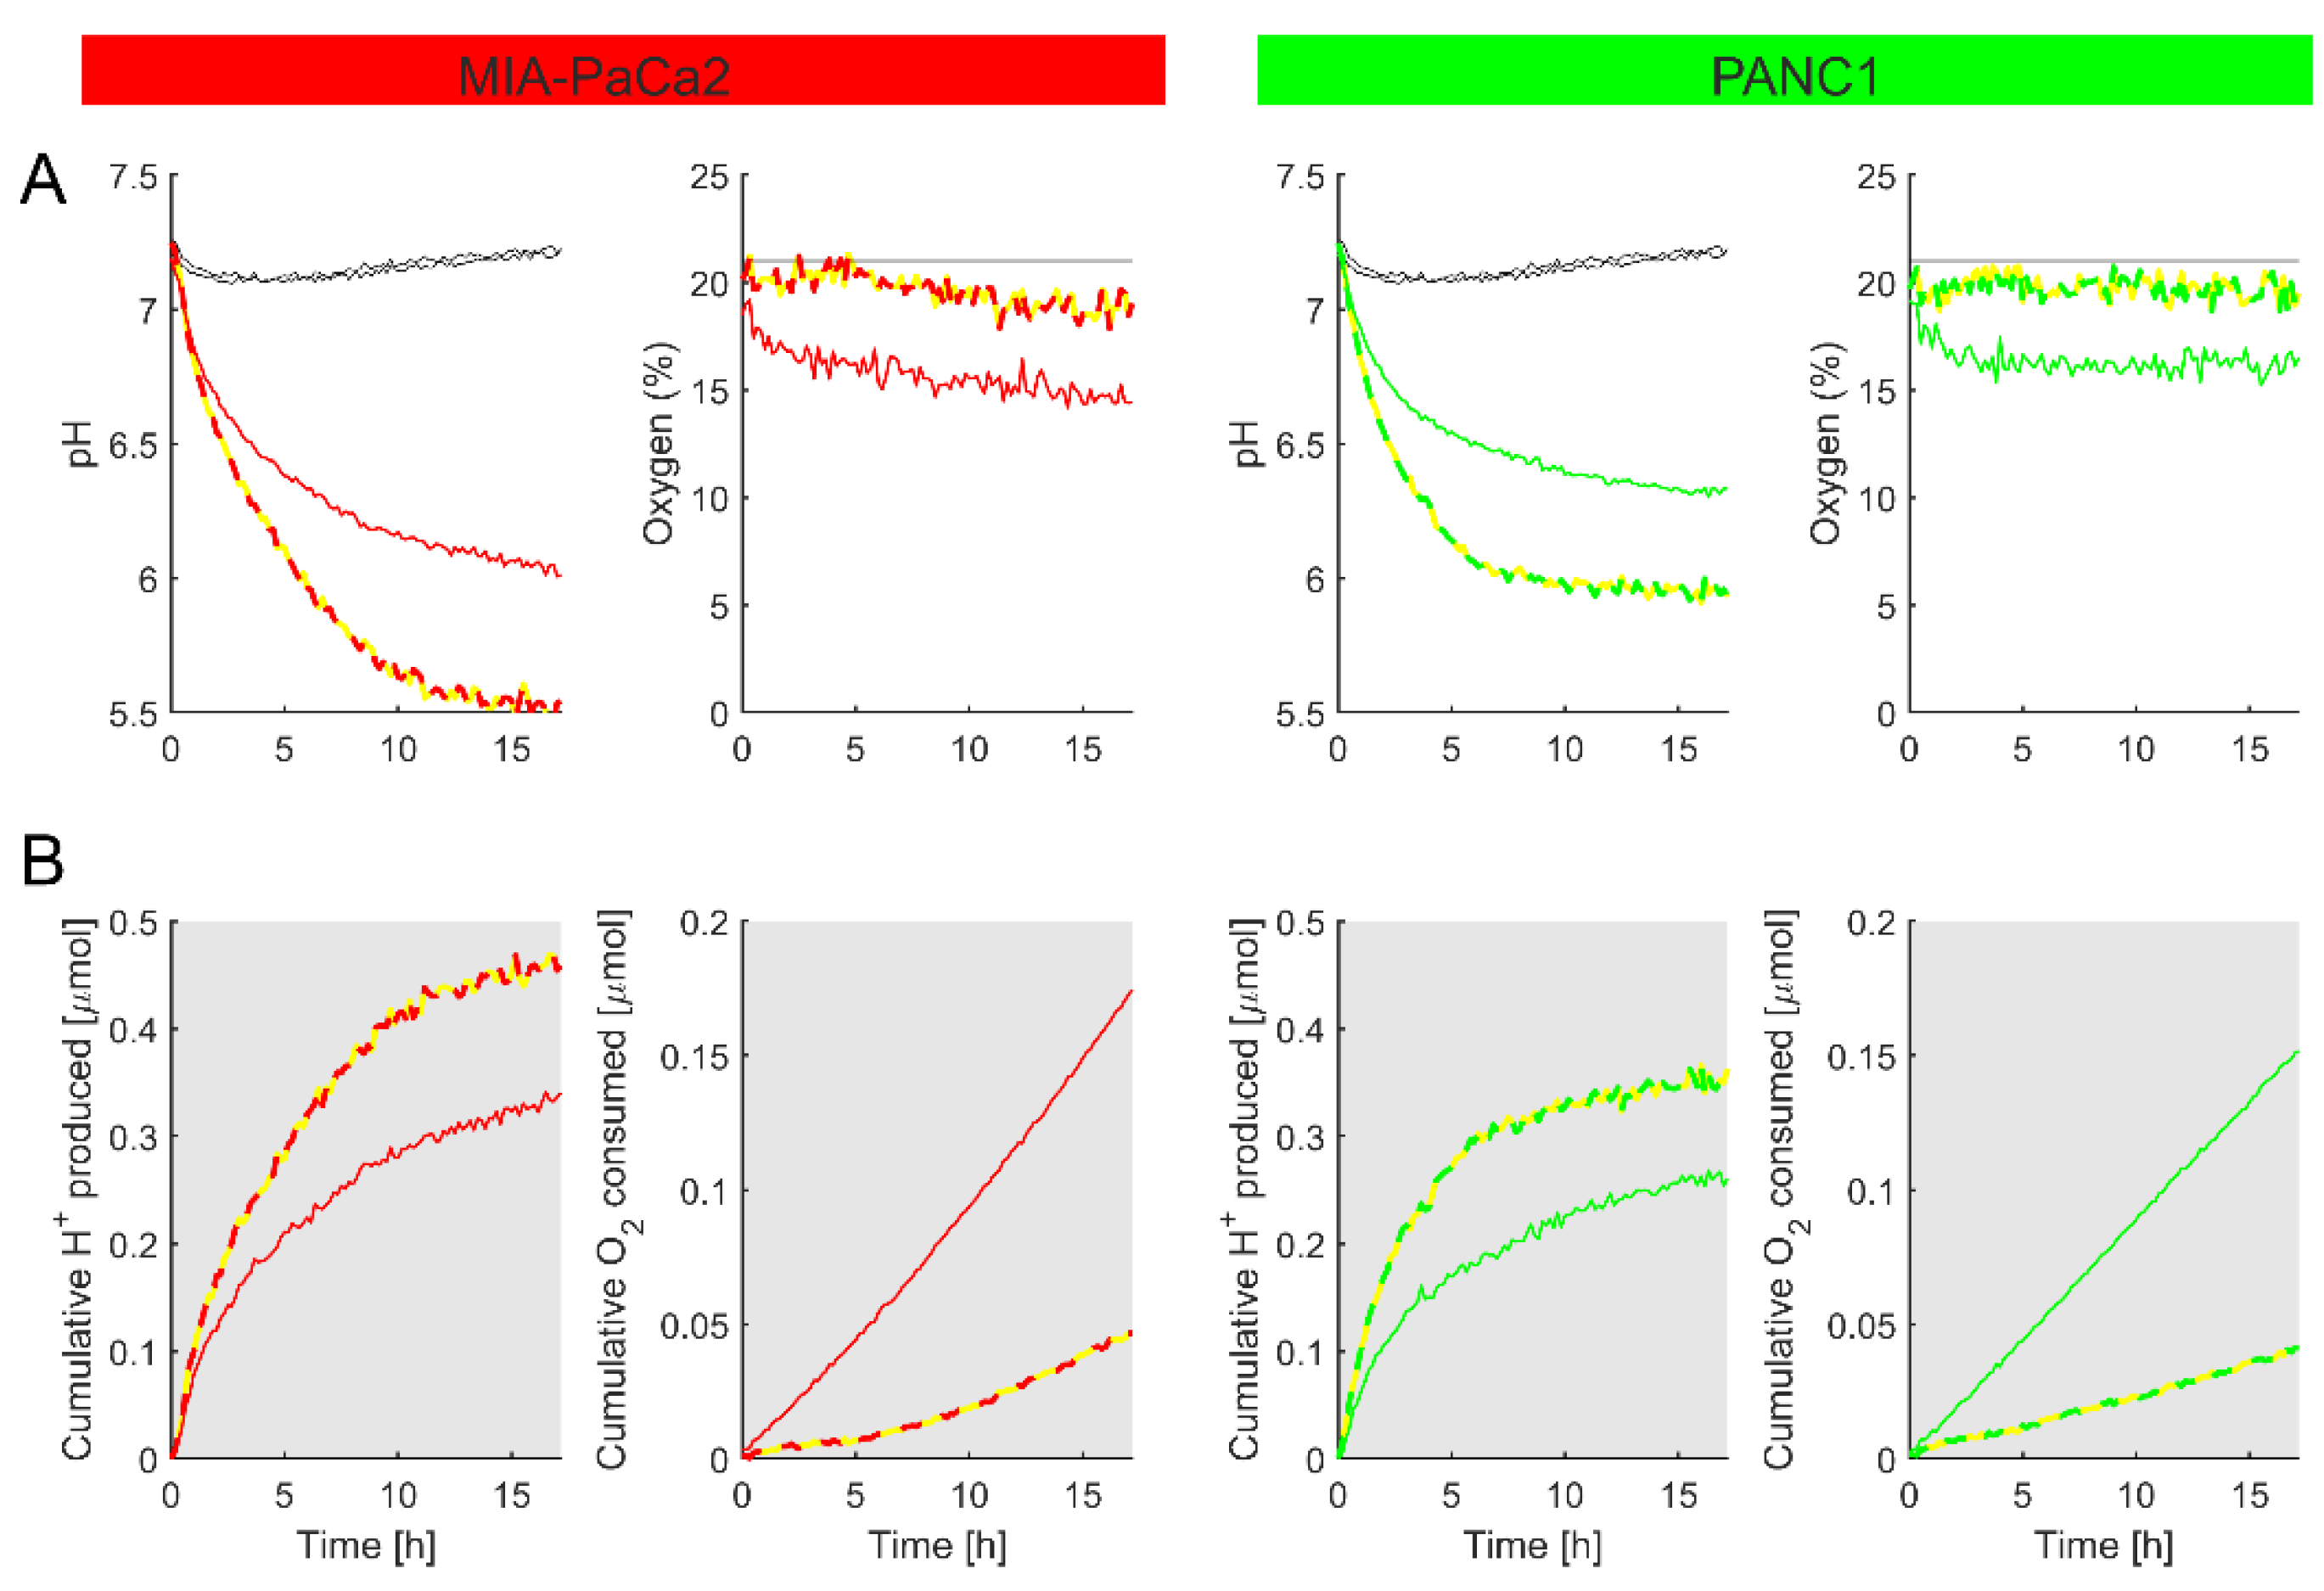
Figure 9.
Using the method to study metabolism in primary myocytes freshly isolated from the mouse ventricle. (A) Time courses of pH and O2. A suspension of myocytes in media was probed for O2 and pH over a period of 15 h, shortly after enzymic isolation from a mouse heart. Media contained 2 mM HEPES and 2 mM MES, 25 mM glucose, supplemented with 10% FBS, 1% penicillin–streptomycin mixture, 1% GlutaMAX, and 1% sodium pyruvate. (B) The cumulative H+ production and O2 consumption, calculated using Equations (7) and (8). Myocytes have a high oxidative metabolism, causing the rapid depletion of O2. Some degree of glycolytic metabolism was also noted. Mean of 3 technical repeats.


Table 1.
Best fit to calibration curves in Equations (1) and (2).
| Calibration Variable | Best-Fit |
|---|---|
| pKa | 7.5383 |
| rmax | 3.9503 |
| rmin | 0.0603 |
| ranoxia | 0.6945 |
Publisher’s Note: MDPI stays neutral with regard to jurisdictional claims in published maps and institutional affiliations. |
© 2021 by the authors. Licensee MDPI, Basel, Switzerland. This article is an open access article distributed under the terms and conditions of the Creative Commons Attribution (CC BY) license (https://creativecommons.org/licenses/by/4.0/).
Share and Cite
MDPI and ACS Style
Blaszczak, W.; Tan, Z.; Swietach, P. Cost-Effective Real-Time Metabolic Profiling of Cancer Cell Lines for Plate-Based Assays. Chemosensors 2021, 9, 139. https://doi.org/10.3390/chemosensors9060139
AMA Style
Blaszczak W, Tan Z, Swietach P. Cost-Effective Real-Time Metabolic Profiling of Cancer Cell Lines for Plate-Based Assays. Chemosensors. 2021; 9(6):139. https://doi.org/10.3390/chemosensors9060139
Chicago/Turabian StyleBlaszczak, Wiktoria, Zhengchu Tan, and Pawel Swietach. 2021. "Cost-Effective Real-Time Metabolic Profiling of Cancer Cell Lines for Plate-Based Assays" Chemosensors 9, no. 6: 139. https://doi.org/10.3390/chemosensors9060139
Note that from the first issue of 2016, this journal uses article numbers instead of page numbers. See further details here.