
Level of Amyloid-β (Aβ) Binding Leading to Differential Effects on Resting State Functional Connectivity in Major Brain Networks
 , , , and
Abstract
:1. Introduction
2. Method
2.1. Participants
2.2. Dementia/Cognitive Impaired Subtype Classification
3. Imaging Protocol
3.1. [18F]Flutemetamol PET/CT Image Acquisition
3.2. MRI Acquisition: T1 MPRAGE Images
3.3. MRI Acquisition: Resting State Functional Images
4. Preprocessing of Images
4.1. Pre-Processing of Resting State Functional MRI
4.2. Voxel-Mirrored Homotopic Connectivity VMHC
4.3. Total Intra-Cranial Volume and Gray Matter Volume Calculation
5. Image and Statistical Analysis
5.1. Participants and Demographics
5.2. Global Aβ Protein Accumulation Analysis: PET/CT Images
5.3. Regional Aβ Protein Accumulation Analysis
5.4. IFC Analysis: VMHC Map Gerenrated from fMRI
5.5. Correlation Analysis between Aβ Protein Accumulation and IFC
6. Results
6.1. Demographics
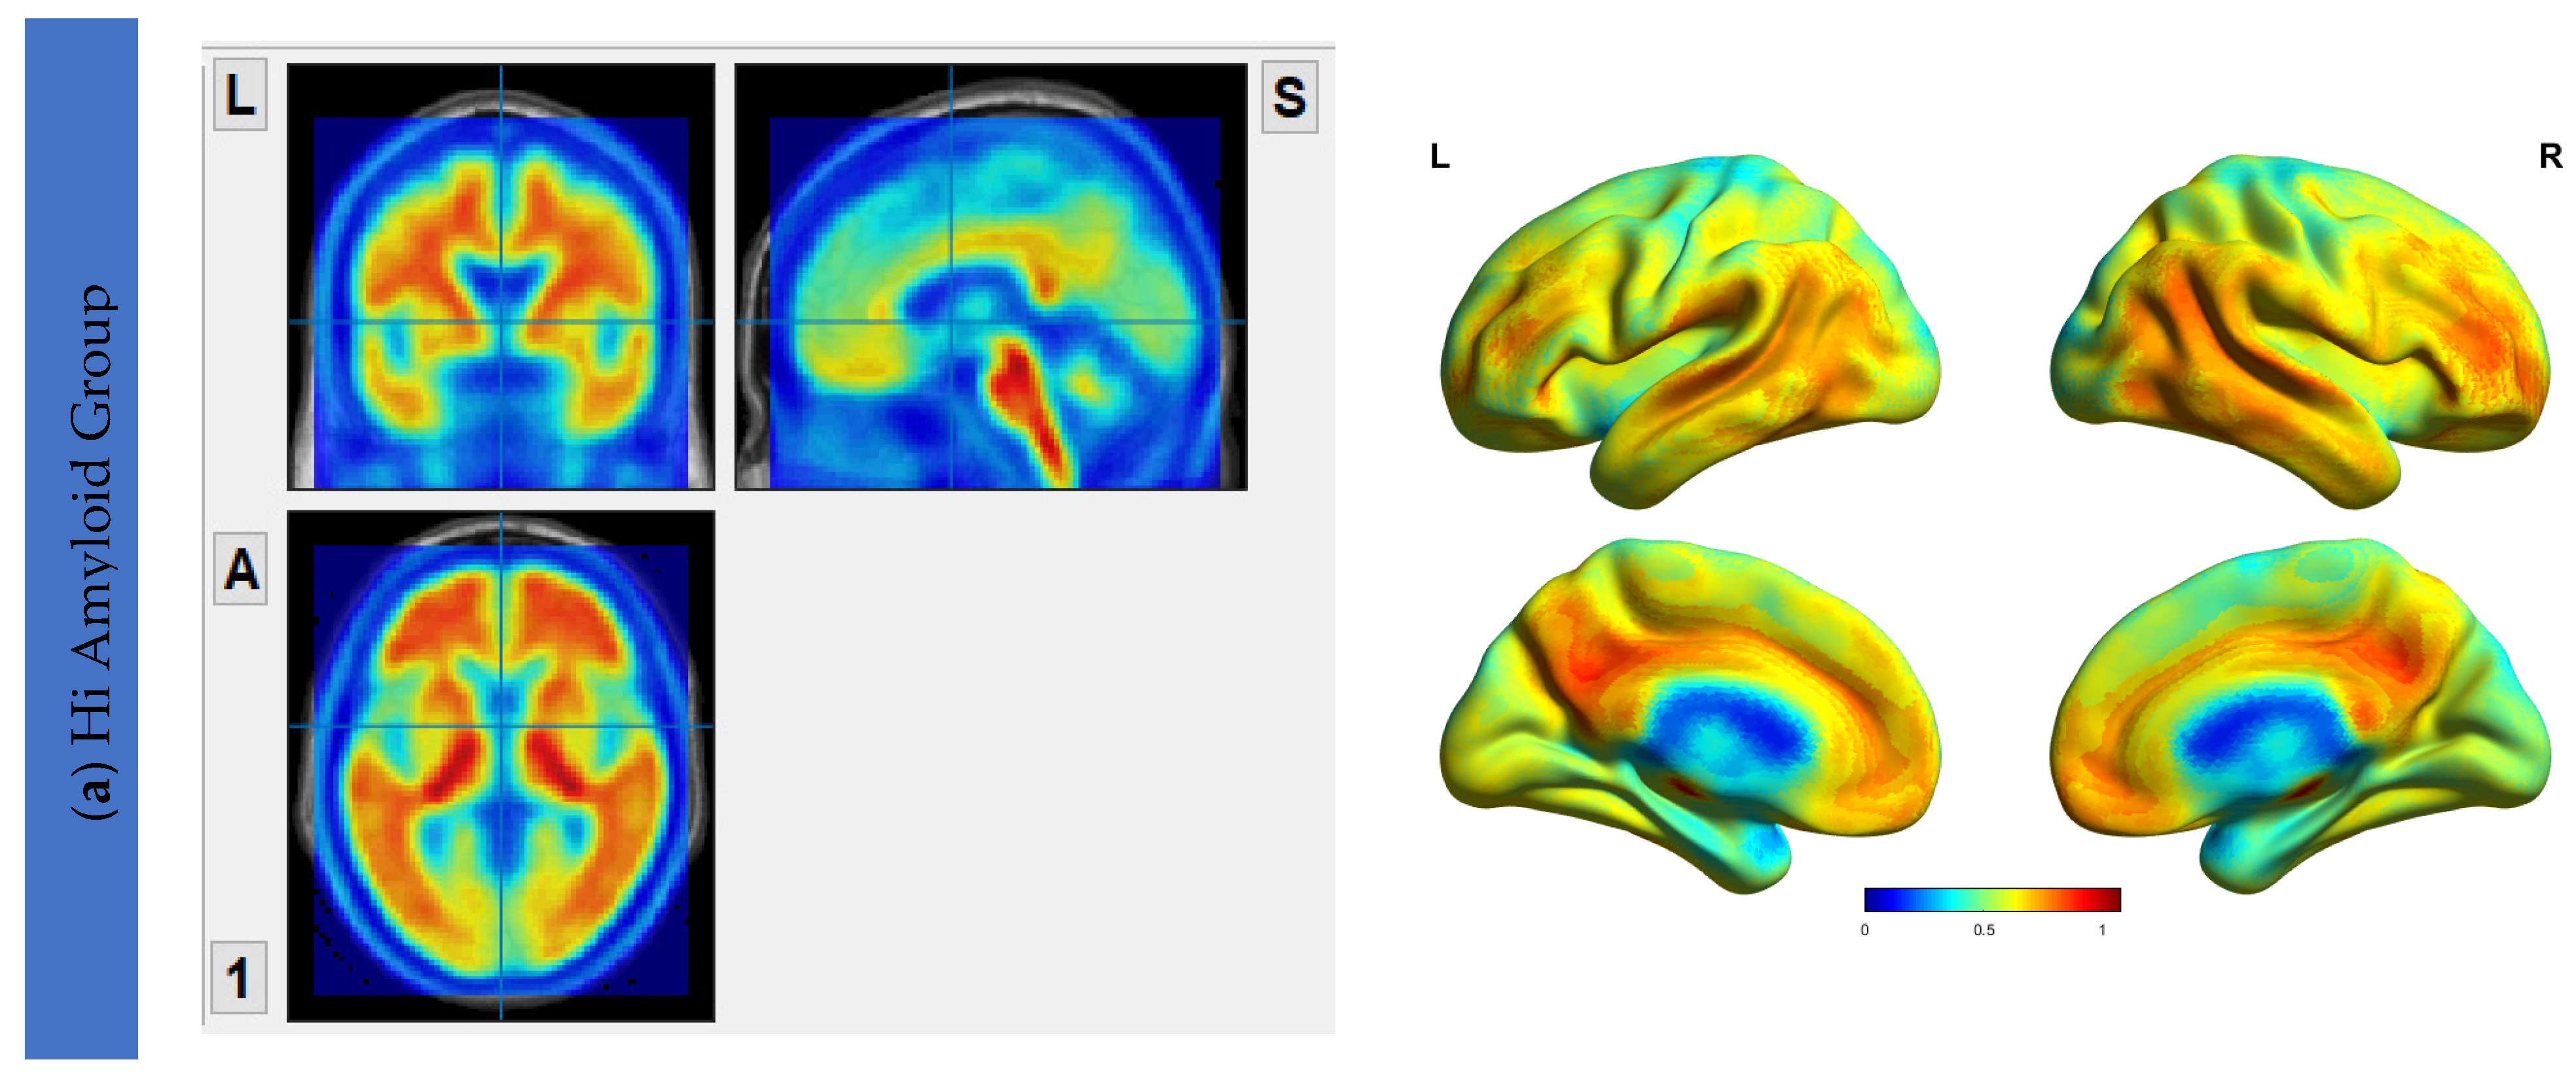
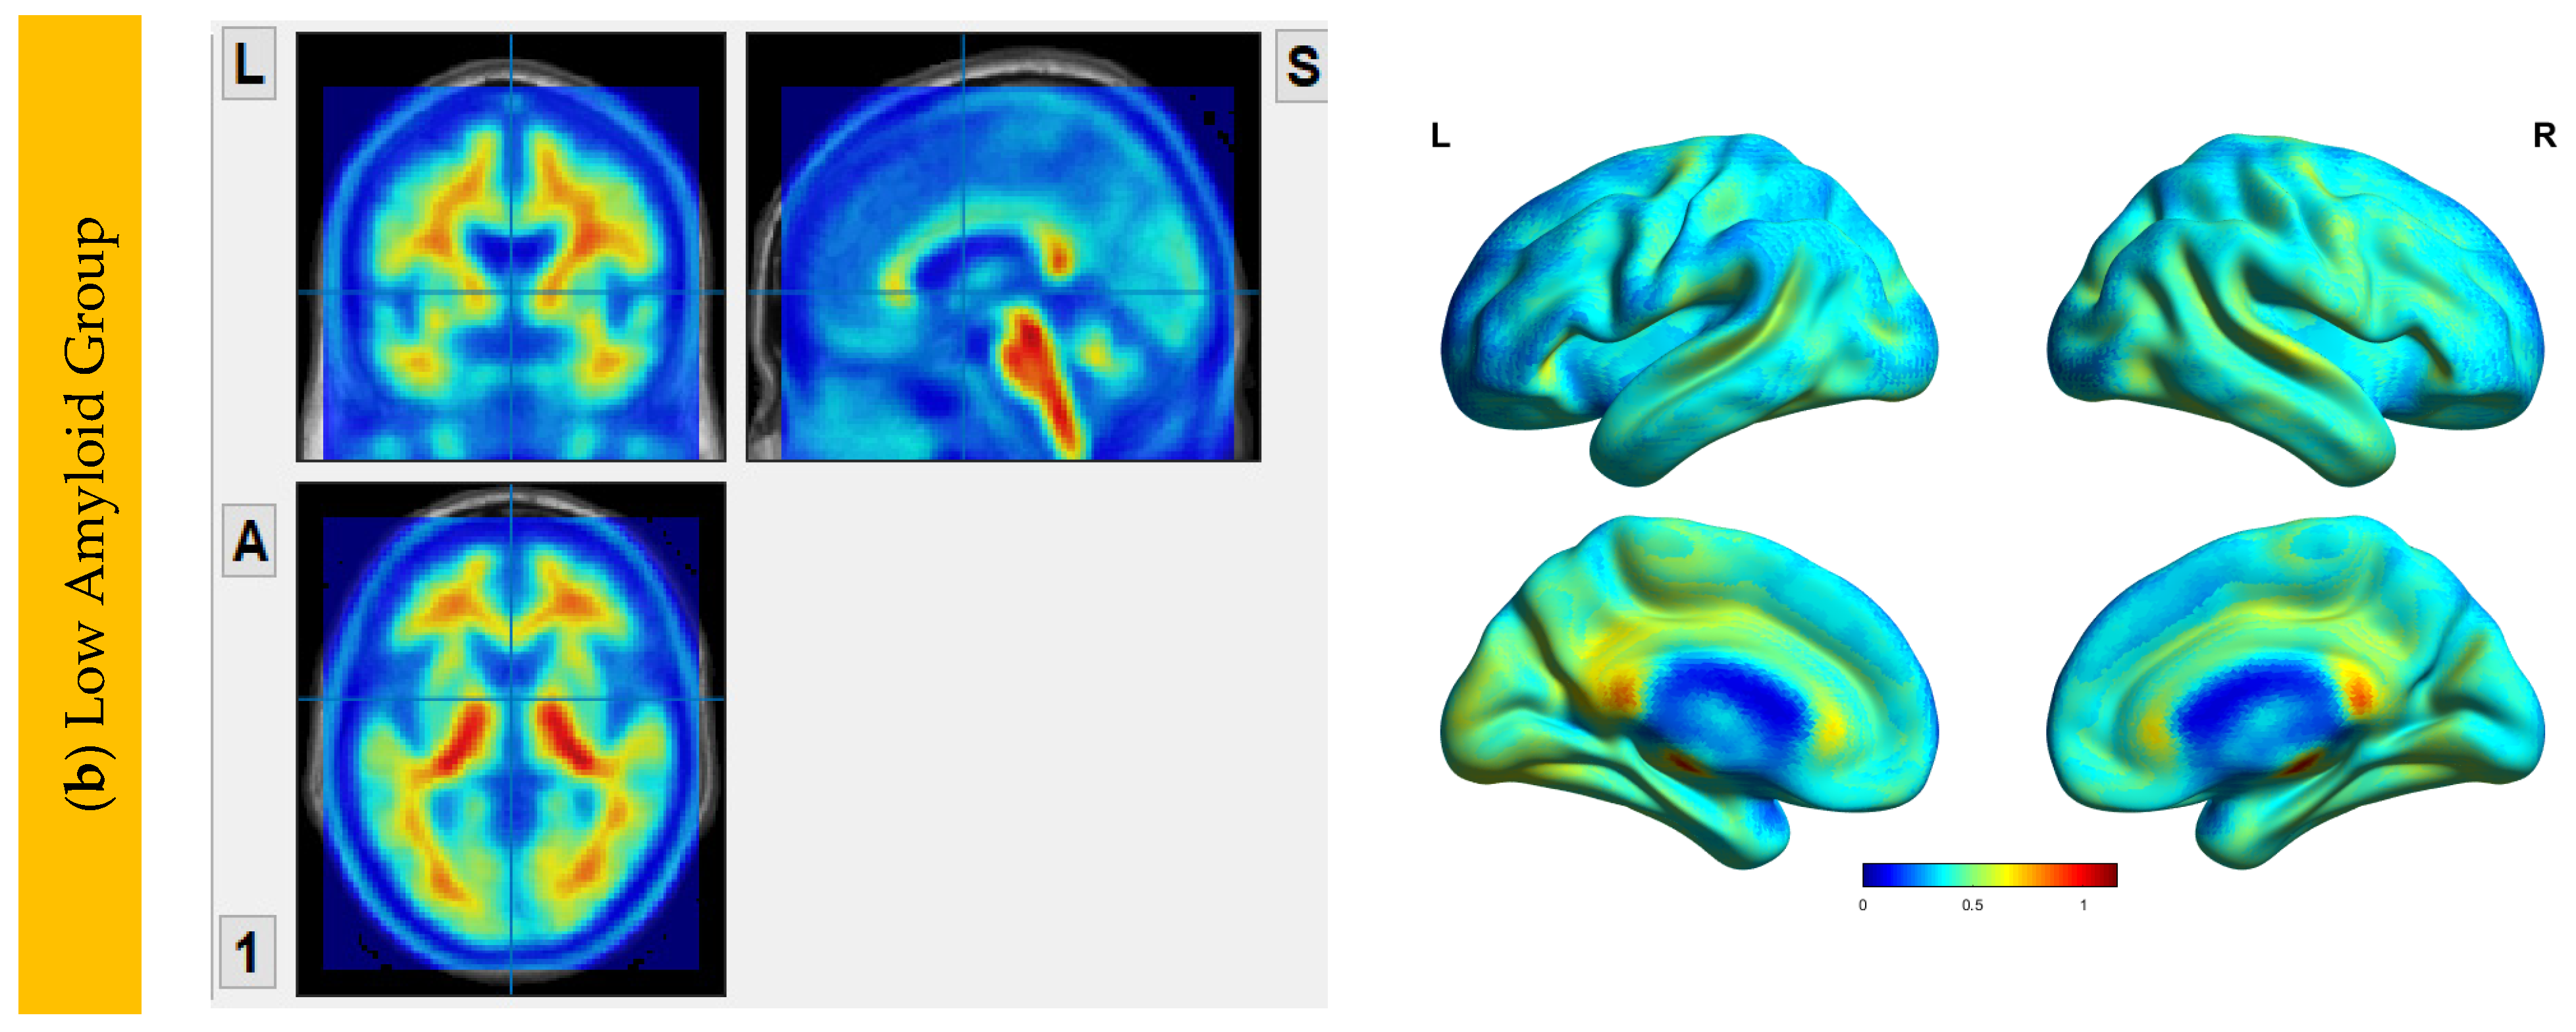
6.2. Aβ Protein Accumulation (SUVr) Maps
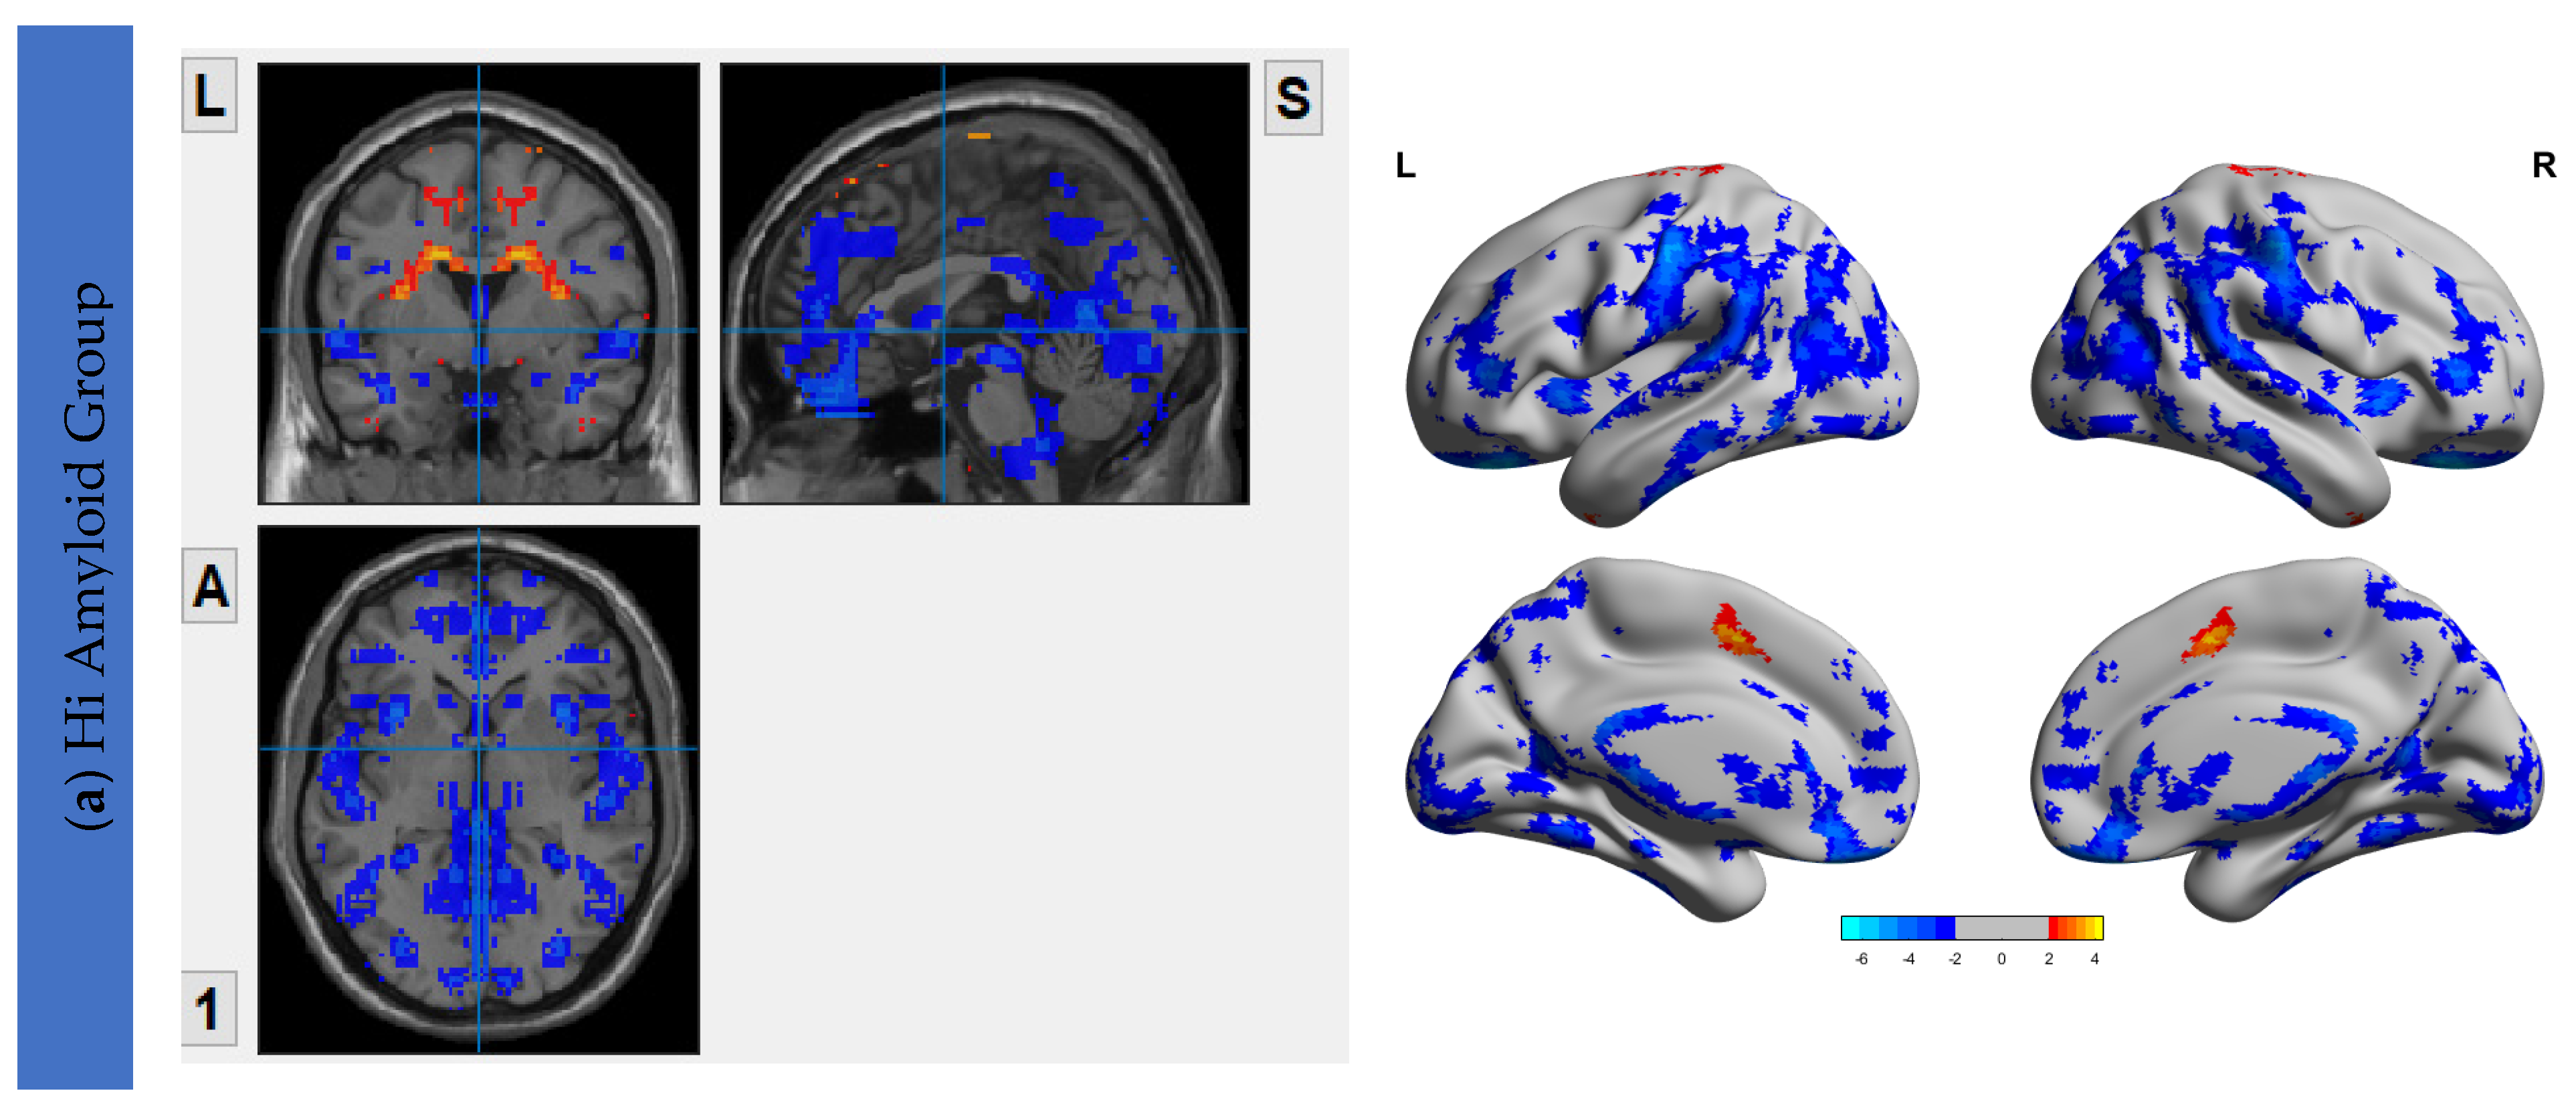
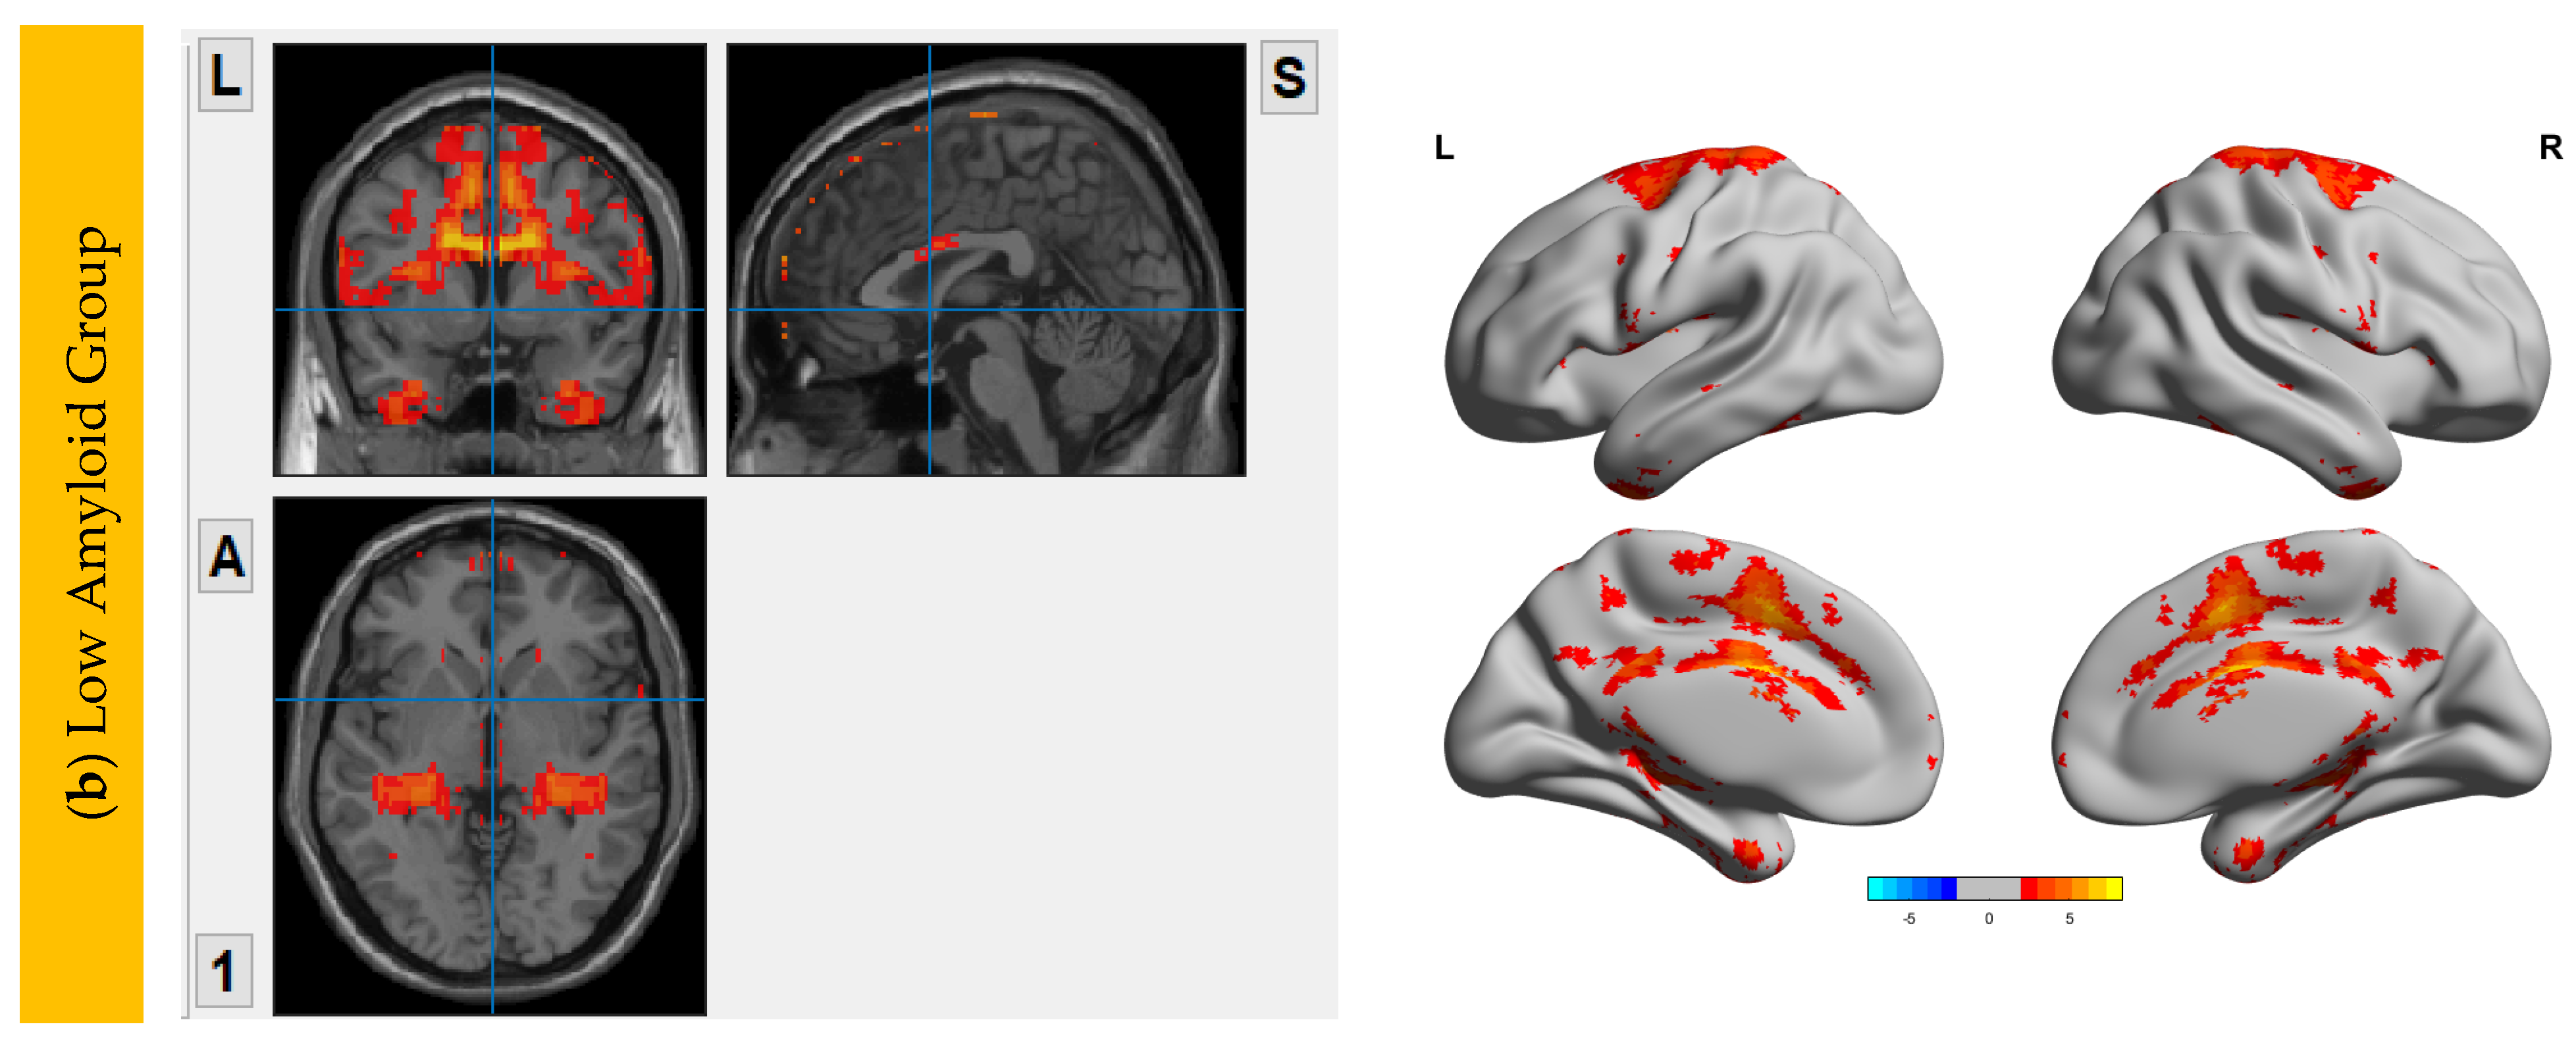
6.3. Interhemispheric Functional Connectivity (VMHC) Maps
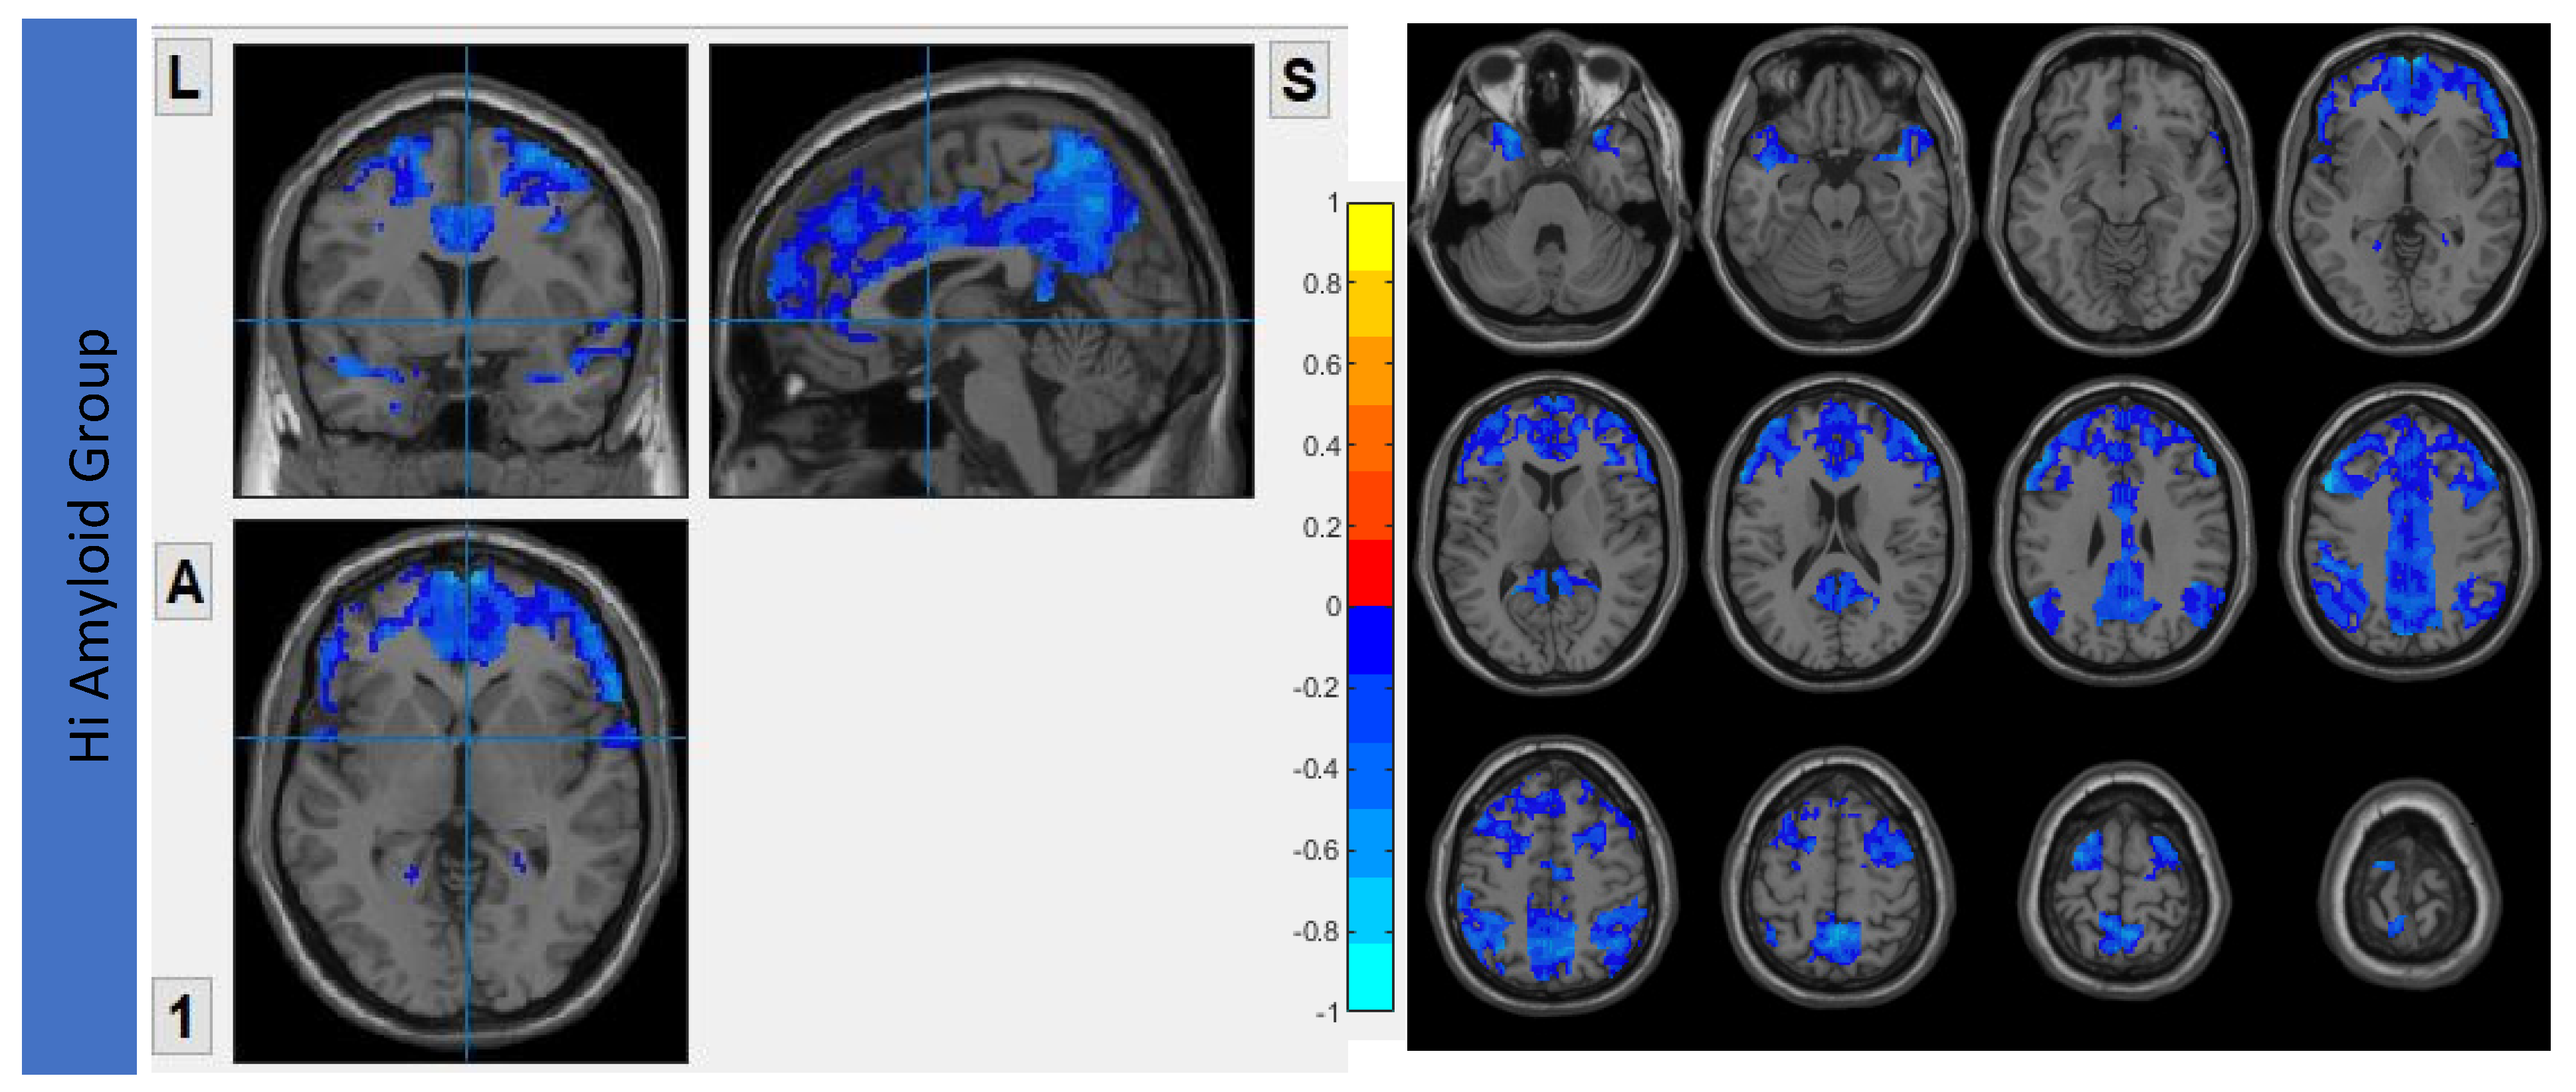
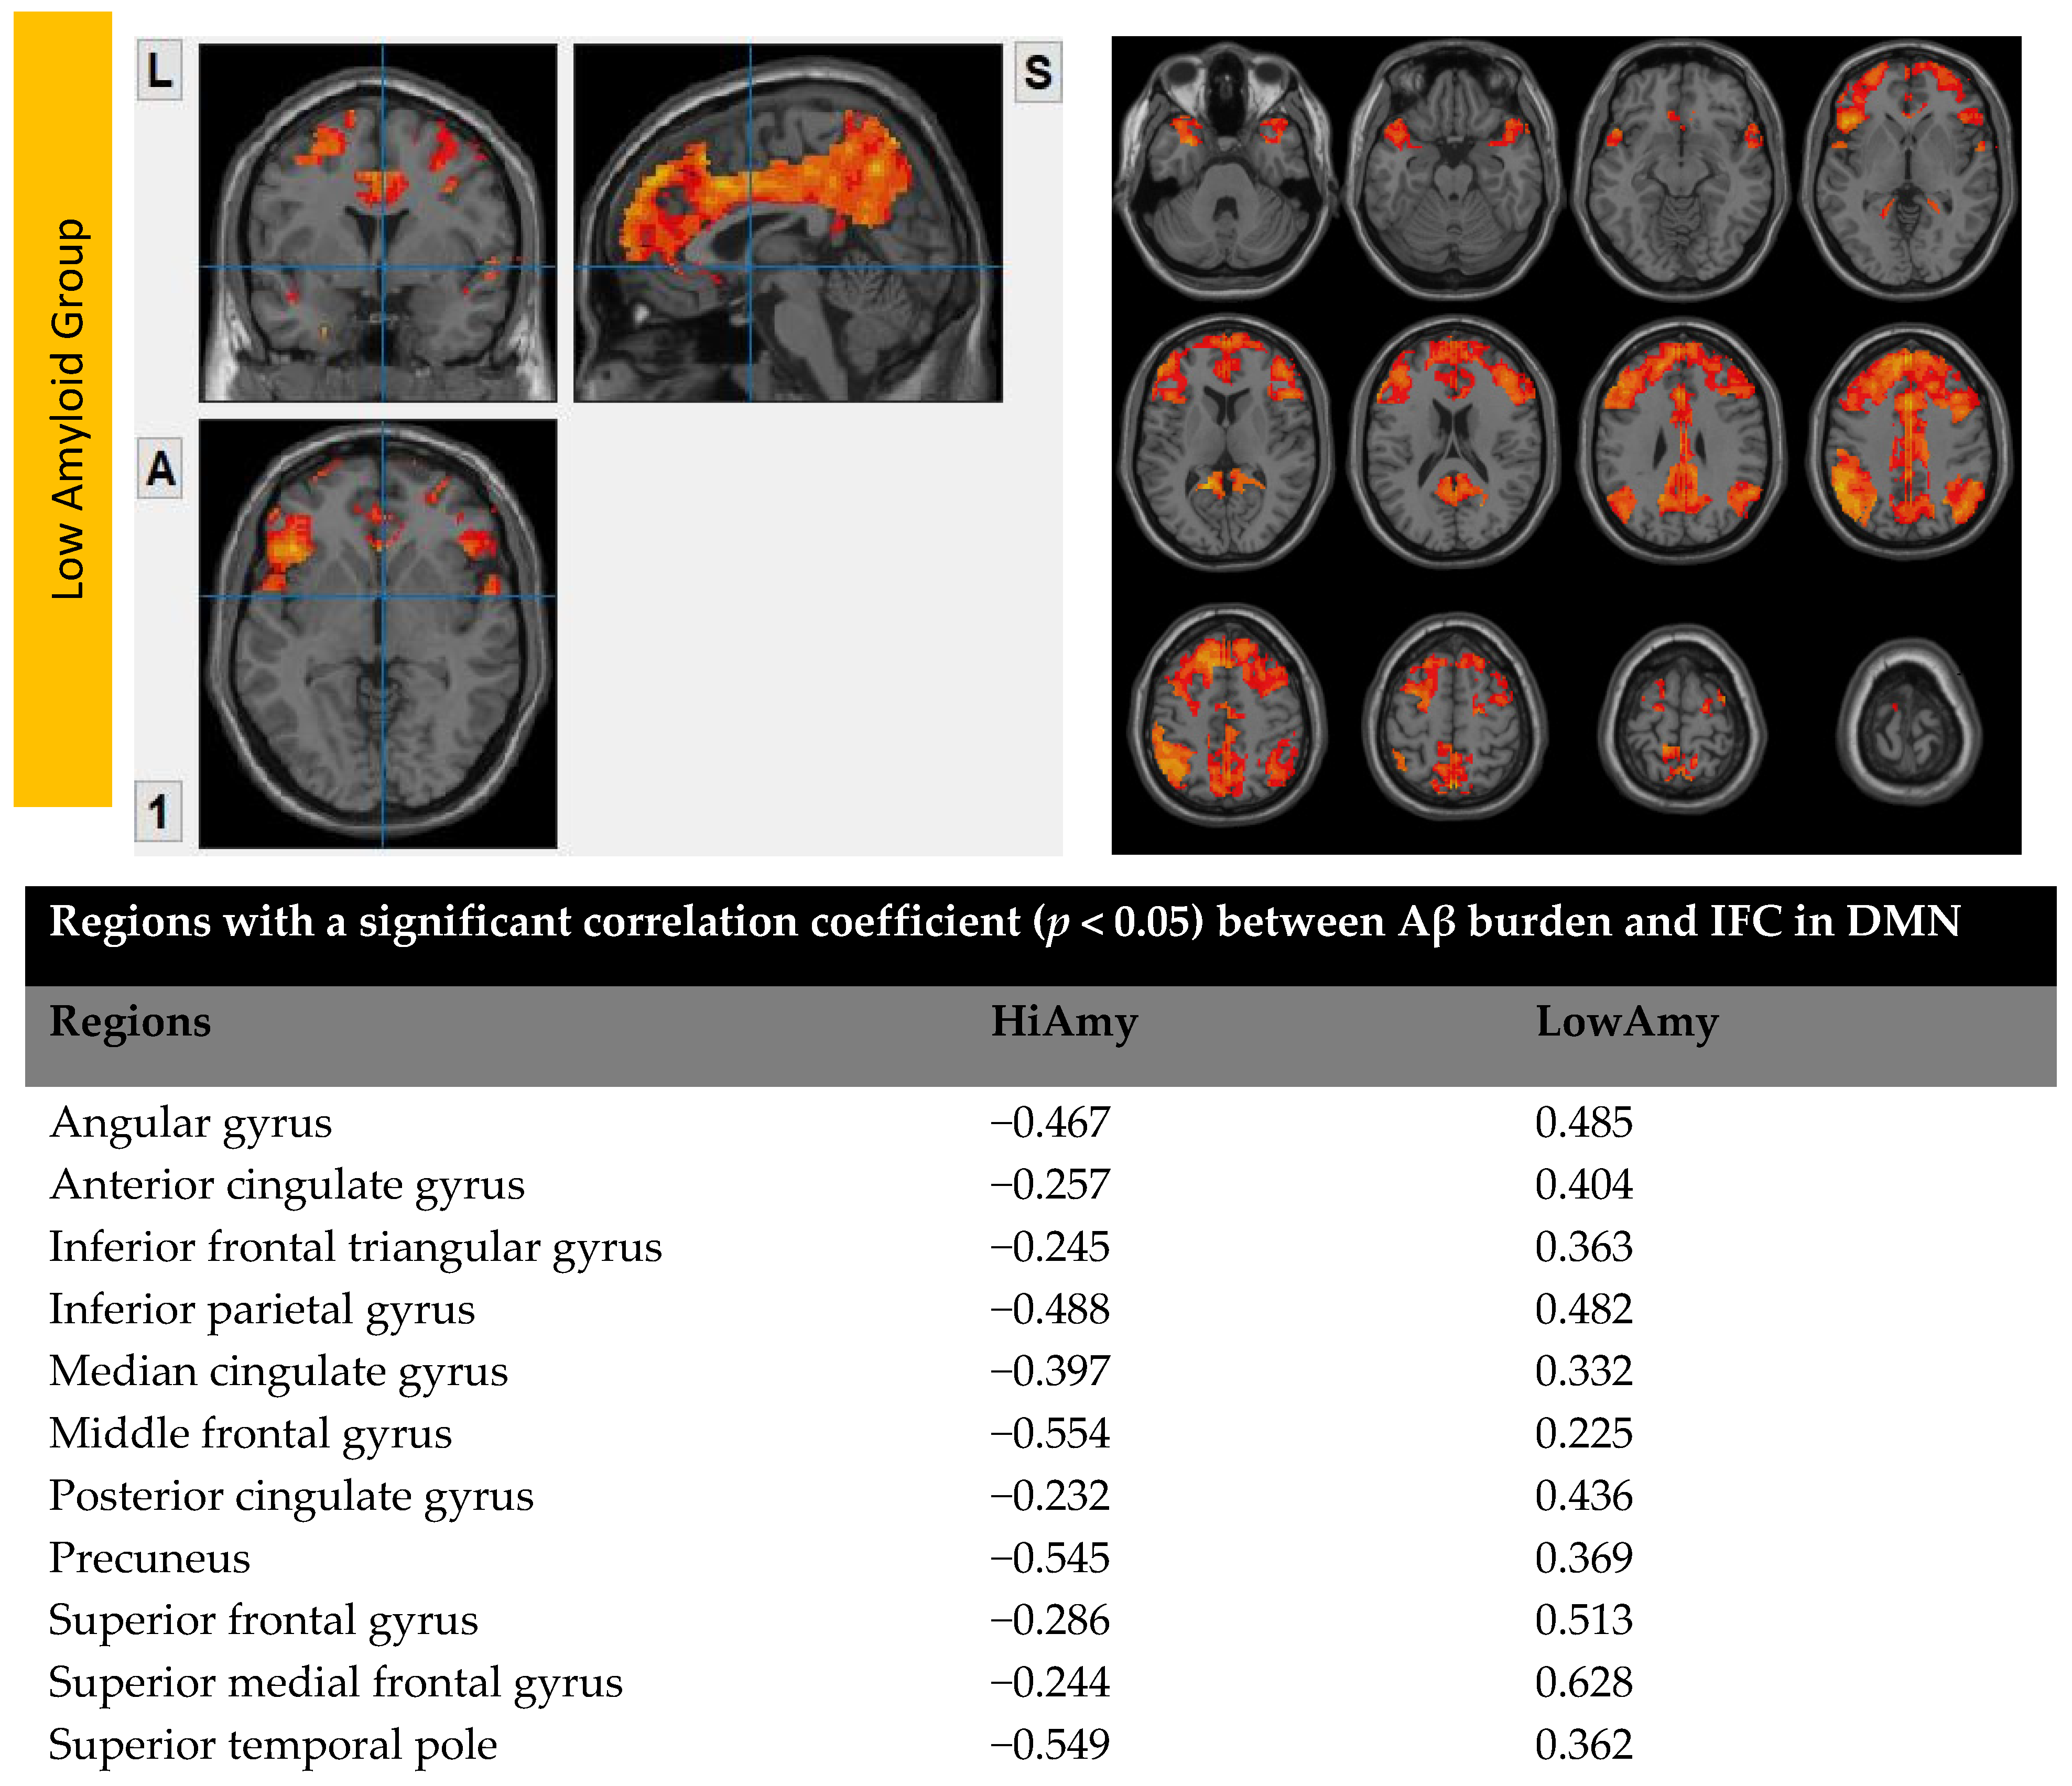
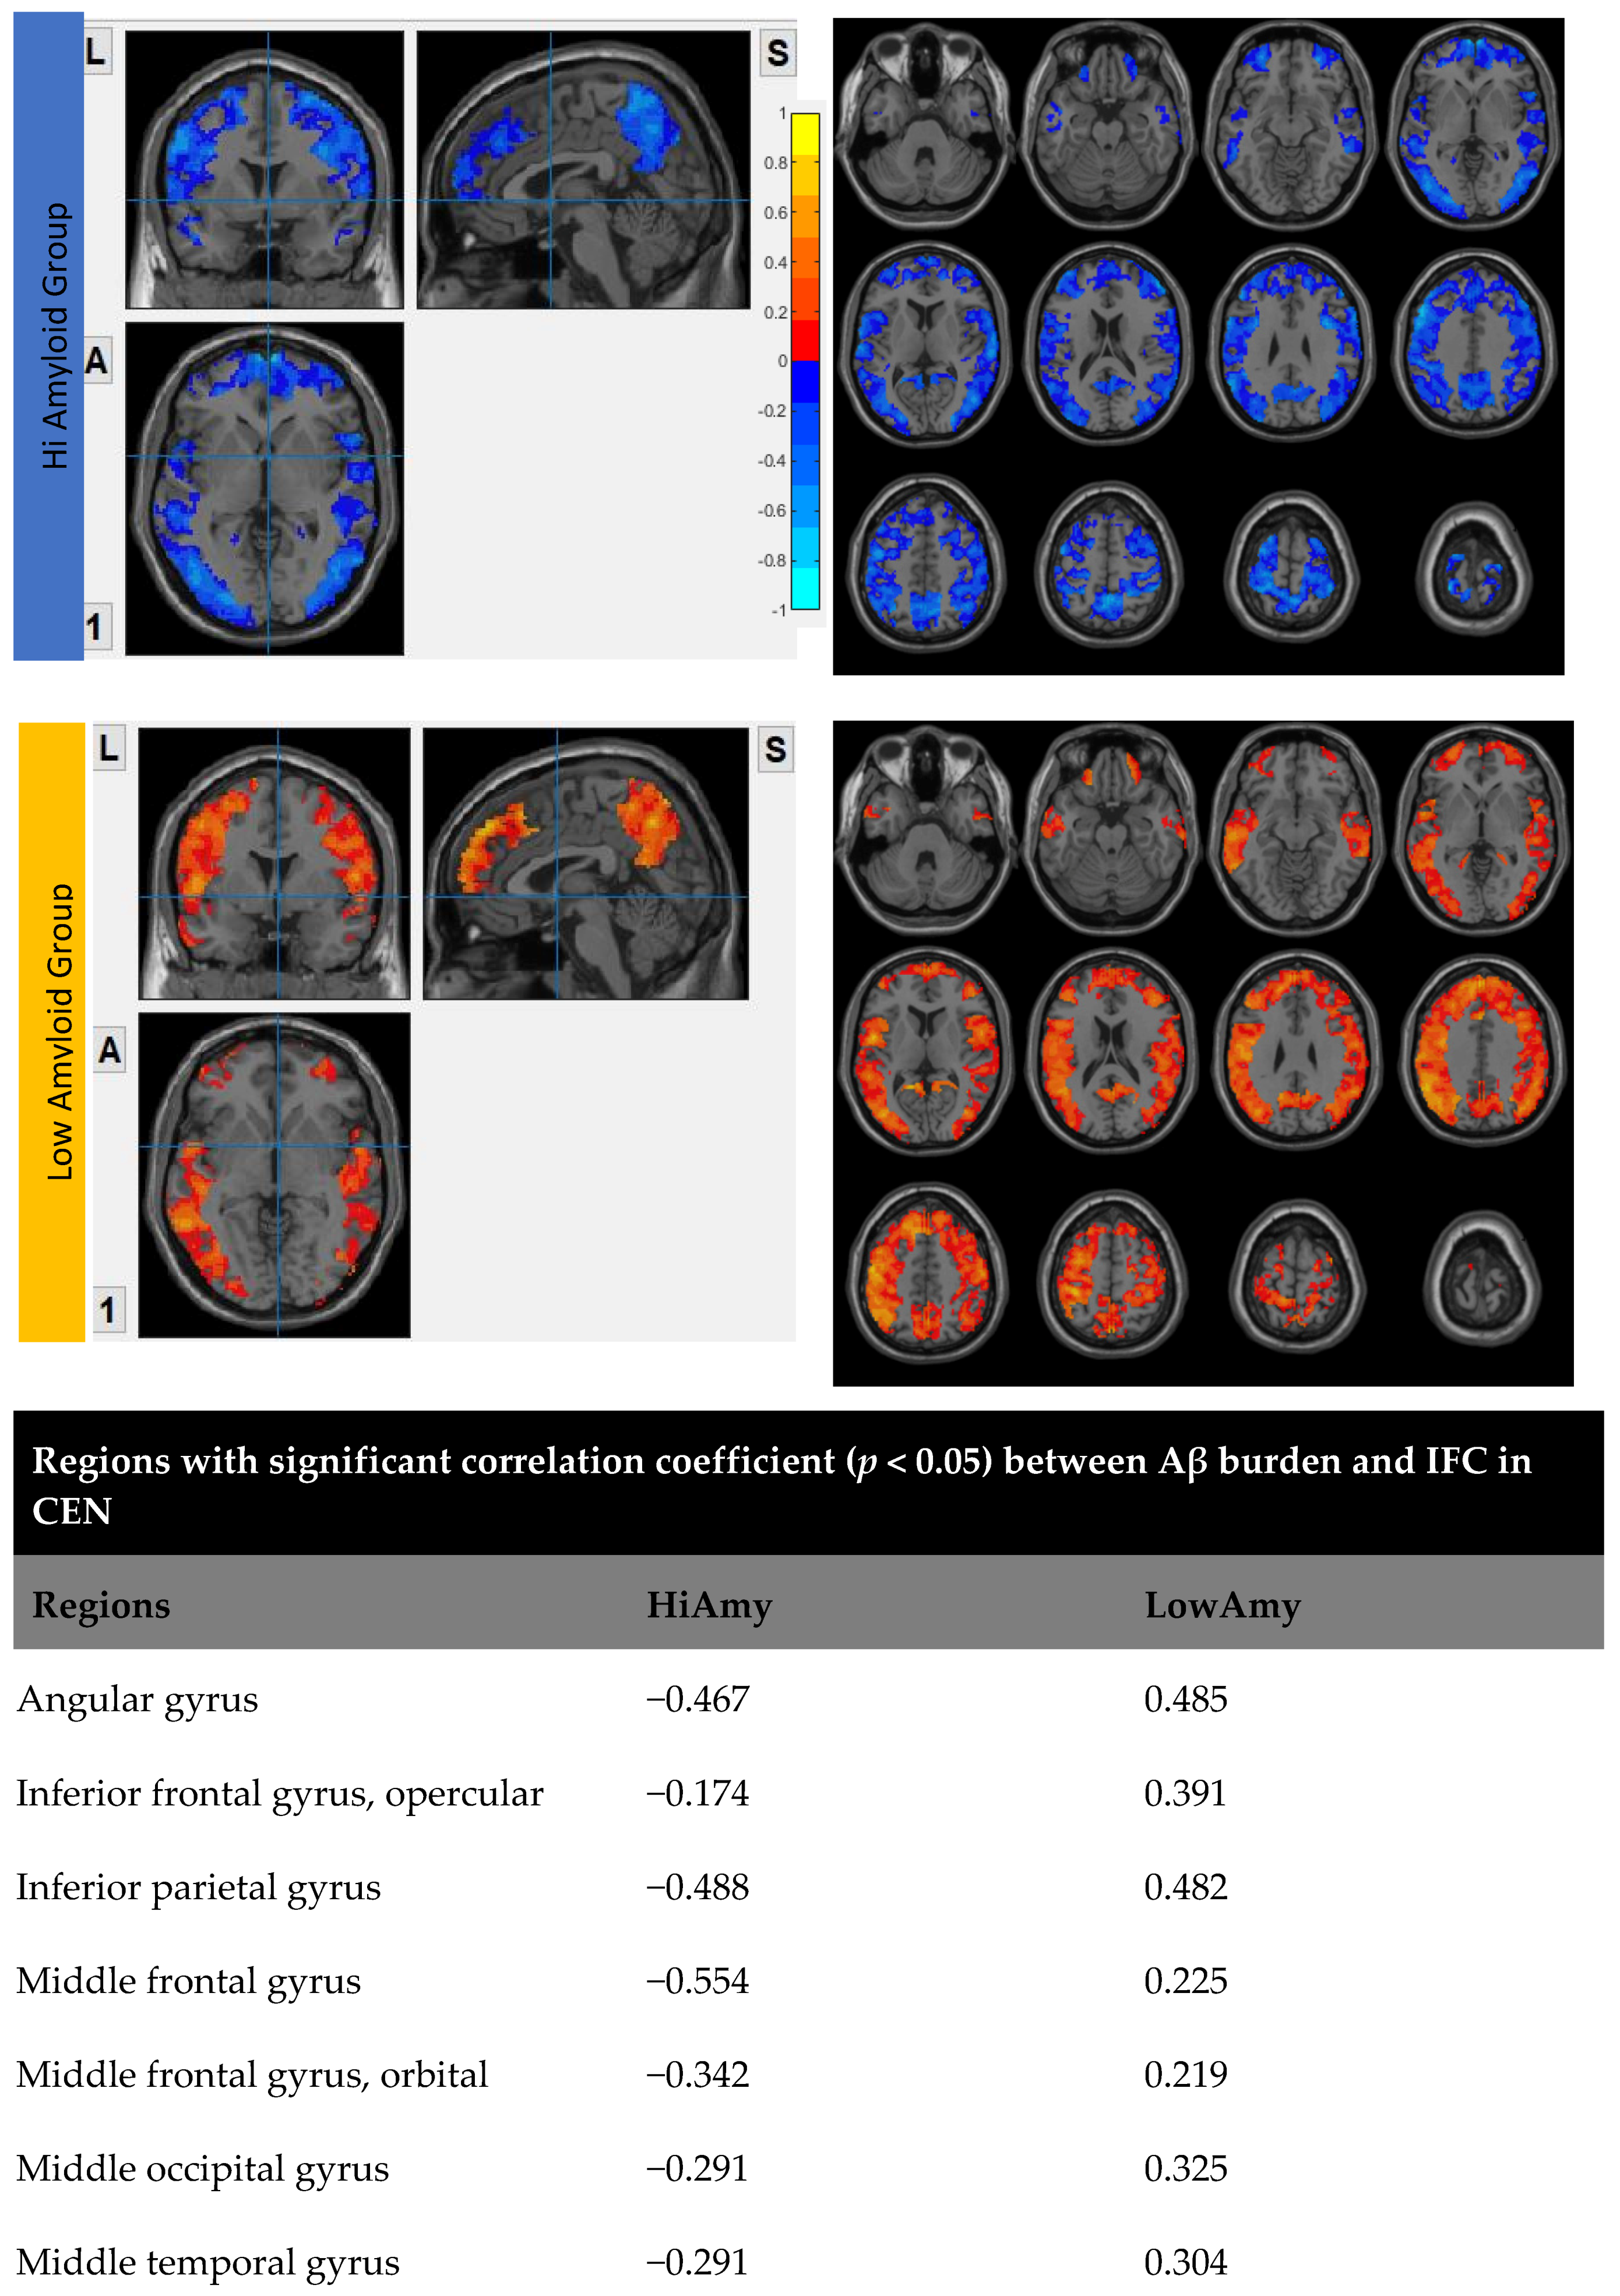
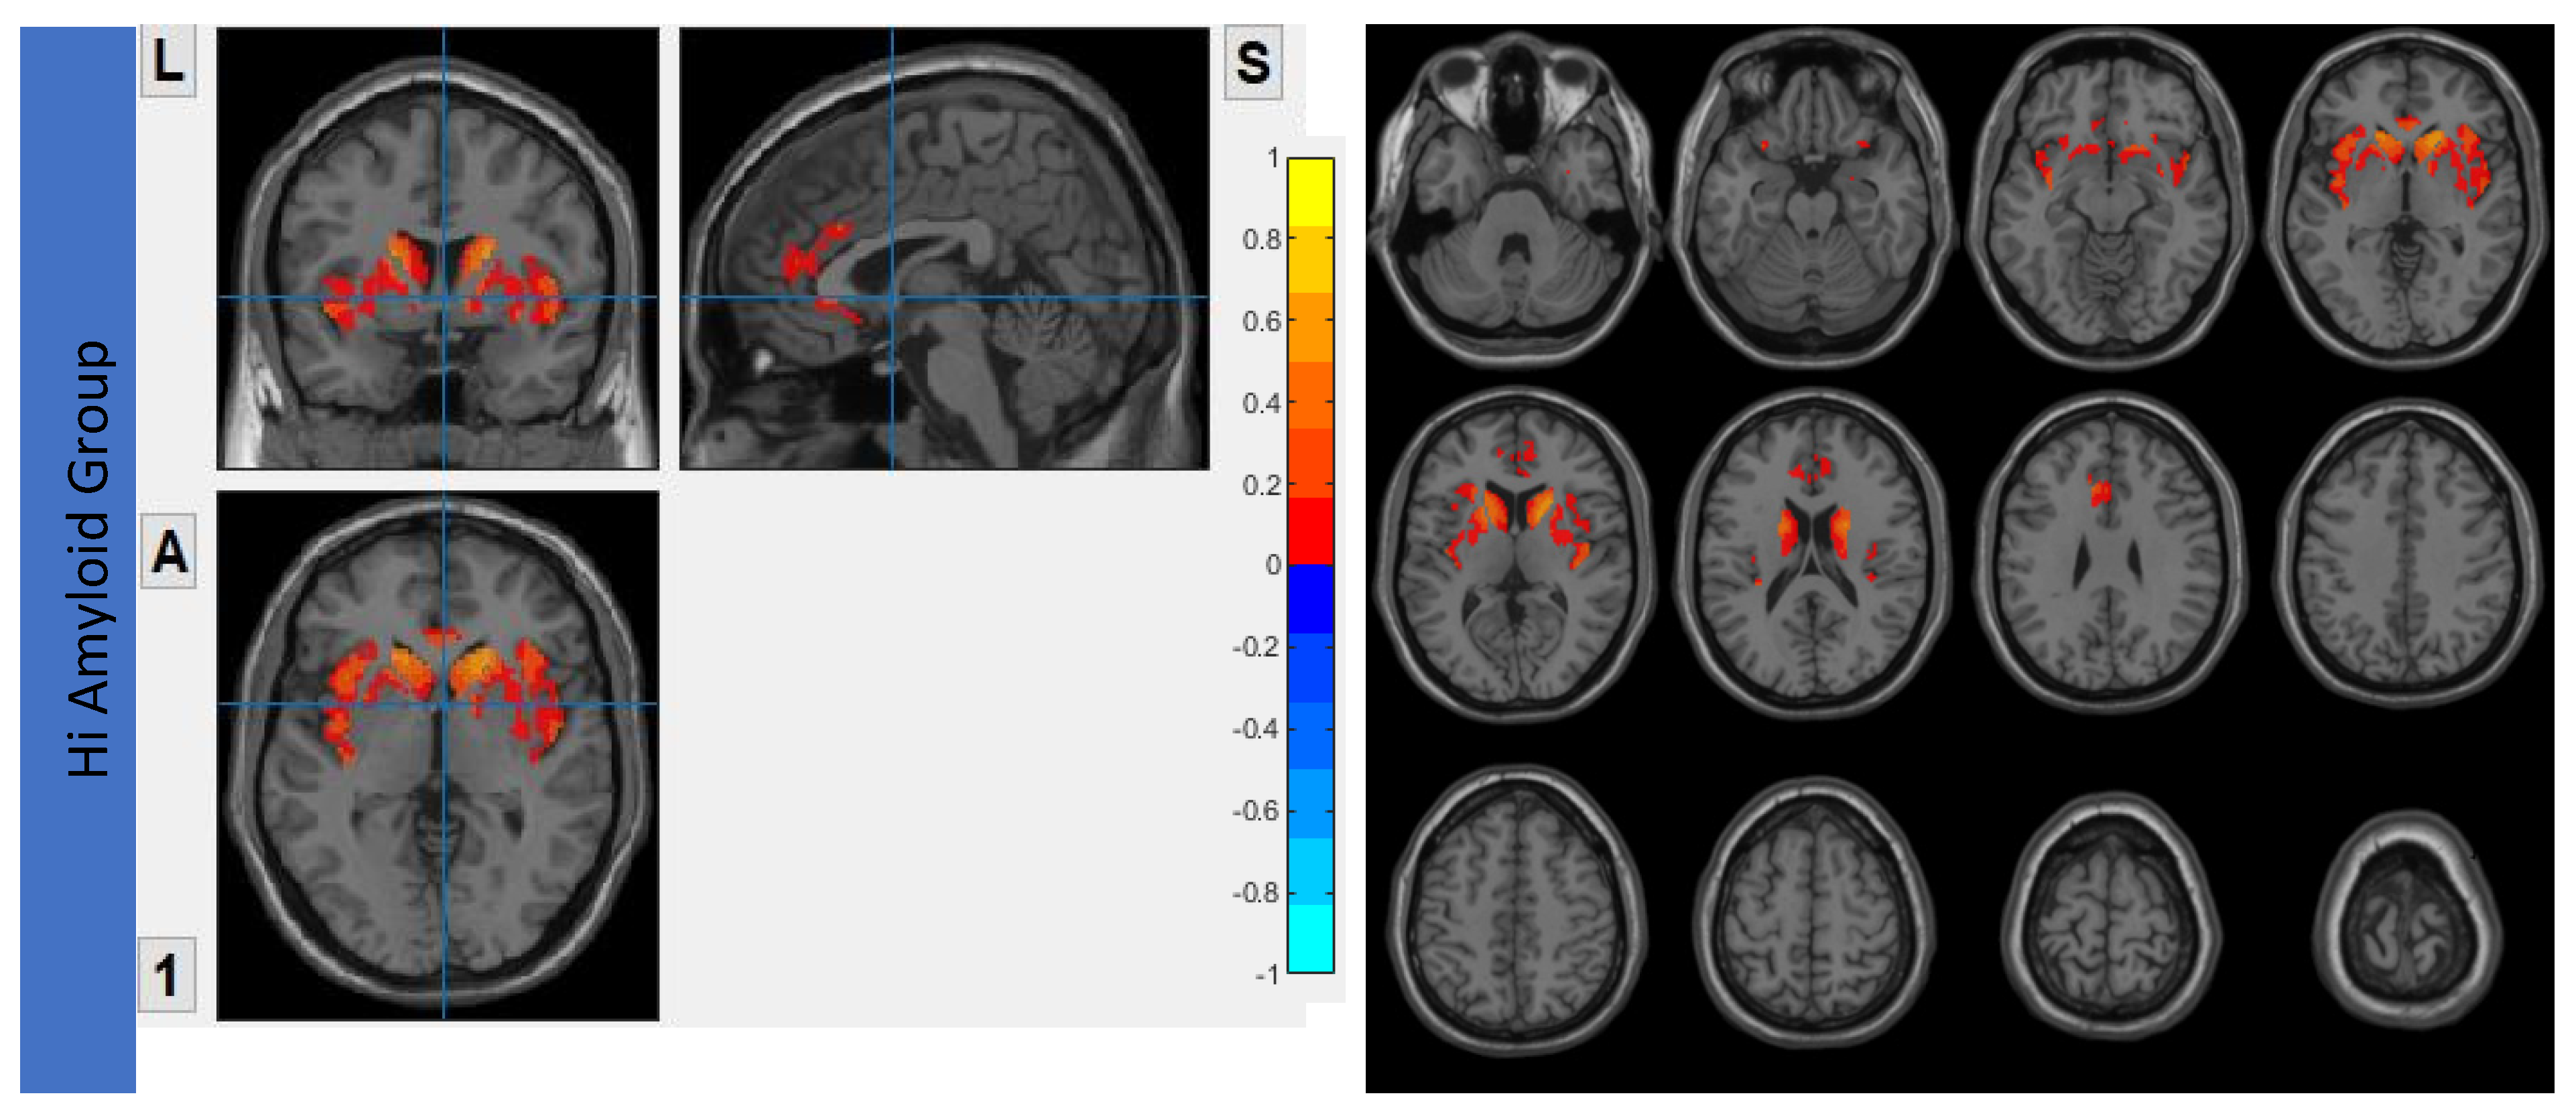
7. Correlation Analysis between Aβ Accumulation and IFC
7.1. Within DMN
7.2. Within CEN
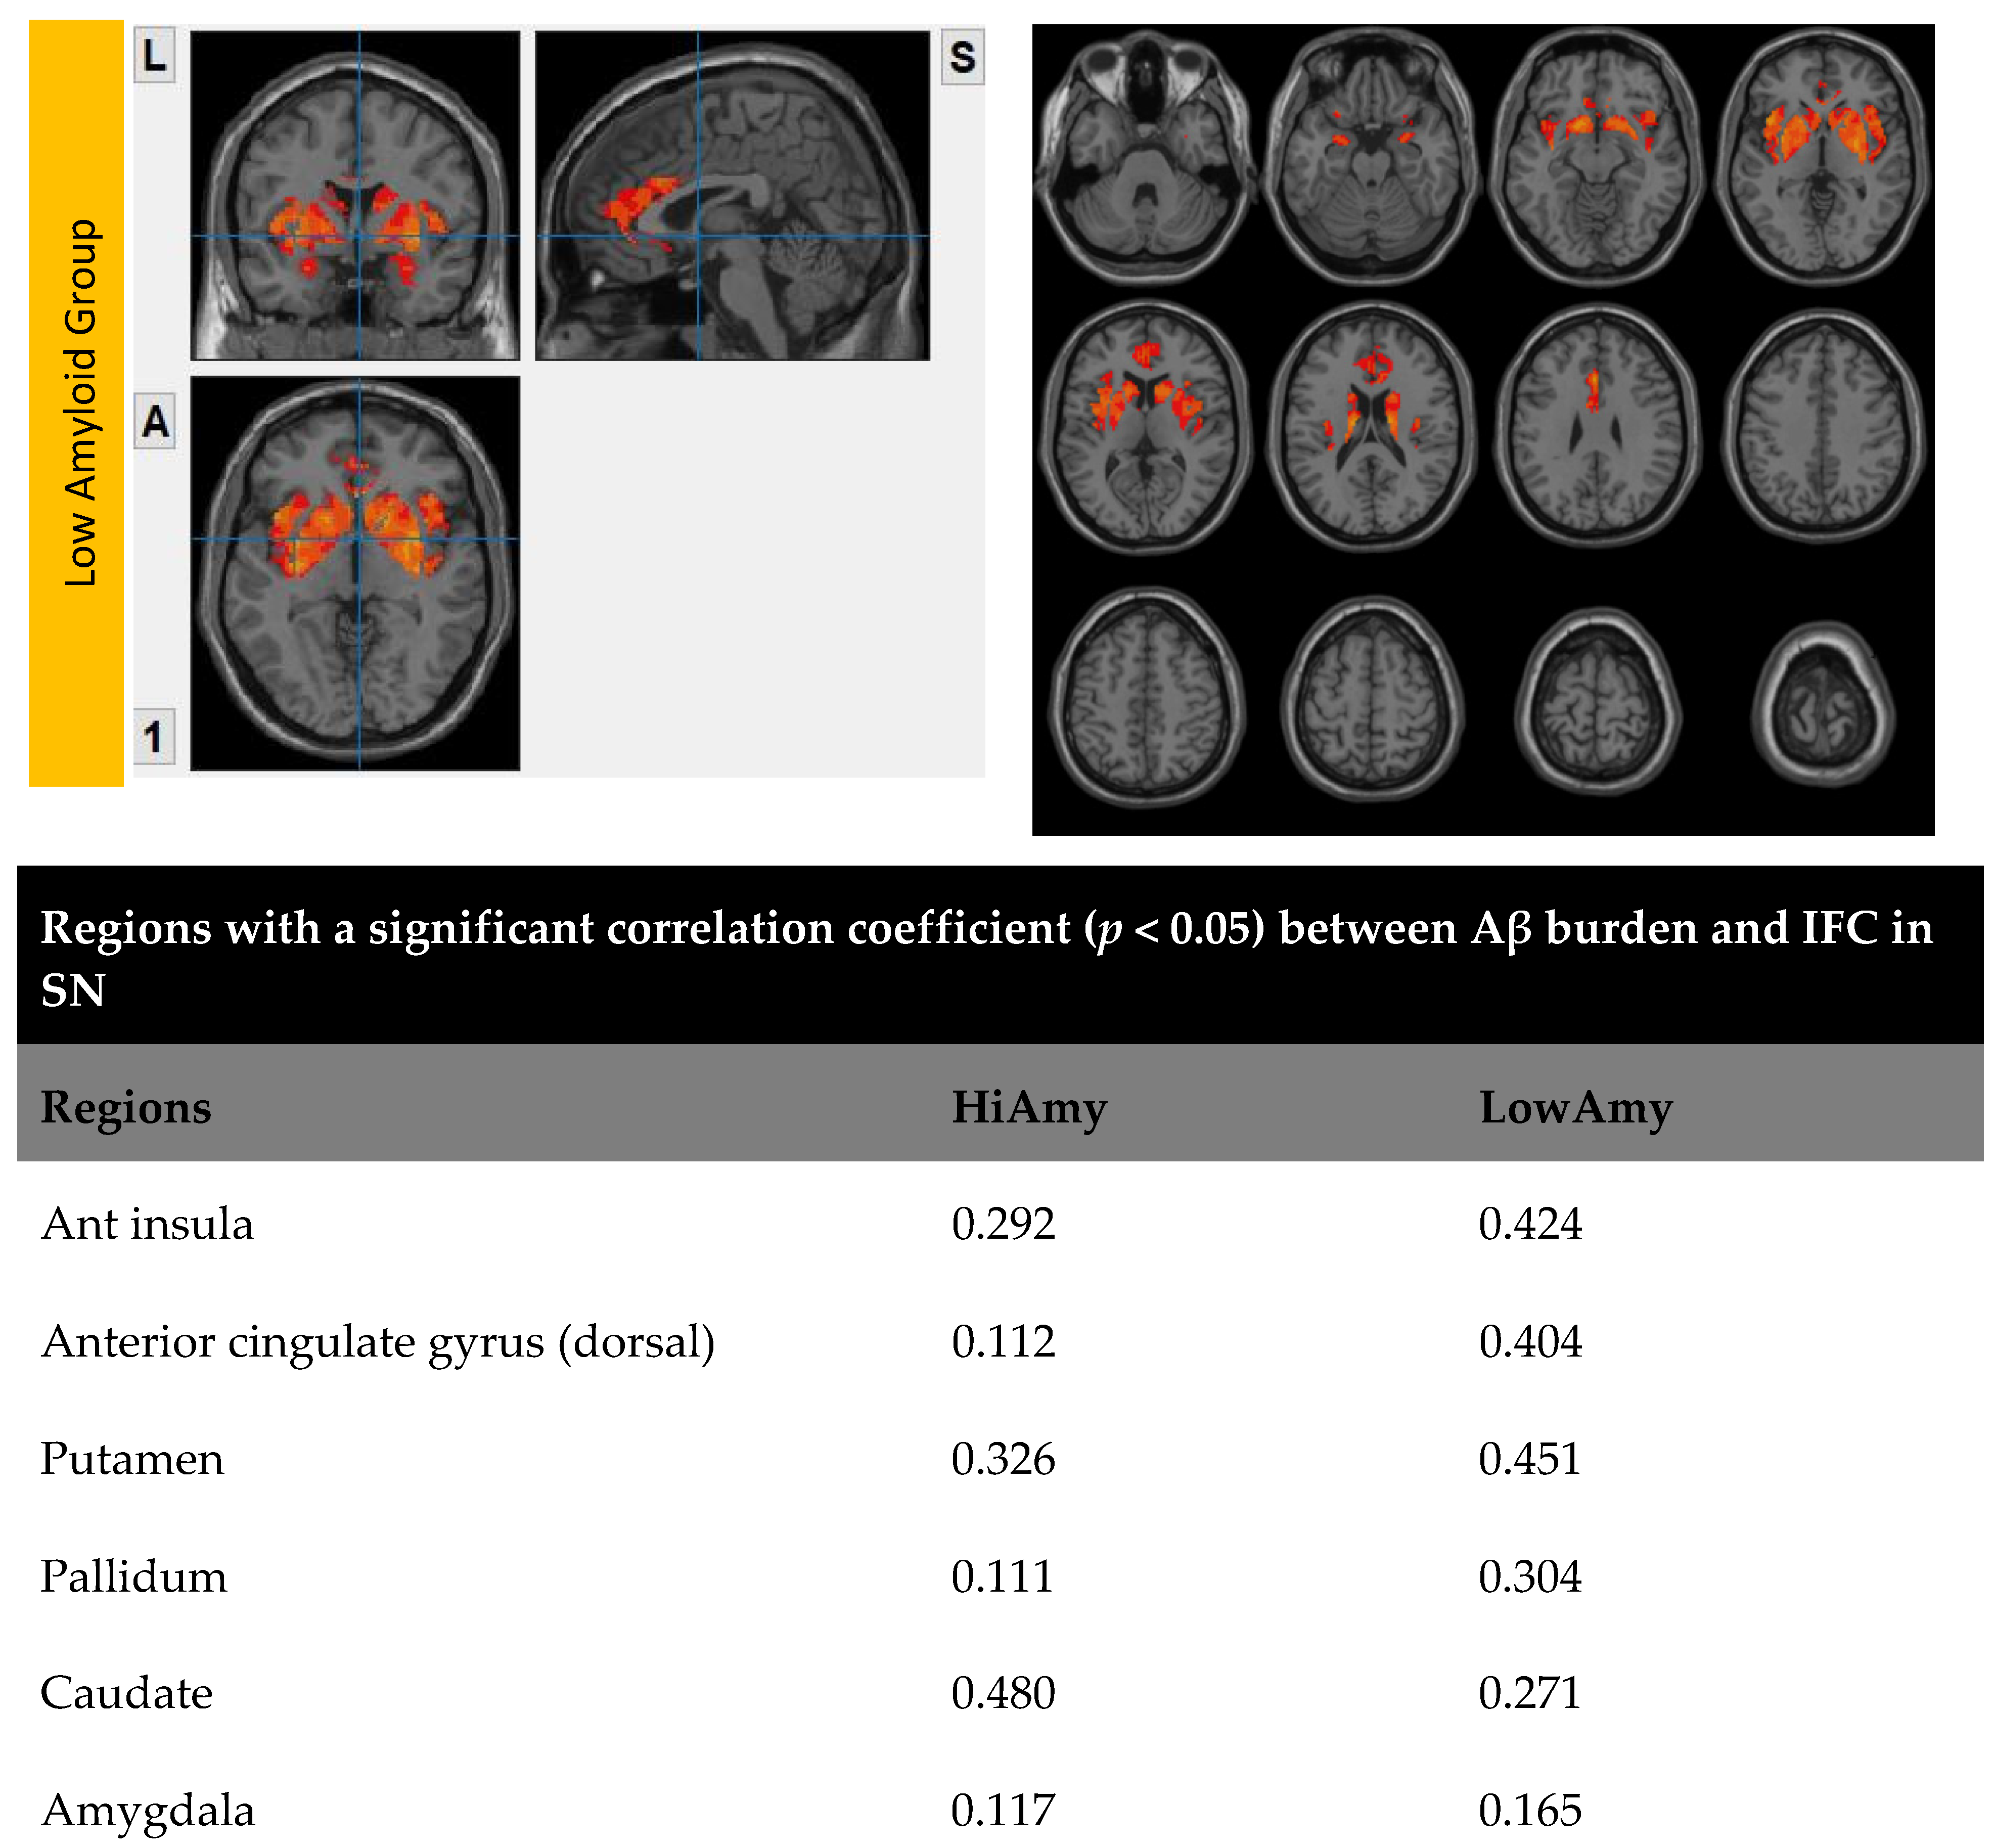
7.3. Within SN
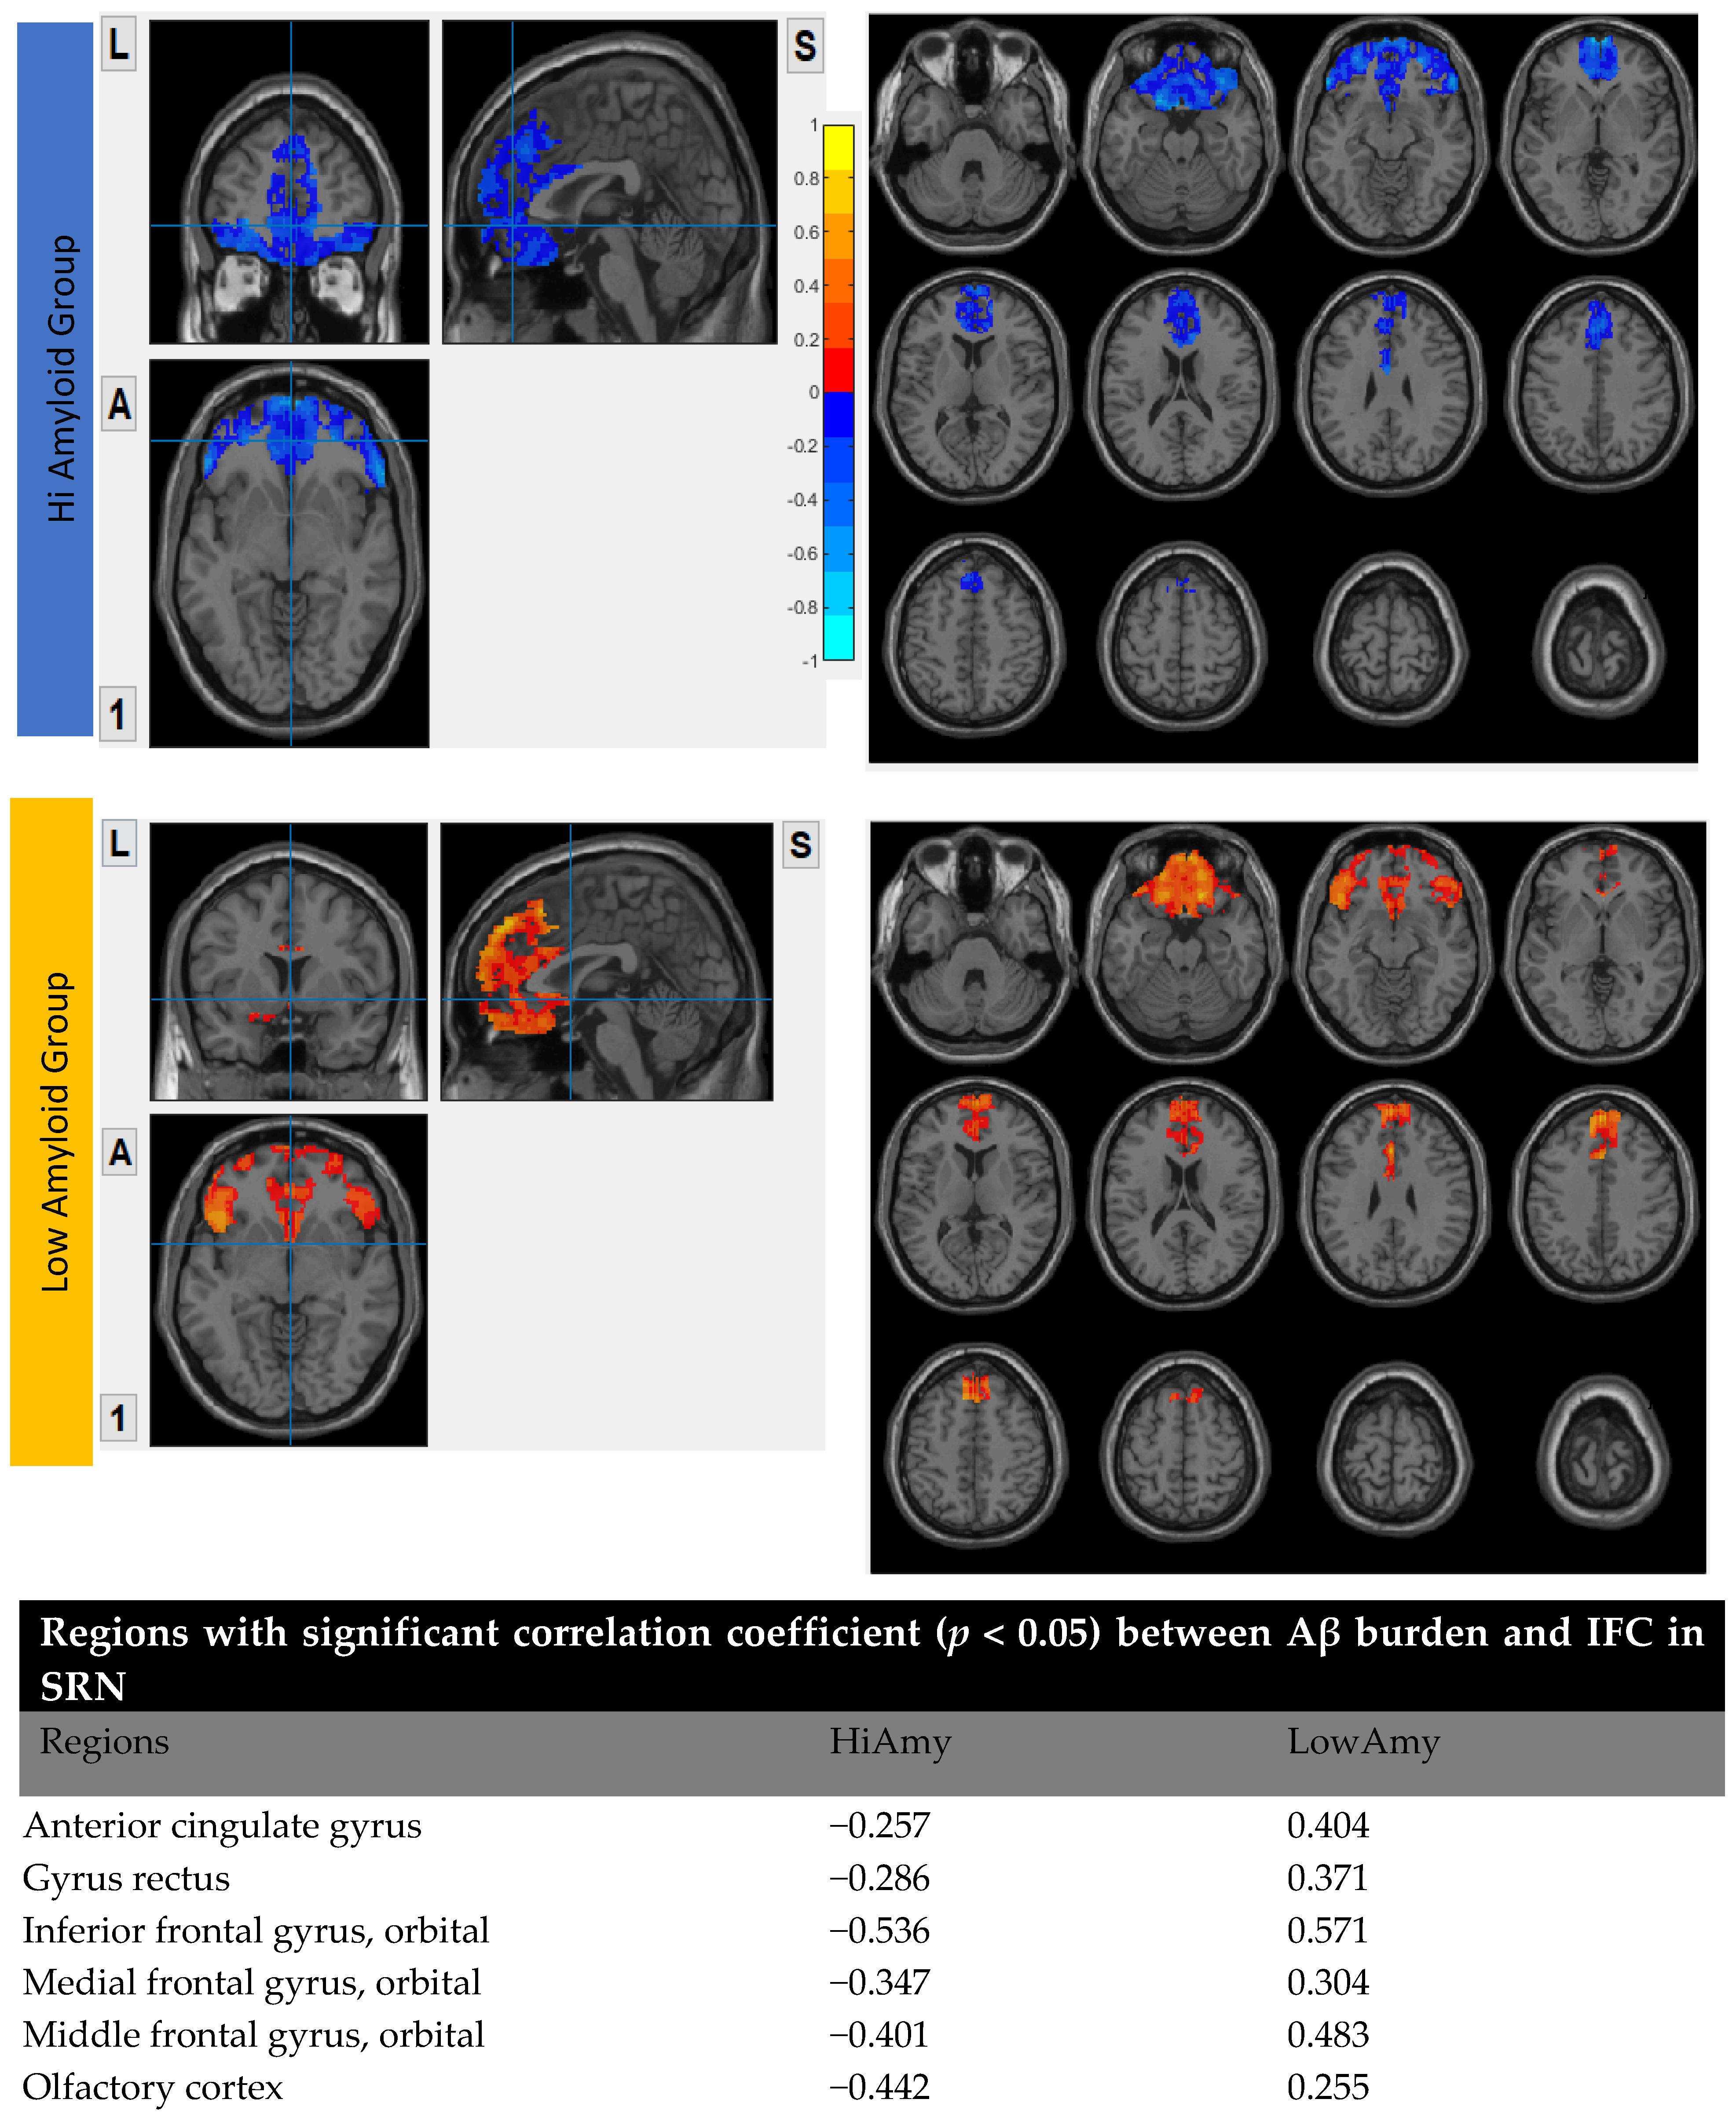
7.4. Within SRN
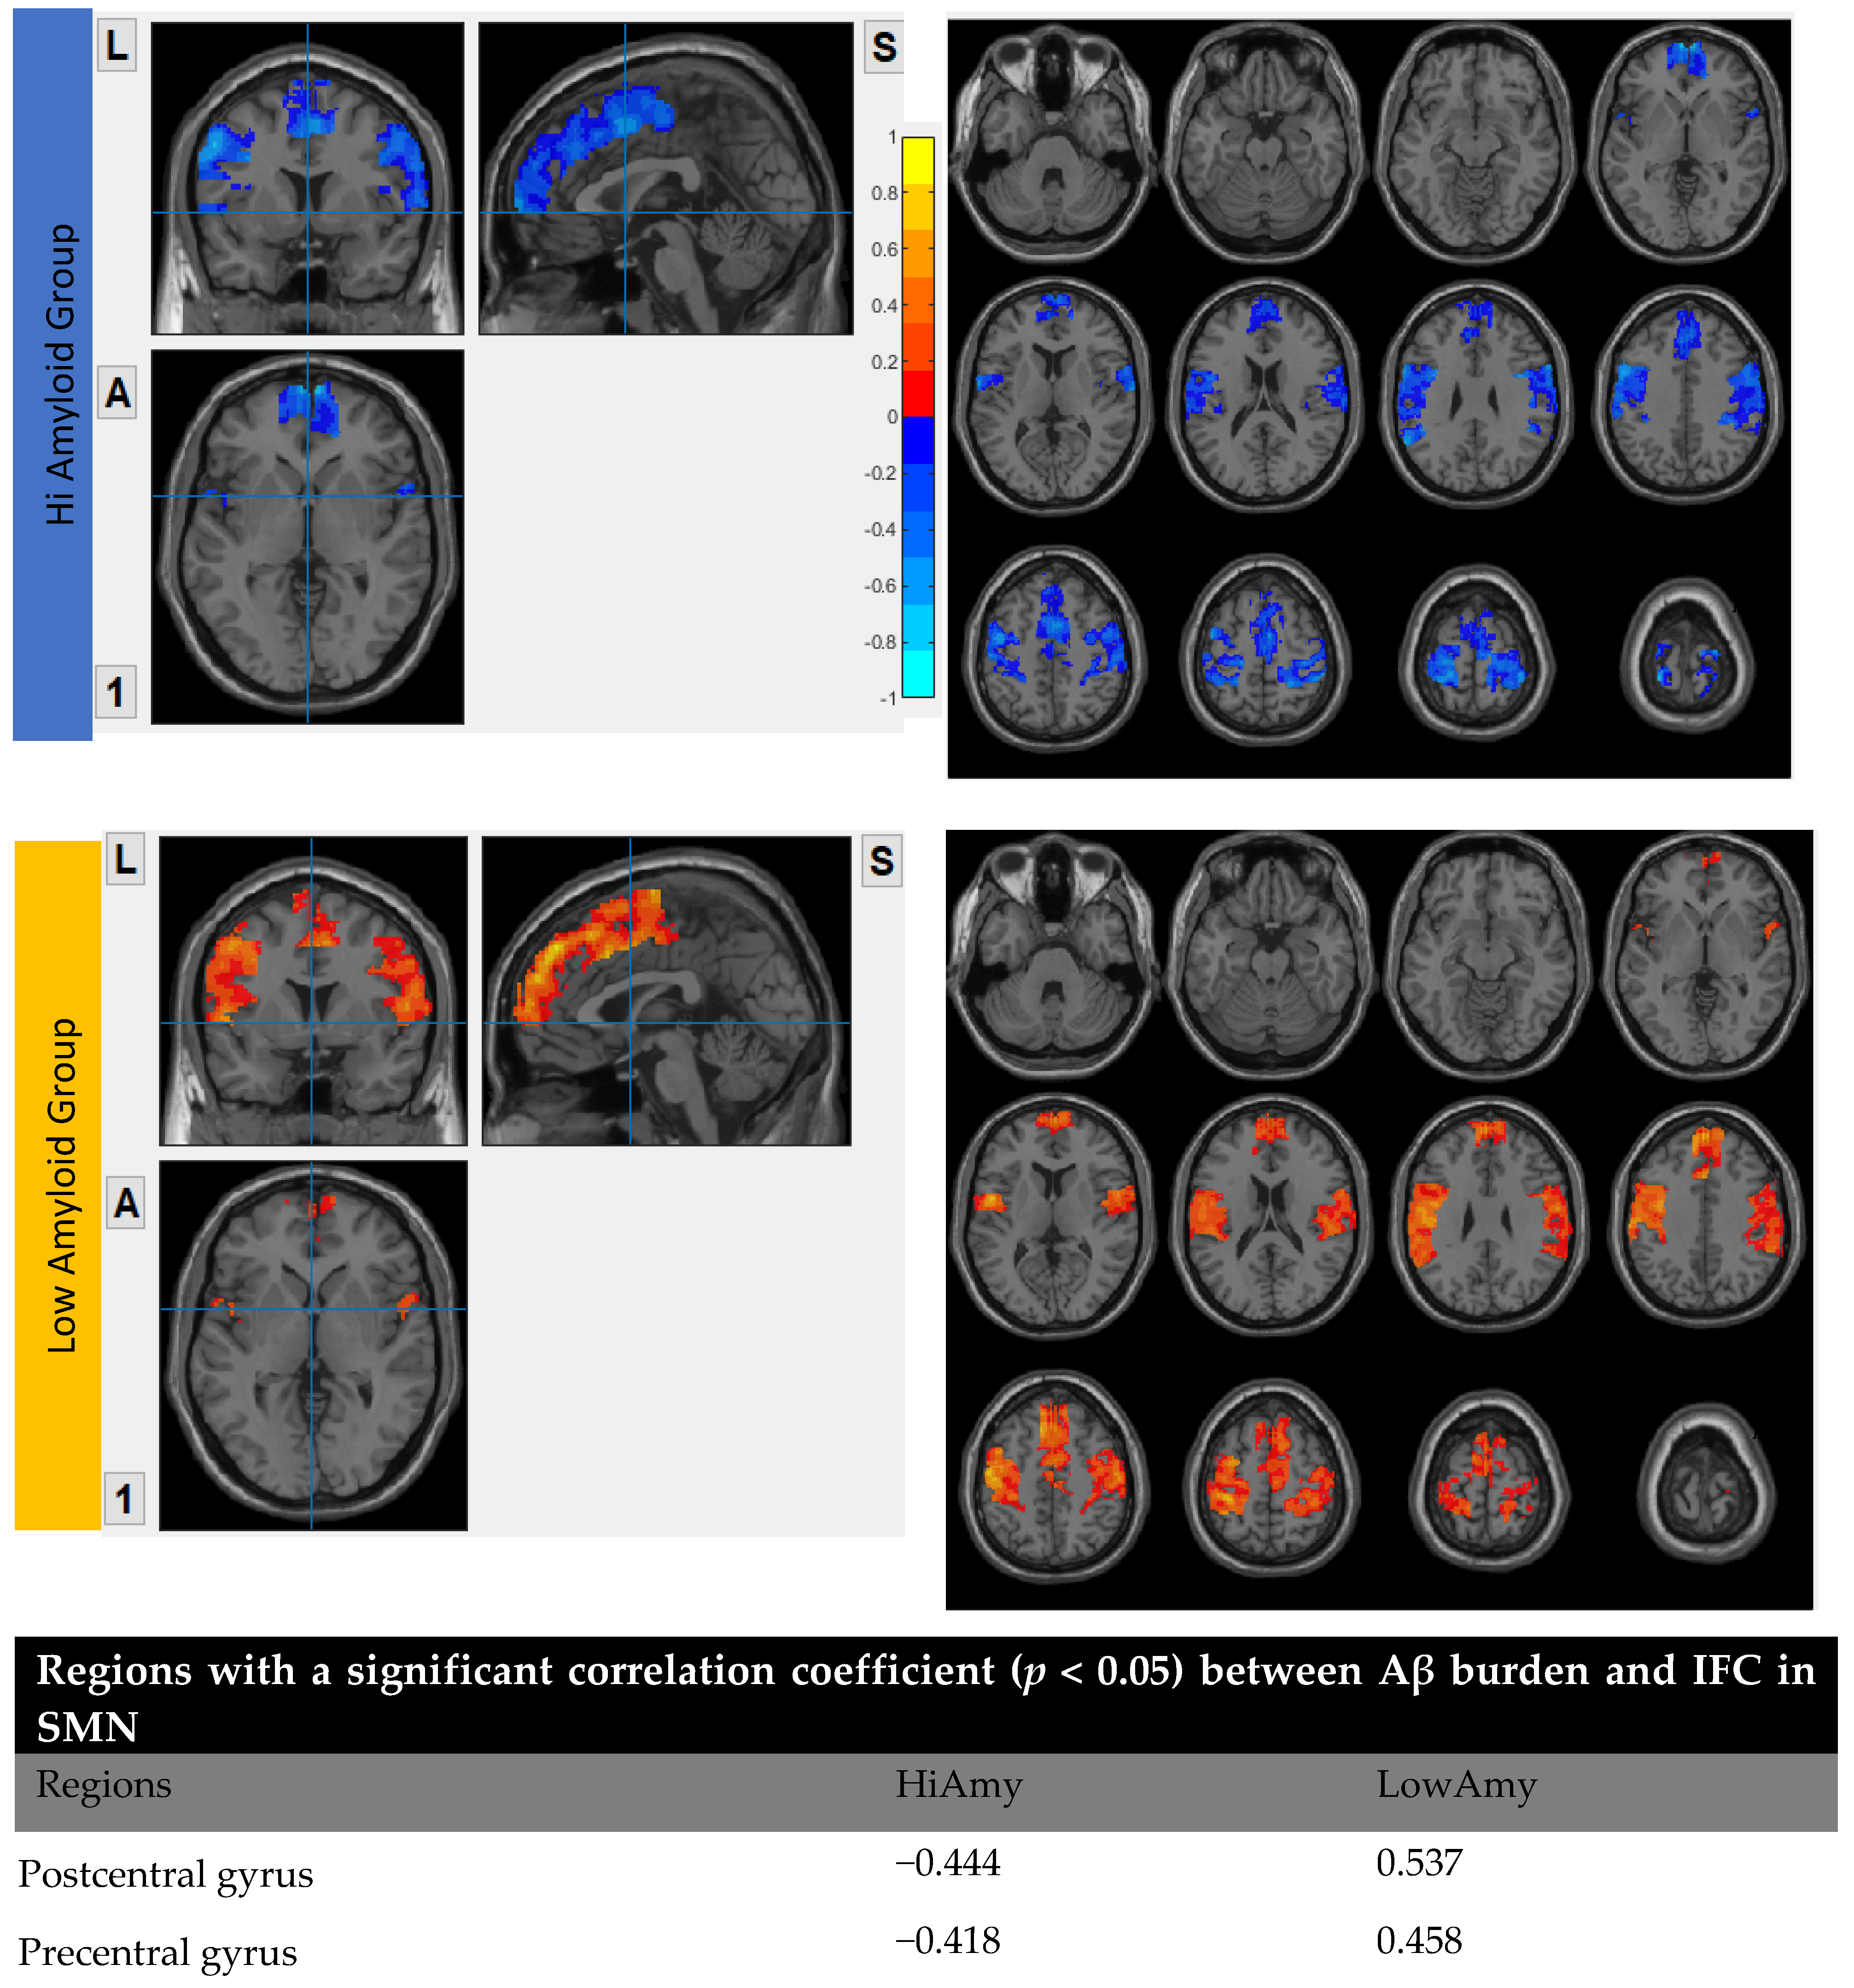
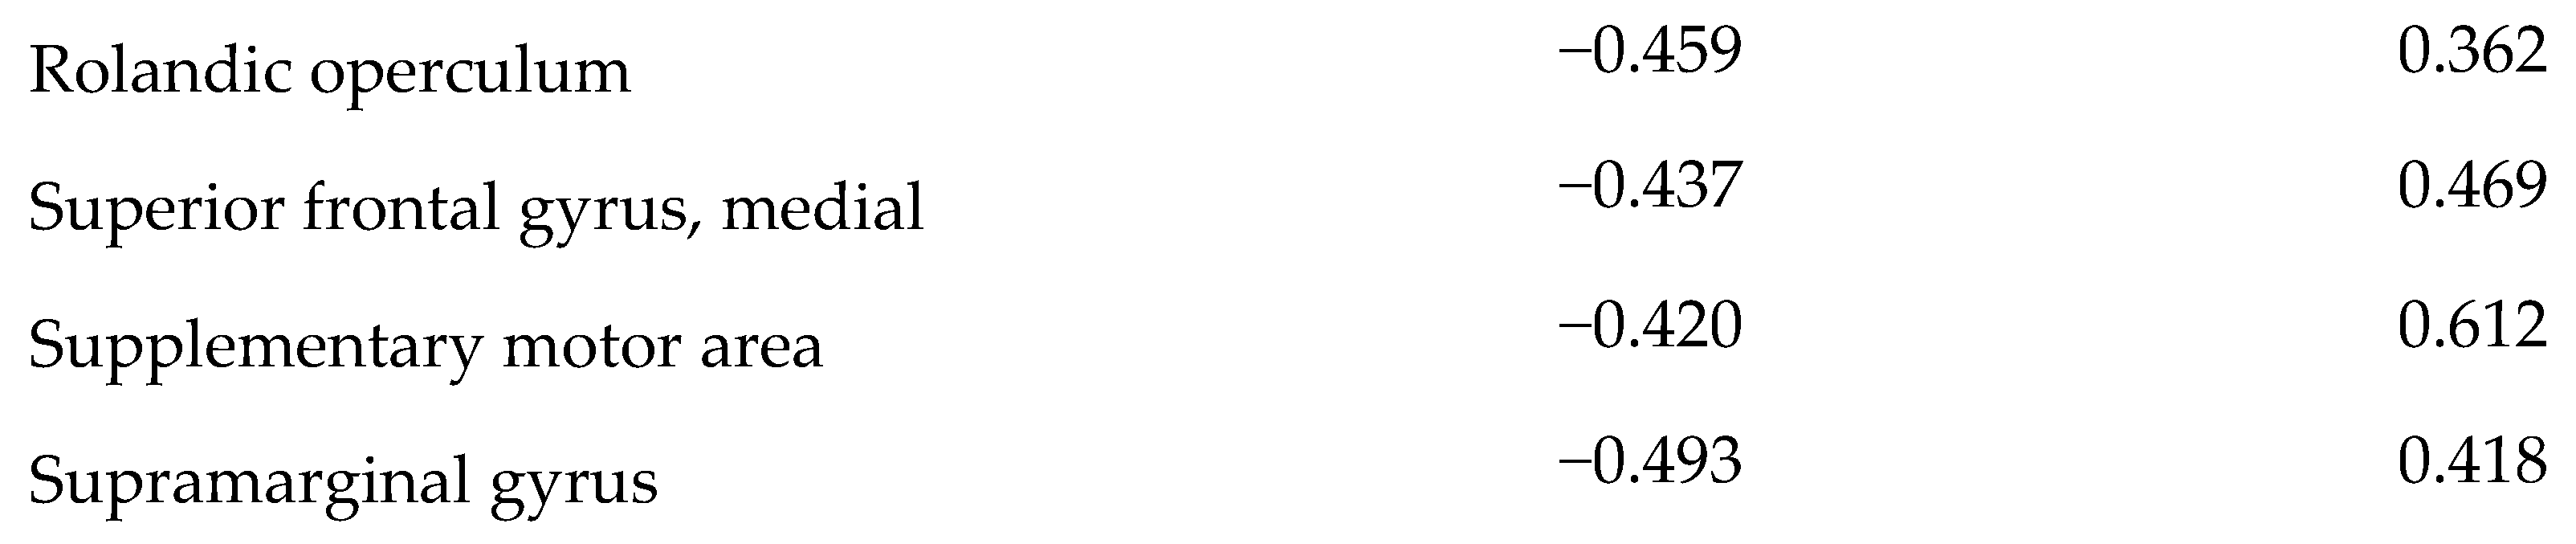
7.5. Within SMN
8. Discussion
9. Limitation of Study
10. Conclusions
Author Contributions
Funding
Institutional Review Board Statement
Informed Consent Statement
Data Availability Statement
Acknowledgments
Conflicts of Interest
References
- Klunk, W.E. Binding of the Positron Emission Tomography Tracer Pittsburgh Compound-B Reflects the Amount of Amyloid- in Alzheimer’s Disease Brain But Not in Transgenic Mouse Brain. J. Neurosci. 2005, 25, 10598–10606. [Google Scholar] [CrossRef] [PubMed]
- Thal, D.R.; Ronisz, A.; Tousseyn, T.; Upadhaya, A.R.; Balakrishnan, K.; Vandenberghe, R.; Vandenbulcke, M.; von Arnim, C.A.F.; Otto, M.; Beach, T.G.; et al. Different Aspects of Alzheimer’s Disease-Related Amyloid β-Peptide Pathology and Their Relationship to Amyloid Positron Emission Tomography Imaging and Dementia. Acta Neuropathol. Commun. 2019, 7, 178. [Google Scholar] [CrossRef] [PubMed]
- Thal, D.R.; Rüb, U.; Orantes, M.; Braak, H. Phases of Aβ-Deposition in the Human Brain and Its Relevance for the Development of AD. Neurology 2002, 58, 1791–1800. [Google Scholar] [CrossRef] [PubMed]
- Duffy, F.H.; Mcanulty, G.B.; Albert, M.S. Effects of Age upon Interhemispheric EEG Coherence in Normal Adults. Neurobiol. Aging 1996, 17, 587–599. [Google Scholar] [CrossRef]
- Liao, Z.; Tan, Y.; Qiu, Y.; Zhu, J.; Chen, Y.; Lin, S.; Wu, M.; Mao, Y.; Hu, J.; Ding, Z.; et al. Interhemispheric Functional Connectivity for Alzheimer’s Disease and Amnestic Mild Cognitive Impairment Based on the Triple Network Model. J. Zhejiang Univ. Sci. B 2018, 19, 924–934. [Google Scholar] [CrossRef] [PubMed]
- Yu, E.; Liao, Z.; Tan, Y.; Qiu, Y.; Zhu, J.; Han, Z.; Wang, J.; Wang, X.; Wang, H.; Chen, Y.; et al. High-Sensitivity Neuroimaging Biomarkers for the Identification of Amnestic Mild Cognitive Impairment Based on Resting-State FMRI and a Triple Network Model. Brain Imaging Behav. 2019, 13, 1–14. [Google Scholar] [CrossRef]
- Cheung, E.Y.W.; Shea, Y.F.; Chiu, P.K.C.; Kwan, J.S.K.; Mak, H.K.F. Diagnostic Efficacy of Voxel-Mirrored Homotopic Connectivity in Vascular Dementia as Compared to Alzheimer’s Related Neurodegenerative Diseases—A Resting State FMRI Study. Life 2021, 11, 1108. [Google Scholar] [CrossRef]
- Palmqvist, S.; Schöll, M.; Strandberg, O.; Mattsson, N.; Stomrud, E.; Zetterberg, H.; Blennow, K.; Landau, S.; Jagust, W.; Hansson, O. Earliest Accumulation of β-Amyloid Occurs within the Default-Mode Network and Concurrently Affects Brain Connectivity. Nat. Commun. 2017, 8, 1214. [Google Scholar] [CrossRef]
- Yao, W.; Chen, H.; Luo, C.; Sheng, X.; Zhao, H.; Xu, Y.; Bai, F. Hyperconnectivity of Self-Referential Network as a Predictive Biomarker of the Progression of Alzheimer’s Disease. JAD 2021, 80, 577–590. [Google Scholar] [CrossRef]
- Hahn, A.; Strandberg, T.O.; Stomrud, E.; Nilsson, M.; van Westen, D.; Palmqvist, S.; Ossenkoppele, R.; Hansson, O. Association Between Earliest Amyloid Uptake and Functional Connectivity in Cognitively Unimpaired Elderly. Cereb. Cortex 2019, 29, 2173–2182. [Google Scholar] [CrossRef] [Green Version]
- Wong, A.; Xiong, Y.Y.; Kwan, P.W.L.; Chan, A.Y.Y.; Lam, W.W.M.; Wang, K.; Chu, W.C.W.; Nyenhuis, D.L.; Nasreddine, Z.; Wong, L.K.S.; et al. The Validity, Reliability and Clinical Utility of the Hong Kong Montreal Cognitive Assessment (HK-MoCA) in Patients with Cerebral Small Vessel Disease. Dement. Geriatr. Cogn. Disord. 2009, 28, 81–87. [Google Scholar] [CrossRef] [PubMed]
- McKhann, G.M.; Knopman, D.S.; Chertkow, H.; Hyman, B.T.; Jack, C.R.; Kawas, C.H.; Klunk, W.E.; Koroshetz, W.J.; Manly, J.J.; Mayeux, R.; et al. The Diagnosis of Dementia Due to Alzheimer’s Disease: Recommendations from the National Institute on Aging-Alzheimer’s Association Workgroups on Diagnostic Guidelines for Alzheimer’s Disease. Alzheimer’s Dement. 2011, 7, 263–269. [Google Scholar] [CrossRef] [PubMed]
- Roman, G.C.; Tatemichi, T.K.; Erkinjuntti, T.; Cummings, J.L.; Masdeu, J.C.; Garcia, J.H.; Amaducci, L.; Orgogozo, J.-M.; Brun, A.; Hofman, A.; et al. Vascular Dementia: Diagnostic Criteria for Research Studies: Report of the NINDS-AIREN International Workshop. Neurology 1993, 43, 250. [Google Scholar] [CrossRef] [PubMed]
- Yan, C.-G.; Zang, Y.-F. DPARSF: A MATLAB Toolbox for “Pipeline” Data Analysis of Resting-State FMRI. Front. Syst. Neurosci. 2010, 4, 13. [Google Scholar] [CrossRef] [PubMed]
- Zuo, X.-N.; Kelly, C.; Di Martino, A.; Mennes, M.; Margulies, D.S.; Bangaru, S.; Grzadzinski, R.; Evans, A.C.; Zang, Y.-F.; Castellanos, F.X.; et al. Growing Together and Growing Apart: Regional and Sex Differences in the Lifespan Developmental Trajectories of Functional Homotopy. J. Neurosci. 2010, 30, 15034–15043. [Google Scholar] [CrossRef] [PubMed]
- Fischl, B. FreeSurfer. NeuroImage 2012, 62, 774–781. [Google Scholar] [CrossRef] [PubMed]
- Fischl, B.; Salat, D.H.; Busa, E.; Albert, M.; Dieterich, M.; Haselgrove, C.; van der Kouwe, A.; Killiany, R.; Kennedy, D.; Klaveness, S.; et al. Whole Brain Segmentation. Neuron 2002, 33, 341–355. [Google Scholar] [CrossRef]
- Fischl, B.; Salat, D.H.; van der Kouwe, A.J.W.; Makris, N.; Ségonne, F.; Quinn, B.T.; Dale, A.M. Sequence-Independent Segmentation of Magnetic Resonance Images. NeuroImage 2004, 23, S69–S84. [Google Scholar] [CrossRef]
- Fischl, B.; Liu, A.; Dale, A.M. Automated Manifold Surgery: Constructing Geometrically Accurate and Topologically Correct Models of the Human Cerebral Cortex. IEEE Trans. Med. Imaging 2001, 20, 70–80. [Google Scholar] [CrossRef]
- Ségonne, F.; Pacheco, J.; Fischl, B. Geometrically Accurate Topology-Correction of Cortical Surfaces Using Nonseparating Loops. IEEE Trans. Med. Imaging 2007, 26, 518–529. [Google Scholar] [CrossRef]
- Dale, A.M.; Fischl, B.; Sereno, M.I. Cortical Surface-Based Analysis. I. Segmentation and Surface Reconstruction. Neuroimage 1999, 9, 179–194. [Google Scholar] [CrossRef] [PubMed]
- Dale, A.M.; Sereno, M.I. Improved Localizadon of Cortical Activity by Combining EEG and MEG with MRI Cortical Surface Reconstruction: A Linear Approach. J. Cogn. Neurosci. 1993, 5, 162–176. [Google Scholar] [CrossRef] [PubMed]
- Fischl, B.; Dale, A.M. Measuring the Thickness of the Human Cerebral Cortex from Magnetic Resonance Images. Proc. Natl. Acad. Sci. USA 2000, 97, 11050–11055. [Google Scholar] [CrossRef] [PubMed]
- Maldjian, J.A.; Laurienti, P.J.; Kraft, R.A.; Burdette, J.H. An Automated Method for Neuroanatomic and Cytoarchitectonic Atlas-Based Interrogation of FMRI Data Sets. Neuroimage 2003, 19, 1233–1239. [Google Scholar] [CrossRef]
- Mantini, D.; Corbetta, M.; Perrucci, M.; Romani, G.; Delgratta, C. Large-Scale Brain Networks Account for Sustained and Transient Activity during Target Detection. NeuroImage 2009, 44, 265–274. [Google Scholar] [CrossRef]
- Mantini, D.; Perrucci, M.G.; Del Gratta, C.; Romani, G.L.; Corbetta, M. Electrophysiological Signatures of Resting State Networks in the Human Brain. Proc. Natl. Acad. Sci. USA 2007, 104, 13170–13175. [Google Scholar] [CrossRef]
- Liao, W.; Mantini, D.; Zhang, Z.; Pan, Z.; Ding, J.; Gong, Q.; Yang, Y.; Chen, H. Evaluating the Effective Connectivity of Resting State Networks Using Conditional Granger Causality. Biol. Cybern. 2010, 102, 57–69. [Google Scholar] [CrossRef]
- Liao, W.; Chen, H.; Feng, Y.; Mantini, D.; Gentili, C.; Pan, Z.; Ding, J.; Duan, X.; Qiu, C.; Lui, S.; et al. Selective Aberrant Functional Connectivity of Resting State Networks in Social Anxiety Disorder. NeuroImage 2010, 52, 1549–1558. [Google Scholar] [CrossRef]
- Thurfjell, L.; Lilja, J.; Lundqvist, R.; Buckley, C.; Smith, A.; Vandenberghe, R.; Sherwin, P. Automated Quantification of 18F-Flutemetamol PET Activity for Categorizing Scans as Negative or Positive for Brain Amyloid: Concordance with Visual Image Reads. J. Nucl. Med. 2014, 55, 1623–1628. [Google Scholar] [CrossRef]
- Bullmore, E.; Sporns, O. Complex Brain Networks: Graph Theoretical Analysis of Structural and Functional Systems. Nat. Rev. Neurosci. 2009, 10, 186–198. [Google Scholar] [CrossRef]
- Rubinov, M.; Sporns, O. Complex Network Measures of Brain Connectivity: Uses and Interpretations. NeuroImage 2010, 52, 1059–1069. [Google Scholar] [CrossRef] [PubMed]
- Lakmache, Y.; Lassonde, M.; Gauthier, S.; Frigon, J.-Y.; Lepore, F. Interhemispheric Disconnection Syndrome in Alzheimer’s Disease. Proc. Natl. Acad. Sci. USA 1998, 95, 9042–9046. [Google Scholar] [CrossRef] [PubMed]
- Li, K.-C.; Luo, X.; Zeng, Q.-Z.; Xu, X.-J.; Huang, P.-Y.; Shen, Z.-J.; Xu, J.-J.; Zhou, J.; Zhang, M.-M. Distinct Patterns of Interhemispheric Connectivity in Patients With Early- and Late-Onset Alzheimer’s Disease. Front. Aging Neurosci. 2018, 10, 261. [Google Scholar] [CrossRef] [PubMed]
- Wang, Z.; Wang, J.; Zhang, H.; Mchugh, R.; Sun, X.; Li, K.; Yang, Q.X. Interhemispheric Functional and Structural Disconnection in Alzheimer’s Disease: A Combined Resting-State FMRI and DTI Study. PLoS ONE 2015, 10, e0126310. [Google Scholar] [CrossRef] [PubMed]
- Murphy, M.P.; LeVine, H. Alzheimer’s Disease and the Amyloid-β Peptide. J. Alzheimer’s Dis. 2010, 19, 311–323. [Google Scholar] [CrossRef] [PubMed]
- Braak, H.; Braak, E. Staging of Alzheimer-Related Cortical Destruction. Int. Psychogeriatr. 1997, 9 (Suppl. S1), 257–261, discussion 269–272. [Google Scholar] [CrossRef]
- Ewers, M.; Sperling, R.A.; Klunk, W.E.; Weiner, M.W.; Hampel, H. Neuroimaging Markers for the Prediction and Early Diagnosis of Alzheimer’s Disease Dementia. Trends Neurosci. 2011, 34, 430–442. [Google Scholar] [CrossRef]
- Greicius, M.D.; Srivastava, G.; Reiss, A.L.; Menon, V. Default-Mode Network Activity Distinguishes Alzheimer’s Disease from Healthy Aging: Evidence from Functional MRI. Proc. Natl. Acad. Sci. USA 2004, 101, 4637–4642. [Google Scholar] [CrossRef]
- Hampton, O.L.; Buckley, R.F.; Manning, L.K.; Scott, M.R.; Properzi, M.J.; Peña-Gómez, C.; Jacobs, H.I.L.; Chhatwal, J.P.; Johnson, K.A.; Sperling, R.A.; et al. Resting-State Functional Connectivity and Amyloid Burden Influence Longitudinal Cortical Thinning in the Default Mode Network in Preclinical Alzheimer’s Disease. NeuroImage Clin. 2020, 28, 102407. [Google Scholar] [CrossRef]
- Lee, E.-S.; Yoo, K.; Lee, Y.-B.; Chung, J.; Lim, J.-E.; Yoon, B.; Jeong, Y. Alzheimer’s Disease Neuroimaging Initiative Default Mode Network Functional Connectivity in Early and Late Mild Cognitive Impairment: Results From the Alzheimer’s Disease Neuroimaging Initiative. Alzheimer Dis. Assoc. Disord. 2016, 30, 289–296. [Google Scholar] [CrossRef] [Green Version]
- Cai, S.; Huang, L.; Zou, J.; Jing, L.; Zhai, B.; Ji, G.; von Deneen, K.M.; Ren, J.; Ren, A. Alzheimer’s Disease Neuroimaging Initiative Changes in Thalamic Connectivity in the Early and Late Stages of Amnestic Mild Cognitive Impairment: A Resting-State Functional Magnetic Resonance Study from ADNI. PLoS ONE 2015, 10, e0115573. [Google Scholar] [CrossRef]
- Koechlin, E.; Summerfield, C. An Information Theoretical Approach to Prefrontal Executive Function. Trends Cogn. Sci. 2007, 11, 229–235. [Google Scholar] [CrossRef] [PubMed]
- Müller, N.G.; Knight, R.T. The Functional Neuroanatomy of Working Memory: Contributions of Human Brain Lesion Studies. Neuroscience 2006, 139, 51–58. [Google Scholar] [CrossRef] [PubMed]
- Shen, K.; Welton, T.; Lyon, M.; McCorkindale, A.N.; Sutherland, G.T.; Burnham, S.; Fripp, J.; Martins, R.; Grieve, S.M. Structural Core of the Executive Control Network: A High Angular Resolution Diffusion MRI Study. Hum. Brain Mapp. 2020, 41, 1226–1236. [Google Scholar] [CrossRef]
- Spreng, R.N.; Shoemaker, L.; Turner, G.R. Executive Functions and Neurocognitive Aging. In Executive Functions in Health and Disease; Elsevier: Amsterdam, The Netherlands, 2017; pp. 169–196. ISBN 978-0-12-803676-1. [Google Scholar]
- Menon, V. Large-Scale Brain Networks and Psychopathology: A Unifying Triple Network Model. Trends Cogn. Sci. 2011, 15, 483–506. [Google Scholar] [CrossRef]
- Mormino, E.C.; Smiljic, A.; Hayenga, A.O.; Onami, S.H.; Greicius, M.D.; Rabinovici, G.D.; Janabi, M.; Baker, S.L.; Yen, I.V.; Madison, C.M.; et al. Relationships between Beta-Amyloid and Functional Connectivity in Different Components of the Default Mode Network in Aging. Cereb. Cortex 2011, 21, 2399–2407. [Google Scholar] [CrossRef]
- Seeley, W.W.; Menon, V.; Schatzberg, A.F.; Keller, J.; Glover, G.H.; Kenna, H.; Reiss, A.L.; Greicius, M.D. Dissociable Intrinsic Connectivity Networks for Salience Processing and Executive Control. J. Neurosci. 2007, 27, 2349–2356. [Google Scholar] [CrossRef]
- Menon, V.; Uddin, L.Q. Saliency, Switching, Attention and Control: A Network Model of Insula Function. Brain Struct. Funct. 2010, 214, 655–667. [Google Scholar] [CrossRef]
- Seeley, W.W. The Salience Network: A Neural System for Perceiving and Responding to Homeostatic Demands. J. Neurosci. 2019, 39, 9878–9882. [Google Scholar] [CrossRef]
- Arkin, S.C.; Ruiz-Betancourt, D.; Jamerson, E.C.; Smith, R.T.; Strauss, N.E.; Klim, C.C.; Javitt, D.C.; Patel, G.H. Deficits and Compensation: Attentional Control Cortical Networks in Schizophrenia. NeuroImage Clin. 2020, 27, 102348. [Google Scholar] [CrossRef]
- Shi, Q.; Chen, H.; Jia, Q.; Yuan, Z.; Wang, J.; Li, Y.; Han, Z.; Mo, D.; Zhang, Y. Altered Granger Causal Connectivity of Resting-State Neural Networks in Patients With Leukoaraiosis-Associated Cognitive Impairment—A Cross-Sectional Study. Front. Neurol. 2020, 11, 457. [Google Scholar] [CrossRef] [PubMed]
- Abdallah, C.G.; Averill, L.A.; Akiki, T.J.; Raza, M.; Averill, C.L.; Gomaa, H.; Adikey, A.; Krystal, J.H. The Neurobiology and Pharmacotherapy of Posttraumatic Stress Disorder. Annu. Rev. Pharmacol. Toxicol. 2019, 59, 171–189. [Google Scholar] [CrossRef] [PubMed]
- Uddin, L.Q. Functions of the Salience Network. In Salience Network of the Human Brain; Elsevier: Amsterdam, The Netherlands, 2017; pp. 11–16. ISBN 978-0-12-804593-0. [Google Scholar]
- Wei, P.-H.; Chen, H.; Ye, Q.; Zhao, H.; Xu, Y.; Bai, F. on behalf of Alzheimer’s Disease Neuroimaging Initiative Self-Reference Network-Related Interactions During the Process of Cognitive Impairment in the Early Stages of Alzheimer’s Disease. Front. Aging Neurosci. 2021, 13, 666437. [Google Scholar] [CrossRef] [PubMed]
- Li, R.; Wu, X.; Fleisher, A.S.; Reiman, E.M.; Chen, K.; Yao, L. Attention-Related Networks in Alzheimer’s Disease: A Resting Functional MRI Study. Hum. Brain Mapp. 2012, 33, 1076–1088. [Google Scholar] [CrossRef]
- The Alzheimer’s Disease Neuroimaging Initiative; Zhan, Y.; Ma, J.; Alexander-Bloch, A.F.; Xu, K.; Cui, Y.; Feng, Q.; Jiang, T.; Liu, Y. Longitudinal Study of Impaired Intra- and Inter-Network Brain Connectivity in Subjects at High Risk for Alzheimer’s Disease. JAD 2016, 52, 913–927. [Google Scholar] [CrossRef]
- Ferreira, D.; Pereira, J.B.; Volpe, G.; Westman, E. Subtypes of Alzheimer’s Disease Display Distinct Network Abnormalities Extending Beyond Their Pattern of Brain Atrophy. Front. Neurol. 2019, 10, 524. [Google Scholar] [CrossRef]
- Melrose, R.J.; Jimenez, A.M.; Riskin-Jones, H.; Weissberger, G.; Veliz, J.; Hasratian, A.S.; Wilkins, S.; Sultzer, D.L. Alterations to Task Positive and Task Negative Networks during Executive Functioning in Mild Cognitive Impairment. NeuroImage Clin. 2018, 19, 970–981. [Google Scholar] [CrossRef]
- Yoshida, T.; Ohno-Matsui, K.; Ichinose, S.; Sato, T.; Iwata, N.; Saido, T.C.; Hisatomi, T.; Mochizuki, M.; Morita, I. The Potential Role of Amyloid Beta in the Pathogenesis of Age-Related Macular Degeneration. J. Clin. Investig. 2005, 115, 2793–2800. [Google Scholar] [CrossRef]
- McKee, A.C.; Au, R.; Cabral, H.J.; Kowall, N.W.; Seshadri, S.; Kubilus, C.A.; Drake, J.; Wolf, P.A. Visual Association Pathology in Preclinical Alzheimer Disease. J. Neuropathol. Exp. Neurol. 2006, 65, 621–630. [Google Scholar] [CrossRef]
- Baddeley, A.D. Attentional Control in Alzheimer’s Disease. Brain 2001, 124, 1492–1508. [Google Scholar] [CrossRef] [Green Version]
- Galton, C.J. Atypical and Typical Presentations of Alzheimer’s Disease: A Clinical, Neuropsychological, Neuroimaging and Pathological Study of 13 Cases. Brain 2000, 123, 484–498. [Google Scholar] [CrossRef] [PubMed]
- Jack, C.R.; Bennett, D.A.; Blennow, K.; Carrillo, M.C.; Dunn, B.; Haeberlein, S.B.; Holtzman, D.M.; Jagust, W.; Jessen, F.; Karlawish, J.; et al. NIA-AA Research Framework: Toward a Biological Definition of Alzheimer’s Disease. Alzheimer’s Dement. 2018, 14, 535–562. [Google Scholar] [CrossRef] [PubMed]
- Albert, M.S.; DeKosky, S.T.; Dickson, D.; Dubois, B.; Feldman, H.H.; Fox, N.C.; Gamst, A.; Holtzman, D.M.; Jagust, W.J.; Petersen, R.C.; et al. The Diagnosis of Mild Cognitive Impairment Due to Alzheimer’s Disease: Recommendations from the National Institute on Aging-Alzheimer’s Association Workgroups on Diagnostic Guidelines for Alzheimer’s Disease. Alzheimer’s Dement 2011, 7, 270–279. [Google Scholar] [CrossRef] [PubMed]
- Ossenkoppele, R.; Jansen, W.J.; Rabinovici, G.D.; Knol, D.L.; van der Flier, W.M.; van Berckel, B.N.; Scheltens, P.; Visser, P.J.; Amyloid PET Study Group; Verfaillie, S.C.; et al. Prevalence of Amyloid PET Positivity in Dementia Syndromes: A Meta-Analysis. JAMA 2015, 313, 1939–1949. [Google Scholar] [CrossRef] [PubMed] [Green Version]


| HiAmy | LowAmy | HC | p-Value | |
|---|---|---|---|---|
| Number of participants | 27 (16 AD, 11 AmyMCI) | 31 (13 VD, 18 NamyMCI) | 25 | |
| Age (mean ± SD) | 74 ± 7.17 (55–87) | 77 ± 6.23 (66–88) | 72 ± 6.34 (60–85) | 0.245 |
| Sex (M:F) | 16:11 | 11:20 | 16:9 | 0.412 |
| HK-MoCA score | 19 ± 5.91 (3–24) | 20 ± 4.23 (7–27) | N/A | 0.063 |
Publisher’s Note: MDPI stays neutral with regard to jurisdictional claims in published maps and institutional affiliations. |
© 2022 by the authors. Licensee MDPI, Basel, Switzerland. This article is an open access article distributed under the terms and conditions of the Creative Commons Attribution (CC BY) license (https://creativecommons.org/licenses/by/4.0/).
Share and Cite
Cheung, E.Y.W.; Chau, A.C.M.; Shea, Y.-F.; Chiu, P.K.C.; Kwan, J.S.K.; Mak, H.K.F. Level of Amyloid-β (Aβ) Binding Leading to Differential Effects on Resting State Functional Connectivity in Major Brain Networks. Biomedicines 2022, 10, 2321. https://doi.org/10.3390/biomedicines10092321
Cheung EYW, Chau ACM, Shea Y-F, Chiu PKC, Kwan JSK, Mak HKF. Level of Amyloid-β (Aβ) Binding Leading to Differential Effects on Resting State Functional Connectivity in Major Brain Networks. Biomedicines. 2022; 10(9):2321. https://doi.org/10.3390/biomedicines10092321
Chicago/Turabian StyleCheung, Eva Y. W., Anson C. M. Chau, Yat-Fung Shea, Patrick K. C. Chiu, Joseph S. K. Kwan, and Henry K. F. Mak. 2022. "Level of Amyloid-β (Aβ) Binding Leading to Differential Effects on Resting State Functional Connectivity in Major Brain Networks" Biomedicines 10, no. 9: 2321. https://doi.org/10.3390/biomedicines10092321