

Mercury and Autism Spectrum Disorder: Exploring the Link through Comprehensive Review and Meta-Analysis


1
Innovative Centre, Faculty of Chemistry, University of Belgrade, Studentski Trg 12–16, 11000 Belgrade, Serbia
2
Clinical Centre of Montenegro, Clinic for Neurosurgery, Ljubljanska bb, 81000 Podgorica, Montenegro
3
Institute for Biological Research “Siniša Stanković”—National Institute of the Republic of Serbia, University of Belgrade, Bulevar Despota Stefana 142, 11060 Belgrade, Serbia
*
Author to whom correspondence should be addressed.
Biomedicines 2023, 11(12), 3344; https://doi.org/10.3390/biomedicines11123344
Submission received: 29 October 2023
/
Revised: 2 December 2023
/
Accepted: 13 December 2023
/
Published: 18 December 2023
(This article belongs to the Special Issue Neurodegeneration in Cognitive Impairment and Mood Disorders for Experimental, Clinical and Translational Neuropsychiatry)
Abstract
:Mercury (Hg) is a non-essential trace metal with unique neurochemical properties and harmful effects on the central nervous system. In this study, we present a comprehensive review and meta-analysis of peer-reviewed research encompassing five crucial clinical matrices: hair, whole blood, plasma, red blood cells (RBCs), and urine. We assess the disparities in Hg levels between gender- and age-matched neurotypical children (controls) and children diagnosed with autism spectrum disorder (ASD) (cases). After applying rigorous selection criteria, we incorporated a total of 60 case-control studies into our meta-analysis. These studies comprised 25 investigations of Hg levels in hair (controls/cases: 1134/1361), 15 in whole blood (controls/cases: 1019/1345), 6 in plasma (controls/cases: 224/263), 5 in RBCs (controls/cases: 215/293), and 9 in urine (controls/cases: 399/623). This meta-analysis did not include the data of ASD children who received chelation therapy. Our meta-analysis revealed no statistically significant differences in Hg levels in hair and urine between ASD cases and controls. In whole blood, plasma, and RBCs, Hg levels were significantly higher in ASD cases compared to their neurotypical counterparts. This indicates that ASD children could exhibit reduced detoxification capacity for Hg and impaired mechanisms for Hg excretion from their bodies. This underscores the detrimental role of Hg in ASD and underscores the critical importance of monitoring Hg levels in ASD children, particularly in early childhood. These findings emphasize the pressing need for global initiatives aimed at minimizing Hg exposure, thus highlighting the critical intersection of human–environment interaction and neurodevelopment health.
1. Introduction
Autism spectrum disorder (ASD) is a disturbance associated with brain development that causes problems in social interaction and communication, along with restricted and/or repetitive behaviors or interests [1,2]. Terminologically, in 2022, the World Health Organization (WHO) published the latest International Classification of Disease and Related Problems-11th Revision (ICD-11), and the official name of autism is ASD [3]. Additionally, according to the European Autism Information System (EAIS), the official name/observation ASD should be used [4].
The incidence of ASD has risen to such an extent that it has become known as the “ASD epidemic” in scientific literature [5]. According to the latest WHO report, one in every 100 children receives a diagnosis of ASD [6]. In the United States (US), one out of every 36 children carries a confirmed ASD diagnosis [7]. Notably, ASD is considerably more prevalent in boys, with a nearly fourfold higher incidence compared to girls [8,9]. Symptoms of ASD typically manifest within the first year of life, becoming most conspicuous between 18 and 24 months [10,11]. Currently, no prenatal biomarker for ASD exists, and regrettably, ASD remains without a cure. However, with appropriate treatments, it is a condition that can be effectively managed [12,13,14].
It is widely accepted that the etiology of ASD is multifactorial, with various contributing factors [15,16]. In addition to genetic, epigenetic, and certain environmental factors, there is a growing suspicion that non-essential trace metals, particularly those with neurotoxic properties, could play a crucial role in the etiology of ASD. It is known that Hg is not the only toxic metal associated with ASD. Other metals related to ASD are aluminum (Al), antimony (Sb), arsenic (As), beryllium (Be), cadmium (Cd), chromium (Cr), lead (Pb), and nickel (Ni) [17,18]. Non-essential trace elements have no known function in the human body and can be toxic even in low levels. Non-essential trace elements include heavy metals and metalloids such as aluminum Al, As, Cd, Hg, Pb, Sb, tin (Sn), uranium (U), and vanadium (V). Their toxicity is related to their ability to damage vital organs such as the brain, kidney, liver, and others. Long-term exposure to non-essential elements can lead to physical (e.g., chronic pain, changes in blood pressure, changes in blood composition, etc.) and psychological (e.g., anxiety, passivity, etc.) disorders, neurodegenerative diseases, and cancer [19]. Exposure to trace metals commences in utero, as the placental barrier often proves insufficient in preventing their transport to the developing fetus [20]. Furthermore, during the initial year of life, the immature blood–brain barrier leaves infants vulnerable to the effects of non-essential trace metals [21,22]. As a result, trace metals can disrupt critical biochemical processes essential for sustaining life [23]. However, the etiology of ASD is still unclear. Environmental factors that could prenatally influence the onset of ASD include immune abnormalities, zinc deficiency, abnormal melatonin synthesis, maternal diabetes, stress, toxins, and parental age. Postnatal environmental factors include stress, immune abnormalities, and toxic metal. There is extensive evidence of the connection between many prenatal environmental factors and increased development of ASD [24].
The hazardous, non-essential/toxic trace metal Hg has garnered notable attention due to its potent neurotoxic properties and specific neurobiochemistry within the human body. According to its role in the body, Hg is classified as a non-essential toxic element, while it is considered a heavy metal according to its physical and chemical properties [25]. The WHO classifies Hg as one of the 10 priority environmental pollutants [26]. Industrial development has led to a nearly threefold increase in Hg emissions into the environment, with atmospheric Hg levels rising by nearly 1.5% annually [27].
Hg exists in various forms, including elemental (Hg0), inorganic (Hg2+), and organic (alkyl Hg) forms [28]. While elemental Hg can be ingested orally with minimal adverse effects, it becomes toxic when chemically converted into the Hg2+ species [26,29]. Further bioconversion into alkyl Hg results in a highly toxic compound with a strong affinity for lipid-rich organs, specifically the brain [30]. Organic forms of Hg (such as methylmercury, MeHg and ethylmercury, EtHg) are notably more toxic than inorganic forms [31,32].
Even at relatively low levels, Hg can be deleterious, primarily to young children [33,34]. Hg easily crosses both the placental and blood–brain barriers, accumulating in the central nervous system, particularly in the cerebral cortex and cerebellum. MeHg and EtHg are fat-soluble and have a high affinity for thiol groups, allowing them to easily penetrate the placental and the blood–brain barrier [35]. Within cells, Hg binds to mitochondria, the endoplasmic reticulum, and the Golgi apparatus, disrupting their essential biochemical functions [36]. The buildup of Hg in brain structures results in neuroinflammation, oxidative stress, and elevated levels of autoantibodies against brain proteins and other components [37,38]. Chronic childhood Hg poisoning, known as acrodynia or “pink disease”, resulting from exposure to Hg chloride-containing tooth powder, underscores the vulnerability of children to Hg compared to adults [39,40]. Moreover, offspring of acrodynia survivors face a higher risk of developing ASD, with an earlier incidence rate of one in 22 compared to the general child population’s one in 160 [39].
During pregnancy, the main sources of Hg exposure stem from maternal consumption of seafood and the number of dental Hg amalgam fillings [41,42]. Seafood consumption poses a common and potentially hazardous route, primarily due to the ingestion of MeHg through contaminated fish, shellfish, and sea mammals [43]. According to the Food and Drug Administration (FDA), pregnant women, women of childbearing age, and young children are advised to avoid shark, swordfish, mackerel, and tilefish, due to their higher Hg concentrations [44]. In contrast, Hg exposure from dental fillings remains relatively constant over time, with dental Hg amalgam fillings largely being replaced by composite fillings [31]. Airborne Hg exposure, primarily resulting from industrial waste, such as coal burning and mining activities, cannot be ruled out [45,46].
Children have been exposed to Hg later in life through thimerosal, a compound containing EtHg used in some vaccines, and anti-Rho(D) immune globulins for Rh-negative mothers during pregnancy [47,48]. Thimerosal, with approximately 50% of its weight consisting of Hg, has been used as a preservative in numerous vaccines since the 1930s to prevent microbial growth [2,49]. Due to substantial public concern and controversy, the FDA proposed the removal of thimerosal from vaccines between 1999 and 2001 [5]. The CDC, following several multi-year studies, declared that “exposure to thimerosal during pregnancy and in young children was not associated with an increased risk of ASD” [7]. It is worth noting that the incidence of ASD continued to rise even after the removal or reduction of thimerosal from many vaccines in the USA, Europe, and certain Asian countries [7]. Consequently, due to controversy, thimerosal was removed from anti-Rho(D) immune globulins [48]. Presently, the scientific community places substantial focus on the environmental Hg exposure of pregnant women, nursing mothers, and young children, suggesting that environmental triggers could play a more important role in the Hg-ASD link than vaccinations themselves. Kern et al.’s [50] review of 91 papers from 1999 to 2016 found that 74% of these papers identified environmental Hg exposure as a critical risk factor for ASD.
Many animal studies have attempted to determine the neurological mechanisms linking Hg and ASD. Experiments on monkeys show that Hg levels in the brain increase after exposure, and that it is necessary to evaluate the effects of its presence on neurological structures. After administering organic Hg to monkeys, the half-life of Hg in the brain varied considerably in different brain regions. In the thalamus, Hg levels remained the same, and in the pituitary gland, they doubled six months after exposure. Stereologic and autometallographic studies showed that the persistence of Hg in the brain was accompanied by a significant increase in the number of microglia, while the number of astrocytes decreased [51]. An active neuroinflammatory process was detected in the brains of ASD patients, including a marked activation of microglia. Hg-mediated modulation of cytokine production (IL-6, TNF-α) could have an adverse impact on ASD patients, leading to autoimmune brain response, IgG accumulation in brain, and CD4+ T cell infiltration [21]. It is also shown that some cognitive and sensory deficits can be associated with Tryptophan–Kynurenine metabolic system in the human brain [52].
On the other hand, the scientific community’s attention has shifted. The focus is not only on how Hg enters the body, but also on the mechanisms of its removal. This shift is particularly vital in the context of ASD children. Numerous investigations have indicated that this sensitive population group exhibits diminished capabilities in eliminating Hg from their bodies [21,49]. Several important factors have been identified, including heightened levels of oxidized glutathione, the far-reaching consequences of oxidative stress, increased use of oral antibiotics (especially during the first year, which disrupts the gut flora and leads to Hg methylation), alterations in cell cycles, epigenetic modifications (such as histone alterations, DNA methylation, and microRNA expression), as well as antagonistic effects on essential trace elements and changes in the expression of metallothioneins, among others. Further in-depth information on these detrimental effects of Hg on multiple biochemical processes can be found in existing literature [48,53].
The present systematic review and comprehensive meta-analysis aim to examine potential aspects of Hg contributing to ASD in children, investigating Hg levels in different biological materials (hair, whole blood, red blood cells, plasma, and urine), and shed light on the role of Hg levels in the context of this neurodevelopmental condition. To achieve that, we categorize, summarize, and discuss the published research papers on this topic.
2. Materials and Methods
The basis for this review and meta-analysis corresponds to the “Preferred Reporting Items for Systematic Reviews and Meta-Analyzes: the PRISMA Statement” [54]. The PRISMA statement was originally proposed in 2009. However, we have utilized the updated PRISMA 2020 statement, which supersedes the 2009 version and incorporates new reporting guidelines that reflect methodological advances in the identification, selection, appraisal, and synthesis of studies.
The main objective of the PRISMA 2020 statement is to ensure that users of review receive a transparent, comprehensive, and accurate account of the rationale for conducting the review, the methodology used, and the findings obtained [55]. It also includes a 27-item checklist, an expanded checklist with detailed reporting recommendations for each item, a PRISMA 2020 abstract checklist, and revised flowcharts for both original and updated reviews.
Prior to commencing the present study, the authors prepared a research protocol.
2.1. Information Sources
First, we searched four databases: SCOPUS, PubMed, ScienceDirect, and Google Scholar. However, as the publications in these databases overlap considerably, we concentrated on two of the most representative databases, SCOPUS and PubMed.
2.2. Search Strategy
Our major objective in this study was to identify all research that examined Hg levels in hair, whole blood, plasma, RBCs, and urine of neurotypical children (controls) and ASD children (cases). We conducted our literature search from 1985 to the present. To do this, we used a comprehensive search strategy with mesh terms such as “autism”, “autistic”, “child”, “preschool”, “school”, “heavy metals”, “toxic metals”, “mercury”, “Hg”, “hair”, “blood”, “plasma”, “red blood cells”, and “urine”. The authors in our search utilized a total of 1462 ASD-related keywords, with 29 being used most frequently. A graphical representation of these data, illustrating the network visualization and relationships between the observed keywords, can be found in Figure 1A,B (created with VOSviewer 1.6.19 software, copyright (c) 2009–2023 Nees Jan van Eck and Ludo Waltman Centre for Science and Technology Studies of Leiden University, Leiden, The Netherlands).
Additionally, we meticulously reviewed the reference lists of retrieved results. Our inclusion criteria encompassed original, case-control research studies that reported Hg levels in the specified clinical matrices of both cases and controls. Exclusion criteria were studies with adults, studies in which the diagnosis of ASD was not confirmed, studies with cases and controls that were not from the same residence, studies with age- and sex-mismatched cases and controls, studies that reported additional pathologies besides ASD, non-English language studies, studies with insufficient numerical data, and studies with extremely abnormal Hg values. Studies that refer to sufficient numerical data include results where the mean ± standard deviation (SD) or standard error (SE), or some other numerical value from which the SD can be calculated, is accurately reported. In fact, there are many studies that report only the mean without the SD or SE, or studies in which only graphs without numerical values are shown. In our meta-analysis, we set the criterion of using only complete data, i.e., mean values and SDs, that represent sufficient numerical data for us. Further exclusion factors are delineated in Figure 2. For the meta-analysis, we examined original full-length research articles spanning the following timeframes: 1985–2023 for hair (µg/g), 2004–2023 for whole blood (µg/L), 2011–2020 for plasma (µg/L), 2010–2017 for RBCs (µg/L), and 2003–2020 for urine Hg levels (µg/g creatinine). These timeframes were selected to ensure consistency in analytical procedures. Most authors employed inductively coupled plasma mass spectrometry (ICP-MS) to determine Hg concentrations in clinical matrices, while a smaller number utilized atomic absorption spectroscopy (AAS). Two papers used inductively coupled plasma optical plasma spectrometry (ICP-OES), one paper employed the Hg vaporimeter, and one paper utilized atomic fluorescence spectroscopy (AFS).
2.3. Study Selection and Data Extraction
A graphical representation of the selection process can be found in Figure 2. Two trained researchers (A.S. and S.P.) independently extracted the following data from each study: author(s) and year of publication, country of origin, sample size (controls/cases), age (controls/cases), gender (number of girls/boys in both groups), type of clinical matrices studied, analytical technique used, and Hg level (mean ± SD, given for controls and cases). In cases where results were reported as mean ± SEM, the SEM (standard error of the mean) was converted to SD using the appropriate formula. Similarly, when authors reported results as an interquartile range (IQR), we converted the IQR to SD [56]. Our inclusion criteria only considered papers in which the results were reported as numerical values. After the selection and data extraction process, the final list of studies was compiled through consensus.
2.4. Quality Assessment
Quality assessment of the enrolled studies was carried out using the Newcastle–Ottawa Scale (NOS) according to [57]. The quality assessment was based on the modified criteria of [58]. The possible scores ranged from 1 to 7, and studies that scored 7 were considered to be of the highest quality, with the lowest risk of bias. Studies that scored less than 7 were considered to be of lower quality, with a higher risk of bias.
We implemented a quality assessment procedure to take account of defects in various parameters. The deficiencies, such as a small sample size, the country of participants’ origin, absence of genderi nformation, age data, and method of analysis, were each scored as one “pointless”. ICP-MS was deemed the most representative analytical methodology, with all others receiving a score of one “unusable”. Finally, the number of points assigned to each study for each clinical matrix was determined, and a mean value for the entire meta-analysis was calculated. A detailed description of the quality assessment procedure can be found.
2.5. Statistical Analysis
The heterogeneity of the selected studies was evaluated using the I-squared (I2) and the associated Cochran’s Q test [59]. An I2 value exceeding 75% was considered indicative of a high level of heterogeneity, and to account for the limited power of the Q test in detecting heterogeneity, a significance level of p < 0.1 was used. In cases where heterogeneity exceeded 70%, pooled estimates were analyzed using the random effects model. We opted for the random effects model for all analyses, as we anticipated that the true effect sizes would vary among studies. Additionally, τ-squared (τ2), as per [60], was used to assess heterogeneity. A τ2 value close to 0 suggested low heterogeneity, while a τ2 value greater than 1 indicated substantial heterogeneity [61].
Effect sizes were calculated as mean differences in Hg levels in clinical materials (hair, whole blood, plasma, RBCs, and urine), and then converted to Hedges’s g, with adjustments to account for the influence of small sample sizes [62]. We also calculated 95% confidence intervals (CIs) to measure statistical variance in the pooled effect sizes. In addition, we determined the relative weight of each study to gain insight into the contribution of each study to the overall results of our meta-analysis. This was particularly important for studies categorized as outliers or those with a high risk of bias. The standard residual was also estimated to illustrate the unaccounted-for residual variability between studies. Significance was set at a two-sided p value of less than 0.05.
Statistical analysis was performed using Comprehensive Meta-Analysis software (v. 3.0, Biostat Inc., Frederick, MD, USA). Additionally, as previously mentioned, we employed VOSviewer 1.6.19 software to create network data maps for visualization and exploration.
2.6. Publication Bias
Publication bias is the selective publication of research studies, where studies with positive results are more likely to be published than studies with negative results. To avoid publication bias in the selection of publications for this meta-analysis, we included all studies that met the specified criteria, regardless of whether their outcome was positive or negative. We also performed appropriate statistical tests to mathematically calculate the publication bias. Although combining the data from independent studies using meta-analytical methods can improve statistical precision, it cannot altogether prevent bias.
To assess publication bias, we conducted Egger’s regression test [63] and Begg and Mazumdar’s rank correlation test [64]. For each type of clinical matrix, publication bias was visually represented using funnel plots. We also utilized the fail-safe method to determine the number of missing studies required to potentially improve the quality of the meta-analysis. However, these results are not presented in this context, given the fact that we did not find a statistically significant publication bias in any of the materials we examined.
3. Results
3.1. Study Selection and Identification
The process of study selection and identification is summarized in Figure 2. Our initial literature search across two primary databases, SCOPUS and PubMed, yielded a total of 9091 records. After removing 596 duplicate records, we further refined the selection based on title and abstract, resulting in the exclusion of 6525 records with irrelevant topics. The remaining 1374 reports were subjected to a detailed search for retrieval. Of these, 1129 reports were not retrievable, and the remaining 245 reports underwent eligibility screening. Within these 245 reports, 122 lacked the necessary data, 16 reports lacked control data, 43 reports were reviews, and 2 reports contained extremely abnormal data, all of which were excluded (total excluded, n = 183 reports). This process led to a final selection of 62 studies for inclusion in the analysis. After a final check, two additional studies with abnormal data were also excluded. Consequently, the meta-analysis included a total of 60 studies. The total number of control participants across all studies was 2991, while the total number of cases was 3892. This resulted in a cumulative total of 6883 participants considered for the meta-analysis.
3.2. Study Characteristics
Table 1 provides an overview of the characteristics of the studies incorporated into the meta-analysis. For the analysis of Hg level in hair, a total of 25 studies were included [65,66,67,68,69,70,71,72,73,74,75,76,77,78,79,80,81,82,83,84,85,86,87,88,89], encompassinf various geographic regions. Specifically, there were 7 studies conducted in Europe [70,71,74,76,80,85,88], 5 in North America [73,79,83,86,87], 9 in Asia [65,66,67,72,77,78,81,82,84], and 4 in Africa [68,69,75,89]. The meta-analysis of Hg levels in whole blood comprised 15 studies [78,86,90,91,92,93,94,95,96,97,98,99,100,101,102,103], with 2 conducted in Europe [85,92], 5 in North America [91,95,96,98,99], 1 in Central America [97], 5 in Asia [77,91,93,100,101], and 2 in Africa [94,102]. For plasma Hg levels, 6 studies were incorporated into the meta-analysis [62,92,103,104,105,106], with 2 originating from Europe [92,106], 2 from Asia [62,105], and 2 from Africa [103,104]. In the case of RBCs, the meta-analysis consisted of 5 studies [37,90,107,108,109], of which 2 were from North America [90,108] and 3 from Asia [37,107,109]. Finally, the analysis of urine Hg values included 9 studies [67,76,78,85,90,110,111,112,113], with 3 from Europe [76,85,111], 3 from North America [90,112,113], 2 from Asia [67,78], and 1 from Africa [110]. These studies collectively contributed to our analysis of Hg levels in various clinical matrices and were drawn from diverse geographic regions worldwide.
3.3. Quality Assessment
The quality scores assigned to the studies enrolled in the meta-analysis ranged from 1 to 7, with an average score of 6.17. The quality scores differed slightly across the different clinical matrices. Specifically, the quality score for hair studies averaged 6.20, for whole blood studies it was 6.47, for plasma studies it was 6.00, for RBCs studies it was 5.60, and for urine studies it was 6.56 (Table 2). Scores of 5 and 6 were assigned to specific studies, and they generally reflected certain criteria. A score of 5 was typically assigned when participant gender and age were not represented, when numerical data (such as standard deviation or error) were missing, and when ICP-MS was not used as the analytical method. A score of 6 was assigned to studies that did not report either participant gender or age but provided all necessary numerical data required for the meta-analysis. These scores did not imply that the selected studies were of lower quality but rather indicated that they did not fully meet the criteria established for this meta-analysis.
3.4. Meta-Analysis of Hg Levels in Hair
This portion of the analysis included 25 studies with a combined sample size of 1134 controls and 1361 cases. Among these studies, four reported age ranges for controls and cases, one study did not specify age, and the remaining 20 studies had mean ages of 5.64 years for controls and 5.72 years for cases. While four studies did not report the gender of participants, two studies only reported gender for cases, and the other 19 studies provided gender data for both controls and cases. Among these 19 studies, there were 481 girls and 623 boys in the control group, and 222 girls and 626 boys in the case group. Analytical techniques for Hg concentration assessment varied, with 16 studies using ICP-MS, eight studies using AAS, and one study using AFS.
The mean hair Hg levels showed considerable variation, ranging from 0.0077 ± 0.0039 µg/g [71] to 13.00 ± 12.68 µg/g [76] for controls, and from 0.127 ± 0.049 µg/g [70] to 8.26 ± 10.57 µg/g [76] for ASD cases. Out of the 25 studies, nine reported significantly higher Hg levels in the hair of cases compared to controls, eight reported significantly lower levels in cases, and eight reported no significant differences between the two groups.
Pooling of the data using the random effects model revealed no significant differences between cases and controls, with Hedges’s g = −0.432 (95% CI: −0.980, 0.115) and p = 0.122. Individual study effect sizes ranged from −47.909 (95% CI: −54.806, −41.012, p = 0.000) in the study by [88] to 1.548 (95% CI: 1.150, 1.945, p = 0.000) in the study by [83]. Relative weights and standard residuals for each study are presented in Figure 3. Relative weights ranged from 0.55% [88] to 4.36% [69], and standard residuals ranged from −12.65 [88] to 8.85 [89]. High heterogeneity was observed with I2 = 97.170%, Q(24) = 847.959, and τ2 = 1.772, p = 0.000, indicating substantial variation in the true mean effects between studies.
Publication bias was assessed using funnel plots, which indicated no significant publication bias. Egger’s regression test showed t25 = 1.027, p = 0.157, and Begg and Mazumdar rank correlation demonstrated Kendall’s τ = −0.120, p = 0.200 (Figure 4).
In summary, we did not provide evidence of higher Hg levels in the hair of ASD children compared to neurotypical children (p = 0.122).
3.5. Meta-Analysis of Hg Levels in Whole Blood
The meta-analysis of Hg levels in whole blood included 15 studies with a total sample size of 1019 neurotypical children and 1345 ASD children (Table 1). In two studies, age ranges were reported for both controls and cases; in one study, ages ranged from 2 to 5 years in both groups, and in another study, they ranged from 2.3 to 4.7 years for controls and 2.6 to 4.0 years for cases. For the remaining 11 studies, the mean age was 7.15 years for controls and 7.40 years for cases.
One study did not provide information about gender, while the other 14 studies reported that the control group consisted of 219 girls and 806 boys, and the case group included 315 girls and 896 boys. The analytical techniques used varied, with nine studies using ICP-MS and six studies using AAS (Table 1).
The mean Hg levels in whole blood varied markedly. In controls, they ranged from 0.00 ± 0.00 µg/L [94] to 19.53 ± 5.65 µg/L [77]. In cases, the levels ranged from 0.19 ± 0.62 µg/L [100] to 55.59 ± 52.56 µg/L [91]. Seven studies reported significantly higher Hg levels in the whole blood of cases than in controls, three reported levels significantly lower than in controls, while five studies did not find significant differences between the two groups.
The forest plot of pooled data under the random effects model (Figure 5) showed significant differences between cases and controls, with Hedges’s g = −0.813 (95% CI: −1.307, −0.318) and p = 0.001. Effect sizes in individual studies ranged from −10.438 (95% CI: −12.017, −8.859, p = 0.000) in the study by [94] to 0.532 (95% CI: 0.251, 0.813, p = 0.000) in the study by [100]. The relative weights and standard residuals for each study are also displayed in Figure 5. Relative weights ranged from 4.14% [94] to 7.07% [96], and standard residuals ranged from −7.92 [94] to 1.46 [100]. High heterogeneity was observed, with I2 = 96.654%, Q(14) = 418.462, and τ2 = 0.891, indicating substantial variation in the true mean effects between studies.
Publication bias was assessed using funnel plots, which indicated no significant publication bias. Egger’s regression test showed t15 = 1.621, p = 0.064, and Begg and Mazumdar rank correlation demonstrated Kendall’s τ = −0.276, p = 0.076 (Figure 6).
In conclusion, the pooled effect size indicates significantly higher Hg levels in whole blood among ASD cases compared to controls (p = 0.001).
3.6. Meta-Analysis of Hg Levels in Plasma
The meta-analysis of plasma Hg levels in controls and cases involved six studies with a combined sample size of 224 neurotypical children and 263 ASD children (Table 1). In one study, the mean age was not reported for females and was 2–6 years for males. In the remaining five studies, the mean age was 5.63 years for controls and 5.19 years for cases. The control group consisted of 83 girls and 141 boys, while the case group included 55 girls and 208 boys. Analytical techniques varied across studies, with one study using ICP-MS, two studies using ICP-OES, and three studies using AAS.
The mean Hg levels in plasma ranged from 0.00 ± 0.00 µg/L [106] to 12.08 ± 4.05 µg/L [104] in the control group, and from 0.81 ± 0.22 µg/L [105] to 32.90 ± 16.40 µg/L [104] in the case group. Three studies reported significantly higher plasma Hg levels in cases than in controls, one study found significantly lower levels, and two studies reported no significant differences.
The forest plot of pooled data under the random-effects model is depicted in Figure 7. The results show significant differences between the two groups, with Hedges’s g = −1.161 (95% CI: −2.247, −0.075) and p = 0.036. Effect sizes in individual studies ranged from −2.878 (95% CI: −3.535, −2.222, p < 0.001) in the study by [62] to −0.090 (95% CI: −0.402, 2.222, p = 0.571) in the study by [103], indicating high heterogeneity in plasma. The relative weights and standard residuals for each study are also shown in Figure 7. Relative weights ranged from 16.28% [106] to 17.19% [103], and standard residuals ranged from −1.37 [62] to 1.51 [104]. The heterogeneity was I2 = 96.256%, Q(5) = 133.562, and τ2 = 1.761, p = 0.000, indicating high heterogeneity in reporting Hg levels in plasma.
Funnel plots (Figure 8) were used to assess publication bias, which revealed no significant publication bias. Egger’s regression test showed t5 = 1.655, p = 0.087, and Begg and Mazumdar rank correlation demonstrated Kendall’s τ = −0.467, p = 0.094.
In summary, the pooled effect size indicates significantly higher plasma Hg levels in cases compared to controls (p = 0.036).
3.7. Meta-Analysis of Hg Levels in RBCs
The meta-analysis of Hg levels in RBCs involved five studies with a total sample size of 215 neurotypical children and 293 ASD children (Table 1). The mean age in the studies was 8.76 years for controls and 7.74 years for cases. Two studies did not report the gender distribution [37,109], and one study [107] reported the control group’s gender, but had an all-boys ASD group. The remaining control group consisted of 24 girls and 119 boys, while the case group included 11 girls and 207 boys. Analytical techniques used included ICP-MS in one study, AAS in three studies, and an Hg vaporimeter in one study.
Mean Hg levels in RBCs varied from 1.30 ± 0.20 µg/L [90] to 10.70 ± 4.30 µg/L [108] in the control group and from 1.20 ± 0.81 µg/L [90] to 22.20 ± 12.10 µg/L [108] in the case group. Four studies reported significantly higher Hg levels in the RBCs of cases compared to controls, while one study did not find significant differences.
The forest plot of pooled data under the random-effects model (Figure 9) indicated significant differences between cases and controls, with Hedges’s g = −1.354 (95% CI: −2.197, −0.512) and p = 0.002. Effect sizes in individual studies ranged from −2.736 (95% CI: −3.589, −1.882, p = 0.000) in the study by [37] to −0.099 (95% CI: −0.295, 0.493, p = 0.622) in the study by [90], showing high heterogeneity among RBCs. The relative weights and standard residuals for each study are also displayed in Figure 9. Relative weights ranged from 20.74% [90] to 21.03% [108]. The heterogeneity was high, with I2 = 93.974%, Q(4) = 66.383, and τ2 = 0.851, p = 0.000.
Publication bias was assessed using funnel plots, which revealed no significant publication bias. Egger’s regression test showed t5 = 0.901, p = 0.217, and Begg and Mazumdar rank correlation demonstrated Kendall’s τ = −0.200, p = 0.312 (Figure 10).
In conclusion, the pooled effect size indicates significantly higher levels of Hg in RBCs in cases compared to controls (p = 0.002).
3.8. Meta-Analysis of Hg Levels in Urine
The meta-analysis of urine Hg levels included nine studies with a total sample size of 399 neurotypical children and 623 ASD children (Table 1). In one study [78], the mean age ranged from 3 to 11 years for both groups, while in another study [76], the age was not specified. In the other seven studies, the mean age was 8.50 years for the controls and 7.53 years for the cases. The control group consisted of 76 girls and 233 boys, and the case group included 95 girls and 474 boys. The [112] study used only boys in their experiment, and the gender structure was not specified in the study by [76]. In eight studies, ICP-MS was used, and one study used AAS as the analytical technique.
Mean Hg levels in urine ranged from 0.29 ± 0.53 µg/g creatinine [112] to 5.40 ± 5.07 µg/g creatinine [111] in the control group and from 0.36 ± 0.62 µg/g creatinine [112] to 11.30 ± 6.63 µg/g creatinine [110] in the case group. Four studies reported significantly higher urine Hg levels in cases compared to controls, one study reported significantly lower levels, and four studies did not find significant differences.
The forest plot of pooled data under the random-effects model is depicted in Figure 11. The results showed significant differences between the two groups, with Hedges’s g = −0.471 (95% CI: −0.981, 0.040) and p = 0.071. Effect sizes in individual studies ranged from −0.333 (95% CI: −0.813, 0.147, p = 0.173) in the study by [113] to −2.092 (95% CI: −2.521, −1.663, p = 0.000) in the study by [110]. The relative weights and standard residuals for each study are shown in Figure 11. Relative weights ranged from 10.26% [85] to 12.61% [78]. Heterogeneity was present, with I2 = 92.204%, Q(8) = 102.612, and τ2 = 0.557, indicating a high degree of variation among studies. Compared with hair, whole blood, plasma, and RBCs, the least heterogeneity was obtained for studies reporting Hg levels in urine.
Funnel plots were used to assess publication bias (Figure 12), and they indicated no significant publication bias in urine samples. Egger’s regression test showed t9 = 0.246, p = 0.406, and Begg and Mazumdar rank correlation demonstrated Kendall’s τ = 0.000, p = 0.500.
In summary, the pooled effect size did not show significantly higher urine Hg levels in cases compared to controls (p = 0.071).
Overall, this meta-analysis revealed significantly higher Hg values in cases compared to controls in whole blood, plasma, and RBCs, with high heterogeneity observed. At the same time, no significant differences were found in hair and urine Hg levels between neurotypical children and ASD children. The analysis of publication bias for hair, blood, plasma, RBCs, and urine did not indicate statistically significant publication bias in any of the studies analyzed.
4. Discussion
In this section, we will not provide a detailed discussion of the studies enrolled in the meta-analysis, as presented in Table 1. Studies that provided specific data, such as Hg levels in clinical matrices of cases and controls sorted by gender, age, residence, and other demographic characteristics, will be discussed in more detail.
4.1. Hg in Hair
Scalp hair is considered a suitable sample for assessing Hg levels in ASD children. It is collected noninvasively, reflects long-term Hg exposure, and is a primary sample in evaluating the link between Hg and ASD [78,114]. However, it is important to collect and prepare hair samples appropriately to avoid potential contamination in the pre-analytical phase. Scalp hair grows at a rate of approximately 1.5 cm per month, and can provide insights into Hg exposure over time [115].
The 1999–2000 NHANES study reported a mean hair Hg value of 0.12 µg/g for healthy neurotypical USA children (n = 838, aged 1 to 5 years) [116]. Their study also highlighted that hair can contain significantly higher Hg levels compared to blood, making it a suitable sample for environmental science. When assessing hair from children with ASD, it is essential to consider the age of the children, as younger children with ASD could exhibit different Hg levels than older children with ASD. Majewska et al. [88] pointed out that younger children with ASD had lower Hg levels than older children with ASD. This discrepancy might be attributed to increased Hg exposure or variations in detoxification mechanisms over time. Nevertheless, it is crucial to explore these variables’ dynamics as children with ASD grow, depending on their Hg exposure and detoxification mechanisms.
Several studies reported significantly lower Hg levels in the hair of ASD cases compared to controls, and the specifics can be found in Table 1. A meta-analysis conducted by Saghazadeh and Rezaei [117], involving 1092 cases and 973 controls, did not establish a link between Hg and ASD in hair samples. However, it reported substantially higher hair Hg levels in ASD cases from developing countries compared to those from developed countries. These findings of unaltered levels of Hg in hair were consistent with the data we obtained in this meta-analysis of 1361 cases and 1134 controls. It is important to note that studies with exceptionally high Hg levels in hair, such as the one by Fido and Al-Saad [84], were excluded from our analysis.
To date, limited research has explored differences in hair Hg levels in ASD cases and neurotypical controls based on demographic and clinical factors. Adams et al. [73] found no significant differences in hair Hg levels for age groups 3–15 years and 3–6 years in the USA. In contrast, Zhai et al. [72] found significantly different hair Hg levels between female cases and female controls, but not between male cases and male controls in China. Geier et al. [53] reported a significant correlation between increasing ASD severity and higher hair Hg levels. However, research findings vary, as Lakshmi Priya and Geetha [82] did not find a significant association between ASD symptom severity and hair Hg levels. Fiore et al. [118] also reported no significant correlation between hair Hg levels and ASD symptom severity in participants from Catania, Southern Italy. Given these discrepancies, further extensive research is needed to better understand Hg levels in ASD children from different countries, accounting for demographic and clinical factors.
4.2. Hg in Whole Blood and Its Parts (Plasma/Serum and RBCs)
Whole blood and RBCs provide long-term information on Hg levels, particularly RBCs, which have a lifespan of approximately 120 days [31]. In contrast, plasma offers only short-term information on Hg exposure, making it less crucial as a clinical matrix in ASD [119]. Therefore, it is imperative to conduct comprehensive studies on the Hg status in the blood, hair, and urine of pregnant women, lactating women, and young children to gain in-depth insights into prenatal and early postnatal Hg exposure, potentially during the period when ASD begins to develop [41]. For instance, a study by Ryu et al. [120] found a connection between prenatal and early childhood Hg exposure and ASD behavior at age 5 by analyzing Hg levels from early pregnancy to age 3 in a longitudinal cohort study of 458 mother–child pairs.
Most studies have reported higher Hg values in whole blood, plasma, and RBCs of ASD cases compared to matched controls, particularly in children older than 3 years. For instance, Baj et al. [48] indicated higher serum Hg levels in 78.3% of children with ASD. Geier et al. [108] reported a twofold increase in Hg levels in RBCs of cases compared to gender- and age-matched controls. Nevertheless, a few studies have reported the opposite pattern, where Hg levels were lower in cases compared to controls (Table 1).
In addition to quantifying total Hg and Hg-species in whole blood and its derivatives, it is crucial to assess essential trace elements, primarily zinc (Zn) and selenium (Se). Some studies have indicated a deficiency of these two elements in ASD cases with elevated Hg profiles. For instance, Babaknejad et al. [121] reported a deficiency of Zn in ASD cases compared to controls, while El-Ansary et al. [37] found protective effects of Se in ASD cases with high Hg levels in RBCs. It is interesting to note that an occupational study by Chen et al. [122] with participants from an Hg-contaminated region reported significantly higher serum and urine Hg levels in the exposed population. McDowell et al. [116] found higher Hg levels in older women, women who consumed more seafood, and women of different ethnicities.
While a previous meta-analysis by Jafari et al. [35] reported significantly lower Hg levels in hair for cases compared to controls, they also reported higher Hg levels in whole blood and RBCs for ASD cases compared to controls. Shiani et al. [123] reported significantly higher Hg levels in 952 cases compared to 650 controls in their meta-analysis, which included 13 studies. These results corroborate previous findings of higher Hg levels in ASD cases compared to controls, but the current meta-analysis enrolled a substantially larger number of participants and samples, including plasma samples.
4.3. Hg in Urine
Urine reflects the short-term status of Hg exposure, and is easily accessible without invasive procedures [31,114,124]. Urine Hg excretion is particularly important in ASD cases receiving chelation therapy, such as dimercaptosuccinic acid (DMSA), which has been reported to lead to increased urine Hg excretion [113,125].
To date, three meta-analyses of urine Hg levels between cases and controls have been conducted. Jafari et al. [35] included eight studies (491 cases and 417 controls) and reported no significant differences in urine Hg levels between cases and controls. They also found no significant difference in urine Hg levels between cases in the US and certain other continents. Saghazadeh and Rezaei [117] similarly reported no significant differences between ASD cases and controls in terms of urine Hg levels. In contrast, Shiani et al. [122] conducted a meta-analysis involving seven studies (466 cases and 325 controls), and reported that children with ASD had significantly lower urine Hg levels compared to controls. Our meta-analysis observed no variations in urine Hg levels between cases and controls, consistent with the findings of Jafari et al. [35] and Saghazadeh and Rezaei [117], but on a larger sample.
As with hair and blood, there is limited knowledge about urine Hg levels in cases and controls concerning age, gender, and other demographic factors. We identified only one study that reported significantly lower urine Hg levels in children aged 2 to 4 years (n = 16, median value of 0.77 µg/L) compared to age-matched controls (n = 16, median value of 0.97 µg/L) [105]. In the comparison of urine Hg levels between children aged 4 to 6 years, no statistically significant differences in Hg levels were observed. This scarcity of data highlights the need for additional research in this direction to better understand the variations in urine Hg levels among different demographic groups.
In addition to measuring Hg levels in urine, several studies have focused on quantifying porphyrins in urine (pre-coproporphyrin, coproporphyrin, etc.), which could serve as specific biomarkers for Hg profiles in the body [38]. Porphyrins are heterocyclic compounds required for heme formation, an essential component of hemoglobin [48]. Many studies have reported significant increases in urine porphyrin levels in ASD cases compared to controls [35,77,104,112,126,127,128,129]. For instance, Geier and Geier [125] noted that children with ASD had 83% higher levels of urine coproporphyrin. Additionally, Geier et al. [130] established a link between high urinary porphyrin levels and ASD severity, although one study did not support this relationship [131]. This area warrants further research to enhance our understanding of urinary Hg and porphyrin levels in relation to ASD. In our meta-analysis, we did not include studies of children with ASD who underwent chelation therapy and subsequently had urinary Hg levels measured, which is actually evidence of the presence of a toxic metal in the organs.
4.4. Are Hg Levels in the Teeth a Promising Link to ASD?
Compared to other biological materials, deciduous teeth are perhaps the most promising clinical matrices for examining the link between Hg and ASD. Unfortunately, only two studies have been published on this topic to date, making it impossible to conduct a meta-analysis [41,112]. For a comprehensive understanding of the role of Hg in ASD, it is important to analyze tooth enamel rather than the entire tooth or dentin, because deciduous teeth’s enamel begins to develop in utero, and concludes between 3 months and 1 year after birth. This provides insight into prenatal and early postnatal exposure, a critical period when ASD begins to develop [112]. Of note, the Hg levels recorded by Adams et al. [41] for neurotypical children corresponded to levels found in brain tissue from monkeys subjected to thimerosal, simulating the US childhood vaccination schedule, emphasizing the importance of deciduous teeth, particularly enamel, in understanding the role of Hg in ASD. Hg levels ranging from 260 to over 600 ng/g have been reported in Minamata disease [41]. Further research in this area is needed to explore the potential relationship between Hg exposure through deciduous teeth and ASD.
4.5. Advantages and Limitations of Study Design and Further Directions
Although systematic review can provide useful overviews of the current state of knowledge on a topic if they are conducted with rigorous and clear methods, meta-analysis has some limitations. Although strict criteria were used to appropriately include individuals and exclude papers with very high levels of Hg in clinical matrices, the current study also had some limitations. We were unable to separate participants by gender, age, or residence, as the dimensionality required for reliable meta-analysis was lost. We have generalized results despite differences in primary research, combined different types of studies, and the summary effect may ignore important differences between studies, including the temporal relationship between exposure and outcome. In addition, it is possible that older children with ASD show more mouth behavior than healthy controls, leading to increased Hg levels in their biological tissues. There are not enough studies for nails and teeth, disease severity, and geographical region for ASD, and the measurement of total Hg but not inorganic or organic forms separately.
One of the primary challenges in elucidating the etiological role of Hg in ASD is the lack of access to the most authoritative clinical matrices to either confirm or refute a causal relationship. This primarily pertains to the inability to collect brain tissue from children with ASD due to the impracticality of surgical or biopsy procedures. The situation is further complicated by the fact that the exact timing of ASD onset remains unknown; symptoms emerge at varying ages.
For all the positive and negative aspects of the meta-analysis, we did our best to strictly follow all the rules of the PRISMA protocol to generate an appropriate study design to avoid heterogeneity, bias, and subjectivity. We are aware that this is not completely possible, but we hope that with this study, we have contributed to a better understanding of the relationship between Hg and ASD.
To address these limitations and further advance our understanding of the potential link between Hg and ASD, future investigations should consider the following:
Comprehensive Hg Analysis: Future studies should focus on detailed Hg analysis, including speciation and quantification (MeHg, EtHg, etc.), across a substantial number of participants diagnosed with ASD. These studies should ensure that participants are rigorously matched by factors such as gender, age, residence, diet, socio-economic status, and other uniform characteristics with neurotypical children.
Non-Invasive Clinical Matrices: To overcome the challenges of collecting brain tissue, researchers should emphasize non-invasive clinical matrices, such as hair, urine, and deciduous teeth, or less invasive clinical matrices (whole blood).
5. Conclusions
The present study provides valuable insights into Hg exposure and its potential link to ASD. Patients with ASD had higher whole blood, RBCs, and plasma levels of Hg, while Hg levels in hair and urine were unchanged. The findings support the hypothesis about the role of Hg as an environmental factor in the etiology of ASD. In addition, the findings of this study suggest that ASD children could have impaired excretory mechanisms for removing Hg from their bodies. Our results suggest that we must consider alternative explanations, such as different environmental exposure and increased deposition of Hg in other body tissues, which could lead to decreased excretion. We stress the promising avenue of investigating Hg levels in offering timely insights into MeHg and other Hg species’ impact on ASD. Furthermore, we emphasize the urgency of international collaboration to curtail environmental Hg exposure, amenable to non-invasive collection, offering timely insights into MeHg and other Hg species’ impact on ASD, highlighting the vital role of human–environment interaction in shaping future generations’ health. Through ongoing research and exploration, we aspire to unveil the intricate connection, if any, between Hg exposure and ASD.
Finally, we strongly recommended future research studies to examine the level of Hg in other biological materials, such as nail and deciduous teeth enamel, amenable to non-invasive collection, offering timely insights into MeHg and other Hg species’ impact on ASD.
Additional research is needed to shed light on the reliable reduction of Hg levels in the bodies of children with ASD and, thereby, reduce or prevent harmful effects.
Author Contributions
A.S. designed the research, conducted the comprehensive review, participated in the statistical analysis, and drafted the initial and final versions of the paper; N.L. contributed important information regarding ASD and participated in the paper’s composition; S.P. was involved in the comprehensive review, conducted the complete meta-analysis, and contributed to the writing of the paper. All authors made critical contributions to the paper’s development and provided final approval for its publication. All authors have read and agreed to the published version of the manuscript.
Funding
This research was financially supported by the Ministry of Science, Technological Development, and Innovation of the Republic of Serbia, Contract Numbers 451-03-47/2023-01/200161 and 451-03-47/2023-01/200007.
Institutional Review Board Statement
Not applicable.
Informed Consent Statement
Not applicable.
Data Availability Statement
The authors declare that all data supporting the findings of this study are available from the corresponding author upon reasonable request.
Conflicts of Interest
The authors declare no conflict of interest.
References
- Veselinović, A.; Petrović, S.; Žikić, V.; Subotić, M.; Jakovljević, V.; Jeremić, N.; Vučić, V. Neuroinflammation in autism and supplementation based on omega-3 polyunsaturated fatty acids: A narrative review. Medicina 2021, 57, 893. [Google Scholar] [CrossRef]
- Awadh, S.M.; Yaseen, Z.M.; Al-Suwaiyan, M.S. The role of environmental trace element toxicants on autism: A medical biogeochemistry perspective. Ecotoxicol. Environ. Saf. 2023, 251, 114561. [Google Scholar] [CrossRef] [PubMed]
- WHO. World Health Organization. 2022. Available online: https://www.who.int/standards/classifications/classification-of-diseases (accessed on 18 May 2023).
- EAIS. European Autism Information System. 2023. Available online: https://ec.europa.eu/health (accessed on 16 August 2023).
- Basu, S.; Parry, P. The autism spectrum disorder ‘epidemic’: Need for biopsychosocial formulation. Aust. N. Z. J. Psychiatry 2013, 7, 1116–1118. [Google Scholar] [CrossRef] [PubMed]
- WHO. World Health Organization. 2023. Available online: https://www.who.int/news-room/factsheets/detail/autismspectrumdisorders#:~:text=About%201%20in%20100%20children,and%20can%20evolve%20over%20time (accessed on 30 June 2023).
- CDC. Centers for Disease Control and Prevention. 2023. Available online: https://www.cdc.gov/ncbddd/autism/data.html (accessed on 7 September 2023).
- Arora, M.; Reichenberg, A.; Willfors, C.; Austin, C.; Gennings, C.; Berggren, S.; Lichtenstein, P.; Anckarsäter, H.; Tammimies, K.; Bölte, S. Fetal and postnatal metal dysregulation in autism. Nat. Commun. 2017, 8, 15493. [Google Scholar] [CrossRef] [PubMed]
- Behl, S.; Mehtam, S.; Pandey, M.K. Abnormal levels of metal micronutrients and autism spectrum disorder: A perspective review. Front. Mol. Neurosci. 2020, 13, 586209. [Google Scholar] [CrossRef] [PubMed]
- Maenner, M.J.; Warren, Z.; Williams, A.R.; Amoakohene, E.; Bakian, A.V.; Bilder, D.A.; Durkin, M.S.; Fitzgerald, R.T.; Furnier, S.M.; Hughes, M.M.; et al. Prevalence and characteristics of autism spectrum disorder among children aged 8 years—Autism and developmental disabilities monitoring network, 11 sites, United States. MMWR Surveill. Summ. 2020, 72, 1–14. [Google Scholar] [CrossRef] [PubMed]
- Lord, C.; Brugha, T.S.; Charman, T.; Cusack, J.; Dumas, G.; Frazier, T.; Jones, E.J.H.; Jones, R.M.; Pickles, A.; State, M.W.; et al. Autism spectrum disorder. Nat. Rev. Dis. Primers 2020, 6, 5. [Google Scholar] [CrossRef] [PubMed]
- Hirota, T.; King, B.H. Autism spectrum disorder: A review. JAMA 2023, 329, 157–168. [Google Scholar] [CrossRef]
- LeClerc, S.; Easley, D. Pharmacological therapies for autism spectrum disorder: A review. PT 2015, 40, 389–397. [Google Scholar]
- DeFilippis, M.; Wagnerm, K.D. Treatment of autism spectrum disorder in children and adolescents. Psychopharmacol. Bull. 2016, 46, 18–41. [Google Scholar]
- Siafis, S.; Çıray, O.; Wu, H.; Schneider-Thoma, J.; Bighelli, I.; Krause, M.; Rodolico, A.; Ceraso, A.; Deste, G.; Huhn, M.; et al. Pharmacological and dietary-supplement treatments for autism spectrum disorder: A systematic review and network meta-analysis. Mol. Autism 2022, 13, 10. [Google Scholar] [CrossRef] [PubMed]
- Dong, H.Y.; Feng, J.Y.; Li, H.H.; Yue, X.J.; Jia, F.Y. Non-parental caregivers, low maternal education, gastrointestinal problems and high blood lead level: Predictors related to the severity of autism spectrum disorder in Northeast China. BMC Pediatr. 2022, 22, 11. [Google Scholar] [CrossRef] [PubMed]
- Sauer, A.K.; Stanton, J.E.; Hans, S.; Grabrucker, A.M. Autism spectrum disorders: Etiology and pathology. In Autism Spectrum Disorders [Internet]; Grabrucker, A.M., Ed.; Exon Publications: Brisbane, Australia, 2021; Chapter 1. [Google Scholar]
- Dickerson, A.S.; Rotem, R.S.; Christian, M.A.; Nguyen, V.T.; Specht, A.J. Potential sex differences relative to autism spectrum disorder and metals. Curr. Environ. Health Rep. 2017, 4, 405–414. [Google Scholar] [CrossRef] [PubMed]
- Marquès, M.; Correig, E.; Capdevila, E.; Gargallo, E.; González, N.; Nadal, M.; Domingo, J.L. Essential and Non-essential Trace Elements in Milks and Plant-Based Drinks. Biol. Trace Elem. Res. 2022, 200, 4524–4533. [Google Scholar] [CrossRef] [PubMed]
- Jagodić, J.; Pavlović, S.; Borković-Mitić, S.; Perović, M.; Miković, Ž.; Đurđić, S.; Manojlović, D.; Stojsavljević, A. Examination of trace metals and their potential transplacental transfer in pregnancy. Int. J. Mol. Sci. 2022, 23, 8078. [Google Scholar] [CrossRef] [PubMed]
- Kaur, I.; Behl, T.; Aleya, L.; Rahman, M.H.; Kumar, A.; Arora, S.; Akter, R. Role of metallic pollutants in neurodegeneration: Effects of aluminum, lead, mercury, and arsenic in mediating brain impairment events and autism spectrum disorder. Environ. Sci. Pollut. Res. Int. 2021, 28, 8989–9001. [Google Scholar] [CrossRef] [PubMed]
- Skogheim, T.S.; Weyde, K.V.F.; Engel, S.M.; Aase, H.; Surén, P.; Øie, M.G.; Biele, G.; Reichborn-Kjennerud, T.; Caspersen, I.H.; Hornig, M.; et al. Metal and essential element concentrations during pregnancy and associations with autism spectrum disorder and attention-deficit/hyperactivity disorder in children. Environ. Int. 2021, 152, 106468. [Google Scholar] [CrossRef]
- McCaulley, M.E. Autism spectrum disorder and mercury toxicity: Use of genomic and epigenetic methods to solve the etiologic puzzle. Acta Neurobiol. Exp. 2019, 79, 113–125. [Google Scholar] [CrossRef]
- Grabrucker, A.M. Environmental factors in autism. Front. Psychiatry 2013, 3, 118. [Google Scholar] [CrossRef]
- Santos-Sacramento, L.; Arrifano, G.P.; Lopes-Araújo, A.; Augusto-Oliveira, M.; Albuquerque-Santos, R.; Takeda, P.Y.; Souza-Monteiro, J.R.; Macchi, M.; do Nascimento, J.L.M.; Lima, R.R.; et al. Human neurotoxicity of mercury in the Amazon: A scoping review with insights and critical considerations. Ecotoxicol. Environ. Saf. 2021, 208, 111686. [Google Scholar] [CrossRef]
- Rice, K.M.; Walker, E.M., Jr.; Wu, M.; Gillette, C.; Blough, E.R. Environmental mercury and its toxic effects. J. Prev. Med. Public Health 2014, 47, 74–83. [Google Scholar] [CrossRef]
- Bjørklund, G.; Skalny, A.V.; Rahman, M.M.; Dadar, M.; Yassa, H.A.; Aaseth, J.; Chirumbolo, S.; Skalnaya, M.G.; Tinkov, A.A. Toxic metal(loid)-based pollutants and their possible role in autism spectrum disorder. Environ. Res. 2018, 166, 234–250. [Google Scholar] [CrossRef]
- Bernhoft, R.A. Mercury toxicity and treatment: A review of the literature. J. Environ. Public Health 2012, 2012, 460508. [Google Scholar] [CrossRef] [PubMed]
- Magos, L.; Clarkson, T.W. Overview of the clinical toxicity of mercury. Ann. Clin. Biochem. 2006, 43, 257–268. [Google Scholar] [CrossRef]
- Sweet, L.I.; Zelikoff, J.T. Toxicology And Immunotoxicology Of Mercury: A Comparative Review In Fish And Humans. J. Toxicol. Environ. Health B 2001, 4, 161–205. [Google Scholar] [CrossRef]
- Burtis, C.A.; Ashwood, E.R.; Bruns, D.E.; Tietz, N.W. Textbook of Clinical Chemistry and Molecular Diagnostics, 5th ed.; Elsevier: Amsterdam, The Netherlands, 2012. [Google Scholar]
- Ijomone, O.M.; Olung, N.F.; Akingbade, G.T.; Okoh, C.O.A.; Aschner, M. Environmental influence on neurodevelopmental disorders: Potential association of heavy metal exposure and autism. J. Trace Elem. Med. Biol. 2020, 62, 126638. [Google Scholar] [CrossRef]
- Hsueh, Y.-M.; Lee, C.-Y.; Chien, S.-N.; Chen, W.-J.; Shiue, H.-S.; Huang, S.-R.; Lin, M.-I.; Mu, S.-C.; Hsieh, R.-L. Association of blood heavy metals with developmental delays and health status in children. Sci. Rep. 2017, 7, 43608. [Google Scholar] [CrossRef]
- Osman, M.A.; Yang, F.; Massey, I.V.Y. Exposure routes and health effects of heavy metals on children. BioMetals 2019, 32, 563–573. [Google Scholar] [CrossRef]
- Jafari, T.; Rostampour, N.; Fallah, A.A.; Hesami, A. The association between mercury levels and autism spectrum disorders: A systematic review and metaanalysis. J. Trace Elem. Med. Biol. 2017, 44, 289–297. [Google Scholar] [CrossRef]
- Amadi, C.N.; Orish, C.N.; Frazzoli, C.; Orisakwe, O.E. Association of autism with toxic metals: A systematic review of case-control studies. Pharmacol. Biochem. Behav. 2022, 212, 173313. [Google Scholar] [CrossRef]
- El-Ansary, A.; Bjørklund, G.; Tinkov, A.A.; Skalny, A.V.; Al Dera, H. Relationship between selenium, lead, and mercury in red blood cells of Saudi autistic children. Metab. Brain Dis. 2017, 32, 1073–1080. [Google Scholar] [CrossRef]
- Błażewicz, A.; Grabrucker, A.M. Metal profiles in autism spectrum disorders: A crosstalk between toxic and essential metals. Int. J. Mol. Sci. 2022, 24, 308. [Google Scholar] [CrossRef] [PubMed]
- Shandley, K.; Austin, D.W. Ancestry of pink disease (infantile acrodynia) identified as a risk factor for autism spectrum disorders. J. Toxicol. Environ. Health A 2011, 74, 1185–1194. [Google Scholar] [CrossRef]
- Lai, O.; Parsi, K.K.; Wu, D.; Konia, T.H.; Younts, A.; Sinha, N.; McNelis, A.; Sharon, V.R. Mercury toxicity presenting as acrodynia and a papulovesicular eruption in a 5-year-old girl. Dermatol. Online J. 2016, 22, 13030/qt6444r7nc. [Google Scholar] [CrossRef]
- Adams, J.B.; Romdalvik, J.; Ramanujam, V.M.; Legator, M.S. Mercury, lead, and zinc in baby teeth of children with autism versus controls. J. Toxicol. Environ. Health A 2007, 70, 1046–1051. [Google Scholar] [CrossRef]
- Dadar, M.; Peyghan, R.; Memari, H.R. Evaluation of the bioaccumulation of heavy metals in white shrimp (Litopenaeus vannamei) along the Persian Gulf coast. Bull. Environ. Contam. Toxicol. 2014, 93, 339–343. [Google Scholar] [CrossRef] [PubMed]
- Jinadasa, B.K.K.K.; Jayasinghe, G.D.T.M.; Pohl, P.; Fowler, S.W. Mitigating the impact of mercury contaminants in fish and other seafood-A review. Mar. Pollut. Bull. 2021, 171, 112710. [Google Scholar] [CrossRef]
- FDA. The Food and Drug Administration. 2023. Available online: https://www.fda.gov/food/consumers/advice-about-eating-fish (accessed on 5 October 2023).
- Windham, G.C.; Zhang, L.; Gunier, R.; Croen, L.A.; Grether, J.K. Autism spectrum disorders in relation to distribution of hazardous air pollutants in the San Francisco bay area. Environ. Health Perspect. 2006, 114, 1438–1444. [Google Scholar] [CrossRef]
- Palmer, R.F.; Blanchard, S.; Wood, R. Proximity to point sources of environmental mercury release as a predictor of autism prevalence. Health Place 2009, 15, 18–24. [Google Scholar] [CrossRef]
- Gorini, F.; Muratori, F.; Morales, M.A. The role of heavy metal pollution in neurobehavioral disorders: A focus on autism. Rev. J. Autism Dev. Disord. 2014, 1, 354–372. [Google Scholar] [CrossRef]
- Baj, J.; Flieger, W.; Flieger, M.; Forma, A.; Sitarz, E.; Skórzyńska-Dziduszko, K.; Grochowski, C.; Maciejewski, R.; Karakuła-Juchnowicz, H. Autism spectrum disorder: Trace elements imbalances and the pathogenesis and severity of autistic symptoms. Neurosci. Biobehav. Rev. 2021, 129, 117–132. [Google Scholar] [CrossRef]
- Ye, B.S.; Leung, A.O.W.; Wong, M.H. The association of environmental toxicants and autism spectrum disorders in children. Environ. Pollut. 2017, 227, 234–242. [Google Scholar] [CrossRef]
- Kern, J.K.; Geier, D.A.; Sykes, L.K.; Haley, B.E.; Geier, M.R. The relationship between mercury and autism: A comprehensive review and discussion. J. Trace Elem. Med. Biol. 2016, 37, 8–24. [Google Scholar] [CrossRef] [PubMed]
- Geier, D.A.; King, P.G.-; Sykes, L.K.; Geier, M.R. A comprehensive review of mercury provoked autism. Indian J. Med. Res. 2008, 128, 383–411. [Google Scholar]
- Battaglia, M.R.; Di Fazio, C.; Battaglia, S. Activated Tryptophan-Kynureninemetabolic system in the human brain is associated with learned fear. Frontiers Mol. Neurisci. 2023, 16, 1217090. [Google Scholar] [CrossRef]
- Geier, D.A.; Kern, J.K.; King, P.G.; Sykes, L.K.; Geier, M.R. Hair toxic metal concentrations and autism spectrum disorder severity in young children. Int. J. Environ. Res. Public Health 2012, 9, 4486–4497. [Google Scholar] [CrossRef] [PubMed]
- Moher, D.; Liberati, A.; Tetzlaff, J.; Altman, D.G. PRISMA Group. Preferred reporting items for systematic reviews and meta-analyses: The PRISMA statement. PLoS Med. 2009, 21, e1000097. [Google Scholar] [CrossRef]
- Page, M.J.; McKenzie, J.E.; Bossuyt, P.M.; Boutron, I.; Hoffmann, T.C.; Mulrow, C.D.; Shamseer, L.; Tetzlaff, J.M.; Akl, E.A.; Brennan, S.E.; et al. The PRISMA 2020 statement: An updated guideline for reporting systematic reviews. BMJ 2021, 372, n71. [Google Scholar] [CrossRef] [PubMed]
- Zar, J.H. Biostatistical Analysis, 4th ed.; Prentice Hall International Inc.: New Jersey, NJ, USA, 1999. [Google Scholar]
- Wells, G.; Shea, B.; O’Connell, D.; Peterson, J.; Welch, V.; Losos, M.; Tugwell, P. The Newcastle–Ottawa Scale (NOS) for Assessing the Quality of Nonrandomized Studies in Meta-Analyses; Ottawa Hospital Research Institute: Ottawa, ON, Canada, 2009. [Google Scholar]
- Nakhaee, S.; Amirabadizadeh, A.; Farnia, V.; Ali Azadi, N.; Mansouri, B.; Radmehr, F. Association between biological lead concentrations and autism spectrum disorder (ASD) in children: A systematic review and meta-analysis. Biol. Trace Elem. Res. 2023, 201, 1567–1581. [Google Scholar] [CrossRef]
- Higgins, J.P.T.; Green, S. Cochrane Handbook for Systematic Reviews of Interventions. The Cochrane Collaboration Version 5.1.0. 2011. (Updated March 2011). The Cochrane Collaboration. Available online: www.cochrane-handbook.org (accessed on 13 September 2013).
- Mata, D.A.; Ramos, M.A.; Bansal, N.; Khan, R.; Guille, C.; Di Angelantonio, E.; Sen, S. Prevalence of depression and depressive symptoms among resident physicians: A systematic review and meta-analysis. JAMA 2015, 314, 2373–2383. [Google Scholar] [CrossRef]
- Peeters, W.; Van den Brande, R.; Polinder, S.; Brazinova, A.; Steyerberg, E.W.; Lingsma, H.F.; Maas, A.I. Epidemiology of traumatic brain injury in Europe. Acta Neurochir. 2015, 157, 1683–1696. [Google Scholar] [CrossRef]
- Qin, Y.Y.; Jian, B.; Wu, C.; Jiang, C.Z.; Kang, Y.; Zhou, J.X.; Yang, F.; Liang, Y. A comparison of blood metal levels in autism spectrum disorder and unaffected children in Shenzhen of China and factors involved in bioaccumulation of metals. Environ. Sci. Pollut. Res. Int. 2018, 25, 17950–17956. [Google Scholar] [CrossRef] [PubMed]
- Egger, M.; Smith, G.D.; Minder, C. Bias in meta-analysis detected by a simple, graphical test. BMJ 1997, 315, 629–634. [Google Scholar] [CrossRef] [PubMed]
- Begg, C.B.; Mazumdar, M. Operating characteristics of a rank correlation test for publication bias. Biometrics 1994, 50, 1088–1101. [Google Scholar] [CrossRef] [PubMed]
- Al-Ayadhi, L.Y. Heavy metals and trace elements in hair samples of autistic children in central Saudi Arabia. Neurosciences 2005, 10, 213–218. [Google Scholar] [PubMed]
- Aljumaili, O.I.; Ewais, E.E.D.A.; El-Waseif, A.A.; AbdulJabbar Suleiman, A. Determination of hair lead, iron, and cadmium in a sample of autistic Iraqi children: Environmental risk factors of heavy metals in autism. Mater. Today Proc. 2021, 80, 2712–2715. [Google Scholar] [CrossRef]
- Blaurock-Busch, E.; Amin, O.R.; Rabah, T. Heavy metals and trace elements in hair and urine of a sample of Arab children with autistic spectrum disorder. Maedica 2011, 6, 247–257. [Google Scholar]
- Mohamed Fel, B.; Zaky, E.A.; El-Sayed, A.B.; Elhossieny, R.M.; Zahra, S.S.; Salah Eldin, W.; Youssef, W.Y.; Khaled, R.A.; Youssef, A.M. Assessment of hair aluminum, lead, and mercury in a sample of autistic Egyptian children: Environmental risk factors of heavy metals in autism. Behav. Neurol. 2015, 2015, 545674. [Google Scholar] [CrossRef]
- Ouisselsat, M.; Maidoumi, S.; Elmaouaki, A.; Lekouch, N.; Pineau, A.; Sedki, A. Hair trace elements and mineral content in Moroccan children with autism spectrum disorder: A case-control study. Biol. Trace Elem. Res. 2023, 201, 2701–2710. [Google Scholar] [CrossRef]
- Skalny, A.V.; Simashkova, N.V.; Klyushnik, T.P.; Grabeklis, A.R.; Bjørklund, G.; Skalnaya, M.G.; Nikonorov, A.A.; Tinkov, A.A. Hair toxic and essential trace elements in children with autism spectrum disorder. Metab. Brain Dis. 2017, 32, 195–202. [Google Scholar] [CrossRef]
- Tinkov, A.A.; Skalnaya, M.G.; Simashkova, N.V.; Klyushnik, T.P.; Skalnaya, A.A.; Bjørklund, G.; Notova, S.V.; Kiyaeva, E.V.; Skalny, A.V. Association between catatonia and levels of hair and serum trace elements and minerals in autism spectrum disorder. Biomed. Pharmacother. 2019, 109, 174–180. [Google Scholar] [CrossRef] [PubMed]
- Zhai, Q.; Cen, S.; Jiang, J.; Zhao, J.; Zhang, H.; Chen, W. Disturbance of trace element and gut microbiota profiles as indicators of autism spectrum disorder: A pilot study of Chinese children. Environ. Res. 2019, 171, 501–509. [Google Scholar] [CrossRef]
- Adams, J.B.; Holloway, C.E.; George, F.; Quig, D. Analyses of toxic metals and essential minerals in the hair of Arizona children with autism and associated conditions, and their mothers. Biol. Trace Elem. Res. 2006, 110, 193–209. [Google Scholar] [CrossRef] [PubMed]
- De Palma, G.; Catalani, S.; Franco, A.; Brighenti, M.; Apostoli, P. Lack of correlation between metallic elements analyzed in hair by ICP-MS and autism. J. Autism. Dev. Disord. 2012, 42, 342–353. [Google Scholar] [CrossRef]
- El-Baz, F.; Elhossiny, R.M.; Elsayed, A.B.; Gaber, G.M. Hair mercury measurement in Egyptian autistic children. Egypt. J. Med. Hum. Gen. 2010, 11, 135–141. [Google Scholar] [CrossRef]
- Gil-Hernández, F.; Gómez-Fernández, A.R.; de la Torre-Aguilar, M.J.; Pérez-Navero, J.L.; Flores-Rojas, K.; Martín-Borreguero, P.; Gil-Campos, M. Neurotoxicity by mercury is not associated with autism spectrum disorders in Spanish children. Ital. J. Pediatr. 2020, 46, 19. [Google Scholar] [CrossRef] [PubMed]
- Ip, P.; Wong, V.; Ho, M.; Lee, J.; Wong, W. Mercury exposure in children with autistic spectrum disorder: Case-control study. J. Child Neurol. 2004, 19, 431–434, Erratum in: J. Child. Neurol. 2004, 22, 1324. [Google Scholar] [CrossRef]
- Nabgha-e-Amen Eqani, S.A.M.A.S.; Khuram, F.; Alamdar, A.; Tahir, A.; Shah, S.T.A.; Nasir, A.; Javed, S.; Bibi, N.; Hussain, A.; Rasheed, H.; et al. Environmental exposure pathway analysis of trace elements and autism risk in Pakistani children population. Sci. Total Environ. 2020, 712, 136471. [Google Scholar] [CrossRef]
- Wecker, L.; Miller, S.B.; Cochran, S.R.; Dugger, D.L.; Johnson, W.D. Trace element concentrations in hair from autistic children. J. Intellect. Disabil. Res. 1985, 29, 15–22. [Google Scholar] [CrossRef]
- Skalny, A.V.; Simashkova, N.V.; Klyushnik, T.P.; Grabeklis, A.R.; Radysh, I.V.; Skalnaya, M.G.; Tinkov, A.A. Analysis of hair trace elements in children with autism spectrum disorders and communication disorders. Biol. Trace Elem. Res. 2017, 107, 215–223. [Google Scholar] [CrossRef]
- Hodgson, N.W.; Waly, M.I.; Al-Farsi, Y.M.; Al-Sharbati, M.M.; Al-Farsi, O.; Ali, A.; Ouhtit, A.; Zang, T.; Zhou, Z.S.; Deth, R.C. Decreased glutathione and elevated hair mercury levels are associated with nutritional deficiency-based autism in Oman. Exp. Biol. Med. 2014, 239, 697–706. [Google Scholar] [CrossRef]
- Lakshmi Priya, M.D.; Geetha, A. Level of trace elements (copper, zinc, magnesium and selenium) and toxic elements (lead and mercury) in the hair and nail of children with autism. Biol. Trace Elem. Res. 2011, 142, 148–158. [Google Scholar] [CrossRef] [PubMed]
- Holmes, A.S.; Blaxill, M.F.; Haley, B.E. Reduced levels of mercury in first baby haircuts of autistic children. Int. J. Toxicol. 2003, 22, 277–285. [Google Scholar] [CrossRef] [PubMed]
- Fido, A.; Al-Saad, S. Toxic trace elements in the hair of children with autism. Autism 2005, 9, 290–298. [Google Scholar] [CrossRef] [PubMed]
- Albizzati, A.; Morè, L.; Di Candia, D.; Saccani, M.; Lenti, C. Normal concentrations of heavy metals in autistic spectrum disorders. Minerva Pediatr. 2012, 64, 27–31. [Google Scholar] [PubMed]
- Kern, J.K.; Grannemann, B.D.; Trivedi, M.H.; Adams, J.B. Sulfhydryl-reactive metals in autism. J. Toxicol. Environ. Health A 2007, 70, 715–721. [Google Scholar] [CrossRef] [PubMed]
- Adams, J.B.; Romdalvik, J.; Levine, K.E.; Hu, L.W. Mercury in first-cut baby hair of children with autism versus typically-developing children. Toxicol. Environ. Chem. 2008, 90, 739–753. [Google Scholar] [CrossRef]
- Majewska, M.D.; Urbanowicz, E.; Rok-Bujko, P.; Namyslowska, I.; Mierzejewski, P. Age-dependent lower or higher levels of hair mercury in autistic children than in healthy controls. Acta Neurobiol. Exp. 2010, 70, 196–208. [Google Scholar]
- Elsheshtawy, E.; Tobar, S.; Sherra, K.; Atallah, S.; Elkasaby, R. Study of some biomarkers in hair of children with autism. MECP 2011, 18, 6–10. [Google Scholar] [CrossRef]
- Li, H.; Li, H.; Li, Y.; Liu, Y.; Zhao, Z. Blood mercury, arsenic, cadmium, and lead in children with autism spectrum disorder. Biol. Trace Elem. Res. 2018, 181, 31–37. [Google Scholar] [CrossRef]
- Adams, J.B.; Audhya, T.; McDonough-Means, S.; Rubin, R.A.; Quig, D.; Geis, E.; Gehn, E.; Loresto, M.; Mitchell, J.; Atwood, S.; et al. Toxicological status of children with autism vs. neurotypical children and the association with autism severity. Biol. Trace Elem. Res. 2013, 151, 171–180. [Google Scholar] [CrossRef] [PubMed]
- Macedoni-Lukšič, M.; Gosar, D.; Bjørklund, G.; Oražem, J.; Kodrič, J.; Lešnik-Musek, P.; Zupančič, M.; France-Štiglic, A.; Sešek-Briški, A.; Neubauer, D.; et al. Levels of metals in the blood and specific porphyrins in the urine in children with autism spectrum disorders. Biol. Trace Elem. Res. 2015, 163, 2–10. [Google Scholar] [CrossRef]
- Zhao, G.; Liu, S.J.; Gan, X.Y.; Li, J.R.; Wu, X.X.; Liu, S.Y.; Jin, Y.S.; Zhang, K.R.; Wu, H.M. Analysis of whole blood and urine trace elements in children with autism spectrum disorders and autistic behaviors. Biol. Trace Elem. Res. 2023, 201, 627–635. [Google Scholar] [CrossRef]
- Yassa, H.A. Autism: A form of lead and mercury toxicity. Environ. Toxicol. Pharmacol. 2014, 38, 1016–1024. [Google Scholar] [CrossRef]
- Stamova, B.; Green, P.G.; Tian, Y.; Hertz-Picciotto, I.; Pessah, I.N.; Hansen, R.; Yang, X.; Teng, J.; Gregg, J.P.; Ashwood, P.; et al. Correlations between gene expression and mercury levels in blood of boys with and without autism. Neurotox. Res. 2011, 19, 31–48. [Google Scholar] [CrossRef] [PubMed]
- Hertz-Picciotto, I.; Green, P.G.; Delwiche, L.; Hansen, R.; Walker, C.; Pessah, I.N. Blood mercury concentrations in CHARGE Study children with and without autism. Environ. Health Perspect. 2020, 118, 161–166. [Google Scholar] [CrossRef] [PubMed]
- Rahbar, M.H.; Samms-Vaughan, M.; Loveland, K.A.; Ardjomand-Hessabi, M.; Chen, Z.; Bressler, J.; Shakespeare-Pellington, S.; Grove, M.L.; Bloom, K.; Pearson DALalor, G.C.; et al. Seafood consumption and blood mercury concentrations in Jamaican children with and without autism spectrum disorders. Neurotox. Res. 2013, 23, 22–38. [Google Scholar] [CrossRef]
- Yau, V.M.; Green, P.G.; Alaimo, C.P.; Yoshida, C.K.; Lutsky, M.; Windham, G.C.; Delorenze, G.; Kharrazi, M.; Grether, J.K.; Croen, L.A. Prenatal and neonatal peripheral blood mercury levels and autism spectrum disorders. Environ. Res. 2014, 133, 294–303. [Google Scholar] [CrossRef]
- McKean, S.J.; Bartell, S.M.; Hansen, R.L.; Barfod, G.H.; Green, P.G.; Hertz-Picciotto, I. Prenatal mercury exposure, autism, and developmental delay, using pharmacokinetic combination of newborn blood concentrations and questionnaire data: A case control study. Environ. Health 2015, 14, 62. [Google Scholar] [CrossRef]
- Mostafa, G.A.; Al-Ayadhi, L.Y. The possible association between elevated levels of blood mercury and the increased frequency of serum anti-myelin basic protein autoantibodies in autistic children. J. Clin. Cell Immunol. 2015, 310, 6. [Google Scholar] [CrossRef]
- Mostafa, G.A.; Bjørklund, G.; Urbina, M.A.; Al-Ayadhi, L.Y. The levels of blood mercury and inflammatory-related neuropeptides in the serum are correlated in children with autism spectrum disorder. Metab. Brain Dis. 2016, 31, 593–599. [Google Scholar] [CrossRef]
- Mostafa, G.A.; Refai, T.M. Antineuronal antibodies in autistic children: Relation to blood mercury. Egypt J. Pediatr. Allergy Immunol. 2007, 5, 21–30. [Google Scholar]
- Chehbani, F.; Gallello, G.; Brahim, T.; Ouanes, S.; Douki, W.; Gaddour, N.; Cervera Sanz, M.L. The status of chemical elements in the blood plasma of children with autism spectrum disorder in Tunisia: A case-control study. Environ. Sci. Pollut. Res. Int. 2020, 27, 35738–35749. [Google Scholar] [CrossRef] [PubMed]
- Khaled, E.M.; Meguid, N.A.; Bjørklund, G.; Gouda, A.; Bahary, M.H.; Hashish, A.; Sallam, N.M.; Chirumbolo, S.; El-Bana, M.A. Altered urinary porphyrins and mercury exposure as biomarkers for autism severity in Egyptian children with autism spectrum disorder. Metab. Brain Dis. 2016, 31, 1419–1426. [Google Scholar] [CrossRef]
- Zhang, J.; Lin, J.; Zhao, X.; Yao, F.; Feng, C.; He, Z.; Cao, X.; Gao, Y.; Khan, N.U.; Chen, M.; et al. Trace element changes in the plasma of autism spectrum disorder children and the positive correlation between chromium and vanadium. Biol. Trace Elem. Res. 2022, 200, 4924–4935. [Google Scholar] [CrossRef] [PubMed]
- Vergani, L.; Cristina, L.; Paola, R.; Luisa, A.M.; Shyti, G.; Edvige, V.; Giuseppe, M.; Elena, G.; Laura, C.; Adriana, V. Metals, metallothioneins and oxidative stress in blood of autistic children. Res. Autism Spectr. Disord. 2011, 5, 286–293. [Google Scholar] [CrossRef]
- Alabdali, A.; Al-Ayadhi, L.; El-Ansary, A. A key role for an impaired detoxification mechanism in the etiology and severity of autism spectrum disorders. Behav. Brain Funct. 2014, 10, 14. [Google Scholar] [CrossRef] [PubMed]
- Geier, D.A.; Audhya, T.; Kern, J.K.; Geier, M.R. Blood mercury levels in autism spectrum disorder: Is there a threshold level? Acta Neurobiol. Exp. 2010, 70, 177–186. [Google Scholar]
- El-Ansary, A. Data of multiple regressions analysis between selected biomarkers related to glutamate excitotoxicity and oxidative stress in Saudi autistic patients. Data Brief. 2016, 7, 111–116. [Google Scholar] [CrossRef]
- Metwally, F.M.; Abdelraoof, E.R.; Rashad, H.; Hasheesh, A.; Elsedfy, Z.B.; Gebril, O.; Meguid, N.A. Toxic effect of some heavy metals in Egyptian autistic children. Int. J. Pharm. Clin. Res. 2015, 7, 206–211. [Google Scholar]
- Wright, B.; Pearce, H.; Allgar, V.; Miles, J.; Whitton, C.; Leon, I.; Jardine, J.; McCaffrey, N.; Smith, R.; Holbrook, I.; et al. A comparison of urinary mercury between children with autism spectrum disorders and control children. PLoS ONE 2012, 7, e29547. [Google Scholar] [CrossRef] [PubMed]
- Woods, J.S.; Armel, S.E.; Fulton, D.I.; Allen, J.; Wessels, K.; Simmonds, P.L.; Granpeesheh, D.; Mumper, E.; Bradstreet, J.J.; Echeverria, D.; et al. Urinary porphyrin excretion in neurotypical and autistic children. Environ. Health Perspect. 2010, 118, 1450–1457. [Google Scholar] [CrossRef]
- Bradstreet, J.; Geier, D.A.; Kartzinel, J.J.; Adams, J.B.; Geier, M.R. A case–control study of mercury burden in children with autistic spectrum disorders. J. Am. Phys. Surg. 2003, 8, 76–79. [Google Scholar]
- Abdullah, M.M.; Ly, A.R.; Goldberg, W.A.; Clarke-Stewart, K.A.; Dudgeon, J.V.; Mull, C.G.; Chan, T.J.; Kent, E.E.; Mason, A.Z.; Ericson, J.E. Heavy metal in children’s tooth enamel: Related to autism and disruptive behaviors? J. Autism Dev. Disord. 2012, 42, 929–936. [Google Scholar] [CrossRef] [PubMed]
- Ambeskovic, M.; Laplante, D.P.; Kenney, T.; Elgbeili, G.; Beaumier, P.; Azat, N.; Simcock, G.; Kildea, S.; King, S.; Metz, G.A.S. Elemental Analysis of hair provides biomarkers of maternal hardship linked to adverse behavioral outcomes in 4-year-old children: The QF2011 Queensland Flood Study. J. Trace Elem. Med. Biol. 2022, 73, 127036. [Google Scholar] [CrossRef]
- McDowell, M.A.; Dillon, C.F.; Osterloh, J.; Bolger, P.M.; Pellizzari, E.; Fernando, R.; Montes de Oca, R.; Schober, S.E.; Sinks, T.; Jones, R.L.; et al. Hair mercury levels in U.S. children and women of childbearing age: Reference range data from NHANES 1999–2000. Environ. Health Perspect. 2004, 112, 1165–1171. [Google Scholar] [CrossRef] [PubMed]
- Saghazadeh, A.; Rezaei, N. Systematic review and meta-analysis links autism and toxic metals and highlights the impact of country development status: Higher blood and erythrocyte levels for mercury and lead, and higher hair antimony, cadmium, lead, and mercury. Prog. Neuropsychopharmacol. Biol. Psychiatry B 2017, 79, 340–368. [Google Scholar] [CrossRef]
- Fiore, M.; Barone, R.; Copat, C.; Grasso, A.; Cristaldi, A.; Rizzo, R.; Ferrante, M. Metal and essential element levels in hair and association with autism severity. J. Trace Elem. Med. Biol. 2020, 57, 126409. [Google Scholar] [CrossRef]
- Bridle, T.G.; Kumarathasan, P.; Gailer, J. Toxic Metal Species and ‘Endogenous’ Metalloproteins at the Blood–Organ Interface: Analytical and Bioinorganic Aspects. Molecules 2021, 26, 3408. [Google Scholar] [CrossRef]
- Ryu, J.; Ha, E.H.; Kim, B.N.; Ha, M.; Kim, Y.; Park, H.; Hong, Y.C.; Kim, K.N. Associations of prenatal and early childhood mercury exposure with autistic behaviors at 5years of age: The Mothers and Children’s Environmental Health (MOCEH) study. Sci. Total Environ. 2017, 15, 251–257. [Google Scholar] [CrossRef]
- Babaknejad, N.; Sayehmiri, F.; Sayehmiri, K.; Mohamadkhani, A.; Bahrami, S. The relationship between zinc levels and autism: A systematic review and meta-analysis. Iran J. Child. Neurol. 2016, 10, 1–9. [Google Scholar]
- Chen, C.; Yu, H.; Zhao, J.; Li, B.; Qu, L.; Liu, S.; Zhang, P.; Chai, Z. The roles of serum selenium and selenoproteins on mercury toxicity in environmental and occupational exposure. Environ. Health Perspect. 2006, 114, 297–301. [Google Scholar] [CrossRef]
- Shiani, A.; Sharafi, K.; Omer, A.K.; Kiani, A.; Karamimatin, B.; Massahi, T.; Ebrahimzadeh, G. A systematic literature review on the association between exposures to toxic elements and an autism spectrum disorder. Sci. Total Environ. 2023, 857, 59246. [Google Scholar] [CrossRef]
- Stojsavljević, A.; Lakićević, N.; Pavlović, S. Does lead have a connection to autism? a systematic review and meta-analysis. Toxics 2023, 11, 753. [Google Scholar] [CrossRef]
- Soden, S.E.; Lowry, J.A.; Garrison, C.B.; Wasserman, G.S. 24-hour provoked urine excretion test for heavy metals in children with autism and typically developing controls, a pilot study. Clin. Toxicol. 2007, 45, 476–481. [Google Scholar] [CrossRef] [PubMed]
- Nataf, R.; Skorupka, C.; Amet, L.; Lam, A.; Springbett, A.; Lathe, R. Porphyrinuria in childhood autistic disorder: Implications for environmental toxicity. Toxicol. Appl. Pharmacol. 2006, 14, 99–108. [Google Scholar] [CrossRef] [PubMed]
- Geier, D.A.; Geier, M.R. A prospective assessment of porphyrins in autistic disorders: A potential marker for heavy metal exposure. Neurotox. Res. 2006, 10, 57–64. [Google Scholar] [CrossRef] [PubMed]
- Kern, J.K.; Geier, D.A.; Adams, J.B.; Geier, M.R. A biomarker of mercury body burden correlated with diagnostic domain specific clinical symptoms of autistic disorders. Biometals 2010, 23, 1043–1051. [Google Scholar] [CrossRef] [PubMed]
- Heyer, N.J.; Echeverria, D.; Woods, J.S. Disordered porphyrin metabolism: A potential biological marker for autism risk assessment. Autism Res. 2012, 5, 84–92. [Google Scholar] [CrossRef]
- Geier, D.A.; Kern, J.K.; Geier, M.R. A prospective blinded evaluation of urinary porphyrins verses the clinical severity of autism spectrum disorders. J. Toxicol. Environ. Health A 2009, 72, 1585–1591. [Google Scholar] [CrossRef] [PubMed]
- Shandley, K.; Austin, D.W.; Bhowmik, J.L. Are urinary porphyrins a valid diagnostic biomarker of autism spectrum disorder? Autism Res. 2014, 7, 535–542. [Google Scholar] [CrossRef] [PubMed]
Figure 1.
(A) Comprehensive network visualization of 1462 ASD-related keywords in scholarly literature; (B) focused network visualization of the 29 most commonly used ASD-related keywords in scholarly literature.
Figure 1.
(A) Comprehensive network visualization of 1462 ASD-related keywords in scholarly literature; (B) focused network visualization of the 29 most commonly used ASD-related keywords in scholarly literature.

Figure 2.
PRISMA flow diagram illustrating the literature search, study identification, inclusion, and exclusion Process. Abbreviation: n (number of studies).
Figure 2.
PRISMA flow diagram illustrating the literature search, study identification, inclusion, and exclusion Process. Abbreviation: n (number of studies).

Figure 3.
Forest plot for random-effects meta-analysis: variations in hair Hg levels between control children and cases. The size of each square corresponds to the study’s weight. The diamond symbol represents the overall pooled effect size for the studies included in the meta-analysis. Abbreviation: CI (Confidence Interval).

Figure 4.
Funnel plots for publication bias assessment in studies comparing hair Hg levels in controls and cases. The plot displays the effect size (Hedges’s g) of the studies against their precision (inverse of SE). Observed studies are represented by circles, while the diamond symbol illustrates the overall pooled effect size based on these observed studies. Egger’s regression test: t25 = 1.027; p = 0.157; Begg and Mazumdar rank correlation: Kendall’s τ = −0.120, p = 0.200.

Figure 5.
Forest plot for random-effects meta-analysis of differences in whole blood Hg levels between control children and cases. The size of each square corresponds to the study’s weight, with the diamond symbol representing the pooled total effect size for the studies included in the meta-analysis. Abbreviation: CI (Confidence Interval).

Figure 6.
Funnel plots for assessing publication bias in observed studies comparing Hg levels in whole blood between control and case groups. The plot displays the effect size (Hedges’s g) of individual studies against their precision (inverse of SE). Observed studies are represented by circles, with the diamond symbol indicating the pooled overall effect size based on these observed studies. Egger’s regression test: t15 = 1.621, p = 0.064; Begg and Mazumdar rank correlation: Kendall’s τ = −0.276, p =0.076.

Figure 7.
Forest plot for random-effects meta-analysis, depicting variations in plasma Hg levels between control children and cases. The size of each square corresponds to the study’s weight, and the diamond symbol represents the pooled total effect size based on the studies included in the meta-analysis. Abbreviation: CI (Confidence Interval).

Figure 8.
Funnel plots for evaluating publication bias in observed studies comparing Hg levels in the plasma of control and case Groups. The figure illustrates the effect size (Hedges’s g) of the studies against their precision (inverse of SE). Observed studies are represented by circles, and the diamond symbol represents the pooled overall effect size based on the observed studies. Egger’s regression test: t6 = 1.655, p = 0.087; Begg and Mazumdar rank correlation: Kendall’s τ = −0.467, p = 0.094.

Figure 9.
Forest plot for random-effects meta-analysis, depicting variations in Hg levels in red blood cells (RBCs) between control children and cases. Each square’s size corresponds to the study’s weight, and the diamond symbol represents the aggregated total effect size for the studies included in the meta-analysis. Abbreviation: CI (Confidence Interval).

Figure 10.
Funnel plots for assessing publication bias in observed studies comparing Hg levels in red blood cells (RBCs) of control and case groups. The figure illustrates the effect size (Hedges’s g) of the studies relative to their precision (inverse of SE). Circles represent individual observed studies, while the diamond symbol indicates the overall effect size derived from the observed studies. Egger’s regression test: t5 = 0.901, p = 0.217; Begg and Mazumdar rank correlation: Kendall’s τ = −0.200, p = 0.312.

Figure 11.
Forest plot for random-effects meta-analysis. Variations in urine Hg levels between control children and cases are presented. The size of each square corresponds to the study’s weight, while the diamond symbol represents the combined overall effect size for the studies included in the meta-analysis. Abbreviation: CI (Confidence Interval).

Figure 12.
Funnel plots for the evaluation of publication bias in the examined studies, comparing Hg levels in the urine of control and case groups. The figure displays the effect size (Hedges’s g) of the individual studies in relation to their precision (inverse of the standard error). Each circle represents an observed study, and the diamond symbol represents the combined overall effect size calculated based on the observed studies. Egger’s regression test: t9 = 0.246, p = 0.406; Begg and Mazumdar rank correlation: Kendall’s τ = 0.000, p = 0.500.


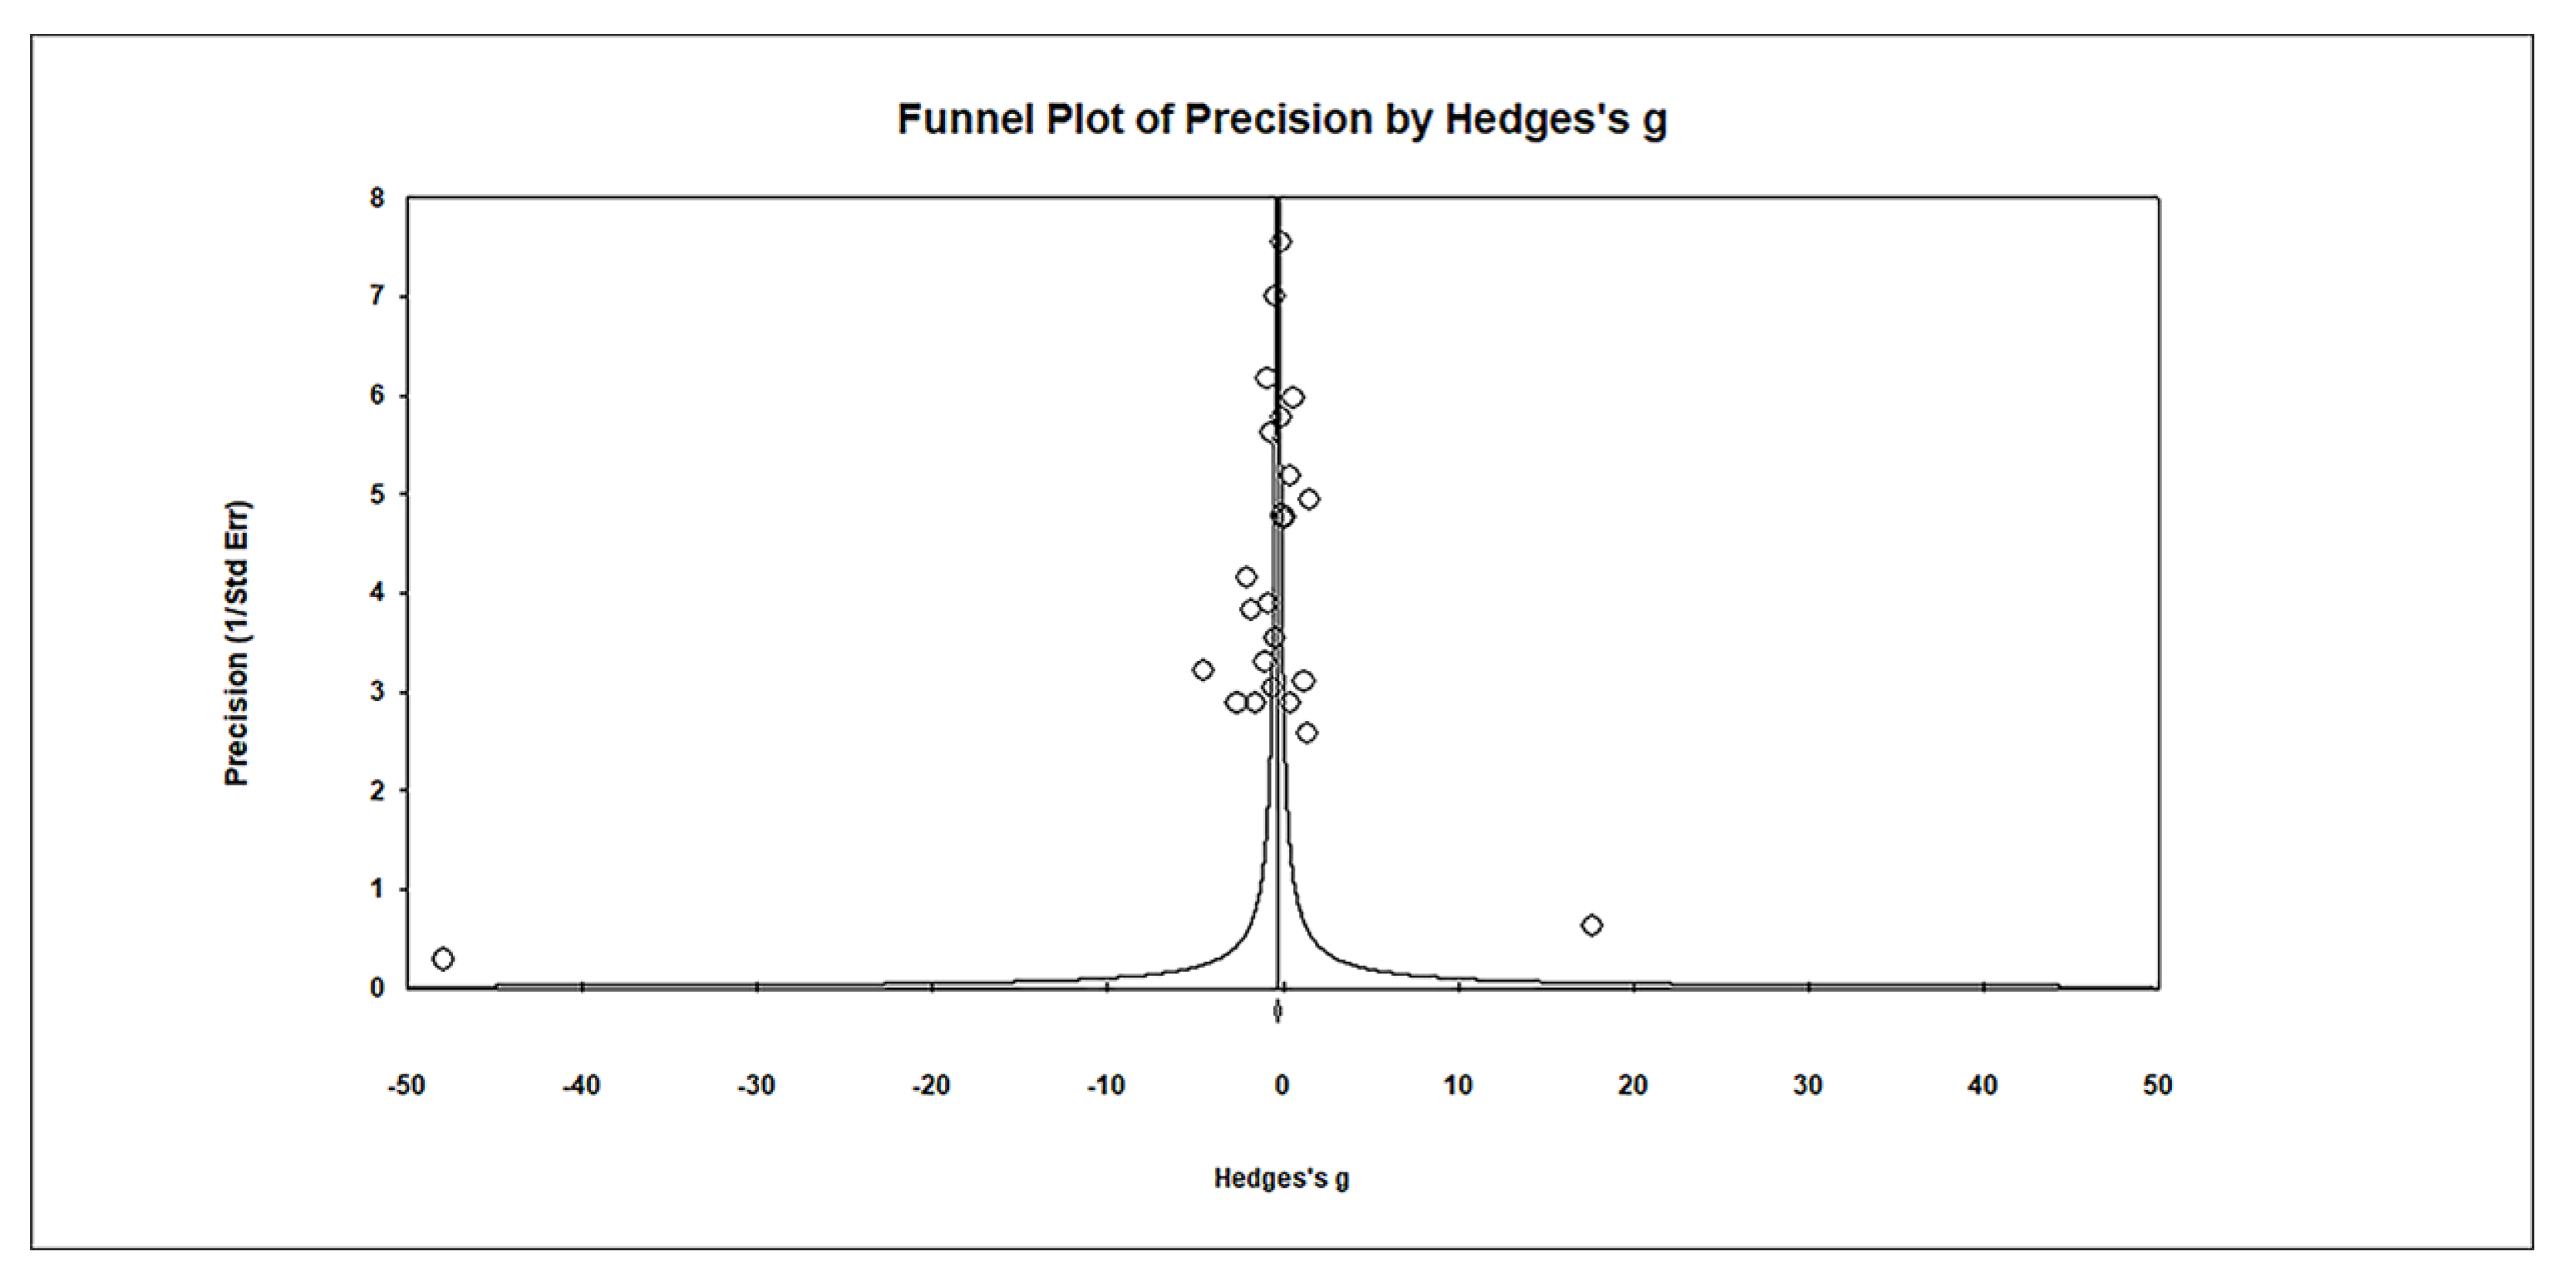
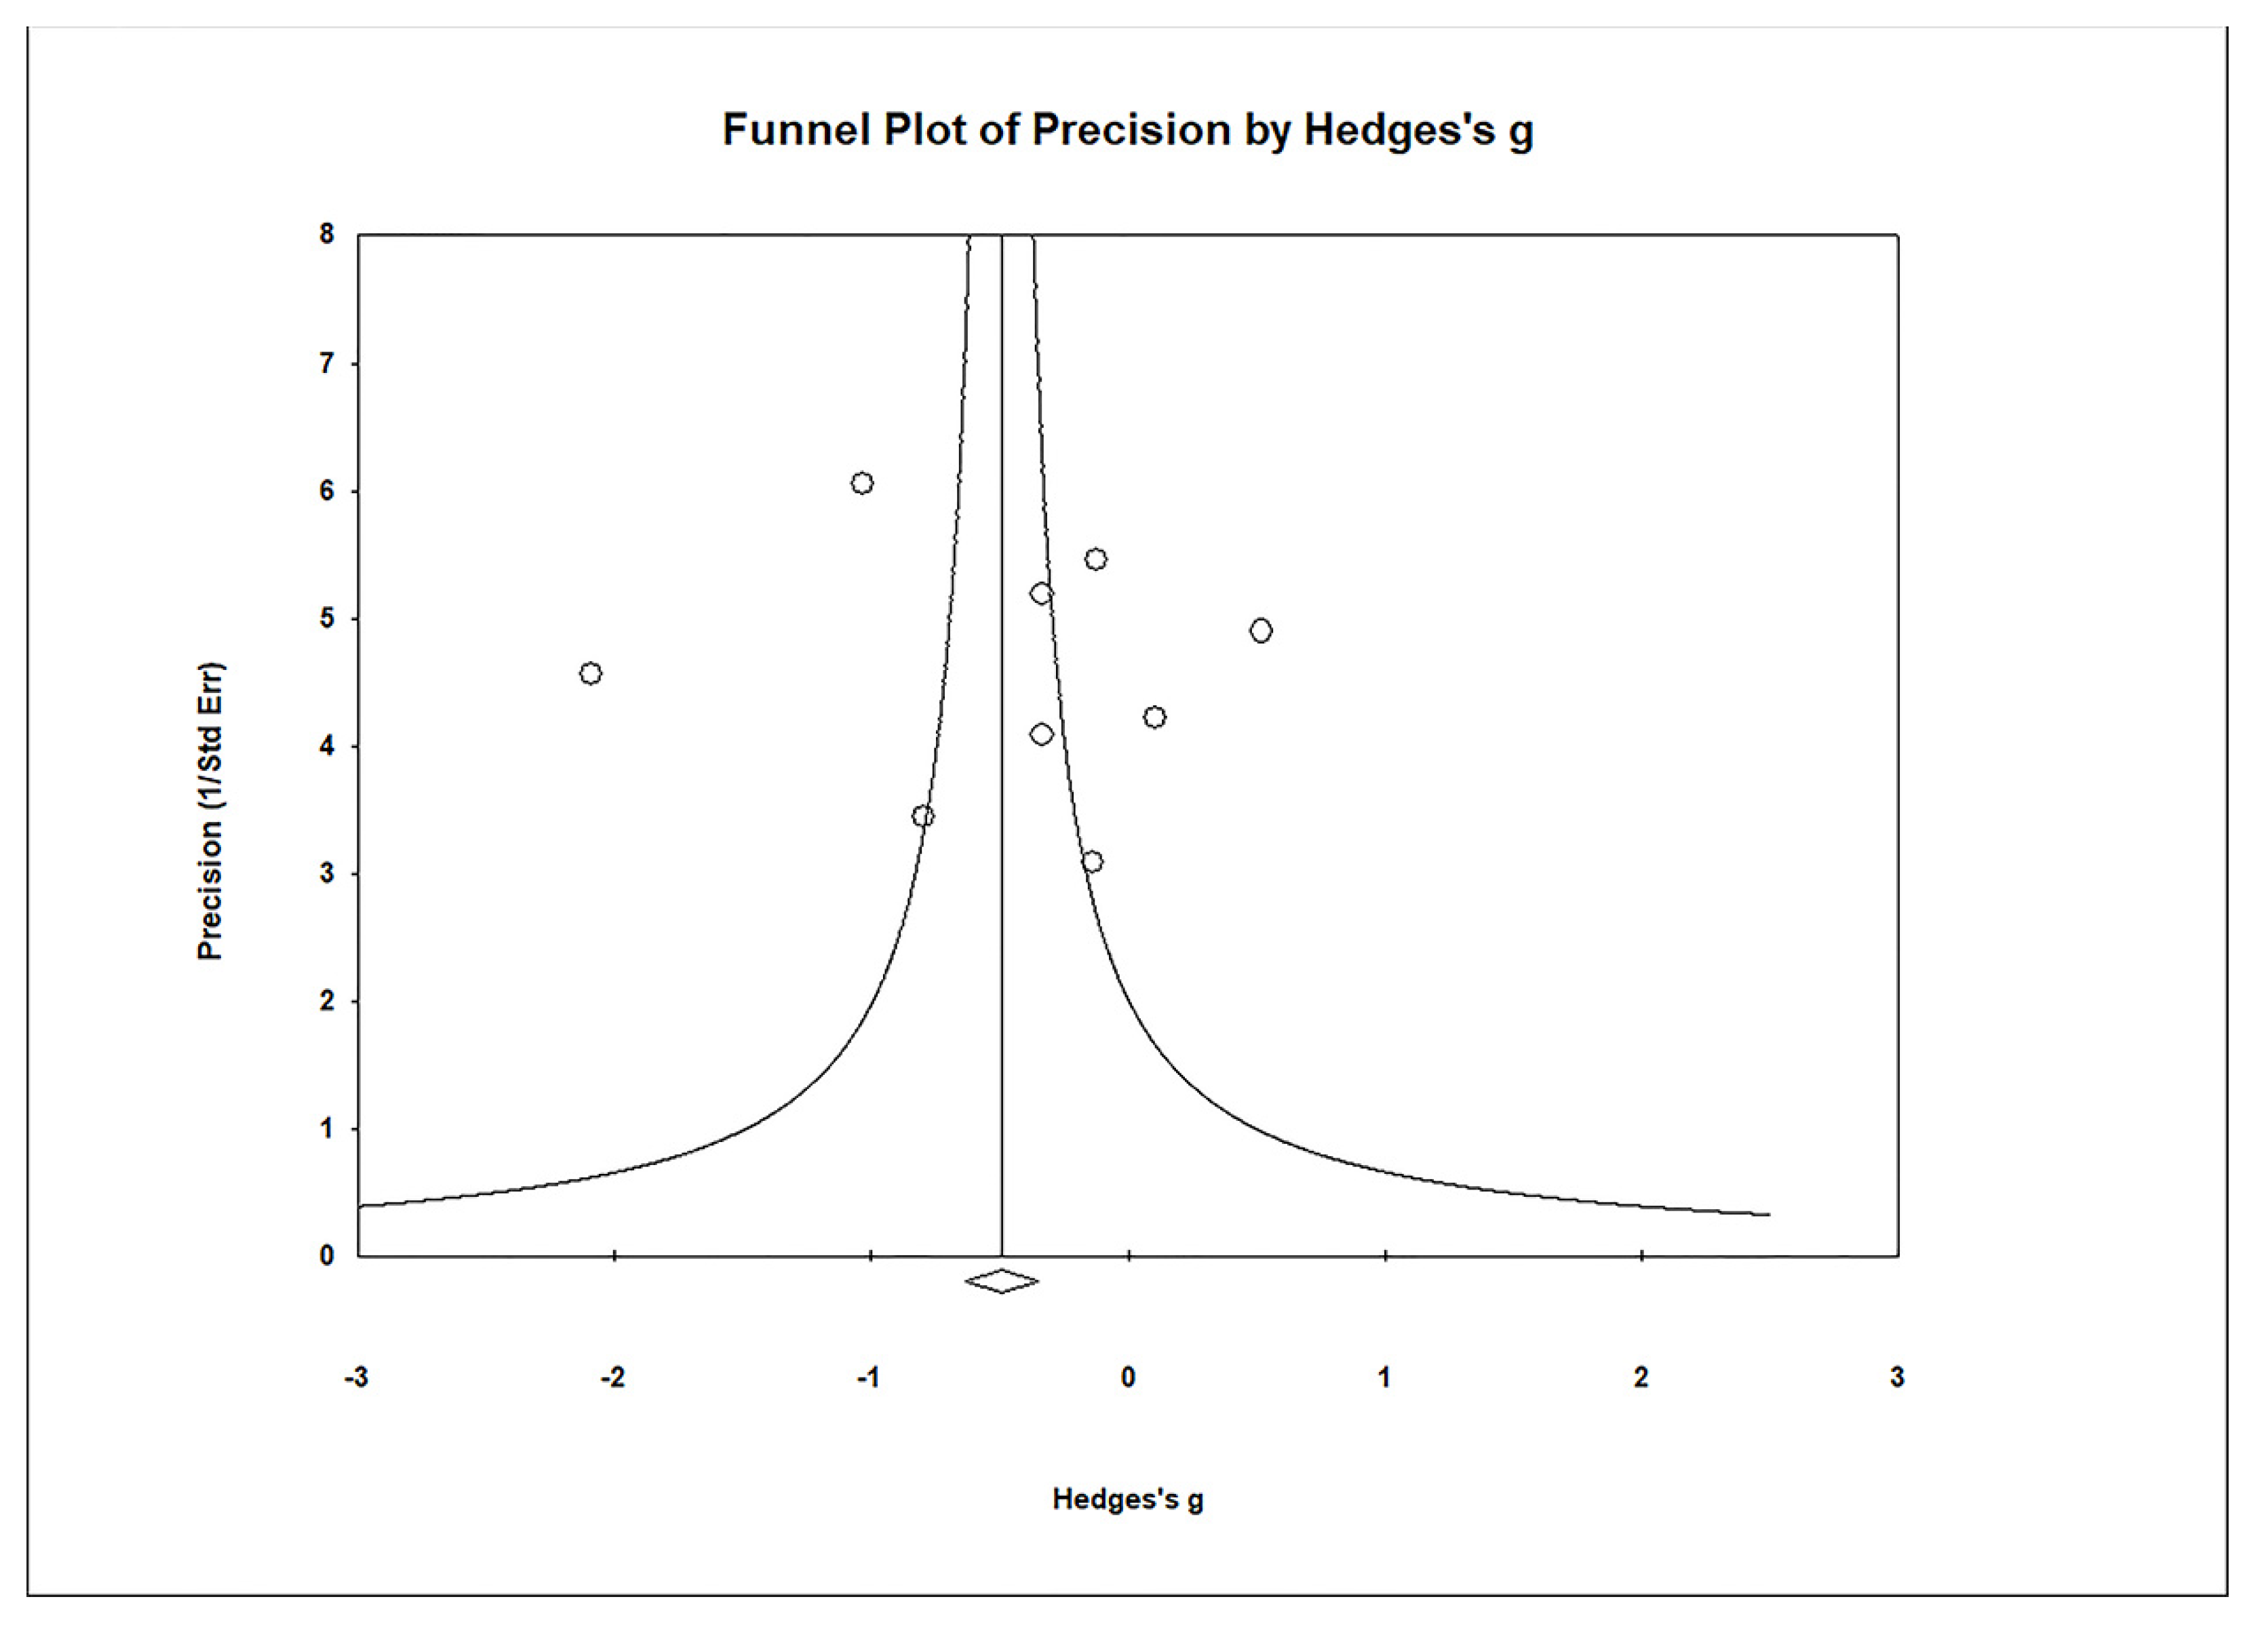
Table 1.
Overview of 60 studies (1985–2023) included in the comprehensive review and meta-analysis of Hg levels in controls and cases as follows: 25 studies (1985–2023) included in the systematic review and meta-analysis of Hg levels in hair (µg/g), 15 studies (2004–2023) included in the systematic review and meta-analysis of Hg levels in whole blood (µg/L), 6 studies (2011–2020) included in the systematic review and meta-analysis of Hg levels in plasma (µg/L), 5 studies (2010–2017) included in the comprehensive review and meta-analysis of Hg levels in red blood cells (RBCs) (µg/L), and 9 studies (2003–2020) included in the comprehensive review and meta-analysis of Hg levels in urine (µg/g creatine).
| Study | Country | Sample Size Controls/CaseS | Age Controls/Cases | Gender (Fem/Male) Controls/Cases | Biological Material | Analytical Technique | Mercury Level (Mean ± SD) Controls/Cases | |
|---|---|---|---|---|---|---|---|---|
| Hair | µg/g | |||||||
| 1. | Al-Ayadhi, 2005 [65] | Saudi Arabia | 80/65 | 7.2 ± 0.7/9.0 ± 0.3 | not specified; 4/61 | Hair | AAS | 0.713 ± 0.228/4.204 ± 1.129 |
| 2. | Aljumaili et al., 2021 [66] | Iraq | 20/75 | 3–14/3–14 | not specified | Hair | AAS | 1.25 ± 0.66/3.44 ± 2.93 |
| 3. | Blaurock-Bush et al., 2011 [67] | Saudi Arabia | 25/25 | 6.25 ± 2.31/5.29 ± 1.90 | 6/19; 3/22 | Hair | ICP-MS | 0.30 ± 0.31/0.47 ± 0.42 |
| 4. | Mohamed et al., 2015 [68] | Egypt | 100/100 | 6.80 ± 3.04/6.20 ± 2.40 | 26/74; 16/84 | Hair | AAS | 0.25 ± 0.16/0.39 ± 0.37 |
| 5. | Ouisselsat et al., 2023 [69] | Morrocco | 120/107 | 6.68 ± 2.39/7.14 ± 2.47 | 36/84; 25/82 | Hair | ICP-MS | 0.193 ± 0.13/0.200 ± 0.12 |
| 6. | Skalny et al., 2017 [70] | Russia | 74/74 | 5.11 ± 2.34/5.12 ± 2.36 | not specified | Hair | ICP-MS | 0.167 ± 0.077/0.127 ± 0.049 |
| 7. | Tinkov et al., 2019 [71] | Russia | 30/30 | 4.8 ± 2.2/4.7 ± 2.1 | not specified | Hair | ICP-MS | 0.077 ± 0.039/0.229 ± 0.072 |
| 8. | Zhai et al., 2019 [72] | China | 58/78 | 4.90 ± 0.97/4.96 ± 1.01 | 27/31; 22/56 | Hair | ICP-MS | 0.26 ± 0.13/0.41 ± 0.25 |
| 9. | Adams et al., 2006 [73] | USA | 40/51 | 7.5 ± 3.0/7.1 ± 3.0 | 10/30; 12/39 | Hair | ICP-MS | 0.29 ± 0.35/0.29 ± 0.41 |
| 10. | De Palma et al., 2012 [74] | Italy | 61/44 | 8.4 ± 1.3/9.0 ± 4.0 | 25/36; 7/37 | Hair | ICP-MS | 0.25 ± 0.11/0.50 ± 0.14 |
| 11. | El-Baz et al., 2010 [75] | Egypt | 15/32 | 5.53 ± 2.75/6.75 ± 3.26 | 6/9; 10/22 | Hair | AAS | 0.12 ± 0.019/0.79 ± 0.51 |
| 12. | Gil-Hernandez et al., 2020 [76] | Spain | 54/54 | Not specified | not specified | Hair | AAS | 13.00 ± 12.68/8.26 ± 10.57 |
| 13. | Ip et al., 2004 [77] | Japan | 55/82 | 7.8 ± 0.4/7.0 ± 0.2 | 9/46; 9/73 | Hair | AAS | 1.92 ± 1.58/1.98 ± 1.05 |
| 14. | Nabgha-e-Amen et al., 2020 [78] | Pakistan | 76/90 | 3–11/3–11 | 22/54; 20/70 | Hair | ICP-MS | 1.0 ± 0.26/1.3 ± 0.4 |
| 15. | Wecker et al., 1985 [79] | USA | 22/12 | 4.3 ± 2.6/5.67 ± 0.69 | 0/22; 0/12 | Hair | AAS | 15.75 ± 0.35/15.2 ± 0.45 |
| 16. | Skalny et al., 2017b [80] | Russia | 16/16 | 5–8/5–8 | 0/16; 0/16 | Hair | ICP-MS | 0.151 ± 0.134/0.105 ± 0.09 |
| 17. | Hodgson et al., 2014 [81] | Oman | 22/22 | 5.50 ± 1.00/3.5 ± 1.5 | 6/9; 7/15 | Hair | ICP-MS | 6.93 ± 0.36/6.03 ± 0.96 |
| 18. | Lakshmi and Geetha., 2011 [82] | India | 15/50 | 4–12/4–12 | not specified; 20/30 | Hair | ICP-MS | 0.37 ± 0.04/3.09 ± 0.37 |
| 19. | Holmes et al., 2003 [83] | USA | 45/94 | 0.7 ± 0.102/0.7 ± 0.325 | 11/34; 21/73 | Hair | ICP-MS | 3.63 ± 3.56/0.47 ± 0.28 |
| 20. | Fido and Al-Saad, 2005 [84] | Kuwait | 40/40 | 4.3 ± 2.67/4.2 ± 2.2 | 0/40; 0/40 | Hair | ICP-MS | 0.30 ± 0.24/4.50 ± 3.33 |
| 21. | Albizzati et al., 2012 [85] | Italy | 20/17 | 10.41 ± 3.05/11.52 ± 3.20 | 6/14; 2/15 | Hair | ICP-MS | 0.28 ± 0.08/0.32 ± 0.04 |
| 22. | Kern et al., 2007 [86] | USA | 45/45 | 3.0 ± 1.4/3.0 ± 1.4 | 10/35; 10/35 | Hair | ICP-MS | 0.16 ± 0.10/0.14 ± 0.11 |
| 23. | Adams et al., 2008 [87] | USA | 31/78 | 1.37 ± 0.42/1.38 ± 0.37 | 11/21; 11/67 | Hair | AFS | 0.95 ± 0.87/0.87 ± 2.6 |
| 24. | Majewska et al., 2010 [88] | Poland | 38/55 | 8.4 ± 0.20/8.1 ± 0.15 | 19/25; 19/30 | Hair | AAS | 0.14 ± 0.02/2.1 ± 0.05 |
| 25. | Elsheshtawy et al., 2011 [89] | Egypt | 32/32 | 4.0 ± 0.8/4.1 ± 0.8 | 8/24; 8/24 | Hair | ICP-MS | 3.2 ± 0.2/0.55 ± 0.06 |
| Whole Blood | µg/L | |||||||
| 1. | Adams et al., 2013 [90] | USA | 44/55 | 11.0 ± 3.1/10.0 ± 3.1 | 5/39; 6/49 | Blood | ICP-MS | 0.87 ± 0.76/0.75 ± 0.67 |
| 2. | Li et al., 2018 [91] | China | 184/180 | 6.12 ± 1.69/5.06 ± 1.37 | 38/146; 30/150 | Blood | AAS | 13.47 ± 17.24/55.59 ± 52.56 |
| 3. | Macedoni-Lukšić et al., 2015 [92] | Slovenia | 22/52 | 6.6. ± 3.7/6.2 ± 3.0 | 11/11; 6/46 | Blood | AAS | 1.55 ± 0.56/1.90 ± 0.97 |
| 4. | Zhao et al., 2023 [93] | China | 30/30 | 4.2 ± 1.5/3.8 ± 1.3 | 15/15; 9/21 | Blood | ICP-MS | 0.685 ± 0.196/0.796 ± 0.198 |
| 5. | Yassa, 2014 [94] | Egypt | 45/45 | 12.40 ± 2.04/11.30 ± 1.02 | 14/31; 13/32 | Blood | ICP-MS | 0.00 ± 0.00/4.02 ± 0.54 |
| 6. | Stamova et al., 2011 [95] | USA | 51/33 | 2.3–4.7/2.6–4.0 | 0/51; 0/33 | Blood | ICP-MS | 0.6 ± 0.82/0.46 ± 0.73 |
| 7. | Hertz-Picciotto et al., 2010 [96] | USA | 143/249 | 2–5/2–5 | 27/116; 28/221 | Blood | ICP-MS | 0.8 ± 1.3/0.49 ± 1.08 |
| 8. | Ip et al., 2004 [77] | Japan | 55/82 | 7.8 ± 0.4/7.0 ± 0.2 | 9/46; 9/73 | Blood | AAS | 19.53 ± 5.65/17.68 ± 2.48 |
| 9. | Rahbar et al., 2013 [97] | Jamaica | 65/65 | 2–8/2–8 | not specified | Blood | ICP-MS | 0.98 ± 0.79/0.83 ± 0.67 |
| 10. | Yau et al., 2014 [98] | USA, Mexico | 78/149 | 6.6 ± 3.7/6.2 ± 3.0 | 16/133; 10/68 | Blood | ICP-MS | 0.32 ± 0.01/0.48 ± 0.13 |
| 11. | McKean et al., 2015 [99] | USA | 58/164 | 2–8/2.8 | 22/36; 149/17 | Blood | ICP-MS | 4.29 ± 0.84/4.73 ± 0.85 |
| 12. | Albizzati et al., 2012 [85] | Italy | 20/17 | 10.41 ± 3.05/11.52 ± 3.20 | 6/14; 2/15 | Blood | ICP-MS | 0.57 ± 0.34/0.67 ± 0.31 |
| 13. | Mostafa and Al-Ayadhi, 2015 [100] | Saudi Arabia | 100/100 | 8.3 ± 1.6/8.1 ± 1.7 | 23/77; 22/78 | Blood | AAS | 0.43 ± 0.14/0.19 ± 0.62 |
| 14. | Mostafa et al., 2016 [101] | Saudi Arabia | 84/84 | 7.0 ± 1.8/6.8 ± 1.5 | 24/60; 22/62 | Blood | AAS | 0.50 ± 0.14/0.8 ± 0.34 |
| 15. | Mostafa and Refai., 2007 [102] | Egypt | 40/40 | 5.25 ± 1.80/5.38 ± 1.85 | 9/31; 9/31 | Blood | AAS | 3.9 ± 1.80/19.8 ± 13.9′ |
| Plasma | µg/L | |||||||
| 1. | Chehbani et al., 2020 [103] | Tunisia | 70/89 | 7.81 ± 3.32/7.52 ± 3.02 | 29/41; 15/74 | Plasma | AAS | 0.77 ± 0.53/0.86 ± 1.24 |
| 2. | Khaled et al., 2016 [104] | Egypt | 40/40 | 5.23 ± 1.25/4.12 ± 0.94 | 12/28; 8/32 | Plasma | AAS | 12.08 ± 4.5/32.9 ± 16.4 |
| 3. | Qin et al., 2018 [62] | China | 38/34 | 4.29 ± 1.73/4.10 ± 0.81 | 17/21; 14/20 | Plasma | ICP-OES | 1.13 ± 1.05/3.89 ± 0.82 |
| 4. | Zhang et al., 2022 [105] | China | 30/30 | 4.21 ± 0.93/4.03 ± 1.12 | 6/24; 6/24 | Plasma | ICP-MS | 0.96 ± 0.2/0.81 ± 0.22 |
| 5. | Vergani et al., 2011 [106] | Italy | 32/28 | Not specified/2–6 | 12/20; 7/21 | Plasma | ICP-OES | 0.00 ± 0.00/3.21 ± 1.72 |
| 6. | Macedoni-Lukšić et al., 2015 [92] | Slovenia | 14/42 | 6.6 ± 3.7/6.2 ± 3.0 | 7/7; 5/37 | Serum | AAS | 1.55 ± 0.56/1.90 ± 0.97 |
| RBCs | µg/L | |||||||
| 1. | El-Ansary et al., 2017 [37] | Saudi Arabia | 30/35 | 7.2 ± 2.14/7.0 ± 2.34 | Not specified | RBCs | AAS | 2.71 ± 0.57/3.66 ± 1.13 |
| 2. | Alabdali et al., 2014 [107] | Saudi Arabia | 32/100 | 7.2 ± 2.0/7.0 ± 2.34 | Not specified; 0/100 | RBCs | AAS | 5.12 ± 0.83/6.99 ± 0.94 |
| 3. | Geier et al., 2010 [108] | USA | 89/83 | 11.4 ± 2.2/7.3 ± 3.7 | 19/70; 5/58 | RBCs | Hg vaporimeter | 10.7 ± 4.3/22.2 ± 12.1 |
| 4. | Adams et al., 2013 [90] | USA | 44/55 | 11.0 ± 3.1/10.0 ± 3.1 | 5/39; 6/49 | RBCs | ICP-MS | 1.3 ± 1.2/1.2 ± 0.81 |
| 5. | El-Ansary., 2016 [109] | Saudi Arabia | 20/20 | 7.4/7.4 | Not specified | RBCs | AAS | 4.64 ± 0.68/6.93 ± 0.94 |
| Urine | µg/g creatinine | |||||||
| 1. | Adams et al., 2013 [90] | USA | 44/55 | 11.0 ± 3.1/10.0 ± 3.1 | 5/39; 6/49 | Urine | ICP-MS | 2.58 ± 1.10/1.01 ± 3.90 |
| 2. | Blaurock-Bush et al., 2011 [67] | Saudi Arabia | 25/25 | 6.25 ± 2.31/5.29 ± 1.90 | 6/19; 3/22 | Urine | ICP-MS | 1.10 ± 0.63/2.48 ± 2.34 |
| 3. | Metwally et al., 2015 [110] | Egypt | 75/55 | 4.02 ± 4.01 | 18/57; 16/39 | Urine | ICP-MS | 2.22 ± 0.35/11.3 ± 6.63 |
| 4. | Wright et al., 2012 [111] | UK | 28/47 | 12.6 ± 3.5/9.6 ± 3.6 | 15/13; 10/37 | Urine | ICP-MS | 5.4 ± 5.07/4.97 ± 3.04 |
| 5. | Woods et al., 2010 [112] | USA | 59/59 | 6.39 ± 3.06/6.01 ± 2.14 | 0/59; 0/59 | Urine | ICP-MS | 0.29 ± 0.53/0.36 ± 0.62 |
| 6. | Bradstreet et al., 2003 [113] | USA | 18/221 | 8.85/6.25 | 4/14; 38/183 | Urine | ICP-MS | 1.29 ± 1.54/4.06 ± 8.59 |
| 7. | Albizzati et al., 2012 [85] | Italy | 20/17 | 10.41 ± 3.05/11.52 ± 3.2 | 6/14; 2/15 | Urine | ICP-MS | 0.69 ± 0.07/0.70 ± 0.07 |
| 8. | Nabgha-e-Amen et al., 2020 [78] | Pakistan | 76/90 | 3–11/3–11 | 22/54; 20/70 | Urine | ICP-MS | 1.0 ± 0.31/1.3 ± 0.27 |
| 9. | Gil-Hernandez et al., 2020 [76] | Spain | 54/54 | Not specified | Not specified | Urine | AAS | 0.33 ± 0.42/0.54 ± 0.78 |
Abbreviations: ICP-MS (Inductively Coupled Plasma-Mass Spectrometry); ICP-OES (Inductively Coupled Plasma-Optical Emission Spectrometry); AAS (Atomic Absorption Spectrometry); AFS (Atomic Fluorescence Spectroscopy). Number of controls: 1134 (hair); 1019 (whole blood); 224 (plasma); 215 (RBCs); 399 (urine). Total number of controls: 2991. Number of cases: 1361 (hair); 1345 (whole blood); 263 (plasma); 293 (RBCs); 623 (urine). Total number of cases: 3892. Total number of participants enrolled in the meta-analysis: 6883.
Table 2.
Quality assessment of included studies in the meta-analysis: Hg levels in ASD cases (based on the Newcastle–Ottawa Scale).
Table 2.
Quality assessment of included studies in the meta-analysis: Hg levels in ASD cases (based on the Newcastle–Ottawa Scale).
| Study | Selection | Comparability | Outcome | Score | |||||
|---|---|---|---|---|---|---|---|---|---|
| Representativeness | Size | Non Respondents | Exposure Determination | Design/ Analysis | Determination of Outcome | Statist. Test | For Sample Type Average | ||
| Hair | |||||||||
| Al-Ayadhi, 2005 [65] | a | a | b | a | a | b | a | 5 | |
| Aljumaili et al., 2021 [66] | a | a | b | a | a | b | a | 5 | |
| Blaurock-Bush et al., 2011 [67] | a | a | a | a | a | b | a | 6 | |
| Mohamed et al., 2015 [68] | a | a | a | a | a | a | a | 7 | |
| Ouisselsat et al., 2023 [69] | a | a | a | a | a | a | a | 7 | |
| Skalny et al., 2017 [70] | a | a | b | a | a | a | a | 6 | |
| Tinkov et al., 2019 [71] | a | a | b | a | a | a | a | 6 | |
| Zhai et al., 2019 [72] | a | a | a | a | a | a | a | 7 | |
| Adams et al., 2006 [73] | a | a | a | a | a | a | a | 7 | |
| De Palma et al., 2012 [74] | a | a | a | a | a | a | a | 7 | |
| El-Baz et al., 2010 [75] | a | a | a | a | a | a | a | 7 | |
| Gil-Hernandez et al., 2020 [76] | a | a | c | a | a | b | a | 4 | |
| Ip et al., 2004 [77] | a | a | a | a | a | b | a | 6 | |
| Nabgha-e-Amen et al., 2020 [78] | a | a | a | a | a | b | a | 6 | |
| Wecker et al., 1985 [79] | a | a | a | a | a | b | a | 6 | |
| Skalny et al., 2017 [80] | a | a | c | a | a | a | a | 5 | |
| Hodgson et al., 2014 [81] | a | a | a | a | a | a | a | 7 | |
| Lakshmi and Geetha., 2011 [82] | a | a | c | a | a | a | a | 5 | |
| Holmes et al., 2003 [83] | a | a | a | a | a | a | a | 7 | |
| Fido and Al-Saad, 2005 [84] | a | a | b | a | a | a | a | 6 | |
| Albizzati et al., 2012 [85] | a | a | a | a | a | a | a | 7 | |
| Kern et al., 2007 [86] | a | a | a | a | a | a | a | 7 | |
| Adams et al., 2008 [87] | a | a | a | a | a | b | a | 6 | |
| Majewska et al., 2010 [88] | a | a | a | a | a | b | a | 6 | |
| Elsheshtawy et al., 2011 [89] | a | a | a | a | a | a | a | 7 | 6.20 |
| Whole blood | |||||||||
| Adams et al., 2013 [90] | a | a | a | a | a | a | a | 7 | |
| Li et al., 2018 [91] | a | a | a | a | a | b | a | 6 | |
| Macedoni-Lukšić et al., 2015 [92] | a | a | a | a | a | b | a | 6 | |
| Zhao et al., 2023 [93] | a | a | a | a | a | a | a | 7 | |
| Yassa, 2014 [94] | a | a | a | a | a | a | a | 7 | |
| Stamova et al., 2011 [95] | a | a | a | a | a | b | a | 6 | |
| Hertz-Picciotto et al., 2010 [96] | a | a | b | a | a | a | a | 6 | |
| Ip et al., 2004 [77] | a | a | a | a | a | a | a | 7 | |
| Rahbar et al., 2013 [97] | a | a | a | a | a | a | a | 7 | |
| Yau et al., 2014 [98] | a | a | b | a | a | a | a | 6 | |
| McKean et al., 2015 [99] | a | a | a | a | a | a | a | 7 | |
| Albizzati et al., 2012 [85] | a | a | a | a | a | a | a | 7 | |
| Mostafa and Al-Ayadhi, 2015 [100] | a | a | a | a | a | b | a | 6 | |
| Mostafa et al., 2016 [101] | a | a | a | a | a | b | a | 6 | |
| Mostafa and Refai., 2007 [102] | a | a | a | a | a | b | a | 6 | 6.47 |
| Plasma | |||||||||
| Chehbani et al., 2020 [103] | a | a | a | a | a | b | a | 6 | |
| Khaled et al., 2016 [104] | a | a | a | a | a | b | a | 6 | |
| Qin et al., 2018 [62] | a | a | a | a | a | b | a | 6 | |
| Zhang et al., 2022 [105] | a | a | a | a | a | a | a | 7 | |
| Vergani et al., 2011 [106] | a | a | b | a | a | a | a | 6 | |
| Macedoni-Lukšić et al., 2015 [92] | a | a | a | a | b | b | a | 5 | 6.00 |
| RBCs | |||||||||
| El-Ansary et al., 2017 [37] | a | a | b | a | a | b | a | 5 | |
| Alabdali et al., 2014 [107] | a | a | b | a | a | b | a | 5 | |
| Geier et al., 2010 [108] | a | a | a | a | a | a | a | 7 | |
| Adams et al., 2013 [90] | a | a | a | a | a | a | a | 7 | |
| El-Ansary., 2016 [109] | a | a | c | a | a | b | a | 4 | 5.60 |
| Urine | |||||||||
| Adams et al., 2013 [90] | a | a | a | a | a | a | a | 7 | |
| Blaurock-Bush et al., 2011 [67] | a | a | a | a | a | a | a | 7 | |
| Metwally et al., 2015 [110] | a | a | a | a | a | a | a | 7 | |
| Wright et al., 2012 [111] | a | a | a | a | a | a | a | 7 | |
| Woods et al., 2010 [112] | a | a | b | a | a | a | a | 6 | |
| Bradstreet et al., 2003 [113] | a | a | a | a | a | a | a | 7 | |
| Albizzati et al., 2012 [85] | a | a | a | a | a | a | a | 7 | |
| Nabgha-e-Amen et al., 2020 [78] | a | a | a | a | a | a | a | 7 | |
| Gil-Hernandez et al., 2020 [76] | a | a | c | a | a | b | a | 4 | 6.56 |
| 6.17 | |||||||||
Selection: (1) Sample representativeness: a, truly representative of the average of the target population; b, reasonably representative of the average of the target population; c, selected group of users. (2) Sample size: a, satisfactory; b, unsatisfactory. (3) Nonrespondents: a, the comparability between the characteristics of the respondents and the nonrespondents is given, and the response rate is satisfactory; b, the response rate is not satisfactory, or the comparability between the respondents and the nonrespondents is not satisfactory; c, no description of response rate or the characteristics of the respondents and the nonrespondents. (4) Exposure determination: a, validated measurement instrument; b, measurement instrument not validated, but the instrument is available or described; c, no description of the measurement instrument. Comparability: (1) Comparability of subjects based on design or analysis: a, the study controls for the main factor; b, the study controls for each additional factor. Outcome: (1) Determination of outcome: a, independent blind assessment; b, record linkage; c, self-report. (2) Statistical test: a, the statistical test used to analyze the data is clearly described and appropriate, and the measure of association is stated, including confidence intervals and probability level (p-value); b, the statistical test is inappropriate, not described, or incomplete. Calculation: a = 1; b = from the maximum 7, 1 is subtracted; c = from the maximum 7, 2 is subtracted. Quality assessment was modified based on criteria as described by [58].
Disclaimer/Publisher’s Note: The statements, opinions and data contained in all publications are solely those of the individual author(s) and contributor(s) and not of MDPI and/or the editor(s). MDPI and/or the editor(s) disclaim responsibility for any injury to people or property resulting from any ideas, methods, instructions or products referred to in the content. |
© 2023 by the authors. Licensee MDPI, Basel, Switzerland. This article is an open access article distributed under the terms and conditions of the Creative Commons Attribution (CC BY) license (https://creativecommons.org/licenses/by/4.0/).
Share and Cite
MDPI and ACS Style
Stojsavljević, A.; Lakićević, N.; Pavlović, S. Mercury and Autism Spectrum Disorder: Exploring the Link through Comprehensive Review and Meta-Analysis. Biomedicines 2023, 11, 3344. https://doi.org/10.3390/biomedicines11123344
AMA Style
Stojsavljević A, Lakićević N, Pavlović S. Mercury and Autism Spectrum Disorder: Exploring the Link through Comprehensive Review and Meta-Analysis. Biomedicines. 2023; 11(12):3344. https://doi.org/10.3390/biomedicines11123344
Chicago/Turabian StyleStojsavljević, Aleksandar, Novak Lakićević, and Slađan Pavlović. 2023. "Mercury and Autism Spectrum Disorder: Exploring the Link through Comprehensive Review and Meta-Analysis" Biomedicines 11, no. 12: 3344. https://doi.org/10.3390/biomedicines11123344
Note that from the first issue of 2016, this journal uses article numbers instead of page numbers. See further details here.