
Effect of Quercetin Nanoparticles on Hepatic and Intestinal Enzymes and Stress-Related Genes in Nile Tilapia Fish Exposed to Silver Nanoparticles
 ,
,  ,
,  , ,
, ,  and
and
Abstract
:1. Introduction
2. Materials and Methods
2.1. AgNPs and QNPs Preparation
2.2. Fish and Diet Formulations
2.3. Chemical Composition of the Whole Body
2.4. Blood and Tissue Sampling
2.5. Serum Physiological Assays
2.6. Oxidative Injury Assays and Antioxidant Status
2.7. Expression of Liver Apoptosis and Stress-Related Genes
2.8. Intestinal Enzyme Activities
2.9. Hormonal Assay
2.10. Determination of Aeromonas Counts and Total Intestinal Bacteria
2.11. Determination of Silver Residues
2.12. Statistical Analysis
3. Results
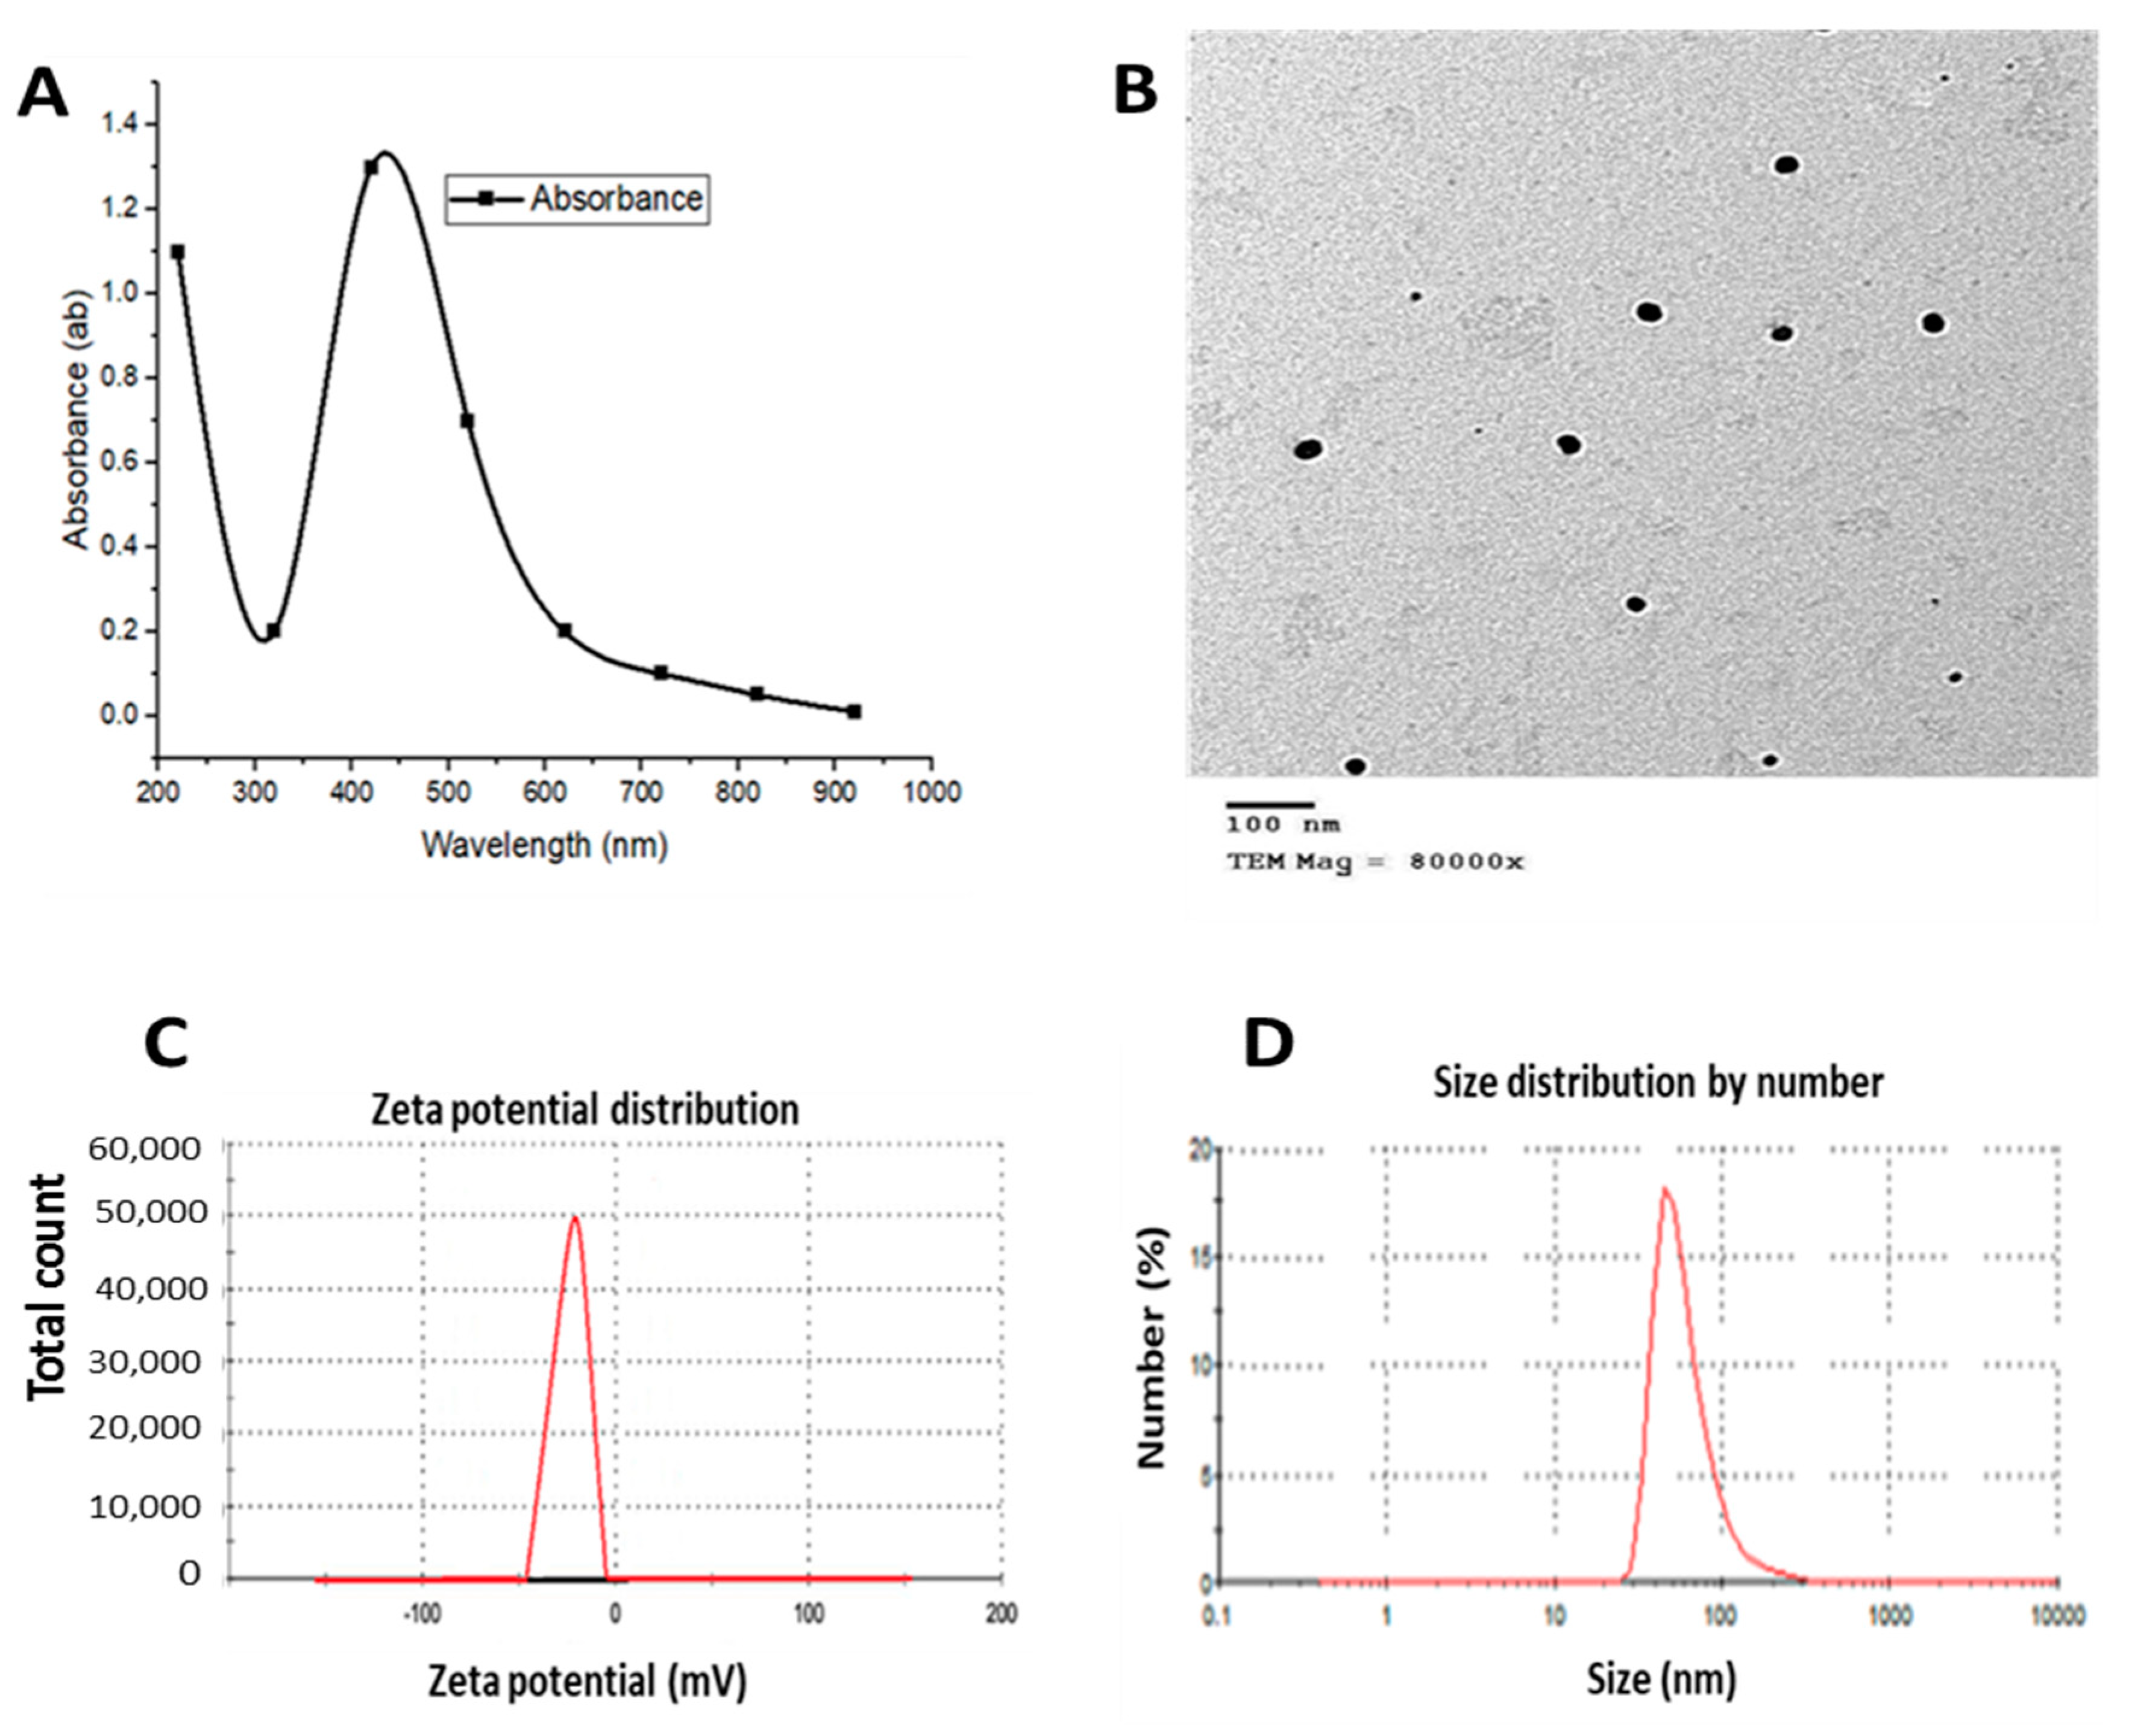
3.1. AgNPs and QNPs Characterization (Surface Chemistry)
3.2. Whole-Body Chemical Composition
3.3. Serum Physiological Assays
3.4. Antioxidant Status and Oxidative Injury Assays
3.5. Expression of Apoptosis and Stress-Related Genes
3.6. Intestinal Enzyme Activity
3.7. Hormonal Assay
3.8. Total Intestinal Bacteria and Aeromonas Counts
3.9. Silver Residues
4. Discussion
5. Conclusions
6. Limitations and Future Perspectives
Author Contributions
Funding
Institutional Review Board Statement
Informed Consent Statement
Data Availability Statement
Conflicts of Interest
References
- Guildford, A.L.; Poletti, T.; Osbourne, L.H.; Di Cerbo, A.; Gatti, A.M.; Santin, M. Nanoparticles of a different source induce different patterns of activation in key biochemical and cellular components of the host response. J. R. Soc. Interface 2009, 6, 1213–1221. [Google Scholar] [CrossRef]
- Di Cerbo, A.; Canello, S.; Guidetti, G.; Fiore, F.; Corsi, L.; Rubattu, N.; Testa, C.; Cocco, R. Adverse food reactions in dogs due to antibiotic residues in pet food: A preliminary study. Vet. Ital. 2018, 54, 137–146. [Google Scholar] [CrossRef]
- Di Cerbo, A.; Rubino, V.; Morelli, F.; Ruggiero, G.; Landi, R.; Guidetti, G.; Canello, S.; Terrazzano, G.; Alessandrini, A. Mechanical phenotyping of K562 cells by the Micropipette Aspiration Technique allows identifying mechanical changes induced by drugs. Sci. Rep. 2018, 8, 1219. [Google Scholar] [CrossRef] [Green Version]
- Sarkar, B.; Mahanty, A.; Gupta, S.K.; Choudhury, A.R.; Daware, A.; Bhattacharjee, S. Nanotechnology: A next-generation tool for sustainable aquaculture. Aquaculture 2022, 546, 737330. [Google Scholar] [CrossRef]
- Mawed, S.A.; Centoducati, G.; Farag, M.R.; Alagawany, M.; Abou-Zeid, S.M.; Elhady, W.M.; El-Saadony, M.T.; Di Cerbo, A.; Al-Zahaby, S.A. Dunaliella salina Microalga Restores the Metabolic Equilibrium and Ameliorates the Hepatic Inflammatory Response Induced by Zinc Oxide Nanoparticles (ZnO-NPs) in Male Zebrafish. Biology 2022, 11, 1447. [Google Scholar] [CrossRef]
- Mawed, S.A.; Marini, C.; Alagawany, M.; Farag, M.R.; Reda, R.M.; El-Saadony, M.T.; Elhady, W.M.; Magi, G.E.; Di Cerbo, A.; El-Nagar, W.G. Zinc Oxide Nanoparticles (ZnO-NPs) Suppress Fertility by Activating Autophagy, Apoptosis, and Oxidative Stress in the Developing Oocytes of Female Zebrafish. Antioxidants 2022, 11, 1567. [Google Scholar] [CrossRef]
- Shah, B.R.; Mraz, J. Advances in nanotechnology for sustainable aquaculture and fisheries. Rev. Aquacult. 2020, 12, 925–942. [Google Scholar] [CrossRef] [Green Version]
- Mansour, W.A.A.; Abdelsalam, N.R.; Tanekhy, M.; Khaled, A.A.; Mansour, A.T. Toxicity, inflammatory and antioxidant genes expression, and physiological changes of green synthesis silver nanoparticles on Nile tilapia (Oreochromis niloticus) fingerlings. Comp. Biochem. Physiol. Part C Toxicol. Pharmacol. 2021, 247, 109068. [Google Scholar] [CrossRef]
- Akter, M.; Sikder, M.T.; Rahman, M.M.; Ullah, A.; Hossain, K.F.B.; Banik, S.; Hosokawa, T.; Saito, T.; Kurasaki, M. A systematic review on silver nanoparticles-induced cytotoxicity: Physicochemical properties and perspectives. J. Adv. Res. 2018, 9, 1–16. [Google Scholar] [CrossRef]
- Bruna, T.; Maldonado-Bravo, F.; Jara, P.; Caro, N. Silver Nanoparticles and Their Antibacterial Applications. Int. J. Mol. Sci. 2021, 22, 7202. [Google Scholar] [CrossRef]
- Vazquez-Munoz, R.; Lopez-Ribot, J.L. Nanotechnology as an Alternative to Reduce the Spread of COVID-19. Challenges 2020, 11, 15. [Google Scholar] [CrossRef]
- Swain, P.; Nayak, S.K.; Sasmal, A.; Behera, T.; Barik, S.K.; Swain, S.K.; Mishra, S.S.; Sen, A.K.; Das, J.K.; Jayasankar, P. Antimicrobial activity of metal based nanoparticles against microbes associated with diseases in aquaculture. World J. Microbiol. Biotechnol. 2014, 30, 2491–2502. [Google Scholar] [CrossRef]
- Johari, S.A.; Kalbassi, M.R.; Soltani, M.; Yu, I.J. Application of nanosilver-coated zeolite as water filter media for fungal disinfection of rainbow trout (Oncorhynchus mykiss) eggs. Aquac. Int. 2016, 24, 23–38. [Google Scholar] [CrossRef]
- Kaegi, R.; Sinnet, B.; Zuleeg, S.; Hagendorfer, H.; Mueller, E.; Vonbank, R.; Boller, M.; Burkhardt, M. Release of silver nanoparticles from outdoor facades. Environ. Pollut. 2010, 158, 2900–2905. [Google Scholar] [CrossRef]
- Khosravi-Katuli, K.; Shabani, A.; Paknejad, H.; Imanpoor, M.R. Comparative toxicity of silver nanoparticle and ionic silver in juvenile common carp (Cyprinus carpio): Accumulation, physiology and histopathology. J. Hazard. Mater. 2018, 359, 373–381. [Google Scholar] [CrossRef]
- Afifi, M.; Saddick, S.; Abu Zinada, O.A. Toxicity of silver nanoparticles on the brain of Oreochromis niloticus and Tilapia zillii. Saudi J. Biol. Sci. 2016, 23, 754–760. [Google Scholar] [CrossRef] [Green Version]
- Hoheisel, S.M.; Diamond, S.; Mount, D. Comparison of nanosilver and ionic silver toxicity in Daphnia magna and Pimephales promelas. Environ. Toxicol. Chem. 2012, 31, 2557–2563. [Google Scholar] [CrossRef]
- Yue, Y.; Li, X.; Sigg, L.; Suter, M.J.F.; Pillai, S.; Behra, R.; Schirmer, K. Interaction of silver nanoparticles with algae and fish cells: A side by side comparison. J. Nanobiotechnol. 2017, 15, 16. [Google Scholar] [CrossRef] [Green Version]
- Khan, M.S.; Qureshi, N.A.; Jabeen, F. Assessment of toxicity in fresh water fish Labeo rohita treated with silver nanoparticles. Appl. Nanosci. 2017, 7, 167–179. [Google Scholar] [CrossRef] [Green Version]
- Ale, A.; Rossi, A.S.; Bacchetta, C.; Gervasio, S.; de la Torre, F.R.; Cazenave, J. Integrative assessment of silver nanoparticles toxicity in Prochilodus lineatus fish. Ecol. Indic. 2018, 93, 1190–1198. [Google Scholar] [CrossRef]
- Clark, N.J.; Boyle, D.; Eynon, B.P.; Handy, R.D. Dietary exposure to silver nitrate compared to two forms of silver nanoparticles in rainbow trout: Bioaccumulation potential with minimal physiological effects. Environ. Sci. Nano 2019, 6, 1393–1405. [Google Scholar] [CrossRef] [Green Version]
- Vali, S.; Mohammadi, G.; Tavabe, K.R.; Moghadas, F.; Naserabad, S.S. The effects of silver nanoparticles (Ag-NPs) sublethal concentrations on common carp (Cyprinus carpio): Bioaccumulation, hematology, serum biochemistry and immunology, antioxidant enzymes, and skin mucosal responses. Ecotoxicol. Environ. Saf. 2020, 194, 110353. [Google Scholar] [CrossRef]
- Farkas, J.; Christian, P.; Gallego-Urrea, J.A.; Roos, N.; Hassellov, M.; Tollefsen, K.E.; Thomas, K.V. Uptake and effects of manufactured silver nanoparticles in rainbow trout (Oncorhynchus mykiss) gill cells. Aquat. Toxicol. 2011, 101, 117–125. [Google Scholar] [CrossRef]
- Lee, B.; Duong, C.N.; Cho, J.; Lee, J.; Kim, K.; Seo, Y.; Kim, P.; Choi, K.; Yoon, J. Toxicity of citrate-capped silver nanoparticles in common carp (Cyprinus carpio). J. Biomed. Biotechnol. 2012, 2012, 262670. [Google Scholar] [CrossRef] [Green Version]
- Sayed, A.H.; Younes, H.A.M. Melanomacrophage centers in Clarias gariepinus as an immunological biomarker for toxicity of silver nanoparticles. J. Microsc. Ultrastruct. 2017, 5, 97–104. [Google Scholar] [CrossRef] [Green Version]
- Lin, P.; Chen, J.-W.; Chang, L.W.; Wu, J.-P.; Redding, L.; Chang, H.; Yeh, T.-K.; Yang, C.S.; Tsai, M.-H.; Wang, H.-J.; et al. Computational and ultrastructural toxicology of a nanoparticle, quantum dot 705, in mice. Environ. Sci. Technol. 2008, 42, 6264–6270. [Google Scholar] [CrossRef]
- Schipper, M.L.; Nakayama-Ratchford, N.; Davis, C.R.; Kam, N.W.S.; Chu, P.; Liu, Z.; Sun, X.; Dai, H.; Gambhir, S.S. A pilot toxicology study of single-walled carbon nanotubes in a small sample of mice. Nat. Nanotechnol. 2008, 3, 216–221. [Google Scholar] [CrossRef]
- de Lima, R.; Seabra, A.B.; Duran, N. Silver nanoparticles: A brief review of cytotoxicity and genotoxicity of chemically and biogenically synthesized nanoparticles. J. Appl. Toxicol. 2012, 32, 867–879. [Google Scholar] [CrossRef]
- Wise, J.P., Sr.; Goodale, B.C.; Wise, S.S.; Craig, G.A.; Pongan, A.F.; Walter, R.B.; Thompson, W.D.; Ng, A.K.; Aboueissa, A.M.; Mitani, H.; et al. Silver nanospheres are cytotoxic and genotoxic to fish cells. Aquat. Toxicol. 2010, 97, 34–41. [Google Scholar] [CrossRef] [Green Version]
- Khalil, S.R.; Awad, A.; Mohammed, H.H.; Nassan, M.A. Imidacloprid insecticide exposure induces stress and disrupts glucose homeostasis in male rats. Environ. Toxicol. Pharmacol. 2017, 55, 165–174. [Google Scholar] [CrossRef]
- Pattanayak, R.; Das, R.; Das, A.; Padhi, S.K.; Sahu, S.S.; Pattnaik, S.; Mishra, C.S.K.; Mishra, S.S.; Mohanty, C.S.; Sinam, G.; et al. Toxicological effects of silver nanoparticles (Ag-NPs) on different physiological parameters of tadpoles, Polypedates maculatus. Int. J. Bio-Resour. Stress Manag. 2018, 9, 647–654. [Google Scholar] [CrossRef] [Green Version]
- Abo-Al-Ela, H.G.; Faggio, C. MicroRNA-mediated stress response in bivalve species. Ecotoxicol. Environ. Saf. 2021, 208, 111442. [Google Scholar] [CrossRef]
- Ciji, A.; Akhtar, M.S. Stress management in aquaculture: A review of dietary interventions. Rev. Aquacult. 2021, 13, 2190–2247. [Google Scholar] [CrossRef]
- Zhu, X.; Zhu, L.; Lang, Y.; Chen, Y. Oxidative stress and growth inhibition in the freshwater fish Carassius auratus induced by chronic exposure to sublethal fullerene aggregates. Environ. Toxicol. Chem. 2008, 27, 1979–1985. [Google Scholar] [CrossRef]
- Pu, Y.; Guo, J.; Yang, H.; Zhong, L.; Tian, H.; Deng, H.; Duan, X.; Liu, S.; Chen, D. Environmentally relevant concentrations of mercury inhibit the growth of juvenile silver carp (Hypophthalmichthys molitrix): Oxidative stress and GH/IGF axis. Ecotoxicol. Environ. Saf. 2022, 236, 113484. [Google Scholar] [CrossRef]
- De Freitas Souza, C.; Baldissera, M.D.; Verdi, C.M.; Santos, R.C.V.; Da Rocha, M.I.U.M.; da Veiga, M.L.; da Silva, A.S.; Baldisserotto, B. Oxidative stress and antioxidant responses in Nile tilapia Oreochromis niloticus experimentally infected by Providencia rettgeri. Microb. Pathog. 2019, 131, 164–169. [Google Scholar] [CrossRef]
- Marques, B.F.; Cordeiro, L.F.; Kist, L.W.; Bogo, M.R.; López, G.; Pagano, G.; Muratt, D.T.; de Carvalho, L.M.; Külkamp-Guerreiro, I.C.; Monserrat, J.M. Toxicological effects induced by the nanomaterials fullerene and nanosilver in the polychaeta Laeonereis acuta (Nereididae) and in the bacteria communities living at their surface. Mar. Environ. Res. 2013, 89, 53–62. [Google Scholar] [CrossRef]
- Hedayati, S.A.; Farsani, H.G.; Naserabad, S.S.; Hoseinifar, S.H.; Van Doan, H. Protective effect of dietary vitamin E on immunological and biochemical induction through silver nanoparticles (AgNPs) inclusion in diet and silver salt (AgNO3) exposure on Zebrafish (Danio rerio). Comp. Biochem. Physiol. Part C Toxicol. Pharmacol. 2019, 222, 100–107. [Google Scholar] [CrossRef]
- Elabd, H.; Soror, E.; El-Asely, A.; El-Gawad, E.A.; Abbass, A. Dietary supplementation of Moringa leaf meal for Nile tilapia Oreochromis niloticus: Effect on growth and stress indices. Egypt. J. Aquat. Res. 2019, 45, 265–271. [Google Scholar] [CrossRef]
- Ibrahim, D.; Kishawy, A.T.; Khater, S.I.; Khalifa, E.; Ismail, T.A.; Mohammed, H.A.; Elnahriry, S.S.; Tolba, H.A.; Sherief, W.R.; Farag, M.F. Interactive effects of dietary quercetin nanoparticles on growth, flesh antioxidant capacity and transcription of cytokines and Aeromonas hydrophila quorum sensing orchestrating genes in Nile tilapia (Oreochromis niloticus). Fish Shellfish. Immunol. 2021, 119, 478–489. [Google Scholar] [CrossRef]
- Dabeek, W.M.; Marra, M.V. Dietary quercetin and kaempferol: Bioavailability and potential cardiovascular-related bioactivity in humans. Nutrients 2019, 11, 2288. [Google Scholar] [CrossRef] [Green Version]
- Ghafarifarsani, H.; Hoseinifar, S.H.; Javahery, S.; Van Doan, H. Effects of dietary vitamin C, thyme essential oil, and quercetin on the immunological and antioxidant status of common carp (Cyprinus carpio). Aquaculture 2022, 553, 738053. [Google Scholar] [CrossRef]
- Ouyang, J.; Sun, F.; Feng, W.; Sun, Y.; Qiu, X.; Xiong, L.; Liu, Y.; Chen, Y. Quercetin is an effective inhibitor of quorum sensing, biofilm formation and virulence factors in Pseudomonas aeruginosa. J. Appl. Microbiol. 2016, 120, 966–974. [Google Scholar] [CrossRef] [Green Version]
- Jasim, S.A.; Al-Mosawi, R.H.; Khalikov, K.; Abdelbasset, W.K.; Ahmad, I.; Shoukat, S.; Jawad, M.A.; Hafsan, H.; Mustafa, Y.F.; Norbakhsh, M. Dietary quercetin improved growth, body composition, haematology, immunity and resistance to Aeromonas hydrophila infection in common carp (Cyprinus carpio). Aquac. Res. 2022, 53, 6910–6920. [Google Scholar] [CrossRef]
- Rice, E.W.; Bridgewater, L.; Association, A.P.H.; Association, A.W.W.; Federation, W.E. Standard Methods for the Examination of Water and Wastewater; American Public Health Association: Washington, DC, USA, 2012. [Google Scholar]
- AOAC. Official Method 989.05, Fat in Milk, Modified Mojonnier, Ether Extrac tion Method. 2016. Available online: https://d163axztg8am2h.cloudfront.net/static/doc/33/39/67e2a818ad56f4785aa08ee21f10.pdf (accessed on 10 September 2022).
- Wenger, W.C.; Murphy, M.P.; Brierley, G.P.; Altschuld, R.A. Effects of ionic strength and sulfhydryl reagents on the binding of creatine phosphokinase to heart mitochondrial inner membranes. J. Bioenerg. Biomembr. 1985, 17, 295–303. [Google Scholar] [CrossRef]
- Murray, D.R. Amino Acid and Amide Metabolism in the Hulls and Seeds of Developing Fruits of Garden Pea, Pisum sativum L. IV. Alanine. New Phytol. 1986, 104, 395–406. [Google Scholar] [CrossRef]
- Tietz, N.W.; Burtis, C.A.; Ashwood, E.R. Tietz Textbook of Clinical Chemistry; Saunders: Philadelphia, PA, USA, 1994. [Google Scholar]
- Fossati, P.; Prencipe, L.; Berti, G. Enzymic creatinine assay: A new colorimetric method based on hydrogen peroxide measurement. Clin. Chem. 1983, 29, 1494–1496. [Google Scholar] [CrossRef]
- Kaplan, A. The Determination of Urea, Ammonia, and Urease. In Methods of Biochemical Analysis; Glick, D., Ed.; John Wiley & Sons, Inc.: Hoboken, NJ, USA, 1969; pp. 311–324. [Google Scholar] [CrossRef]
- Beutler, E.; Duron, O.; Kelly, B.M. Improved method for the determination of blood glutathione. J. Lab. Clin. Med. 1963, 61, 882–888. [Google Scholar]
- Nishikimi, M.; Appaji, N.; Yagi, K. The occurrence of superoxide anion in the reaction of reduced phenazine methosulfate and molecular oxygen. Biochem. Biophys. Res. Commun. 1972, 46, 849–854. [Google Scholar] [CrossRef]
- Aebi, H. [13] Catalase in vitro. In Methods in Enzymology; Academic Press: Cambridge, MA, USA, 1984; Volume 105, pp. 121–126. [Google Scholar]
- Ohkawa, H.; Ohishi, N.; Yagi, K. Assay for lipid peroxides in animal tissues by thiobarbituric acid reaction. Anal. Biochem. 1979, 95, 351–358. [Google Scholar] [CrossRef]
- Farag, M.R.; Alagawany, M.; Khalil, S.R.; Abd El-Aziz, R.M.; Zaglool, A.W.; Moselhy, A.A.A.; Abou-Zeid, S.M. Effect of parsley essential oil on digestive enzymes, intestinal morphometry, blood chemistry and stress-related genes in liver of Nile tilapia fish exposed to Bifenthrin. Aquaculture 2022, 546, 737322. [Google Scholar] [CrossRef]
- Standen, B.T.; Peggs, D.L.; Rawling, M.D.; Foey, A.; Davies, S.J.; Santos, G.A.; Merrifield, D.L. Dietary administration of a commercial mixed-species probiotic improves growth performance and modulates the intestinal immunity of tilapia, Oreochromis niloticus. Fish Shellfish. Immunol. 2016, 49, 427–435. [Google Scholar] [CrossRef] [Green Version]
- Hassan, A.M.; El-nahas, A.F.; Mahmoud, S.; Barakat, M.E.; Ammar, A.Y. Thermal stress of ambient temperature modulate expression of stress and immune-related genes and DNA fragmentation in Nile tilapia (Oreochromis niloticus (Linnaeus, 1758)). Appl. Ecol. Environ. Res. 2017, 15, 1343–1354. [Google Scholar] [CrossRef]
- Pang, J.-c.; Gao, F.-y.; Lu, M.-x.; Ye, X.; Zhu, H.-p.; Ke, X.-l. Major histocompatibility complex class IIA and IIB genes of Nile tilapia Oreochromis niloticus: Genomic structure, molecular polymorphism and expression patterns. Fish Shellfish. Immunol. 2013, 34, 486–496. [Google Scholar] [CrossRef]
- Livak, K.J.; Schmittgen, T.D. Analysis of relative gene expression data using real-time quantitative PCR and the 2(-Delta Delta C(T)) Method. Methods 2001, 25, 402–408. [Google Scholar] [CrossRef]
- Caraway, W.T. A stable starch substrate for the determination of amylase in serum and other body fluids. Am. J. Clin. Pathol. 1959, 32, 97–99. [Google Scholar] [CrossRef]
- Borlongan, I.G. Studies on the digestive lipases of milkfish, Chanos chanos. Aquaculture 1990, 89, 315–325. [Google Scholar] [CrossRef]
- Bezerra, R.S.; Lins, E.J.F.; Alencar, R.B.; Paiva, P.M.G.; Chaves, M.E.C.; Coelho, L.C.B.B.; Carvalho, L.B. Alkaline proteinase from intestine of Nile tilapia (Oreochromis niloticus). Process Biochem. 2005, 40, 1829–1834. [Google Scholar] [CrossRef]
- Saad, A.M.; Sitohy, M.Z.; Ahmed, A.I.; Rabie, N.A.; Amin, S.A.; Aboelenin, S.M.; Soliman, M.M.; El-Saadony, M.T. Biochemical and functional characterization of kidney bean protein alcalase-hydrolysates and their preservative action on stored chicken meat. Molecules 2021, 26, 4690. [Google Scholar] [CrossRef]
- Praveen, P.K.; Debnath, C.; Shekhar, S.; Dalai, N.; Ganguly, S. Incidence of Aeromonas spp. infection in fish and chicken meat and its related public health hazards: A review. Vet. World 2016, 9, 6–11. [Google Scholar] [CrossRef] [Green Version]
- Mahaffey, K.R.; Capar, S.G.; Gladen, B.C.; Fowler, B.A. Concurrent exposure to lead, cadmium, and arsenic: Effects on toxicity and tissue metal concentrations in the rat. J. Lab. Clin. Med. 1981, 98, 463–481. [Google Scholar] [CrossRef]
- Khan, M.S.; Qureshi, N.A.; Jabeen, F.; Shakeel, M.; Asghar, M.S. Assessment of Waterborne Amine-Coated Silver Nanoparticle (Ag-NP)-Induced Toxicity in Labeo rohita by Histological and Hematological Profiles. Biol. Trace Elem. Res. 2018, 182, 130–139. [Google Scholar] [CrossRef]
- Govindasamy, R.; Rahuman, A.A. Histopathological studies and oxidative stress of synthesized silver nanoparticles in Mozambique tilapia (Oreochromis mossambicus). J. Environ. Sci. 2012, 24, 1091–1098. [Google Scholar] [CrossRef]
- Shaluei, F.; Hedayati, A.; Jahanbakhshi, A.; Kolangi, H.; Fotovat, M. Effect of subacute exposure to silver nanoparticle on some hematological and plasma biochemical indices in silver carp (Hypophthalmichthys molitrix). Hum. Exp. Toxicol. 2013, 32, 1270–1277. [Google Scholar] [CrossRef]
- Srinonate, A.; Banlunara, W.; Maneewattanapinyo, P.; Thammacharoen, C.; Ekgasit, S.; Kaewamatawong, T. Acute Toxicity Study of Nanosilver Particles in Tilapia (Oreochromis niloticus): Pathological Changes, Particle Bioaccumulation and Metallothionien Protein Expression. Thai Vet. Med. 2015, 45, 81–89. [Google Scholar]
- Mabrouk, M.M.; Mansour, A.T.; Abdelhamid, A.F.; Abualnaja, K.M.; Mamoon, A.; Gado, W.S.; Matter, A.F.; Ayoub, H.F. Impact of aqueous exposure to silver nanoparticles on growth performance, redox status, non-specific immunity, and histopathological changes of Nile Tilapia, Oreochromis niloticus, challenged with Aeromonas hydrophila. Aquac. Rep. 2021, 21, 100816. [Google Scholar] [CrossRef]
- Sibiya, A.; Gopi, N.; Jeyavani, J.; Mahboob, S.; Al-Ghanim, K.A.; Sultana, S.; Mustafa, A.; Govindarajan, M.; Vaseeharan, B. Comparative toxicity of silver nanoparticles and silver nitrate in freshwater fish Oreochromis mossambicus: A multi-biomarker approach. Comp. Biochem. Physiol. Part C Toxicol. Pharmacol. 2022, 259, 109391. [Google Scholar] [CrossRef]
- Hamed, H.S.; Abdel-Tawwab, M. Dietary pomegranate (Punica granatum) peel mitigated the adverse effects of silver nanoparticles on the performance, haemato-biochemical, antioxidant, and immune responses of Nile tilapia fingerlings. Aquaculture 2021, 540, 736742. [Google Scholar] [CrossRef]
- Choi, J.E.; Kim, S.; Ahn, J.H.; Youn, P.; Kang, J.S.; Park, K.; Yi, J.; Ryu, D.Y. Induction of oxidative stress and apoptosis by silver nanoparticles in the liver of adult zebrafish. Aquat. Toxicol. 2010, 100, 151–159. [Google Scholar] [CrossRef]
- Yousefi, M.; Vatnikov, Y.A.; Kulikov, E.V.; Plushikov, V.G.; Drukovsky, S.G.; Hoseinifar, S.H.; Van Doan, H. The protective effects of dietary garlic on common carp (Cyprinus carpio) exposed to ambient ammonia toxicity. Aquaculture 2020, 526, 735400. [Google Scholar] [CrossRef]
- Amjad, S.; Sharma, A.K.; Serajuddin, M. Toxicity assessment of cypermethrin nanoparticles in Channa punctatus: Behavioural response, micronuclei induction and enzyme alteration. Regul. Toxicol. Pharmacol. 2018, 100, 127–133. [Google Scholar] [CrossRef]
- Van Waarde, A.; De Wilde-Van Berge Henegouwen, M. Nitrogen metabolism in goldfish, Carassius auratus (L.). Pathway of aerobic and anaerobic glutamate oxidation in goldfish liver and muscle mitochondria. Comp. Biochem. Physiol. Part B Comp. Biochem. 1982, 72, 133–136. [Google Scholar] [CrossRef]
- Vijayavel, K.; Anbuselvam, C.; Balasubramanian, M.P.; Deepak Samuel, V.; Gopalakrishnan, S. Assessment of biochemical components and enzyme activities in the estuarine crab Scylla tranquebarica from naphthalene contaminated habitants. Ecotoxicology 2006, 15, 469–476. [Google Scholar] [CrossRef]
- Velmurugan, B.; Selvanayagam, M.; Cengiz, E.I.; Uysal, E. Levels of transaminases, alkaline phosphatase, and protein in tissues of Clarias gariepienus fingerlings exposed to sublethal concentrations of cadmium chloride. Environmental Toxicology 2008, 23, 672–678. [Google Scholar] [CrossRef]
- Sánchez-Muros, M.a.J.; García-Rejón, L.; García-Salguero, L.; de laHiguera, M.; Lupiáñez, J.A. Long-term nutritional effects on the primary liver and kidney metabolism in rainbow trout. Adaptive response to starvation and a high-protein, carbohydrate-free diet on glutamate dehydrogenase and alanine aminotransferase kinetics. Int. J. Biochem. Cell Biol. 1998, 30, 55–63. [Google Scholar] [CrossRef]
- Samanta, P.; Pal, S.; Mukherjee, A.K.; Ghosh, A.R. Evaluation of metabolic enzymes in response to excel mera 71, a glyphosate-based herbicide, and recovery pattern in freshwater teleostean fishes. BioMed Res. Int. 2014, 2014, 425159. [Google Scholar] [CrossRef] [Green Version]
- Rajkumar, K.S.; Kanipandian, N.; Thirumurugan, R. Toxicity assessment on haemotology, biochemical and histopathological alterations of silver nanoparticles-exposed freshwater fish Labeo rohita. Appl. Nanosci. 2016, 6, 19–29. [Google Scholar] [CrossRef] [Green Version]
- Bermejo-Nogales, A.; Fernandez, M.; Fernandez-Cruz, M.L.; Navas, J.M. Effects of a silver nanomaterial on cellular organelles and time course of oxidative stress in a fish cell line (PLHC-1). Comp. Biochem. Physiol. C Toxicol. Pharmacol. 2016, 190, 54–65. [Google Scholar] [CrossRef]
- Banaee, M.; Sureda, A.; Zohiery, F.; Hagi, B.; Garanzini, D. Alterations in biochemical parameters of the freshwater fish, Alburnus mossulensis, exposed to sub-lethal concentrations of Fenpropathrin. Int. J. Aquat. Biol. 2014, 2, 58–68. [Google Scholar]
- Kotronen, A.; Westerbacka, J.; Bergholm, R.; Pietiläinen, K.H.; Yki-Järvinen, H. Liver fat in the metabolic syndrome. J. Clin. Endocrinol. Metab. 2007, 92, 3490–3497. [Google Scholar] [CrossRef]
- Deng, S.-X.; Tian, L.-X.; Liu, F.-J.; Jin, S.-J.; Liang, G.-Y.; Yang, H.-J.; Du, Z.-Y.; Liu, Y.-J. Toxic effects and residue of aflatoxin B1 in tilapia (Oreochromis niloticus × O. aureus) during long-term dietary exposure. Aquaculture 2010, 307, 233–240. [Google Scholar] [CrossRef]
- Lin, H.; Romsos, D.R.; Tack, P.I.; Leveille, G.A. Influence of diet on in vitro and in vivo rates of fatty acid synthesis in coho salmon [Oncorhynchus Kisutch (Walbaum)]. J. Nutr. 1977, 107, 1677–1682. [Google Scholar] [CrossRef]
- Lin, H.; Romsos, D.R.; Tack, P.I.; Leveille, G.A. Effects of fasting and feeding various diets on hepatic lipogenic enzyme activities in coho salmon (Oncorhynchus kisutch (Walbaum)). J. Nutr. 1977, 107, 1477–1483. [Google Scholar] [CrossRef]
- Polakof, S.; Panserat, S.; Soengas, J.L.; Moon, T.W. Glucose metabolism in fish: A review. J. Comp. Physiol. B 2012, 182, 1015–1045. [Google Scholar] [CrossRef]
- Jin, J.; Médale, F.; Kamalam, B.S.; Aguirre, P.; Véron, V.; Panserat, S. Comparison of glucose and lipid metabolic gene expressions between fat and lean lines of rainbow trout after a glucose load. PLoS ONE 2014, 9, e105548. [Google Scholar] [CrossRef] [Green Version]
- Galsgaard, K.D.; Pedersen, J.; Knop, F.K.; Holst, J.J.; Wewer Albrechtsen, N.J. Glucagon receptor signaling and lipid metabolism. Front. Physiol. 2019, 10, 413. [Google Scholar] [CrossRef] [Green Version]
- Solloway, M.J.; Madjidi, A.; Gu, C.; Eastham-Anderson, J.; Clarke, H.J.; Kljavin, N.; Zavala-Solorio, J.; Kates, L.; Friedman, B.; Brauer, M.; et al. Glucagon couples hepatic amino acid catabolism to mTOR-dependent regulation of α-cell mass. Cell Rep. 2015, 12, 495–510. [Google Scholar] [CrossRef] [Green Version]
- Dean, E.D.; Li, M.; Prasad, N.; Wisniewski, S.N.; Von Deylen, A.; Spaeth, J.; Maddison, L.; Botros, A.; Sedgeman, L.R.; Bozadjieva, N.; et al. Interrupted glucagon signaling reveals hepatic α cell axis and role for L-glutamine in α cell proliferation. Cell Metab. 2017, 25, 1362–1373. [Google Scholar] [CrossRef] [Green Version]
- Kim, J.; Okamoto, H.; Huang, Z.; Anguiano, G.; Chen, S.; Liu, Q.; Cavino, K.; Xin, Y.; Na, E.; Hamid, R.; et al. Amino acid transporter Slc38a5 controls glucagon receptor inhibition-induced pancreatic α cell hyperplasia in mice. Cell Metab. 2017, 25, 1348–1361. [Google Scholar] [CrossRef] [Green Version]
- Han, S.; Akiyama, T.E.; Previs, S.F.; Herath, K.; Roddy, T.P.; Jensen, K.K.; Guan, H.-P.; Murphy, B.A.; McNamara, L.A.; Shen, X.; et al. Effects of small interfering RNA-mediated hepatic glucagon receptor inhibition on lipid metabolism in db/db mice[S]. J. Lipid Res. 2013, 54, 2615–2622. [Google Scholar] [CrossRef] [Green Version]
- Wang, H.; Zhao, M.; Sud, N.; Christian, P.; Shen, J.; Song, Y.; Pashaj, A.; Zhang, K.; Carr, T.; Su, Q. Glucagon regulates hepatic lipid metabolism via cAMP and Insig-2 signaling: Implication for the pathogenesis of hypertriglyceridemia and hepatic steatosis. Sci. Rep. 2016, 6, 32246. [Google Scholar] [CrossRef] [Green Version]
- Galsgaard, K.D.; Winther-Sørensen, M.; Ørskov, C.; Kissow, H.; Poulsen, S.S.; Vilstrup, H.; Prehn, C.; Adamski, J.; Jepsen, S.L.; Hartmann, B.; et al. Disruption of glucagon receptor signaling causes hyperaminoacidemia exposing a possible liver-alpha-cell axis. Am. J. Physiol. Endocrinol. Metab. 2018, 314, E93–E103. [Google Scholar] [CrossRef] [Green Version]
- Iacob, R.; Rüdrich, U.; Rothe, M.; Kirsch, S.; Maasoumy, B.; Narain, N.; Verfaillie, C.M.; Sancho-Bru, P.; Iken, M.; Popescu, I.; et al. Induction of a mature hepatocyte phenotype in adult liver derived progenitor cells by ectopic expression of transcription factors. Stem Cell Res. 2011, 6, 251–261. [Google Scholar] [CrossRef] [Green Version]
- Holst, J.J.; Wewer Albrechtsen, N.J.; Pedersen, J.; Knop, F.K. Glucagon and amino acids are linked in a mutual feedback cycle: The liver–α-cell axis. Diabetes 2017, 66, 235–240. [Google Scholar] [CrossRef] [Green Version]
- Carrasco-Pozo, C.; Tan, K.N.; Reyes-Farias, M.; De La Jara, N.; Ngo, S.T.; Garcia-Diaz, D.F.; Llanos, P.; Cires, M.J.; Borges, K. The deleterious effect of cholesterol and protection by quercetin on mitochondrial bioenergetics of pancreatic β-cells, glycemic control and inflammation: In vitro and in vivo studies. Redox Biol. 2016, 9, 229–243. [Google Scholar] [CrossRef] [Green Version]
- Cui, Y.; Hou, P.; Li, F.; Liu, Q.; Qin, S.; Zhou, G.; Xu, X.; Si, Y.; Guo, S. Quercetin improves macrophage reverse cholesterol transport in apolipoprotein E-deficient mice fed a high-fat diet. Lipids Health Dis. 2017, 16, 9. [Google Scholar] [CrossRef] [Green Version]
- Fang, W.; Chi, Z.; Li, W.; Zhang, X.; Zhang, Q. Comparative study on the toxic mechanisms of medical nanosilver and silver ions on the antioxidant system of erythrocytes: From the aspects of antioxidant enzyme activities and molecular interaction mechanisms. J. Nanobiotechnol. 2019, 17, 66. [Google Scholar] [CrossRef] [Green Version]
- Durán, N.; Durán, M.; de Jesus, M.B.; Seabra, A.B.; Fávaro, W.J.; Nakazato, G. Silver nanoparticles: A new view on mechanistic aspects on antimicrobial activity. Nanomed. Nanotechnol. Biol. Med. 2016, 12, 789–799. [Google Scholar] [CrossRef]
- Bruneau, A.; Turcotte, P.; Pilote, M.; Gagné, F.; Gagnon, C. Fate of silver nanoparticles in wastewater and immunotoxic effects on rainbow trout. Aquat. Toxicol. 2016, 174, 70–81. [Google Scholar] [CrossRef]
- Piao, M.J.; Kang, K.A.; Lee, I.K.; Kim, H.S.; Kim, S.; Choi, J.Y.; Choi, J.; Hyun, J.W. Silver nanoparticles induce oxidative cell damage in human liver cells through inhibition of reduced glutathione and induction of mitochondria-involved apoptosis. Toxicol. Lett. 2011, 201, 92–100. [Google Scholar] [CrossRef]
- van Aerle, R.; Lange, A.; Moorhouse, A.; Paszkiewicz, K.; Ball, K.; Johnston, B.D.; de-Bastos, E.; Booth, T.; Tyler, C.R.; Santos, E.M. Molecular Mechanisms of Toxicity of Silver Nanoparticles in Zebrafish Embryos. Environ. Sci. Technol. 2013, 47, 8005–8014. [Google Scholar] [CrossRef] [Green Version]
- Jia, H.Y.; Liu, Y.; Zhang, X.J.; Han, L.; Du, L.B.; Tian, Q.; Xu, Y.C. Potential Oxidative Stress of Gold Nanoparticles by Induced-NO Releasing in Serum. J. Am. Chem. Soc. 2009, 131, 40–41. [Google Scholar] [CrossRef]
- Tayemeh, M.B.; Kalbassi, M.R.; Paknejad, H.; Joo, H.S. Dietary nanoencapsulated quercetin homeostated transcription of redox-status orchestrating genes in zebrafish (Danio rerio) exposed to silver nanoparticles. Environ. Res. 2020, 185, 109477. [Google Scholar] [CrossRef]
- Zhang, F.; Feng, J.; Zhang, J.; Kang, X.; Qian, D. Quercetin modulates AMPK/SIRT1/NF-kappaB signaling to inhibit inflammatory/oxidative stress responses in diabetic high fat diet-induced atherosclerosis in the rat carotid artery. Exp. Ther. Med. 2020, 20, 280. [Google Scholar] [CrossRef]
- Shen, P.; Lin, W.; Ba, X.; Huang, Y.; Chen, Z.; Han, L.; Qin, K.; Huang, Y.; Tu, S. Quercetin-mediated SIRT1 activation attenuates collagen-induced mice arthritis. J. Ethnopharmacol. 2021, 279, 114213. [Google Scholar] [CrossRef]
- Kumar, S.; Moniruzzaman, M.; Chakraborty, A.; Sarbajna, A.; Chakraborty, S.B. Crosstalk between heat shock proteins, NRF2, NF-κB and different endogenous antioxidants during lead-induced hepatotoxicity in Puntius ticto. Aquat. Toxicol. 2021, 233, 105771. [Google Scholar] [CrossRef]
- Ahamed, M.; Posgai, R.; Gorey, T.J.; Nielsen, M.; Hussain, S.M.; Rowe, J.J. Silver nanoparticles induced heat shock protein 70, oxidative stress and apoptosis in Drosophila melanogaster. Toxicol. Appl. Pharmacol. 2010, 242, 263–269. [Google Scholar] [CrossRef]
- Reisman, D.; Takahashi, P.; Polson, A.; Boggs, K. Transcriptional regulation of the p53 tumor suppressor gene in S-phase of the cell-cycle and the cellular response to DNA damage. Biochem. Res. Int. 2012, 2012, 808934. [Google Scholar] [CrossRef] [Green Version]
- Langheinrich, U.; Hennen, E.; Stott, G.; Vacun, G. Zebrafish as a model organism for the identification and characterization of drugs and genes affecting p53 signaling. Curr. Biol. 2002, 12, 2023–2028. [Google Scholar] [CrossRef] [Green Version]
- Dong, Y.; Hou, Q.; Lei, J.; Wolf, P.G.; Ayansola, H.; Zhang, B. Quercetin alleviates intestinal oxidative damage induced by H2O2 via modulation of GSH: In vitro screening and in vivo evaluation in a colitis model of mice. ACS Omega 2020, 5, 8334–8346. [Google Scholar] [CrossRef] [Green Version]
- Suzuki, T.; Hara, H. Quercetin enhances intestinal barrier function through the assembly of zonnula occludens-2, occludin, and claudin-1 and the expression of claudin-4 in Caco-2 cells. J. Nutr. 2009, 139, 965–974. [Google Scholar] [CrossRef] [Green Version]
- Li, J.; Tang, M.; Xue, Y. Review of the effects of silver nanoparticle exposure on gut bacteria. J. Appl. Toxicol. 2019, 39, 27–37. [Google Scholar] [CrossRef] [Green Version]
- Javurek, A.B.; Suresh, D.; Spollen, W.G.; Hart, M.L.; Hansen, S.A.; Ellersieck, M.R.; Bivens, N.J.; Givan, S.A.; Upendran, A.; Kannan, R.; et al. Gut dysbiosis and neurobehavioral alterations in rats exposed to silver nanoparticles. Sci. Rep. 2017, 7, 2822. [Google Scholar] [CrossRef]
- Chen, P.; Huang, J.; Rao, L.; Zhu, W.; Yu, Y.; Xiao, F.; Chen, X.; Yu, H.; Wu, Y.; Xu, K.; et al. Resistance and resilience of fish gut microbiota to silver nanoparticles. Environ. Microbiol. 2021, 6, e0063021. [Google Scholar] [CrossRef]
- Ma, Y.; Song, L.; Lei, Y.; Jia, P.; Lu, C.; Wu, J.; Xi, C.; Strauss, P.R.; Pei, D.-S. Sex dependent effects of silver nanoparticles on the zebrafish gut microbiota. Environ. Sci. Nano 2018, 5, 740–751. [Google Scholar] [CrossRef]
- Naguib, M.; Mahmoud, U.M.; Mekkawy, I.A.; Sayed, A.E.-D.H. Hepatotoxic effects of silver nanoparticles on Clarias gariepinus; Biochemical, histopathological, and histochemical studies. Toxicol. Rep. 2020, 7, 133–141. [Google Scholar] [CrossRef]
- Shobana, C.; Rangasamy, B.; Hemalatha, D.; Ramesh, M. Bioaccumulation of silver and its effects on biochemical parameters and histological alterations in an Indian major carp Labeo rohita. Environ. Chem. Ecotoxicol. 2021, 3, 51–58. [Google Scholar] [CrossRef]
- Sayed, A.E.-D.H.; Mekkawy, I.A.; Mahmoud, U.M.; Nagiub, M. Histopathological and histochemical effects of silver nanoparticles on the gills and muscles of African catfish (Clarias garepinus). Sci. Afr. 2020, 7, e00230. [Google Scholar] [CrossRef]
- Johari, S.A.; Kalbassi, M.R.; Yu, I.J.; Lee, J.H. Chronic effect of waterborne silver nanoparticles on rainbow trout (Oncorhynchus mykiss): Histopathology and bioaccumulation. Comp. Clin. Pathol. 2015, 24, 995–1007. [Google Scholar] [CrossRef]
- Ale, A.; Galdoporpora, J.M.; Mora, M.C.; de la Torre, F.R.; Desimone, M.F.; Cazenave, J. Mitigation of silver nanoparticle toxicity by humic acids in gills of Piaractus mesopotamicus fish. Environ. Sci. Pollut. Res. Int. 2021, 28, 31659–31669. [Google Scholar] [CrossRef]
- Rotruck, J.T.; Pope, A.L.; Ganther, H.E.; Swanson, A.B.; Hafeman, D.G.; Hoekstra, W.G. Selenium: Biochemical role as a component of glutathione peroxidase. Science 1973, 179, 588–590. [Google Scholar] [CrossRef]


| Gene Symbol | Sequence (5’-3’) | Gene Name | Accession Number | Reference |
|---|---|---|---|---|
| p53 | F: GCATGTGGCTGATGTTGTTC R: GCAGGATGGTGGTCATCTCT | Tumor suppressor protein | FJ233106.1 | Farag, et al. [56] |
| casp3 | F: GGCTCTTCGTCTGCTTCTGT R: GGGAAATCGAGGCGGTATCT | Caspase3 | GQ421464.1 | Standen, et al. [57] |
| Hsp70 | F- CTCCACCCGAATCCCCAAAA R: TCGATACCCAGGGACAGAGG | Heat shock protein 70 | EU816596.1 | Hassan, et al. [58] |
| β-actin | F: AGCAAGCAGGAGTACGATGAG R: TGTGTGGTGTGTGGTTGTTTTG | Beta-actin | XM-003455949.2 | Pang, et al. [59] |
| Control | QNPs | AgNPs | AgNPs + QNPs | p-Value | |
|---|---|---|---|---|---|
| Moisture (%) | 76.17 ± 0.38 b | 75.81 ± 0.45 b | 79.48 ± 0.14 a | 75.93 ± 0.43 b | <0.001 |
| Ash (%) | 4.41 ± 0.23 | 4.34 ± 0.15 | 6.25 ± 0.24 | 5.14 ± 0.17 | 0.814 |
| Crude lipid (%) | 6.19 ± 0.03 a | 5.07 ± 0.03 b | 4.14 ± 0.04 d | 4.84 ± 0.04 c | <0.05 |
| Crude protein (%) | 14.02 ± 0.45 a | 14.44 ± 0.17 a | 11.30 ± 0.07 c | 12.58 ± 0.16 b | <0.001 |
| Control | QNP | AgNPs | AgNPs + QNPs | p-Value | |
|---|---|---|---|---|---|
| ALT (IU L−1) | 26.98 ± 0.53 c | 24.28 ± 0.12 c | 92.37 ± 3.15 a | 33.70 ± 1.23 b | <0.001 |
| AST (IU L−1) | 53.31 ± 0.57 b | 40.85 ± 0.64 c | 151.66 ± 0.61 a | 53.84 ± 0.92 b | <0.001 |
| Glycogen (pg mL−1) | 74.42 ± 0.35 a | 73.27 ± 0.87 a | 44.28 ± 0.49 b | 72.67 ± 1.34 a | <0.001 |
| TC (mg dL−1) | 181.07 ± 9.60 b | 154.76 ± 3.11 c | 216.40 ± 2.39 a | 175.20 ± 3.42 ab | <0.001 |
| TG (mg dL−1) | 99.79 ± 6.89 b | 65.92 ± 5.66 c | 121.44 ± 1.88 a | 89.51 ± 0.92 b | <0.001 |
| Control | QNPs | AgNPs | AgNPs + QNPs | p-Value | |
|---|---|---|---|---|---|
| SOD (U g−1 tissue) | 5.48 ± 0.20 a | 5.67 ± 0.07 a | 3.13 ± 0.05 c | 4.77 ± 0.15 b | <0.001 |
| CAT (U g−1 tissue) | 4.45 ± 0.07 a | 4.12 ± 0.01 a | 3.05 ± 0.05 b | 3.16 ± 0.32 b | <0.001 |
| GSH (nmol g−1 tissue) | 2.77 ± 0.05 a | 3.26 ± 0.26 a | 0.82 ± 0.02 b | 2.74 ± 0.05 a | <0.001 |
| MDA (nmol g−1 tissue) | 14.57 ± 0.17 b | 13.19 ± 0.09 c | 18.46 ± 0.32 a | 14.58 ± 0.17 b | <0.001 |
| PC (nmol g−1 tissue) | 4.23 ± 0.01 c | 4.19 ± 0.39 c | 7.75 ± 0.37 a | 5.77 ± 0.38 b | <0.001 |
| Control | QNPs | AgNPs | AgNPs + QNPs | p-Value | |
|---|---|---|---|---|---|
| Amylase (DU) | 1.16 ± 0.17 a | 1.37 ± 0.01 a | 0.34 ± 0.02 c | 0.80 ± 0.06 b | <0.001 |
| Lipase (FCCFIP) | 52.54 ± 0.91 b | 85.31 ± 2.61 a | 27.16 ± 1.16 c | 51.41 ± 0.83 b | <0.001 |
| Protease (HUT) | 1.52 ± 0.01 b | 3.49 ± 0.03 a | 0.44 ± 0.03 d | 0.93 ± 0.01 c | <0.001 |
| Control | QNPs | AgNPs | AgNPs + QNPs | p-Value | |
|---|---|---|---|---|---|
| GH (pg mL−1) | 560.07 ± 5.18 a | 560.17 ± 1.64 a | 344.09 ± 6.06 b | 539 ± 8.02 a | <0.001 |
| T3 (pg mL−1) | 302.00 ± 13.58 | 301.33 ± 12.25 | 241.10 ± 28.12 | 301.67 ± 29.07 | 0.214 |
| T4 (ng mL−1) | 133.27 ± 2.58 | 94.00 ± 4.26 | 77.97 ± 3.77 | 134.48 ± 2.50 | 0.199 |
| Glucagon (pg mL−1) | 4.59 ± 0.05 | 4.58 ± 0.04 | 4.59 ± 0.05 | 4.58 ± 0.8 | 0.999 |
Disclaimer/Publisher’s Note: The statements, opinions and data contained in all publications are solely those of the individual author(s) and contributor(s) and not of MDPI and/or the editor(s). MDPI and/or the editor(s) disclaim responsibility for any injury to people or property resulting from any ideas, methods, instructions or products referred to in the content. |
© 2023 by the authors. Licensee MDPI, Basel, Switzerland. This article is an open access article distributed under the terms and conditions of the Creative Commons Attribution (CC BY) license (https://creativecommons.org/licenses/by/4.0/).
Share and Cite
Farag, M.R.; Abo-Al-Ela, H.G.; Alagawany, M.; Azzam, M.M.; El-Saadony, M.T.; Rea, S.; Di Cerbo, A.; Nouh, D.S. Effect of Quercetin Nanoparticles on Hepatic and Intestinal Enzymes and Stress-Related Genes in Nile Tilapia Fish Exposed to Silver Nanoparticles. Biomedicines 2023, 11, 663. https://doi.org/10.3390/biomedicines11030663
Farag MR, Abo-Al-Ela HG, Alagawany M, Azzam MM, El-Saadony MT, Rea S, Di Cerbo A, Nouh DS. Effect of Quercetin Nanoparticles on Hepatic and Intestinal Enzymes and Stress-Related Genes in Nile Tilapia Fish Exposed to Silver Nanoparticles. Biomedicines. 2023; 11(3):663. https://doi.org/10.3390/biomedicines11030663
Chicago/Turabian StyleFarag, Mayada R., Haitham G. Abo-Al-Ela, Mahmoud Alagawany, Mahmoud M. Azzam, Mohamed T. El-Saadony, Stefano Rea, Alessandro Di Cerbo, and Doaa S. Nouh. 2023. "Effect of Quercetin Nanoparticles on Hepatic and Intestinal Enzymes and Stress-Related Genes in Nile Tilapia Fish Exposed to Silver Nanoparticles" Biomedicines 11, no. 3: 663. https://doi.org/10.3390/biomedicines11030663