
Risk Factors for Pulmonary Embolism in Individuals Infected with SARS-CoV2—A Single-Centre Retrospective Study

 , , , ,
  ,
,
Abstract
:1. Introduction
2. Materials and Methods
2.1. Study Design and Ethics
2.2. Inclusion and Exclusion Criteria
- ○
- Aged 51 or older;
- ○
- Positive diagnosis of a moderate or severe form of COVID-19, confirmed through a RT-PCR test;
- ○
- Hospitalisation due to acute infection with SARS-CoV2, with at least one of the following comorbidities: hypertension, diabetes, COPD, CAD, heart failure, atrial fibrillation, dyslipidaemia, BMI ≥ 30, and/or cancer history;
- ○
- Development of pulmonary embolism;
- ○
- Vaccination or lack thereof (disregarding what type of vaccine was administered)
- ○
- An age of 50 or below
- ○
- Symptomatic and mild forms of COVID-19 infection;
- ○
- Development of venous thromboembolism.
- ○
- Moderate infection:
- SpO2 ≥ 92%;
- Pulmonary lesions on <50% of the surface (as seen imagistically);
- CRP > 50 mg/dL;
- Twofold or threefold increased ferritin;
- Threefold increased D-dimers;
- Thrombocytopenia with values between 100,000 and 150,000/mcL;
- Lymphopenia with the range 1000–1500/mcL;
- Lactate with values double the normal.
- ○
- Severe infection:
- SpO2 < 90%;
- PaO2/FiO2 ratio ≤ 300 mmHg;
- Respiratory rate over 30 breaths per minute;
- Lung infiltrates on more than 50% of the surface;
- CRP >100 mg/dL
- Increased ferritin, IL-6, and D-dimers (3 to 4 times higher);
- thrombocytopenia (less than 100,000/mcL).
- ○
- First wave: January–June 2020 (Wuhan-Hu-1—NCBI Reference Sequence: NC 045512.2 variant was the predominant strain);
- ○
- Second wave: July–December 2020 (Clade variants S: D614G being the dominant viral strains);
- ○
- Third wave: January–March 2021 (Alpha B.1.1.7 variant);
- ○
- Fourth wave: September–November 2021 (Delta B1217.2 variant);
- ○
- Fifth wave: January–March 2022 (Omicron variant);
- ○
- Sixth wave: April–November 2022 (BA.2 subvariant of Omicron);
- ○
- Seventh wave: December 2022–March 2023 (BA.5 subvariant of Omicron).
2.3. Study Variables
- ○
- Baseline characteristics of the participants, including age, BMI, gender, demographics, smoking status, comorbidities (diabetes, COPD, CAD, heart failure, atrial fibrillation, dyslipidaemia, hypertension, cancer history), COVID-19 vaccination status, and COVID-19 vaccine type;
- ○
- Paraclinical findings such as WBC count, platelets, lymphocytes, GOT, GPT, ALT, ferritin, ERS, CRP, fibrinogen, procalcitonin, D-dimers, and others;
- ○
- Clinical findings and disease outcomes such as signs and symptoms at admission, COVID-19 outcomes, disease severity, duration of hospitalisation, ICU admission and duration, Wells and Pesi scores, O2 supplementation, and mortality.
2.4. Statistical Analysis
3. Results
3.1. Thrombotic Events in COVID-19
3.2. Thrombus Location
3.3. Mortality within the PE Group
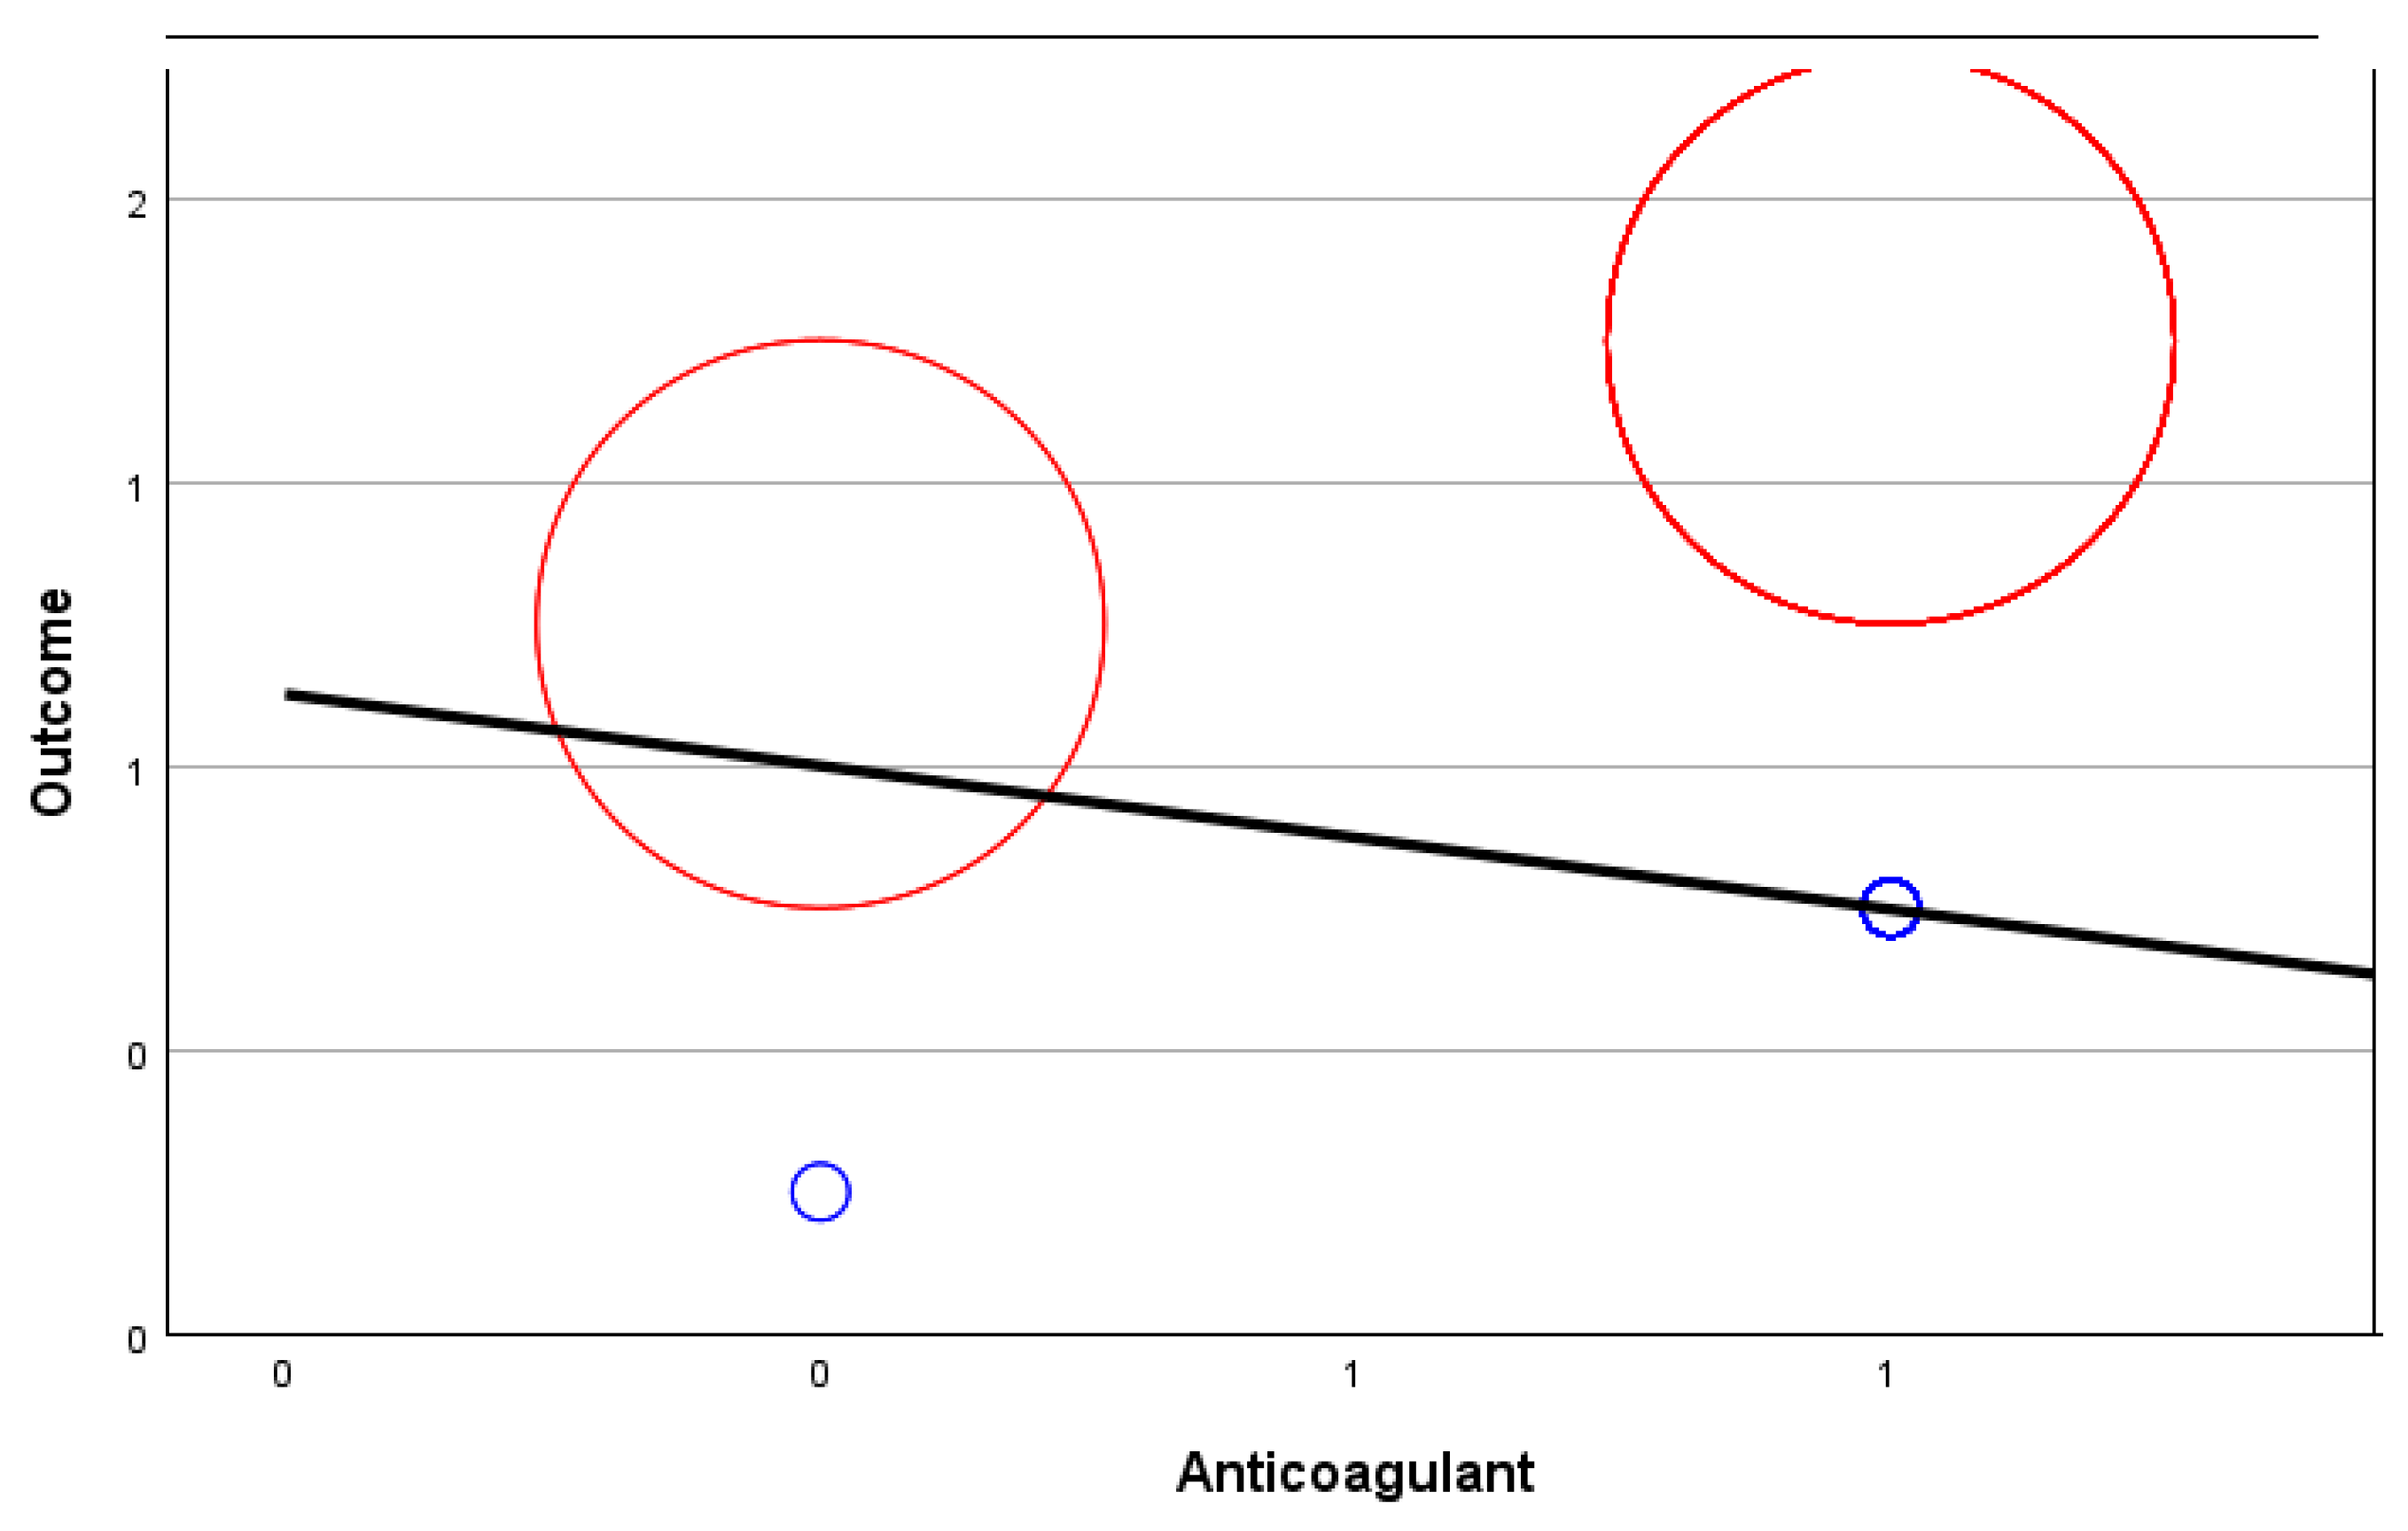
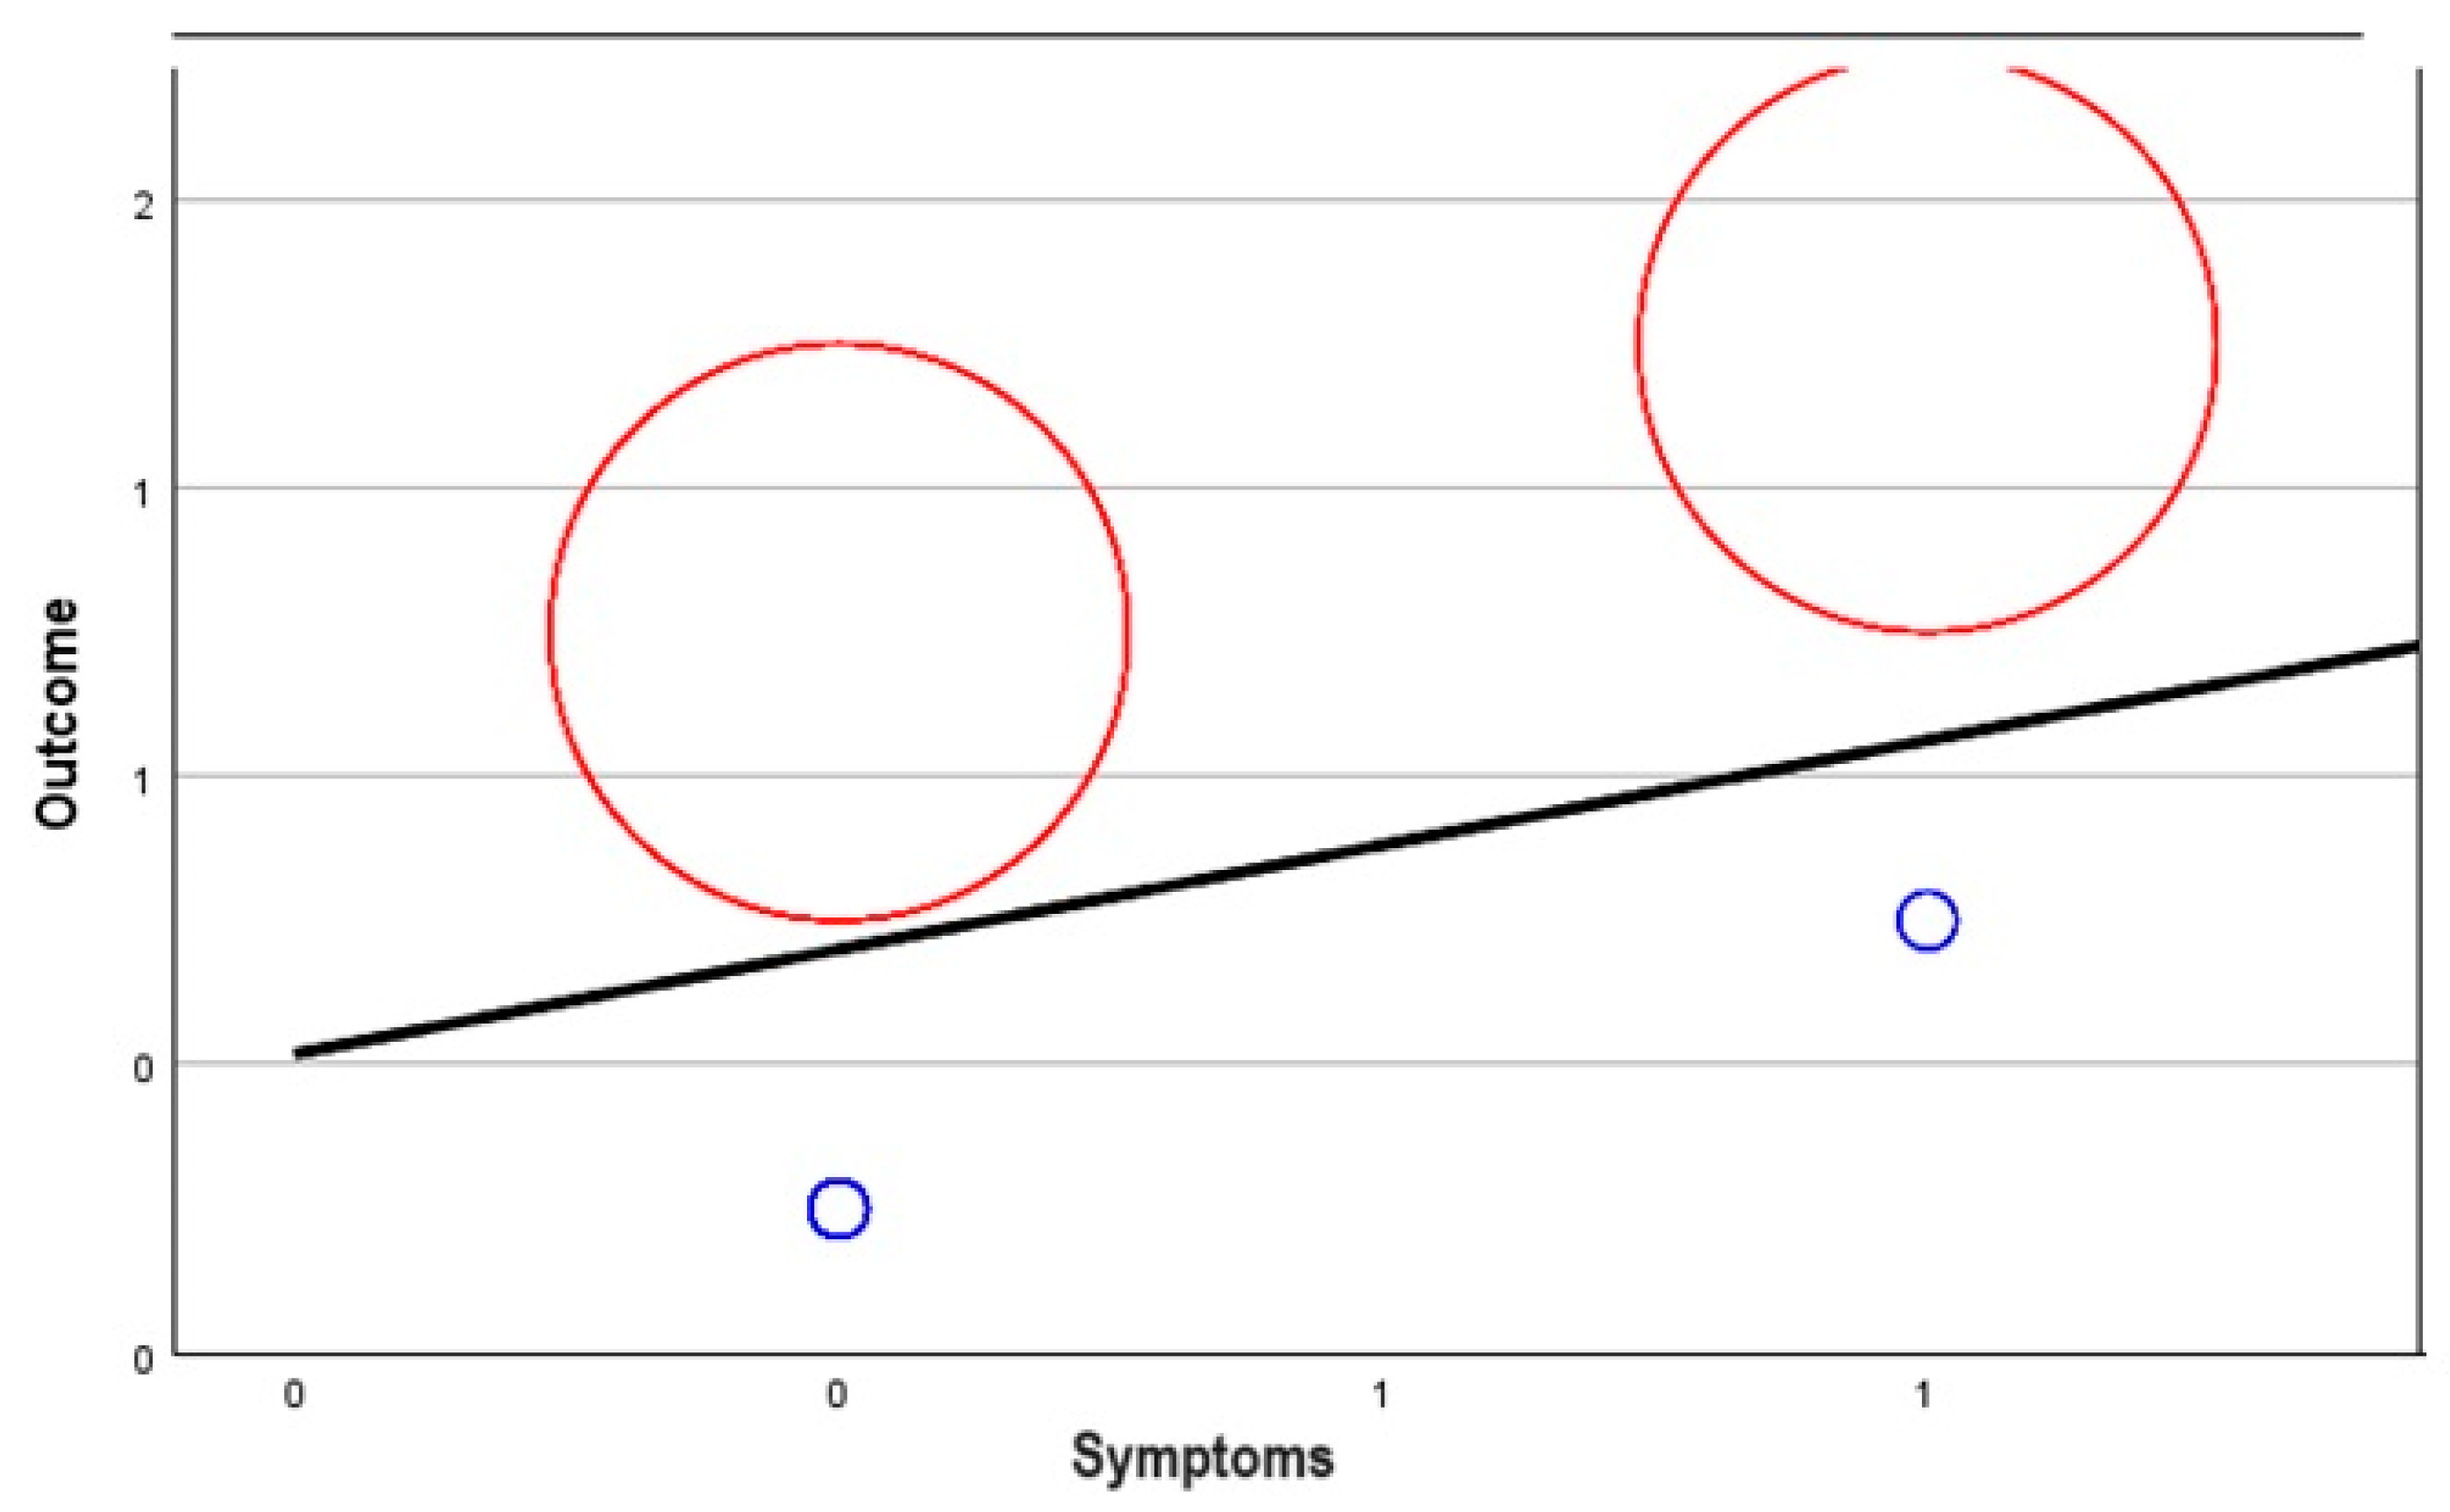
3.4. Statistical Analysis of Other Selected Variables
- ○
- 1 indicates a perfect positive linear relationship;
- ○
- −1 indicates a perfect negative linear relationship;
- ○
- 0 indicates no linear relationship.
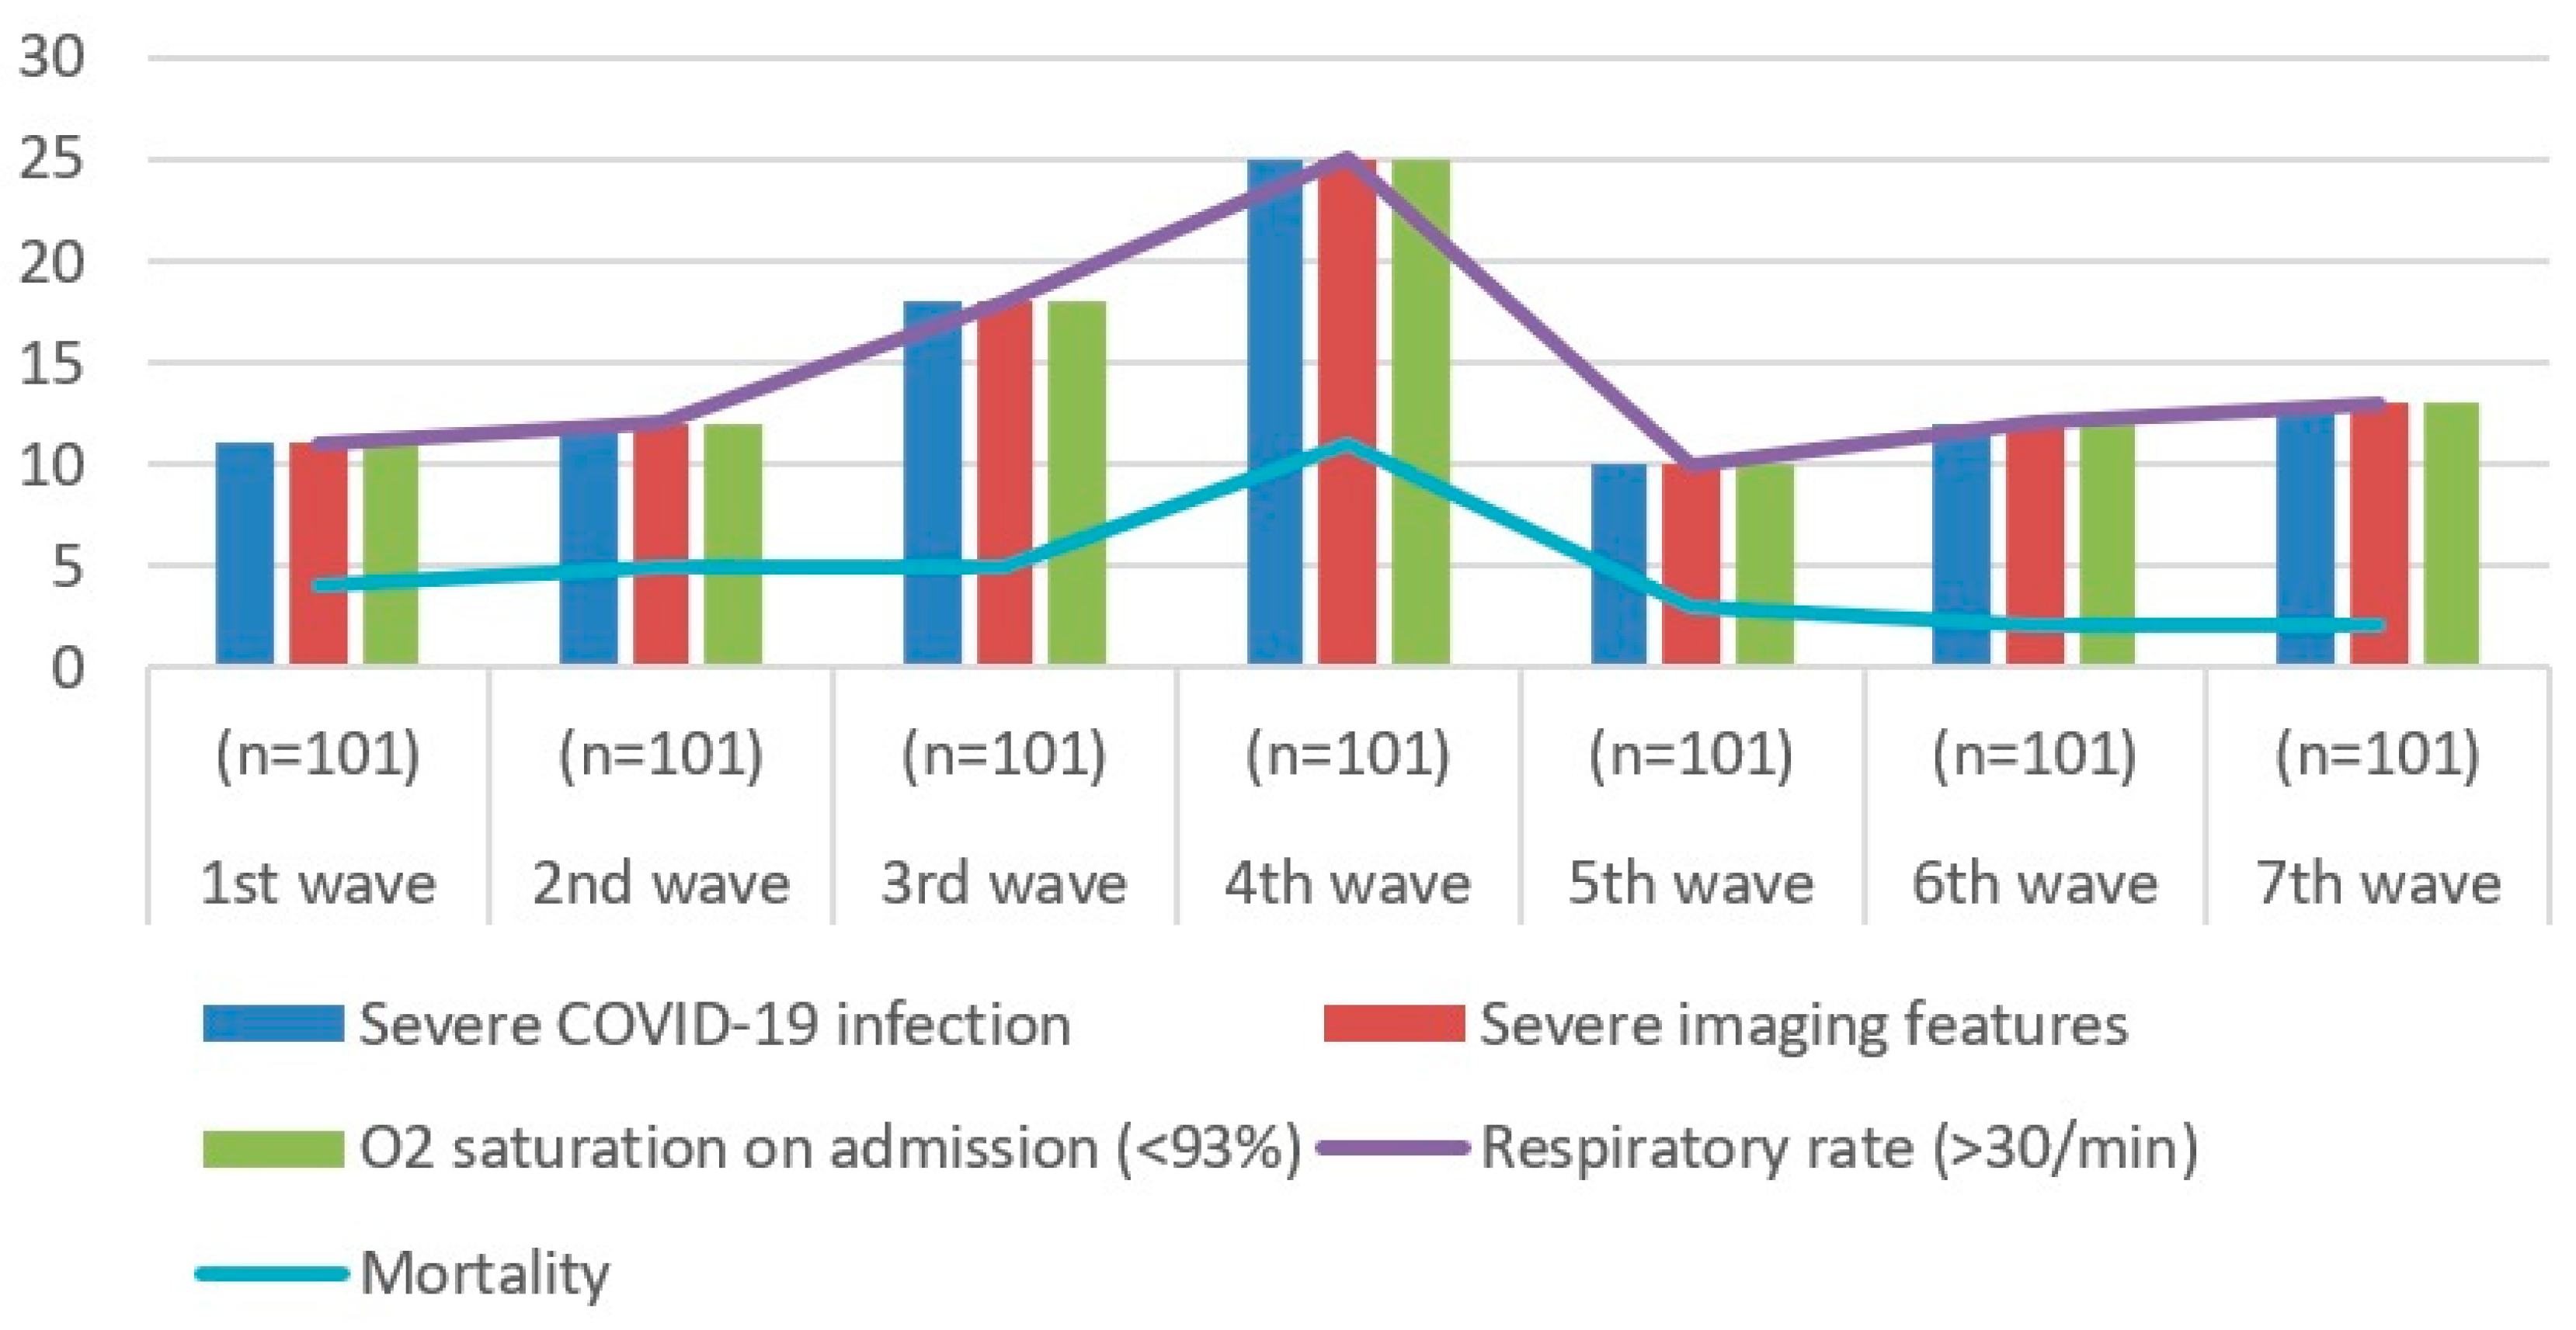
3.5. Comparison of COVID-19 Pandemic Waves for PE Group
4. Discussions
5. Limitations
6. Conclusions
Author Contributions
Funding
Institutional Review Board Statement
Informed Consent Statement
Data Availability Statement
Conflicts of Interest
References
- World Meters. Available online: https://www.worldometers.info/coronavirus/ (accessed on 26 September 2023).
- Leretter, M.T.; Vulcanescu, D.D.; Horhat, F.G.; Matichescu, A.; Rivis, M.; Rusu, L.C.; Roi, A.; Racea, R.; Badea, I.; Dehelean, C.A.; et al. COVID-19: Main findings after a year and half of unease and the proper scientific progress (Review). Exp. Ther. Med. 2022, 23, 424. [Google Scholar] [CrossRef] [PubMed]
- Matsuishi, Y.; Mathis, B.J.; Shimojo, N.; Subrina, J.; Okubo, N.; Inoue, Y. Severe COVID-19 Infection Associated with Endothelial Dysfunction Induces Multiple Organ Dysfunction: A Review of Therapeutic Interventions. Biomedicines 2021, 9, 279. [Google Scholar] [CrossRef]
- Dal Ferro, M.; Bussani, R.; Paldino, A.; Nuzzi, V.; Collesi, C.; Zentilin, L.; Schneider, E.; Correa, R.; Silvestri, F.; Zacchigna, S.; et al. SARS-CoV-2, myocardial injury and inflammation: Insights from a large clinical and autopsy study. Clin. Res. Cardiol. 2021, 110, 1822–1831, Erratum in Clin. Res. Cardiol. 2021, 110, 1694. [Google Scholar] [CrossRef] [PubMed]
- Clerkin, K.J.; Fried, J.A.; Raikhelkar, J.; Sayer, G.; Griffin, J.M.; Masoumi, A.; Jain, S.S.; Burkhoff, D.; Kumaraiah, D.; Rabbani, L.; et al. COVID-19 and Cardiovascular Disease. Circulation 2020, 141, 1648–1655. [Google Scholar] [CrossRef] [PubMed]
- Sakr, Y.; Giovini, M.; Leone, M.; Pizzilli, G.; Kortgen, A.; Bauer, M.; Tonetti, T.; Duclos, G.; Zieleskiewicz, L.; Buschbeck, S.; et al. Pulmonary embolism in patients with coronavirus disease-2019 (COVID-19) pneumonia: A narrative review. Ann. Intensiv. Care 2020, 10, 124. [Google Scholar] [CrossRef] [PubMed]
- Tan, B.K.; Mainbourg, S.; Friggeri, A.; Bertoletti, L.; Douplat, M.; Dargaud, Y.; Grange, C.; Lobbes, H.; Provencher, S.; Lega, J.C. Arterial and venous thromboembolism in COVID-19: A study-level meta-analysis. Thorax 2021, 76, 970–979. [Google Scholar] [CrossRef]
- Liao, S.C.; Shao, S.C.; Chen, Y.T.; Chen, Y.-C.; Hung, M.-J. Incidence and mortality of pulmonary embolism in COVID-19: A systematic review and meta-analysis. Crit. Care 2020, 24, 464. [Google Scholar] [CrossRef] [PubMed]
- Pastori, D.; Cormaci, V.M.; Marucci, S.; Franchino, G.; Del Sole, F.; Capozza, A.; Fallarino, A.; Corso, C.; Valeriani, E.; Menichelli, D.; et al. A Comprehensive Review of Risk Factors for Venous Thromboembolism: From Epidemiology to Pathophysiology. Int. J. Mol. Sci. 2023, 24, 3169. [Google Scholar] [CrossRef] [PubMed]
- Bĕlohlávek, J.; Dytrych, V.; Linhart, A. Pulmonary embolism, part I: Epidemiology, risk factors and risk stratification, pathophysiology, clinical presentation, diagnosis and nonthrombotic pulmonary embolism. Exp. Clin. Cardiol. 2013, 18, 129–138. [Google Scholar]
- Popa, M.F.; Stefanescu, C.; Corici, P.D. Medical-legal identification methods with the aid of cheiloscopy. Rom. J. Leg. Med. 2013, 21, 215–218. [Google Scholar] [CrossRef]
- Deacu, S.; Neculai-Candea, L.; Pricop, S.; Aschie, M.; Mocanu, L.; Popa, M. Vascular Adhesive Peptide-1 (VAP-1) Expression in Wounds—A New Vital Reaction Marker? Rom. J. Leg. Med. 2021, 29, 347–351. [Google Scholar] [CrossRef]
- Cooney, E. For Most Mild Infections, Long Covid Symptoms Clear after a Year, Large Study Finds. STAT. 31 July 2023. Available online: https://www.statnews.com/2023/01/11/mild-infections-long-covid-symptoms-clear-after-a-year-large-study/ (accessed on 11 February 2024).
- Massaro, G.; Lecis, D.; Martuscelli, E.; Chiricolo, G.; Sangiorgi, G.M. Clinical Features and Management of COVID-19-Associated Hypercoagulability. Card. Electrophysiol. Clin. 2022, 14, 41–52. [Google Scholar] [CrossRef] [PubMed]
- Date, K.; Ettelaie, C.; Maraveyas, A. Tissue factor-bearing microparticles and inflammation: A potential mechanism for the development of venous thromboembolism in cancer. J. Thromb. Haemost. 2017, 15, 2289–2299. [Google Scholar] [CrossRef]
- Cut, T.G.; Mavrea, A.; Cumpanas, A.A.; Novacescu, D.; Oancea, C.I.; Bratosin, F.; Marinescu, A.R.; Laza, R.; Mocanu, A.; Pescariu, A.S.; et al. A Retrospective Assessment of Sputum Samples and Antimicrobial Resistance in COVID-19 Patients. Pathogens 2023, 12, 620. [Google Scholar] [CrossRef]
- A New COVID Surge Could Hit the US soon Following European Wave. TODAY.com. Available online: https://www.today.com/health/coronavirus/europe-facing-new-covid-19-wave-us-probably-rcna51855 (accessed on 12 October 2022).
- Althubaiti, A. Sample size determination: A practical guide for health researchers. J. Gen. Fam. Med. 2022, 24, 72–78. [Google Scholar] [CrossRef] [PubMed]
- Pourhoseingholi, M.A.; Vahedi, M.; Rahimzadeh, M. Sample size calculation in medical studies. Gastroenterol. Hepatol. Bed Bench 2013, 6, 14–17. [Google Scholar]
- Charan, J.; Biswas, T. How to calculate sample size for different study designs in medical research? Indian J. Psychol. Med. 2013, 35, 121–126. [Google Scholar] [CrossRef]
- Charan, J.; Kaur, R.; Bhardwaj, P.; Singh, K.; Ambwani, S.; Misra, S. Sample Size Calculation in Medical Research: A Primer. Ann. Natl. Acad. Med. Sci. (India) 2021, 57, 074–081. [Google Scholar] [CrossRef]
- Moser, A.; Korstjens, I. Series: Practical guidance to qualitative research. Part 3: Sampling, data collection and analysis. Eur. J. Gen. Pract. 2017, 24, 9–18. [Google Scholar] [CrossRef] [PubMed]
- Serdar, C.C.; Cihan, M.; Yücel, D.; Serdar, M.A. Sample size, power and effect size revisited: Simplified and practical approaches in pre-clinical, clinical and laboratory studies. Biochem. Med. 2021, 31, 010502. [Google Scholar] [CrossRef]
- Gergel, T.L. Medicine and the individual: Is phenomenology the answer? J. Eval. Clin. Pract. 2012, 18, 1102–1109. [Google Scholar] [CrossRef] [PubMed]
- ORDIN 487 23/03/2020—Portal Legislativ. Available online: https://legislatie.just.ro/Public/DetaliiDocument/224341 (accessed on 12 February 2024).
- World Health Organization. Therapeutics and COVID-19: Living Guideline, 10 November 2023; WHO/2019-nCoV/therapeutics/2023.2; World Health Organization: Geneva, Switzerland, 2023.
- Buletine de Presa—COVID. Available online: https://www.ms.ro/ro/de-interes/buletine-de-presa-covid/ (accessed on 12 February 2024).
- Jarman, A.F.; Mumma, B.E.; Singh, K.S.; Nowadly, C.D.; Maughan, B.C. Crucial considerations: Sex differences in the epidemiology, diagnosis, treatment, and outcomes of acute pulmonary embolism in non-pregnant adult patients. J. Am. Coll. Emerg. Physicians Open 2021, 2, e12378. [Google Scholar] [CrossRef] [PubMed]
- Marshall, A.L.; Bartley, A.C.; Ashrani, A.A.; Pruthi, R.K.; Durani, U.; Gonsalves, W.I.; Kapoor, P.; Hashmi, S.K.; Siddiqui, M.A.; Go, R.S. Sex-based disparities in venous thromboembolism outcomes: A National Inpatient Sample (NIS)-based analysis. Vasc. Med. 2017, 22, 121–127. [Google Scholar] [CrossRef] [PubMed]
- Keller, K.; Rappold, L.; Gerhold-Ay, A.; Hobohm, L.; Hasenfuß, G.; Konstantinides, S.V.; Dellas, C.; Lankeit, M. Sex-specific differences in pulmonary embolism. Thromb. Res. 2019, 178, 173–181. [Google Scholar] [CrossRef] [PubMed]
- Mansour, S.; Alotaibi, G.; Wu, C.; Alsaleh, K.; McMurtry, M.S. Sex disparities in hospitalization and mortality rates for venous thromboembolism. J. Thromb. Thrombolysis 2017, 44, 197–202. [Google Scholar] [CrossRef] [PubMed]
- Ross, S.M. Probability; Elsevier eBooks; Elsevier: Amsterdam, The Netherlands, 2010. [Google Scholar] [CrossRef]
- Roberts, M.R.; Ashrafzadeh, S.; Asgari, M.M. Research Techniques Made Simple: Interpreting Measures of Association in Clinical Research. J. Investig. Dermatol. 2019, 139, 502–511.e1. [Google Scholar] [CrossRef] [PubMed]
- Popescu, I.-M.; Baditoiu, L.M.; Reddy, S.R.; Nalla, A.; Popovici, E.D.; Margan, M.-M.; Anghel, M.; Laitin, S.M.D.; Toma, A.-O.; Herlo, A.; et al. Environmental Factors Influencing the Dynamics and Evolution of COVID-19: A Systematic Review on the Study of Short-Term Ozone Exposure. Healthcare 2023, 11, 2670. [Google Scholar] [CrossRef] [PubMed]
- Popa, M.F.; Enciu, M. Sudden death due to Arrhythmogenic Right Ventricular Dysplasia in young men. Report of two cases. Rom. J. Leg. Med. 2012, 20, 181–184. [Google Scholar] [CrossRef]
- Evensen, L.H.; Isaksen, T.; Braekkan, S.K.; Hansen, J.B. Physical activity and risk of recurrence and mortality after incident venous thromboembolism. J. Thromb. Haemost. 2019, 17, 901–911. [Google Scholar] [CrossRef]
- Fernando, J. The Correlation Coefficient: What It Is, What It Tells Investors. Investopedia. Available online: https://www.investopedia.com/terms/c/correlationcoefficient.asp (accessed on 19 October 2023).
- Mukaka, M.M. Statistics corner: A guide to appropriate use of correlation coefficient in medical research. Malawi Med. J. 2012, 24, 69–71. [Google Scholar]
- Oprita, B.; Davidoiu, A.; Dinu, A.B.; Oprita, R. The Rescue of the Romanian Health System by the Emergency Departments during the Fourth Wave of COVID-19 Pandemic. Life 2022, 12, 1547. [Google Scholar] [CrossRef] [PubMed]
- The Romanian National Institute of Public Health. Available online: https://www.cnscbt.ro/index.php/analiza-cazuri-confirmate-covid19/2785-raport-saptamanal-episaptamana43-2021/file (accessed on 20 December 2023).
- Laza, R.; Lazureanu, V.E.; Musta, V.F.; Nicolescu, N.D.; Vernic, C.; Tudor, A.; Critu, R.; Vilceanu, L.; Paczeyka, R.; Profir, V.B.; et al. COVID-19 Independent Risk Factors for Unfavorable Disease Progression: A Cross-Sectional Study from Romania. Int. J. Gen. Med. 2022, 15, 2025–2036. [Google Scholar] [CrossRef]
- Marza, A.M.; Cindrea, A.C.; Petrica, A.; Stanciugelu, A.V.; Barsac, C.; Mocanu, A.; Critu, R.; Botea, M.O.; Trebuian, C.I.; Lungeanu, D. Non-Ventilated Patients with Spontaneous Pneumothorax or Pneumomediastinum Associated with COVID-19: Three-Year Debriefing across Five Pandemic Waves. J. Pers. Med. 2023, 13, 1497. [Google Scholar] [CrossRef] [PubMed]
- Mindrescu, N.M.; Guja, C.; Jinga, V.; Ispas, S.; Curici, A.; Nelson Twakor, A.; Pantea Stoian, A.M. Interactions between Gut Microbiota and Oral Antihyperglycemic Drugs: A Systematic Review. Int. J. Mol. Sci. 2024, 25, 3540. [Google Scholar] [CrossRef] [PubMed]
- Mocanu, A.; Noja, G.G.; Istodor, A.V.; Moise, G.; Leretter, M.; Rusu, L.-C.; Marza, A.M.; Mederle, A.O. Individual Characteristics as Prognostic Factors of the Evolution of Hospitalized COVID-19 Romanian Patients: A Comparative Observational Study between the First and Second Waves Based on Gaussian Graphical Models and Structural Equation Modeling. J. Clin. Med. 2021, 10, 1958. [Google Scholar] [CrossRef] [PubMed]
- Mocanu, A.; Lazureanu, V.E.; Marinescu, A.R.; Cut, T.G.; Laza, R.; Rusu, L.-C.; Marza, A.M.; Nelson-Twakor, A.; Negrean, R.A.; Popescu, I.-M.; et al. A Retrospective Assessment of Laboratory Findings and Cytokine Markers in Severe SARS-CoV-2 Infection among Patients of Roma Population. J. Clin. Med. 2022, 11, 6777. [Google Scholar] [CrossRef] [PubMed]
- Bikdeli, B.; Madhavan, M.V.; Jimenez, D.; Chuich, T.; Dreyfus, I.; Driggin, E.; Nigoghossian, C.; Ageno, W.; Madjid, M.; Guo, Y.; et al. Global COVID-19 Thrombosis Collaborative Group, Endorsed by the ISTH, NATF, ESVM, and the IUA, Supported by the ESC Working Group on Pulmonary Circulation and Right Ventricular Function. COVID-19 and Thrombotic or Thromboembolic Disease: Implications for Prevention, Antithrombotic Therapy, and Follow-Up: JACC State-of-the-Art Review. J. Am. Coll. Cardiol. 2020, 75, 2950–2973. [Google Scholar] [CrossRef]
- Gąsecka, A.; Borovac, J.A.; Guerreiro, R.A.; Giustozzi, M.; Parker, W.; Caldeira, D.; Chiva-Blanch, G. Thrombotic Complications in Patients with COVID-19: Pathophysiological Mechanisms, Diagnosis, and Treatment. Cardiovasc. Drugs Ther. 2020, 35, 215–229. [Google Scholar] [CrossRef] [PubMed]
- Khanna, A.K.; Khanna, D. Venous Thromboembolism and COVID-19-an Epidemiological Perspective. Indian J. Surg. 2023, 85 (Suppl. S1), 133–140. [Google Scholar] [CrossRef]
- Cuț, T.; Enache, A.; Novacescu, D.; Marinescu, A.; Lazureanu, V.; Paul, C.; Voicu, M.; Stelea, L.; Raluca, D. Postmortem MicroRNA Signatures as Predictive Markers in SARS-CoV-2 Infection. Clin. Lab. 2022, 68, 1142–1149. [Google Scholar] [CrossRef]
- Gorog, D.A.; Storey, R.F.; Gurbel, P.A.; Tantry, U.S.; Berger, J.S.; Chan, M.Y.; Duerschmied, D.; Smyth, S.S.; Parker, W.A.E.; Ajjan, R.A.; et al. Current and novel biomarkers of thrombotic risk in COVID-19: A Consensus Statement from the International COVID-19 Thrombosis Biomarkers Colloquium. Nat. Rev. Cardiol. 2022, 19, 475–495. [Google Scholar] [CrossRef] [PubMed]
- Ahuja, N.; Bhinder, J.; Nguyen, J.; Langan TJr O’Brien-Irr, M.; Montross, B.; Khan, S.; Sharma, A.M.; Harris, L.M. Venous thromboembolism in patients with COVID-19 infection: Risk factors, prevention, and management. Semin. Vasc. Surg. 2021, 34, 101–116. [Google Scholar] [CrossRef] [PubMed]
- Montani, D.; Günther, S.; Dorfmüller, P.; Perros, F.; Girerd, B.; Garcia, G.; Jaïs, X.; Savale, L.; Artaud-Macari, E.; Price, L.C.; et al. Pulmonary arterial hypertension. Orphanet J. Rare Dis. 2013, 8, 97. [Google Scholar] [CrossRef] [PubMed]
- Lannan, K.L.; Phipps, R.P.; White, R.J. Thrombosis, platelets, microparticles and PAH: More than a clot. Drug Discov. Today 2014, 19, 1230–1235. [Google Scholar] [CrossRef] [PubMed]
- Austin, E.D.; Kawut, S.M.; Gladwin, M.T.; Abman, S.H. Pulmonary hypertension: NHLBI Workshop on the Primary Prevention of Chronic Lung Diseases. Ann. Am. Thorac. Soc. 2014, 11 (Suppl. S3), S178–S185. [Google Scholar] [CrossRef] [PubMed]
- Tudoran, C.; Tudoran, M.; Lazureanu, V.E.; Marinescu, A.R.; Cut, T.G.; Oancea, C.; Pescariu, S.A.; Pop, G.N. Factors Influencing the Evolution of Pulmonary Hypertension in Previously Healthy Subjects Recovering from a SARS-CoV-2 Infection. J. Clin. Med. 2021, 10, 5272. [Google Scholar] [CrossRef] [PubMed]
- Swinkels, M.; Rijkers, M.; Voorberg, J.; Vidarsson, G.; Leebeek, F.W.G.; Jansen, A.J.G. Emerging Concepts in Immune Thrombocytopenia. Front. Immunol. 2018, 9, 880. [Google Scholar] [CrossRef]
- Kobayashi, T.; Shigeta, A.; Terada, J.; Tanabe, N.; Sugiura, T.; Sakao, S.; Taniguchi, K.; Oto, T.; Tatsumi, K. Severe thrombocytopenia in patients with idiopathic pulmonary arterial hypertension provided several strategies for lung transplantation. Pulm. Circ. 2020, 10, 2045894020969103. [Google Scholar] [CrossRef] [PubMed]
- Johnson, S.R.; Granton, J.T.; Tomlinson, G.A.; Grosbein, H.A.; Le, T.; Lee, P.; Seary, M.E.; Hawker, G.A.; Feldman, B.M. Warfarin in systemic sclerosis-associated and idiopathic pulmonary arterial hypertension. A Bayesian approach to evaluating treatment for uncommon disease. J. Rheumatol. 2012, 39, 276–285. [Google Scholar] [CrossRef]
- Cascella, M.; Rajnik, M.; Aleem, A.; Dulebohn, S.; Di Napoli, R. Features, Evaluation, and Treatment of Coronavirus (COVID-19). In StatPearls [Internet]; StatPearls Publishing: Petersburg, FL, USA, 2024. Available online: https://www.ncbi.nlm.nih.gov/books/NBK554776/ (accessed on 18 August 2023).
- Robertson, L.; Kesteven, P.; McCaslin, J.E. Oral direct thrombin inhibitors or oral factor Xa inhibitors for the treatment of pulmonary embolism. Cochrane Database Syst. Rev. 2015, 2015, CD010957. [Google Scholar] [CrossRef]
- Saluk-Bijak, J.; Dziedzic, A.; Bijak, M. Pro-Thrombotic Activity of Blood Platelets in Multiple Sclerosis. Cells 2019, 8, 110. [Google Scholar] [CrossRef] [PubMed]
- Mocanu, A.; Lazureanu, V.E.; Laza, R.; Marinescu, A.R.; Cut, T.G.; Sincaru, S.V.; Marza, A.M.; Popescu, I.M.; Herlo, L.F.; Nelson-Twakor, A.; et al. Laboratory Findings and Clinical Outcomes of ICU-admitted COVID-19 Patients: A Retrospective Assessment of Particularities Identified among Romanian Minorities. J. Pers. Med. 2023, 13, 195. [Google Scholar] [CrossRef] [PubMed]
- Mocanu, A.; Lazureanu, V.; Cut, T.; Laza, R.; Musta, V.; Nicolescu, N.; Marinescu, A.; Nelson-Twakor, A.; Dumache, R.; Mederle, O. Angiocatheter Decompression on a COVID-19 Patient with severe Pneumonia, Pneumothorax, and Subcutaneous Emphysema. Clin. Lab. 2022, 68, 2403–2412. [Google Scholar] [CrossRef] [PubMed]
- Zamanian, R.T.; Kudelko, K.T.; Sung, Y.K.; Perez, V.J.; Liu, J.; Spiekerkoetter, E. Current clinical management of pulmonary arterial hypertension. Circ. Res. 2014, 115, 131–147. [Google Scholar] [CrossRef] [PubMed]
- Condliffe, R.; Kiely, D.G.; Peacock, A.J.; Corris, P.A.; Gibbs, J.S.; Vrapi, F.; Das, C.; Elliot, C.A.; Johnson, M.; DeSoyza, J.; et al. Connective tissue disease-associated pulmonary arterial hypertension in the modern treatment era. Am. J. Respir. Crit. Care Med. 2009, 179, 151–157. [Google Scholar] [CrossRef] [PubMed]
- Hotoleanu, C. Association between obesity and venous thromboembolism. Med. Pharm. Rep. 2020, 93, 162–168. [Google Scholar] [CrossRef] [PubMed]
- McLendon, K.; Goyal, A.; Attia, M. Deep Venous Thrombosis Risk Factors. In StatPearls [Internet]; StatPearls Publishing: Petersburg, FL, USA, 2023. Available online: https://www.ncbi.nlm.nih.gov/books/NBK470215/ (accessed on 17 March 2023).
- Senst, B.; Tadi, P.; Basit, H.; Jan, A. Hypercoagulability. In StatPearls [Internet]; StatPearls Publishing: Petersburg, FL, USA, 2023. Available online: https://www.ncbi.nlm.nih.gov/books/NBK538251/ (accessed on 22 August 2023).
- Hirsh, J.; Hoak, J. Management of Deep Vein Thrombosis and Pulmonary Embolism. Circulation 1996, 93, 2212–2245. [Google Scholar] [CrossRef]
- Enache, A.; Ciocan, V.; Muresan, C.O.; Cut, T.G.; Novacescu, D.; Paul, C.; Andreescu, N.; Mihailescu, A.; Raica, M.; Dumache, R. Postmortem Documentation of SARS-CoV-2 in Utero and Postpartum Transmission, through Amniotic Fluid, Placental, and Pulmonary Tissue RT-PCR. Appl. Sci. 2021, 11, 9505. [Google Scholar] [CrossRef]
- Zakai, N.A.; McClure, L.A.; Judd, S.E.; Safford, M.M.; Folsom, A.R.; Lutsey, P.L.; Cushman, M. Racial and regional differences in venous thromboembolism in the United States in 3 cohorts. Circulation 2014, 129, 1502–1509. [Google Scholar] [CrossRef]
- Sample Size, Power and Effect Size Revisited: Simplified and Practical Approaches in Pre-Clinical, Clinical and Laborat. Available online: https://ouci.dntb.gov.ua/en/works/4gGLPxB4/ (accessed on 11 February 2024).


| All Patients | Control Group | PE Group | p-Value | |
|---|---|---|---|---|
| Number of participants | 420 | 319 | 101 | |
| Age | ||||
| Mean ± SD | 69.34 ± 16.09 | 67.47 ± 15.52 | 71.86 ± 13.27 | 0.329 |
| Age group (%) | ||||
| 51–60 | 124 (29.52%) | 99 (31.03%) | 25 (24.75%) | <0.001 |
| 61–70 | 138 (32.85%) | 105 (32.91%) | 33 (32.67%) | <0.001 |
| ≥70 | 158 (37.61%) | 115 (36.05%) | 43 (42.57%) | <0.001 |
| Male sex | 223 (53%) | 168 (52.66%) | 55 (55.45%) | <0.001 |
| Geographical distribution | ||||
| Urban | 271 (64.52%) | 210 (65.83%) | 61 (60.39%) | 0.002 |
| Rural | 149 (35.47%) | 109 (34.17%) | 40 (39.61%) | 0.026 |
| COVID-19 vaccination status | ||||
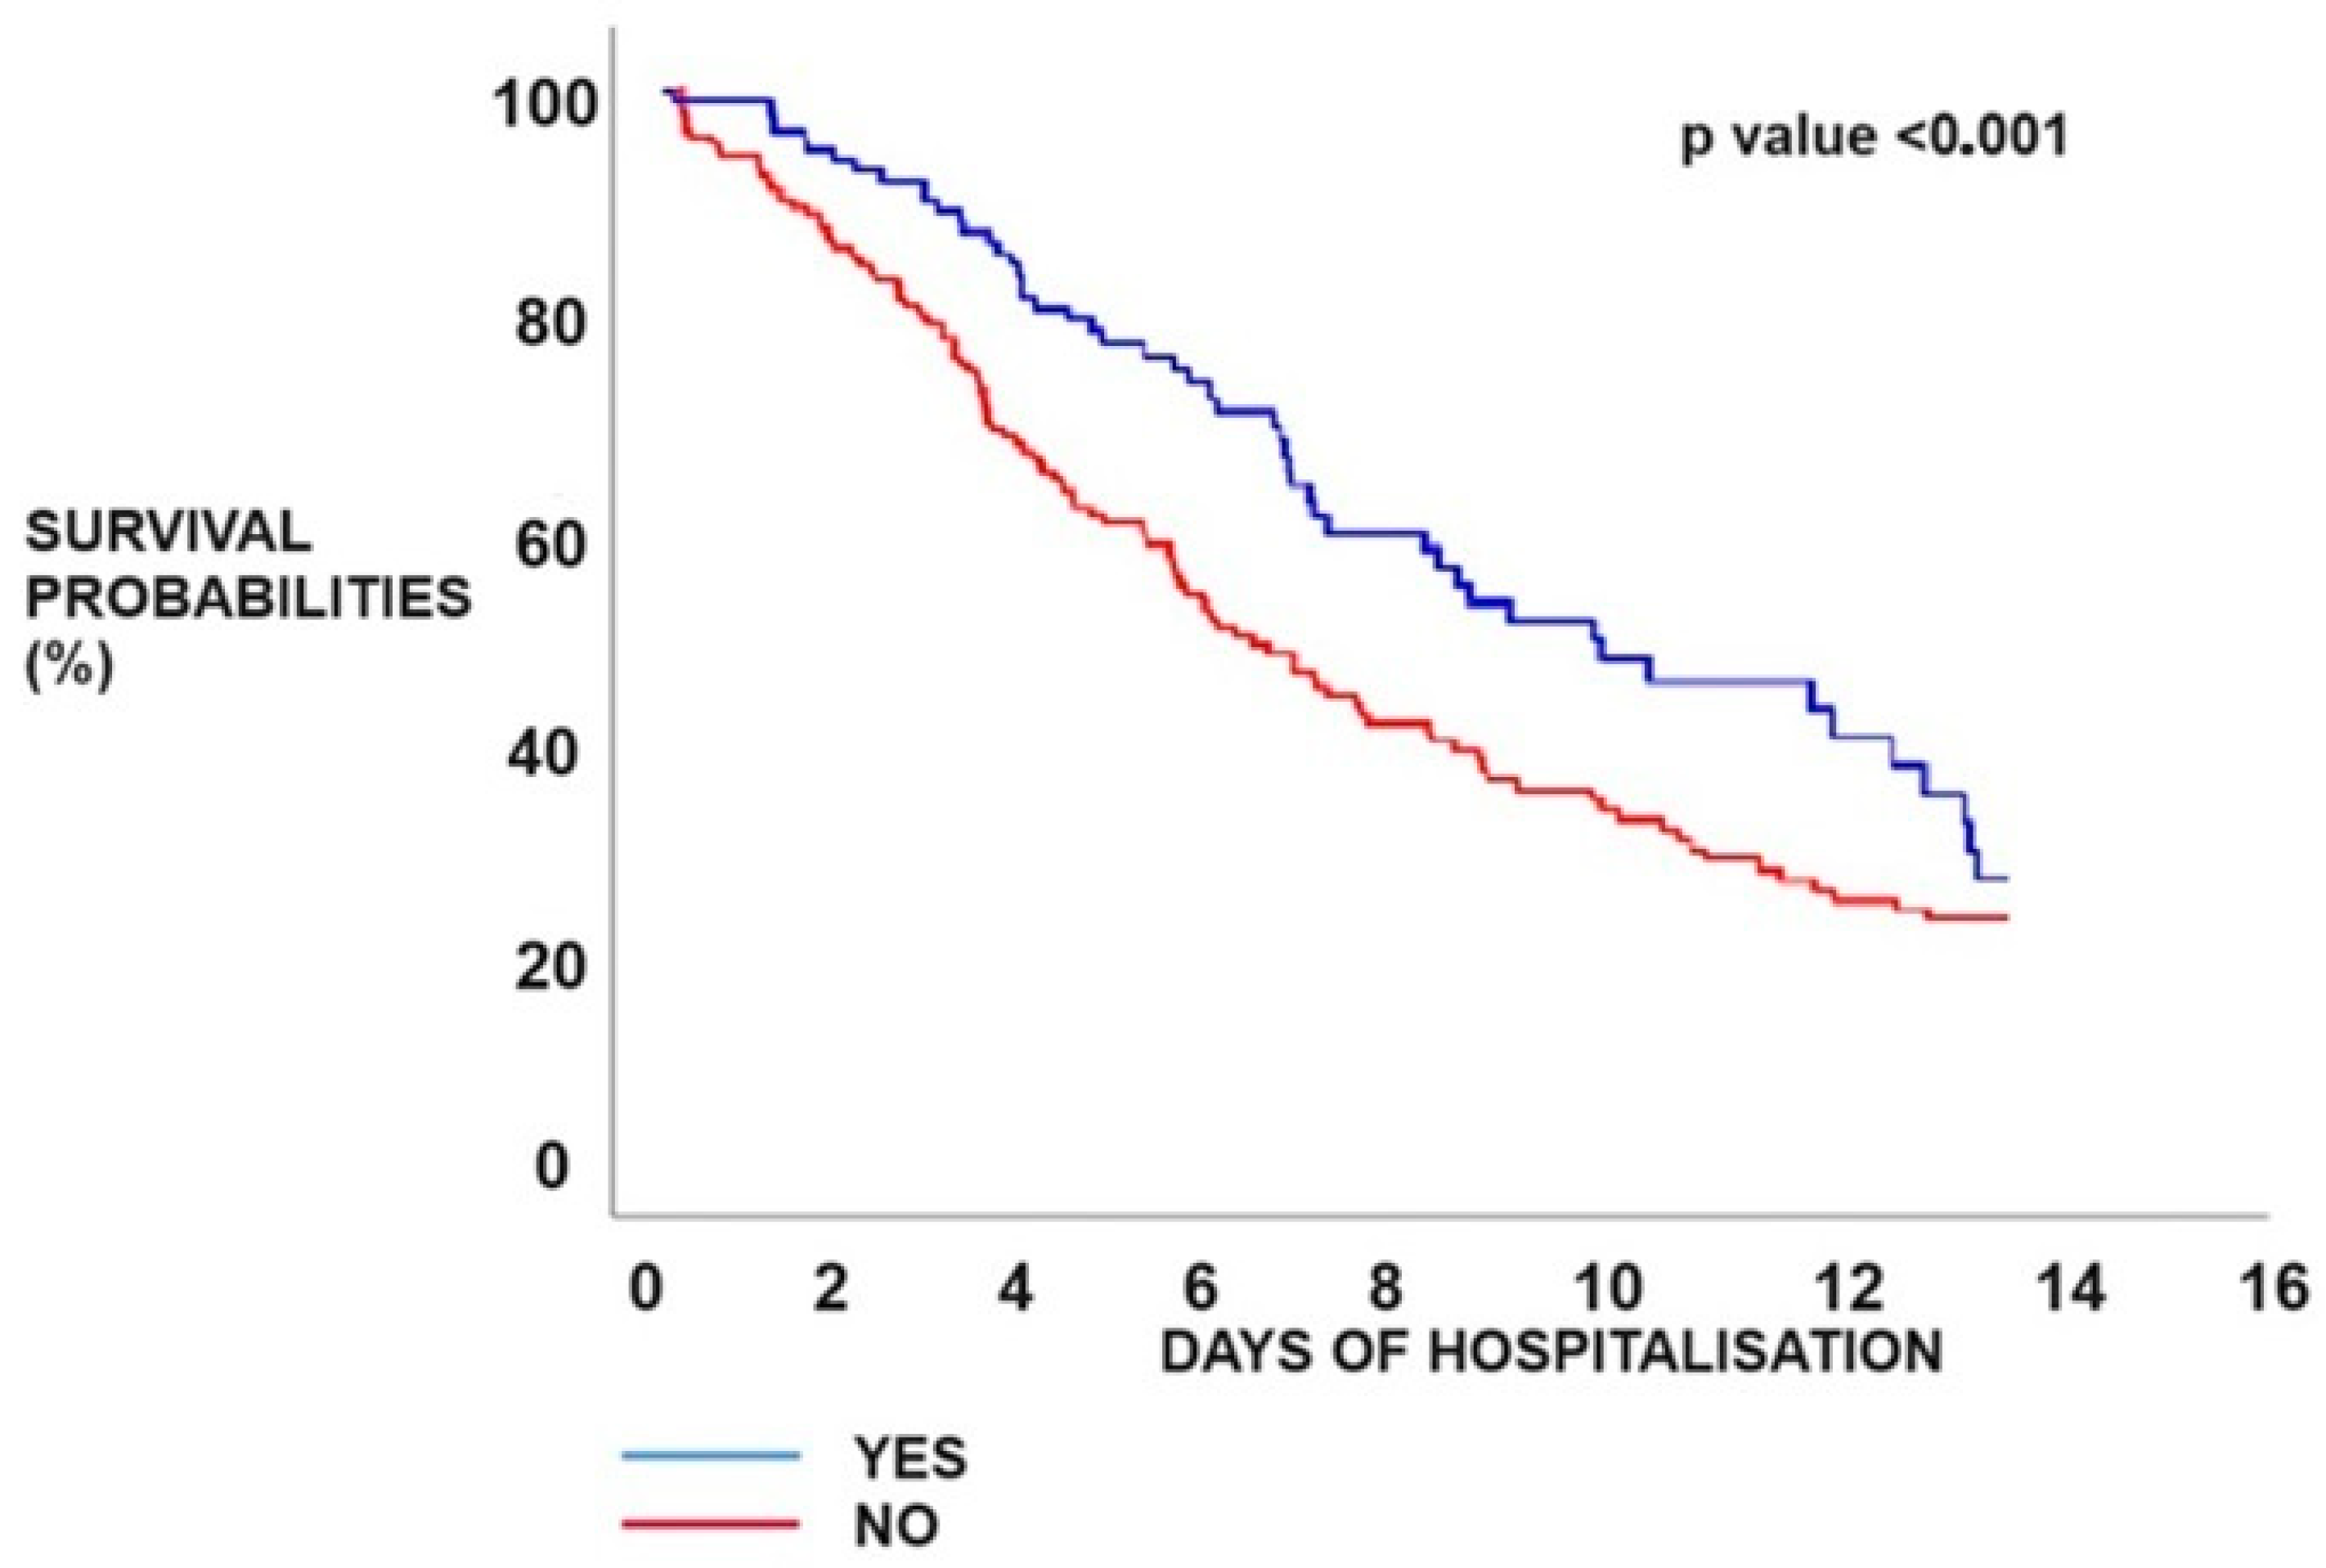
| YES | 194 (46.1%) | 172 (53.9%) | 22 (21.7%) | <0.001 |
| NO | 226 (53.8%) | 147 (46.1%) | 79 (78.2%) | <0.001 |
| COVID-19 vaccine type | ||||
| Pfizer BioNTech | 120 (61,86%) | 106 (61.7%) | 14 (63.6%) | 0.007 |
| Moderna | 51 (26.29%) | 46 (26.7%) | 5 (22.7%) | 0.006 |
| Janssen | 23 (11.85%) | 20 (11.6%) | 3 (13.7%) | 0.002 |
| ICU admission | 45 (10.71%) | 25 (7.8%) | 20 (19.8%) | 0.006 |
| Comorbidities | ||||
| Hypertension | 258 (61.42%) | 194 (60.81%) | 64 (63.36%) | 0.032 |
| Diabetes | 169 (40.23%) | 106 (33.22%) | 63 (62.37%) | 0.173 |
| Smoker | 215 (51.19%) | 162 (50.78%) | 53 (52.47%) | 0.055 |
| COPD | 54 (12.85%) | 39 (12.22%) | 15 (14.85%) | 0.021 |
| CAD | 70 (16.66%) | 51 (15.98%) | 19 (18.81%) | 0.144 |
| Heart failure | 81 (19.28%) | 57 (17.86%) | 24 (23.76%) | 0.071 |
| Atrial fibrillation | 53 (12.61%) | 36 (11.28%) | 17 (16.83%) | 0.005 |
| Dyslipidaemia | 148 (35.23%) | 105 (32.91%) | 43 (42.57%) | 0.012 |
| BMI ≥ 30 | 205 (49.04%) | 137 (42.94%) | 69 (68.31%) | 0.007 |
| Cancer history | 48 (11.42%) | 35 (10.97%) | 13 (12.87%) | 0.014 |
| Medication | ||||
| ACE-inhibitors | 76 (18.09%) | 51 (15.98%) | 25 (24.7%) | 0.031 |
| ARBs | 59 (14.04%) | 48 (13.75%) | 11 (10.89%) | 0.053 |
| Aspirin | 53 (12.61%) | 46 (14.42%) | 7 (6.9%) | 0.165 |
| Statins | 53 (12.61%) | 31 (12.85%) | 22 (21.78%) | 0.002 |
| Anticoagulant | 62 (14.76%) | 58 (18.18%) | 4 (3.9%) | 0.024 |
| Antiplatelet agents | 66 (15.71%) | 64 (20.06%) | 2 (1.9%) | 0.081 |
| Antihypertensives | 204 (48.57%) | 153 (47.96%) | 51 (50.49%) | 0.003 |
| Diuretics | 196 (46.66%) | 148 (46.39%) | 48 (47.5%) | 0.006 |
| Calcium channel blockers | 215 (51.1%) | 162 (50.78%) | 53 (52.47%) | 0.024 |
| Antiarrhythmics | 45 (10.71%) | 31 (9.7%) | 14 (13.86%) | 0.161 |
| Antidiabetics | 158 (37.61%) | 101 (31.66%) | 57 (56.43%) | 0.059 |
| Remdesivir | 338 (80.47%) | 257 (80.56%) | 81 (80.19%) | 0.084 |
| Favipiravir | 66 (15.71%) | 46 (13.47%) | 20 (19.80%) | 0.003 |
| Tocilizumab | 80 (19.04%) | 67 (21%) | 13 (12.87%) | 0.005 |
| Anakira | 137 (32.61%) | 102 (31.97%) | 35 (34.65%) | 0.071 |
| Dexamethasone | 276 (65.71%) | 223 (69.9%) | 53 (52.47%) | 0.612 |
| Actilyse | 6 (1.4%) | 0 | 6 (5.94%) | 0.001 |
| Nadroparin | 203 (48.33%) | 149 (46.7%) | 54 (53.46%) | 0.412 |
| Heparins | 60 (14.28%) | 55 (17.24%) | 5 (4.9%) | 0.004 |
| Enoxaparina | 152 (36.19%) | 129 | 23 | 0.053 |
| PaO2/FiO2 [median] | 313 [155–379] | 328 [284–379] | 254 [155–309] | <0.001 |
| Laboratory findings (mean ± SD; [median]) | ||||
| WBC (×1000/mm3) | 8.9 [1–32] | 8.5 [1.6–32] | 9.6 [1–28] | 0.344 |
| PLT (×1000/mm3) | 196 [11–682] | 165 [11–440] | 228 [30–682] | 0.007 |
| Limfocytes | 974 [150–3462] | 1100 [614–3462] | 780 [150–2230] | 0.249 |
| Neutrofils | 5967 [1087–27,330] | 4422 [1087–11,452] | 7745 [1700–27,330] | 0.172 |
| Creatinine (mg/dL) | 1.71 ± 8.85 | 2.26 ± 11.77 | 1.01 ± 0.49 | 0.483 |
| Total proteins | 6 [3.3–7.3] | 5.8 [5.1–7.3] | 6.3 [3.3–7.1] | 0.264 |
| Na (mmol/L) | 135 [0.78–154] | 134 [0.78–154] | 135.5 [125–149] | 0.497 |
| K (mmol/L) | 4.18 [2.7–6.36] | 4.21 [2.98–6.36] | 4.1 [2.7–5.7] | 0.410 |
| Glycemia (mg/dL) | 144 [57–501] | 152 [57–501] | 137 [68–423] | 0.452 |
| AST (U/L) | 34 [8.8–321] | 34 [8.8–321] | 34 [11–213] | 0.009 |
| ALT (U/L) | 38 [5–347] | 37 [5–347] | 44.5 [6–294] | 0.007 |
| GGT | 65 [24–372] | 68 [26–372] | 66 [24–364] | 0.055 |
| Procalcitonin | 0.4 [0.07–15] | 0.58 [0.09–15] | 0.3 [0.07–10] | 0.013 |
| CRP (mg/L) | 90.5 [0.03–538] | 70.5 [0.03–538] | 114 [24–433] | 0.029 |
| ESR (mm/h) | 76 [10–205] | 78 [11–205] | 75 [10–200] | 0.162 |
| D-dimer (ng/mL) | 2765 [211–19,000] | 2431 [211–5880] | 3100 [790–19,000] | 0.175 |
| Ferritine (ng/mL) | 884 [111–5600] | 780 [111–4828] | 890 [120–5600] | 0.036 |
| Fibrinogen | 6.0 [4.79–8.35] | 5.94 [4.79–6.91] | 6.7 [4.8–8.35] | 0.080 |
| Albumin (g/dL) | 3.51 [2.01–5.9] | 3.3 [2.01–5.4] | 3.7 [2.43–5.9] | 0.009 |
| IL6 | 77 [6–5600] | 78 [6.6–5600] | 76 [6–5500] | 0.006 |
| LDH units/L | 348 [135–2634] | 336 [135–2634] | 391 [156–2405] | 0.173 |
| LDL | 205 [78–376] | 201 [78–301] | 221 [91–376] | 0.062 |
| HDL | 28 [22–50] | 32 [24–50] | 24 [22–49] | 0.008 |
| Triglycerides | 224 [98–521] | 213 [98–402] | 265 [101–521] | 0.005 |
| Lactate | 2.7 [0.4–4.7] | 2.4 [0.4–4.1] | 3.2 [0.6–4.7] | 0.094 |
| Cholinesterase | 5224 [4288–9345] | 5230 [4389–9345] | 5211 [4288–9297] | 0.274 |
| Alkaline phosphatases | 141 [50–162] | 134 [50–151] | 145 [75–162] | 0.083 |
| aPTT sec. | 39.4 [26.5–60.2] | 38.8 [26.5–51.1] | 41.2 [27.3–60.2] | 0.113 |
| INR | 1.11 [1.3–3.2] | 1.9 [1.5–2.5] | 2.4 [1.3–3.2] | 0.244 |
| Symptoms | ||||
| Digestive symptoms | 45 (10.71%) | 27 (8.46%) | 18 (17.82%) | 0.009 |
| Anosmia | 81 (19.28%) | 65 (20.37%) | 16 (15.84%) | 0.005 |
| Ageusia | 102 (24.28%) | 81 (25.39%) | 21 (20.79%) | 0.053 |
| Fatigue | 350 (83.33%) | 274 (85.89%) | 76 (75.24%) | 0.061 |
| Dyspnoea | 234 (55.71%) | 165 (51.72%) | 69 (69.31%) | 0.006 |
| Confusion | 26 (6.19%) | 15 (4.7%) | 11 (10.89%) | 0.071 |
| Headache | 290 (70.47) | 281 (88.08%) | 15 (14.85%) | 0.008 |
| Fever | 248 (59.04%) | 179 (56.11%) | 69 (68.3%) | 0.031 |
| Cough | 266 (63.33%) | 195 (61.12%) | 71 (70.29%) | 0.041 |
| Clinical outcomes | ||||
| Moderate COVID-19 | 228 (54.29%) | 198 (62.07%) | 30 (29.70%) | <0.001 |
| Severe COVID-19 | 192 (45.71%) | 121 (37.93%) | 71 (70.29%) | 0.071 |
| Severe imaging features (CT) | 128 (30.4%) | 88 (27.58%) | 40 (39.6%) | 0.003 |
| Mean duration of hospital stay | 13.4 ± 3.6 | 12.5 ± 3.1 | 14.1 ± 3.8 | 0.064 |
| ICU admissions | 46 (10.95%) | 25 (7.8%) | 21 (20.79%) | 0.021 |
| Mean duration from hospital admission to ICU admission | 4.9 ± 2.1 | 5.1 ± 2.2 | 4.7 ± 1.3 | 0.025 |
| Median duration of ICU stay | 4.4 ± 1.9 | 4.1 ± 1.3 | 5.5 ± 2.1 | 0.031 |
| Intubation | 45 (10.71%) | 25 (7.8%) | 20 (19.8%) | 0.006 |
| Wells score | - | - | 1.34 ± 1.68 | <0.001 |
| Pessi score | - | - | 3.5 ± 1.03 | <0.001 |
| O2 supplementation | 288 (68.57%) | 204 (63.94%) | 84 (83.16%) | 0.322 |
| Mortality | 90 (21.42%) | 58 (18.18%) | 32 (31.68%) | <0.001 |
| Hypertension | Obesity | ||
| Odds ratio | 1.1145 | Odds ratio | 2.8645 |
| 95% CI: | 0.7015 to 1.7708 | 95% CI: | 1.7828 to 4.6025 |
| z statistic | 0.459 | z statistic | 4.350 |
| Significance level | p = 0.646 | Significance level | p < 0.001 |
| Neoplasm | Diabetes | ||
| Odds ratio | 1.1987 | Odds ratio | 3.3314 |
| 95% CI: | 0.6073 to 2.3662 | 95% CI: | 2.0923 to 5.3044 |
| z statistic | 0.522 | z statistic | 5.071 |
| Significance level | p = 0.601 | Significance level | p < 0.001 |
| COPD | Dyslipidemia | ||
| Odds ratio | 1.2522 | Odds ratio | 3.6799 |
| 95% CI: | 0.6585 to 2.3811 | 95% CI: | 2.3013 to 5.8844 |
| z statistic | 0.686 | z statistic | 5.440 |
| Significance level | p = 0.492 | Significance level | p < 0.001 |
| Thrombus Location | |||||
|---|---|---|---|---|---|
| Central (n = 6) | Lobar (n = 20) | Segmental (n = 51) | Peripheral (n = 25) | p-Value | |
| Age | 66.5 ± 8.03 | 69.65 ± 9.24 | 70.44 ± 9.44 | 68.6 ± 10.06 | <0.001 |
| Male | 50% | 60% | 51% | 56% | - |
| Hypertension | 9% | 28.5% | 37.5% | 25% | - |
| COPD | 13.3% | 40% | 20% | 26.7% | - |
| Obesity | 2.5 | 25.5% | 46.5% | 25.5% | - |
| Cancer | 7% | 13% | 47% | 33% | - |
| Diabetes | 0 | 25.3% | 49.4% | 25.3% | - |
| Dyslipidaemia | 9.3% | 21.5% | 44.6% | 24.6% | - |
| PLT (×1000/mm3) | 194 ± 111.6 | 237.7 ± 126.8 | 243.1 ± 122.4 | 238.2 ± 108.4 | <0.001 |
| D-dimers | 4183.3 ± 2934.09 | 5888 ± 3411.92 | 4026.7 ± 3577.55 | 3126.9 ± 2317.5 | 0.033 |
| Pesi | 3.8 ± 1.32 | 3.75 ± 0.71 | 3.52 ± 1.14 | 3.52 ± 0.96 | <0.001 |
| Wells | 1.6 ± 3.4 | 1.2 ± 1.15 | 1.35 ± 1.81 | 1.34 ± 1.24 | 0.160 |
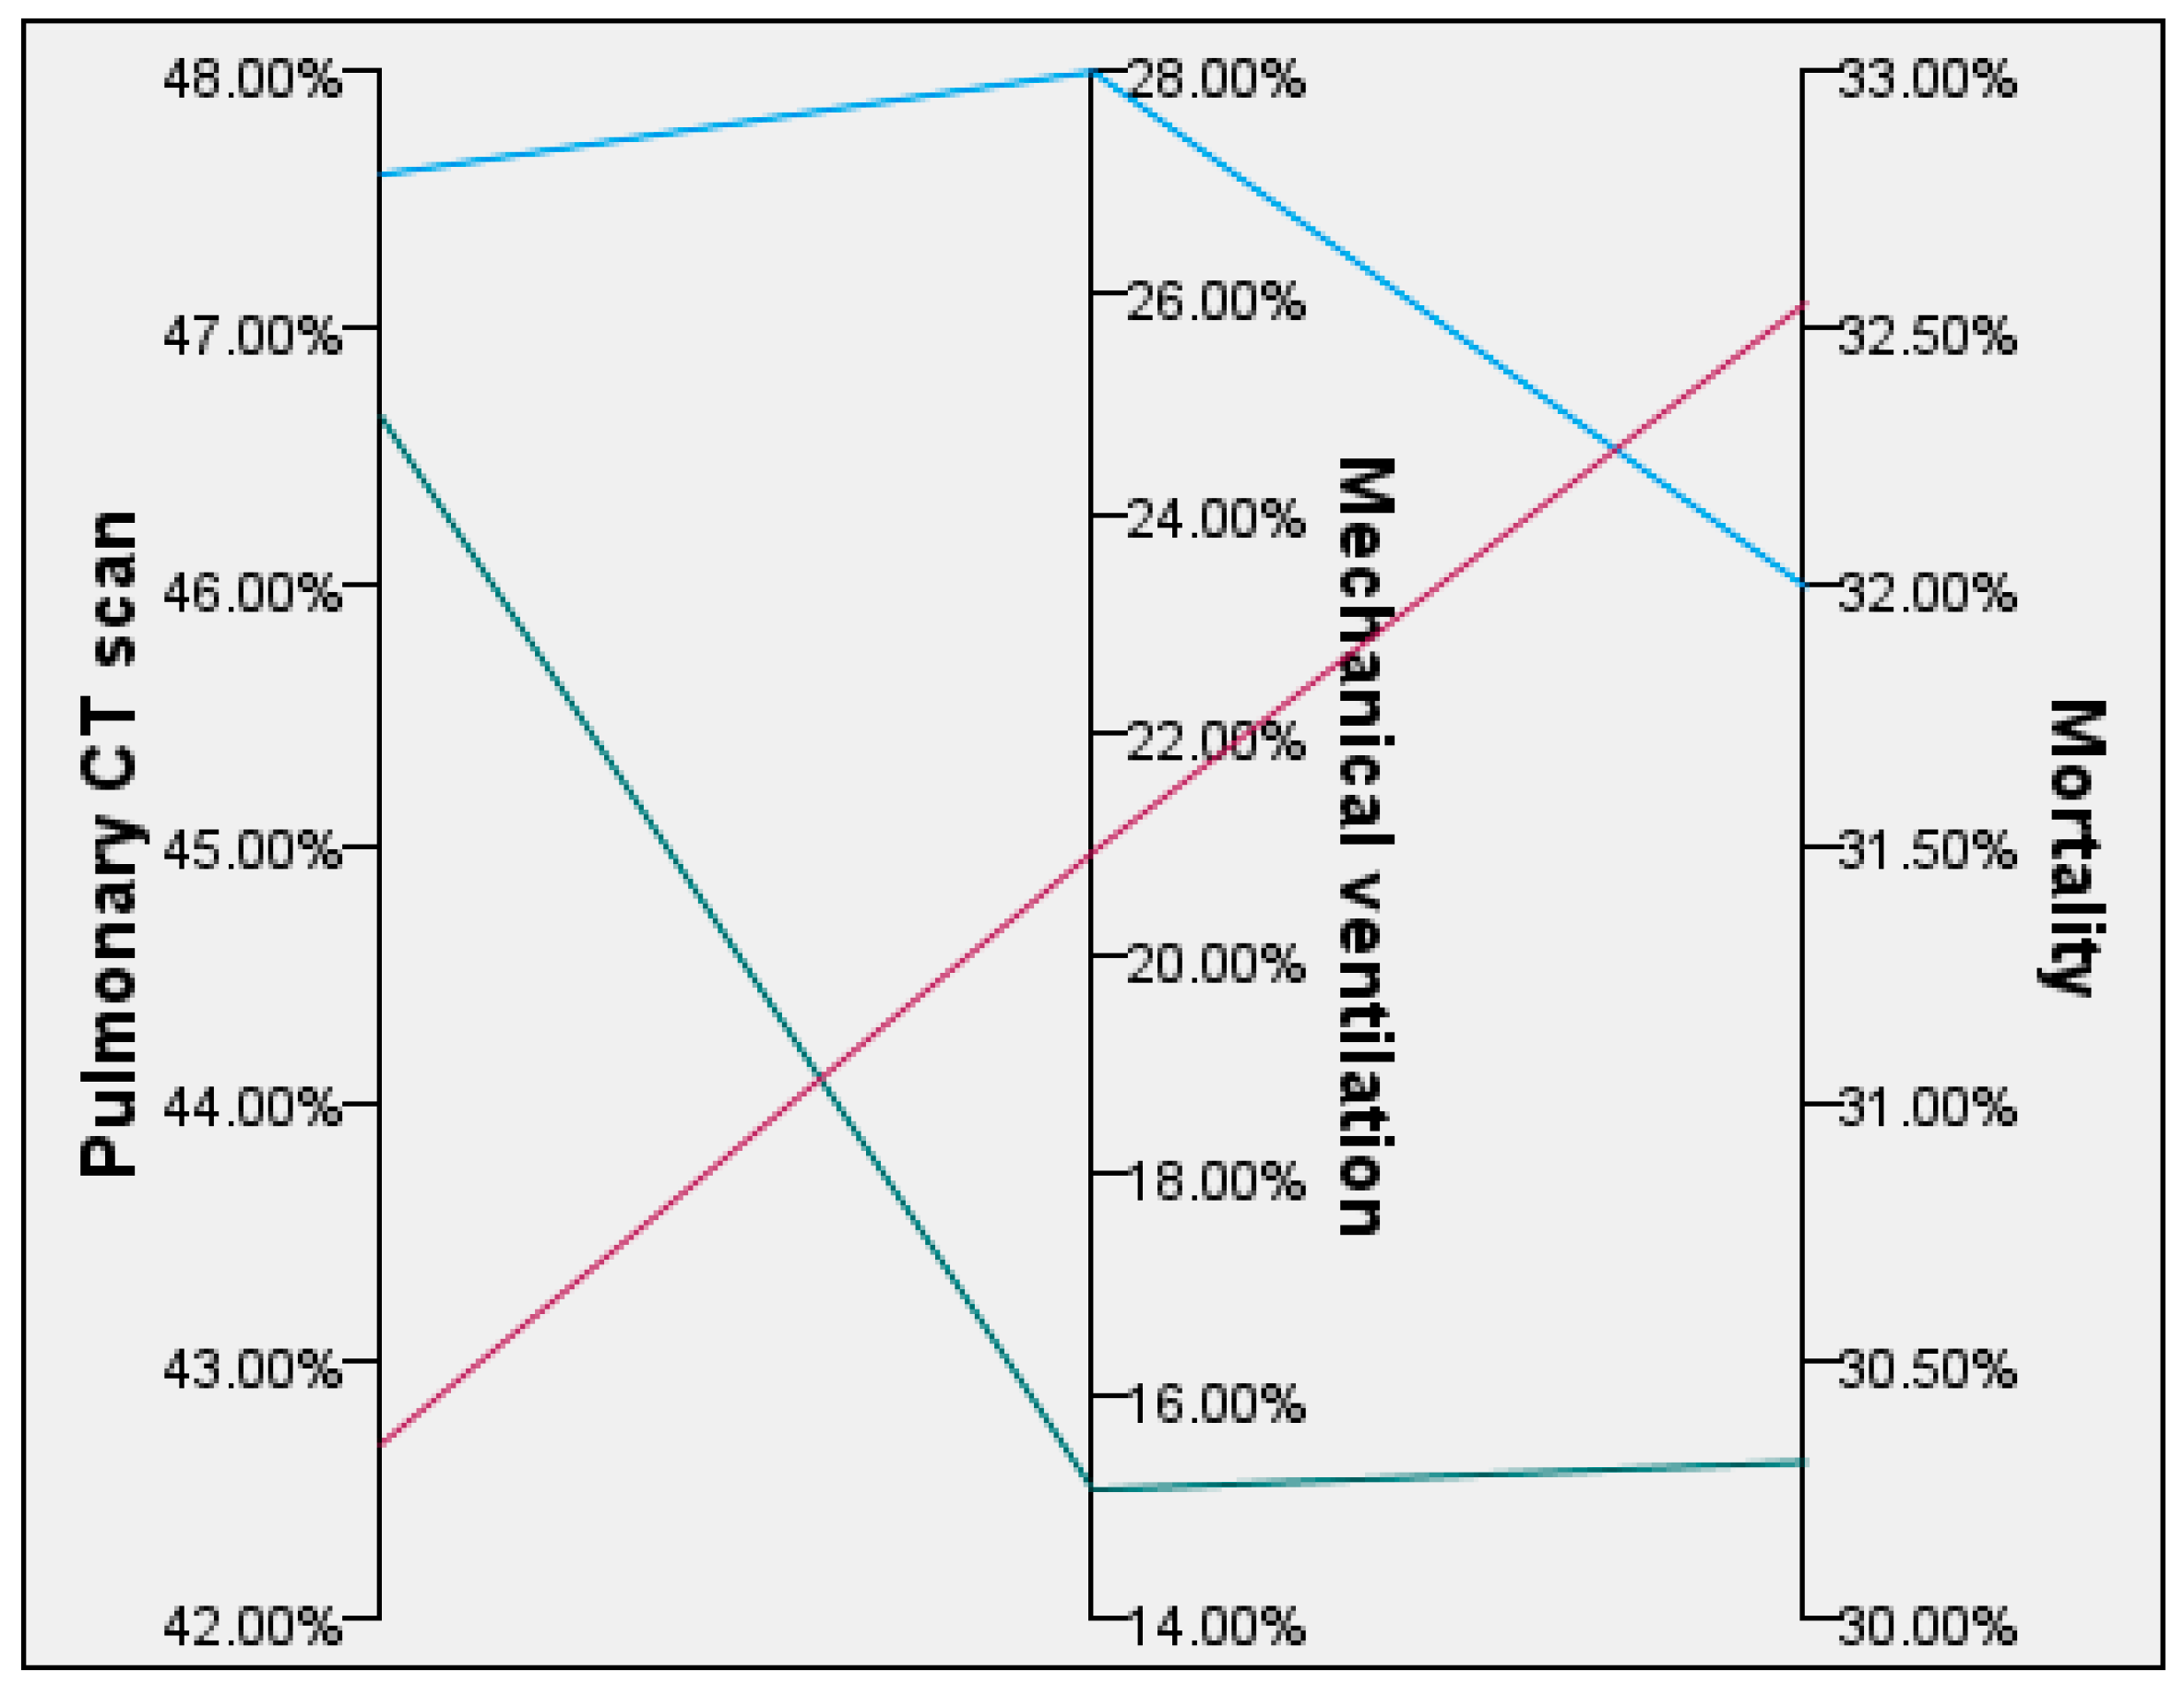
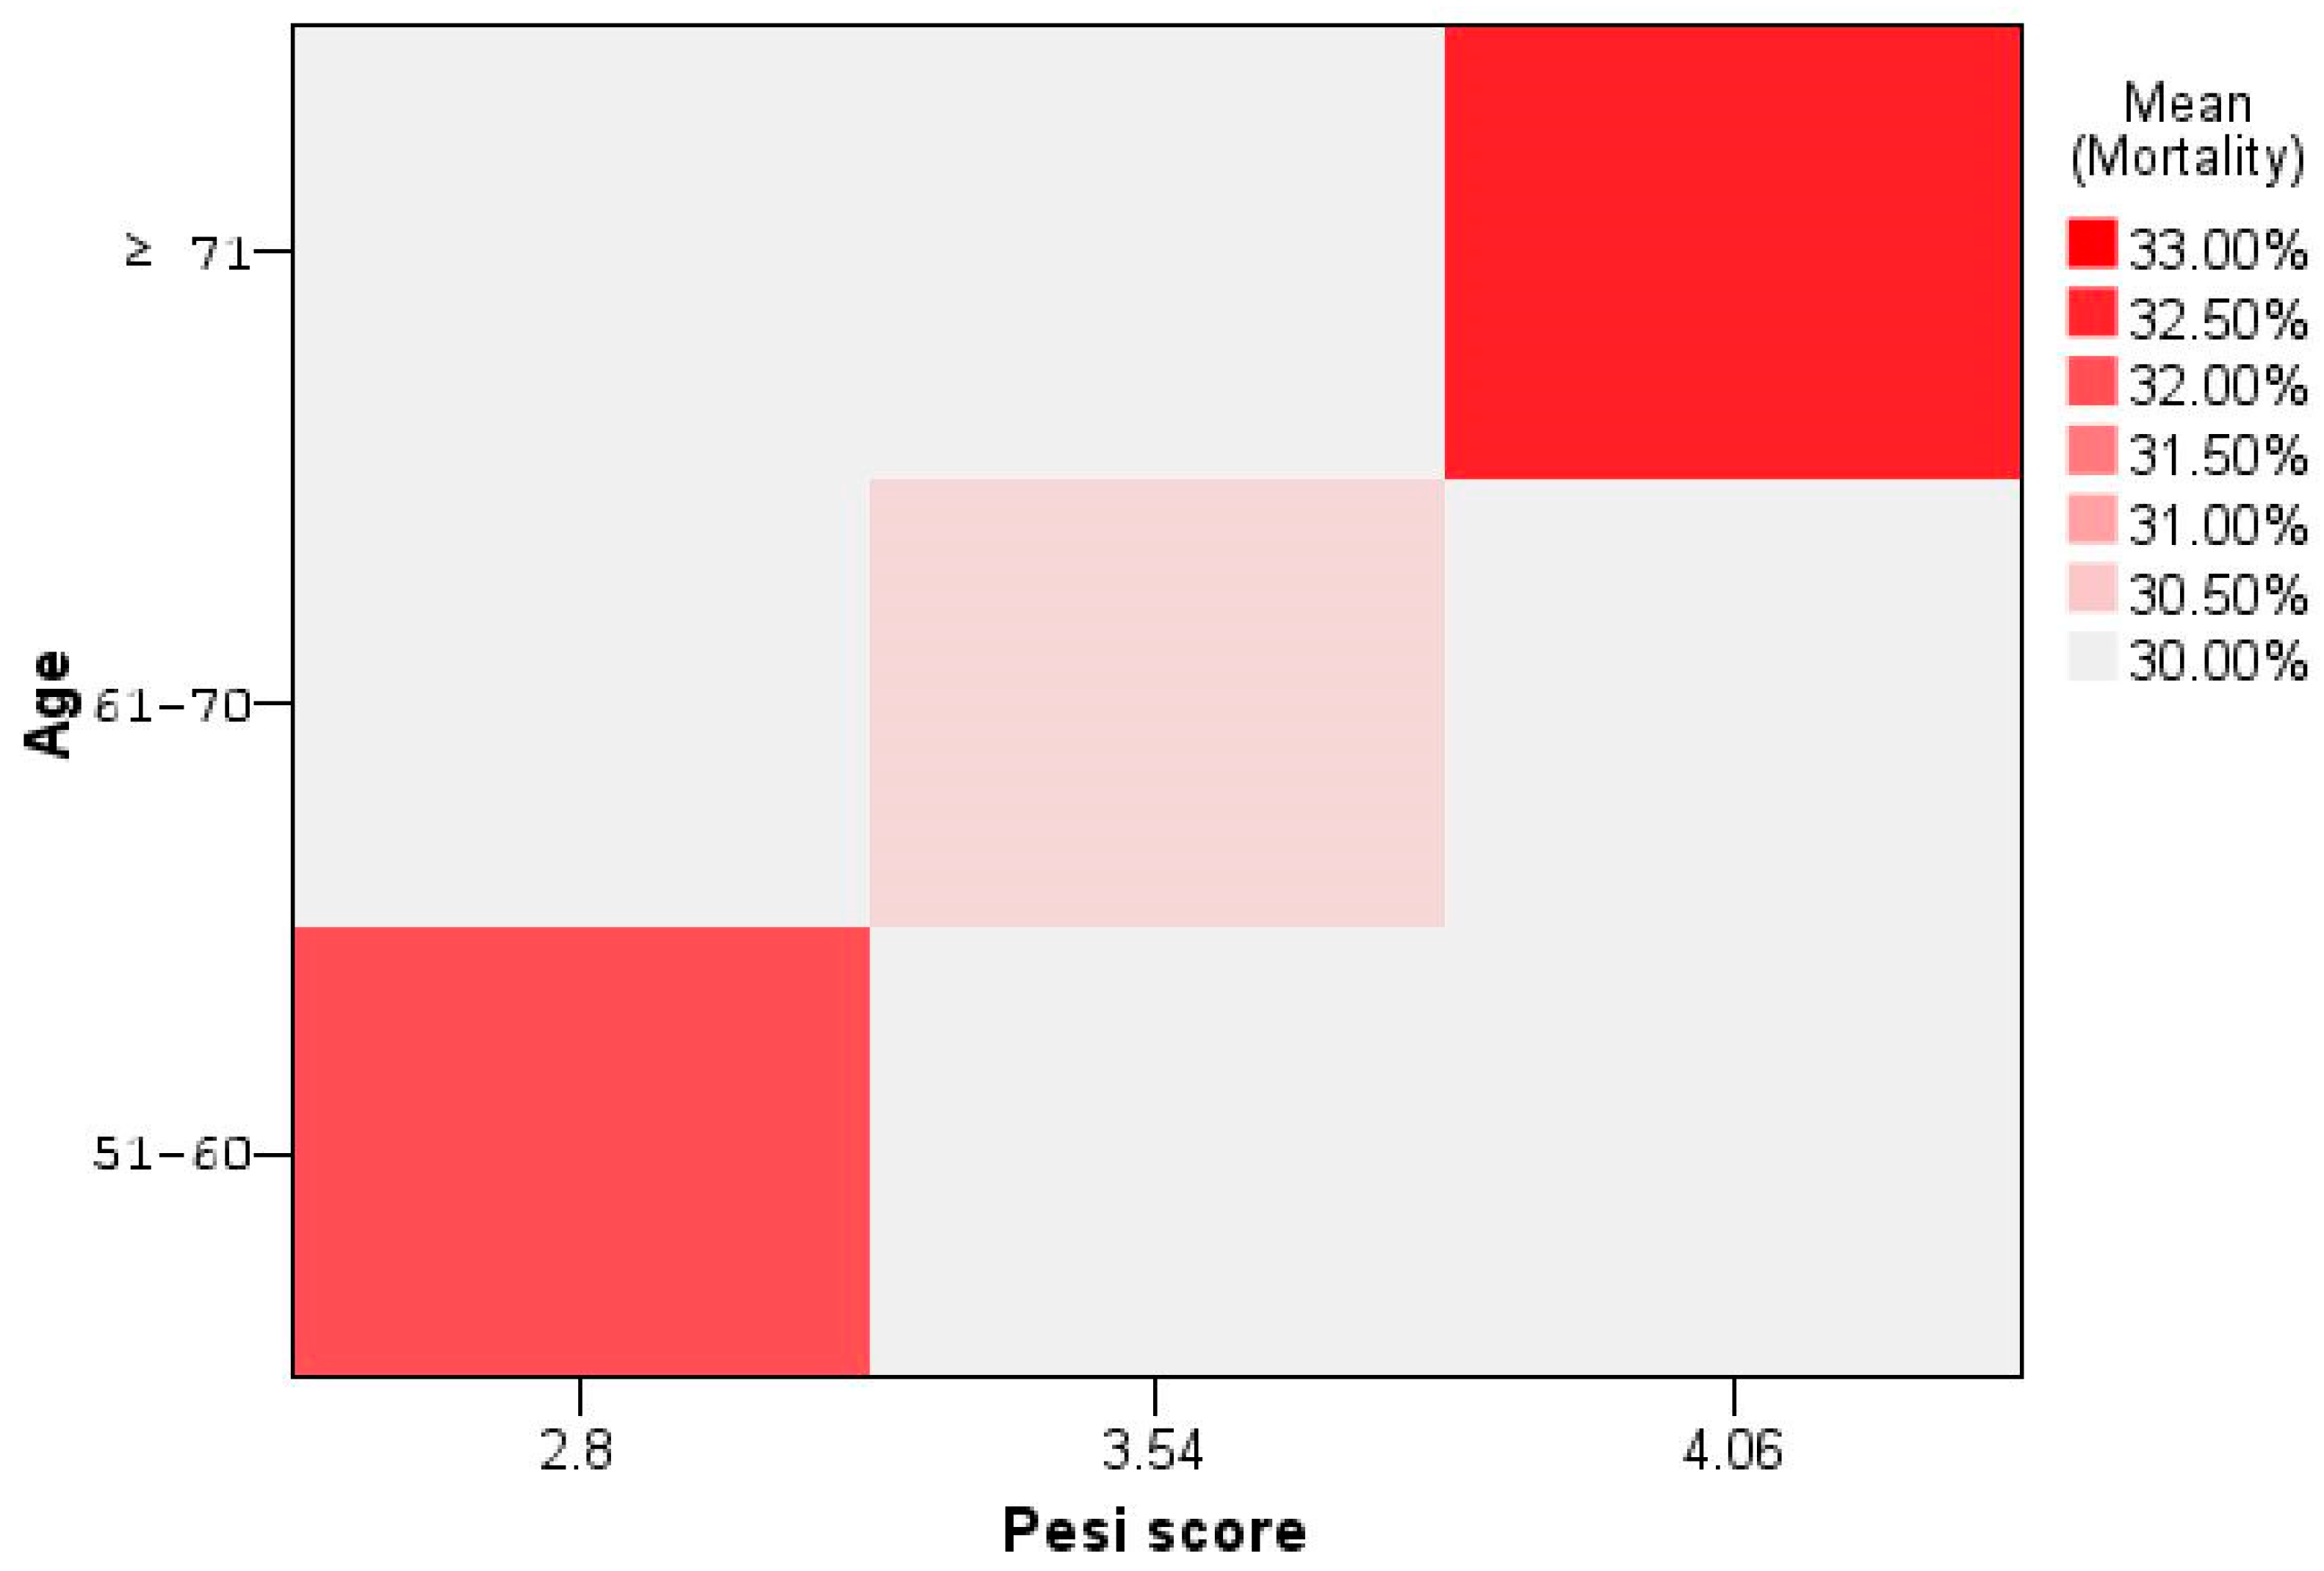
| Age | Wells Score | Pulmonary CT Scan | Pesi Score | Mechanical Ventilation | Mortality |
|---|---|---|---|---|---|
| 51–60 (n = 25) | 1.1 ± 0.95 | 47.6% | 2.8 ± 1.04 | 28% | 32% |
| 61–70 (n = 33) | 0.8 ± 1.22 | 46.66% | 3.54 ± 0.07 | 15.15% | 30.3% |
| ≥71 (n = 43) | 1.89 ± 2.12 | 42.67% | 4.06 ± 0.76 | 20.93% | 32.55% |
| Overall (n = 101) | 1.34 ± 1.68 | 45.19% | 3.58 ± 1.03 | 20.79% | 30.69% |
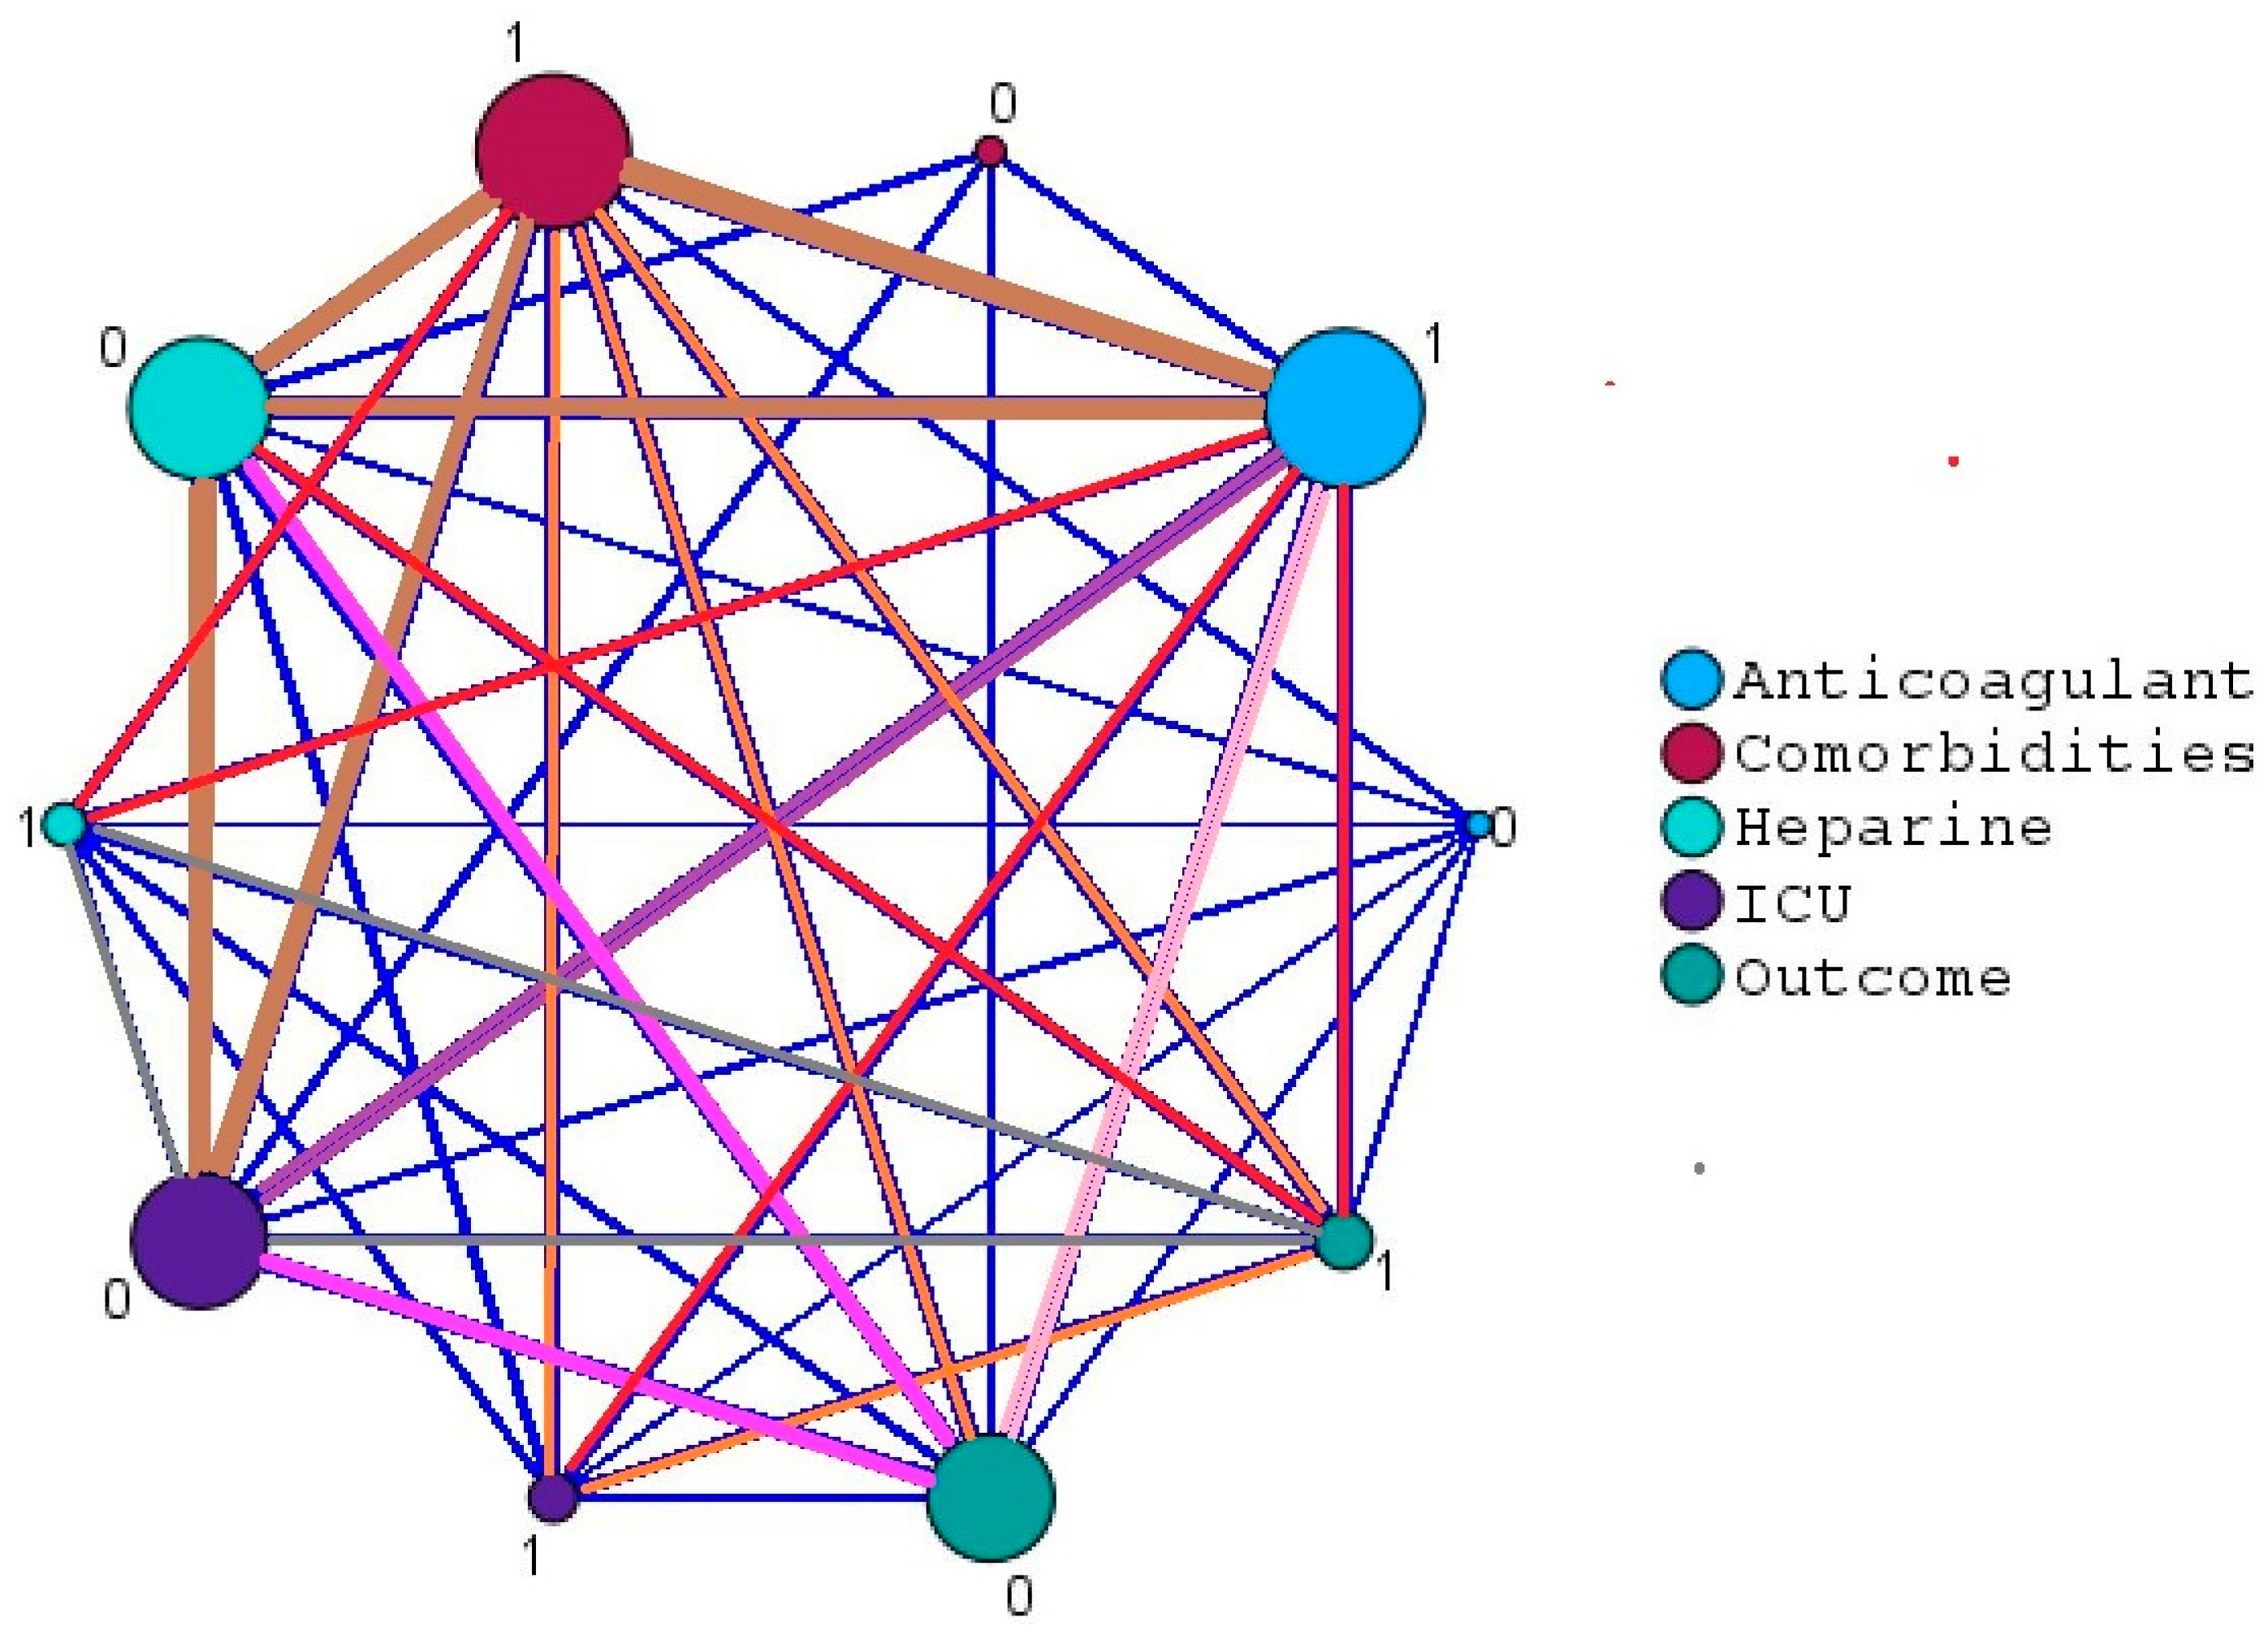
| Correlation | Count | Lower C.I. | Upper C.I. | ||
|---|---|---|---|---|---|
| Outcome | ICU | 0.673 | 101 | 0.550 | 0.768 |
| Symptoms | 0.563 | 101 | 0.114 | 0.470 | |
| Comorbidities | 0.161 | 101 | −0.036 | 0.345 | |
| Anticoagulant | −0.113 | 101 | −0.301 | 0.085 |
| Control Variables | Comorbidities | Anticoagulant | ICU | Symptoms | |
|---|---|---|---|---|---|
| Comorbidities | Correlation | 1.000 | −0.038 | 0.038 | 0.743 |
| Significance p-value | - | 0.707 | 0.711 | 0.463 | |
| Degree of freedom (df) | 0 | 98 | 98 | 98 | |
| Anticoagulant | Correlation | −0.038 | 1.000 | 0.067 | 0.165 |
| Significance p-value | 0.707 | - | 0.506 | 0.102 | |
| df | 98 | 0 | 98 | 98 | |
| ICU | Correlation | 0.038 | 0.067 | 1.000 | 0.814 |
| Significance p-value | 0.711 | 0.506 | - | 0.814 | |
| df | 98 | 98 | 0 | 98 | |
| Symptoms | Correlation | 0.743 | 0.165 | 0.814 | 1.000 |
| Significance p-value | 0.463 | 0.102 | 0.425 | - | |
| df | 98 | 98 | 98 | 0 | |
| 1st Wave (n = 101) | 2nd Wave (n = 101) | 3rd Wave (n = 101) | 4th Wave (n = 101) | 5th Wave (n = 101) | 6th Wave (n = 101) | 7th Wave (n = 101) | |
|---|---|---|---|---|---|---|---|
| Severe COVID-19 infection | 11 | 12 | 18 | 25 | 10 | 12 | 13 |
| Severe imaging features | 11 | 12 | 18 | 25 | 10 | 12 | 13 |
| O2 saturation on admission (<94%) | 11 | 12 | 18 | 25 | 10 | 12 | 13 |
| Respiratory rate (>30/min) | 11 | 12 | 18 | 25 | 10 | 12 | 13 |
| Mortality | 4 | 5 | 5 | 11 | 3 | 2 | 2 |
Disclaimer/Publisher’s Note: The statements, opinions and data contained in all publications are solely those of the individual author(s) and contributor(s) and not of MDPI and/or the editor(s). MDPI and/or the editor(s) disclaim responsibility for any injury to people or property resulting from any ideas, methods, instructions or products referred to in the content. |
© 2024 by the authors. Licensee MDPI, Basel, Switzerland. This article is an open access article distributed under the terms and conditions of the Creative Commons Attribution (CC BY) license (https://creativecommons.org/licenses/by/4.0/).
Share and Cite
Herlo, A.; Marinescu, A.R.; Cut, T.G.; Laza, R.; Oancea, C.I.; Manolescu, D.; Hogea, E.; Porosnicu, T.M.; Sincaru, S.V.; Dumache, R.; et al. Risk Factors for Pulmonary Embolism in Individuals Infected with SARS-CoV2—A Single-Centre Retrospective Study. Biomedicines 2024, 12, 774. https://doi.org/10.3390/biomedicines12040774
Herlo A, Marinescu AR, Cut TG, Laza R, Oancea CI, Manolescu D, Hogea E, Porosnicu TM, Sincaru SV, Dumache R, et al. Risk Factors for Pulmonary Embolism in Individuals Infected with SARS-CoV2—A Single-Centre Retrospective Study. Biomedicines. 2024; 12(4):774. https://doi.org/10.3390/biomedicines12040774
Chicago/Turabian StyleHerlo, Alexandra, Adelina Raluca Marinescu, Talida Georgiana Cut, Ruxandra Laza, Cristian Iulian Oancea, Diana Manolescu, Elena Hogea, Tamara Mirela Porosnicu, Suzana Vasilica Sincaru, Raluca Dumache, and et al. 2024. "Risk Factors for Pulmonary Embolism in Individuals Infected with SARS-CoV2—A Single-Centre Retrospective Study" Biomedicines 12, no. 4: 774. https://doi.org/10.3390/biomedicines12040774