
The Strategies to Homogenize PET/CT Metrics: The Case of Onco-Haematological Clinical Trials

Abstract
:1. Introduction
2. Analysis and Reporting of Positron Emission Tomography Computed Tomography (PET/CT) Images
2.1. Binary Scale
2.2. Discrete Scale
2.3. Continuous Scale
2.3.1. Standardized Uptake Value
- SUVmax: it is the maximum value within the VOI; this index is simple to measure and provides information about the most active tumour foci. Its drawback is the strong dependence on image noise, because it corresponds to a single voxel measure.
- SUVmean: it is the average of all values belonging to the VOI; this metric evaluates the mean metabolic activity of tumour. It is much less vulnerable to image noise, but heavily depends on the delineation method used for drawing the VOI [23].
2.3.2. Metabolic Volumes
2.3.3. Kinetic Modelling
3. Sources of Errors in Uptake Evaluation
3.1. Scanner-Related Factors
3.1.1. Cross Calibration of PET/CT Scanners
3.1.2. Verification of Image Reconstruction Algorithm
3.2. Site-Related Factors
3.2.1. Imaging Parameters
3.2.2. Patient’s Weight
3.2.3. Administered Activity
3.2.4. Other Factors
3.3. Host Factors
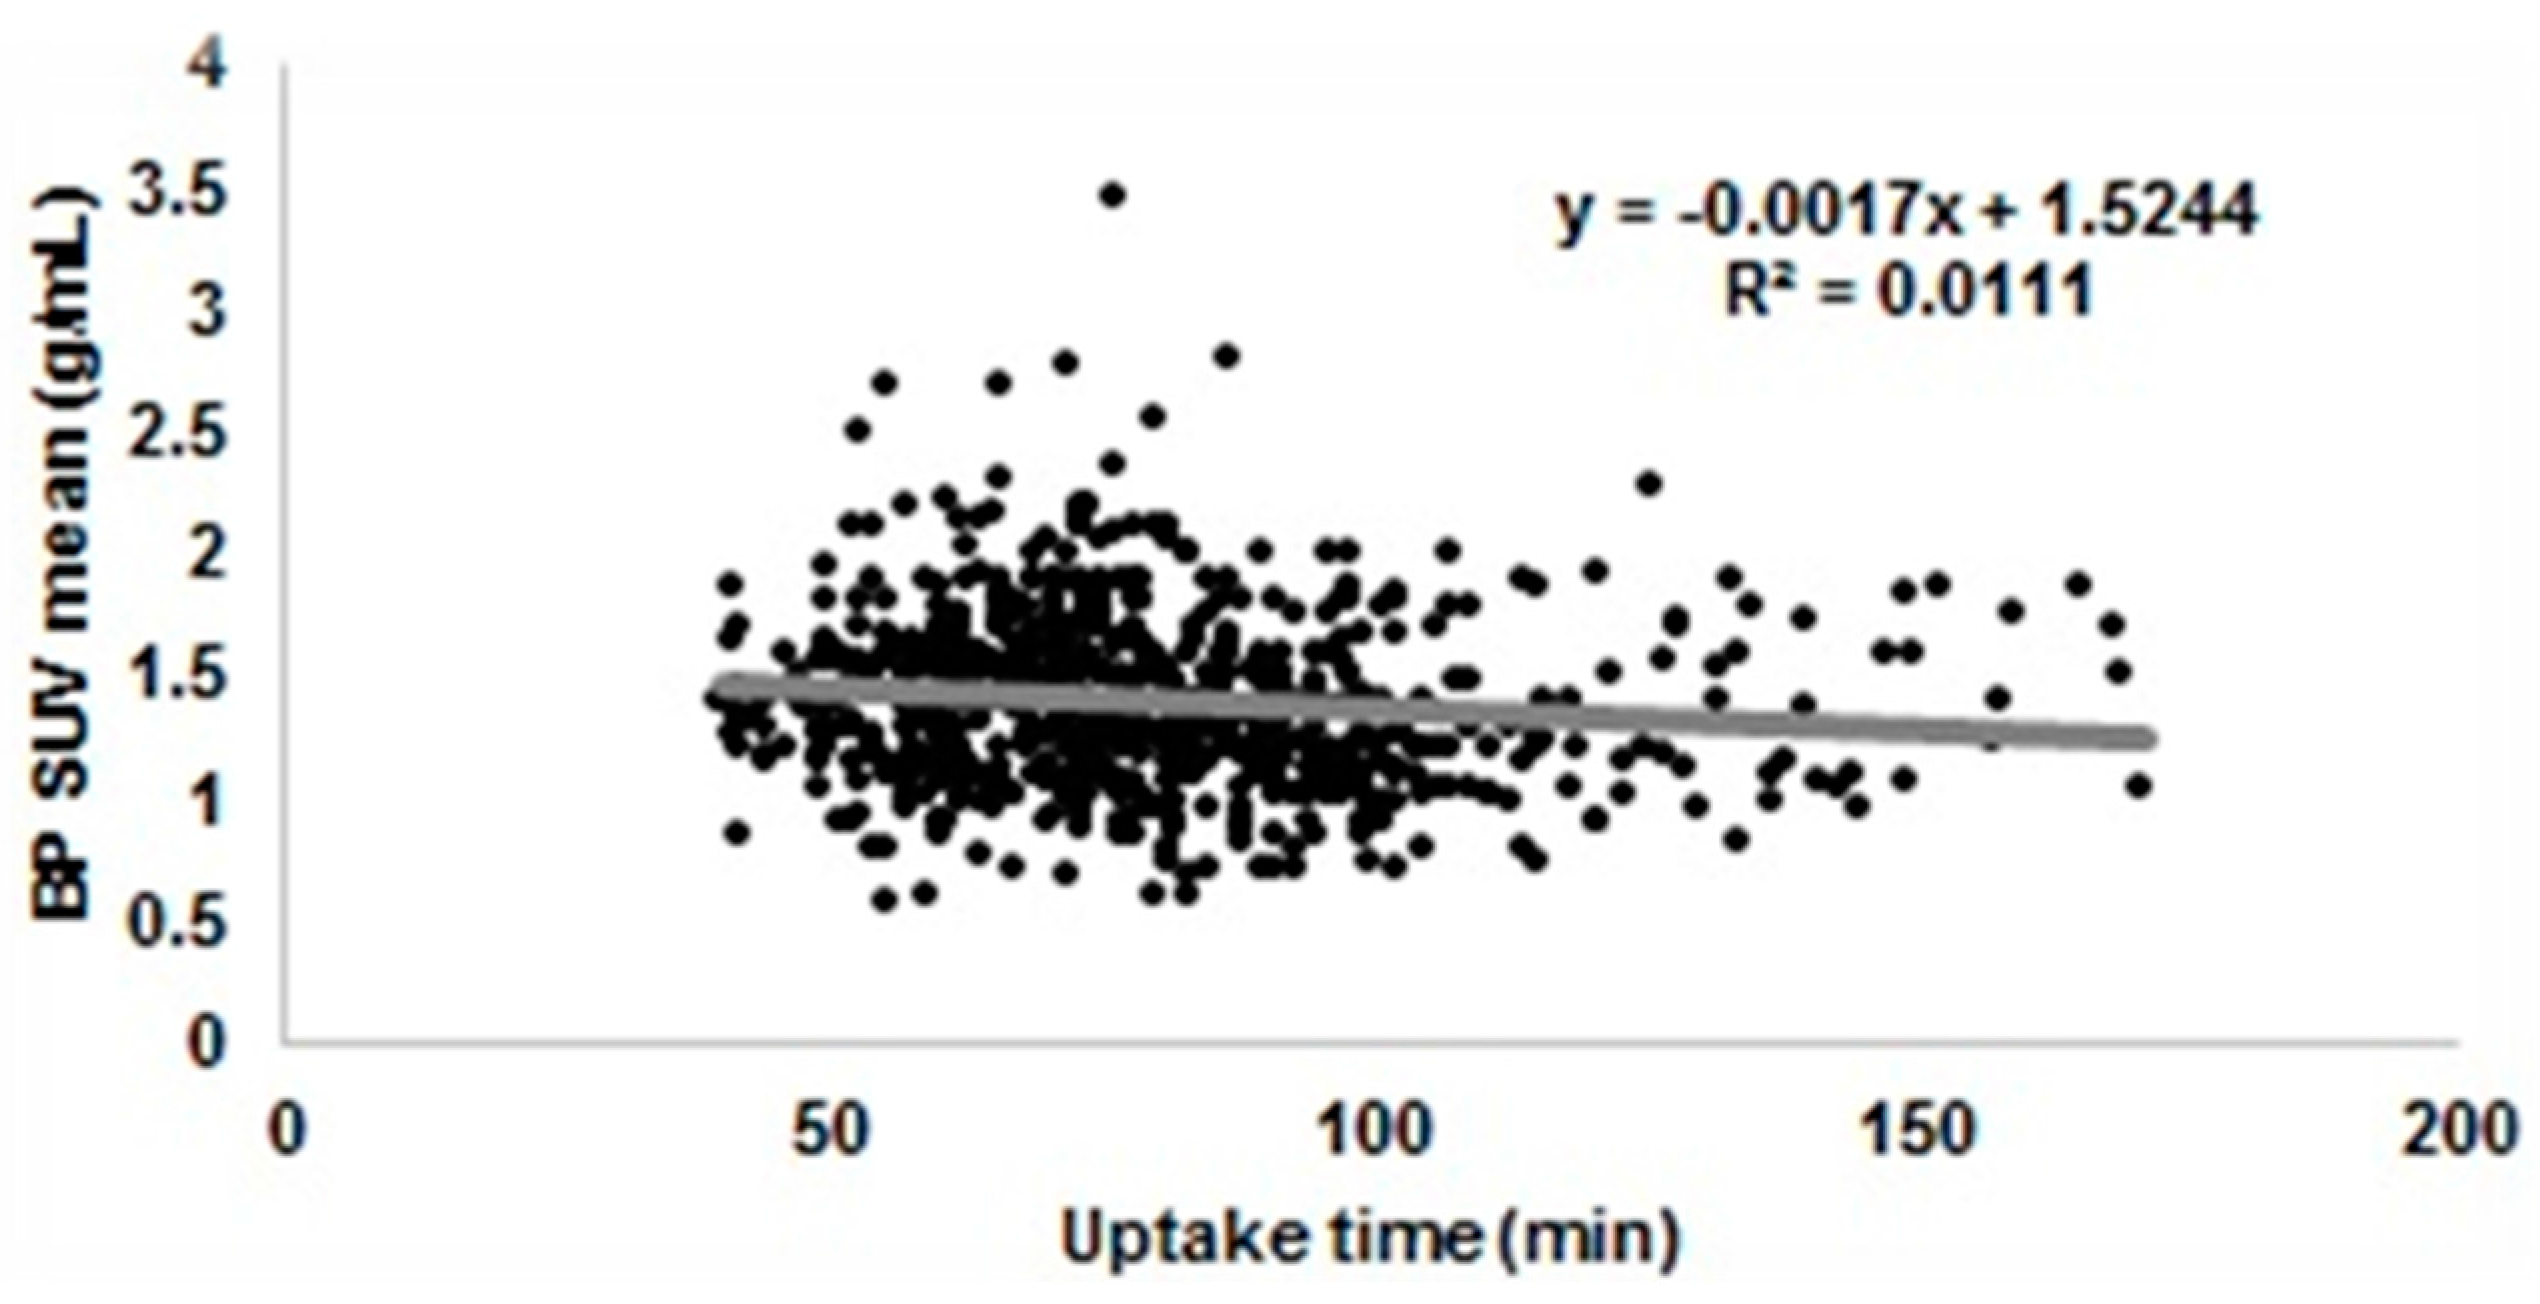
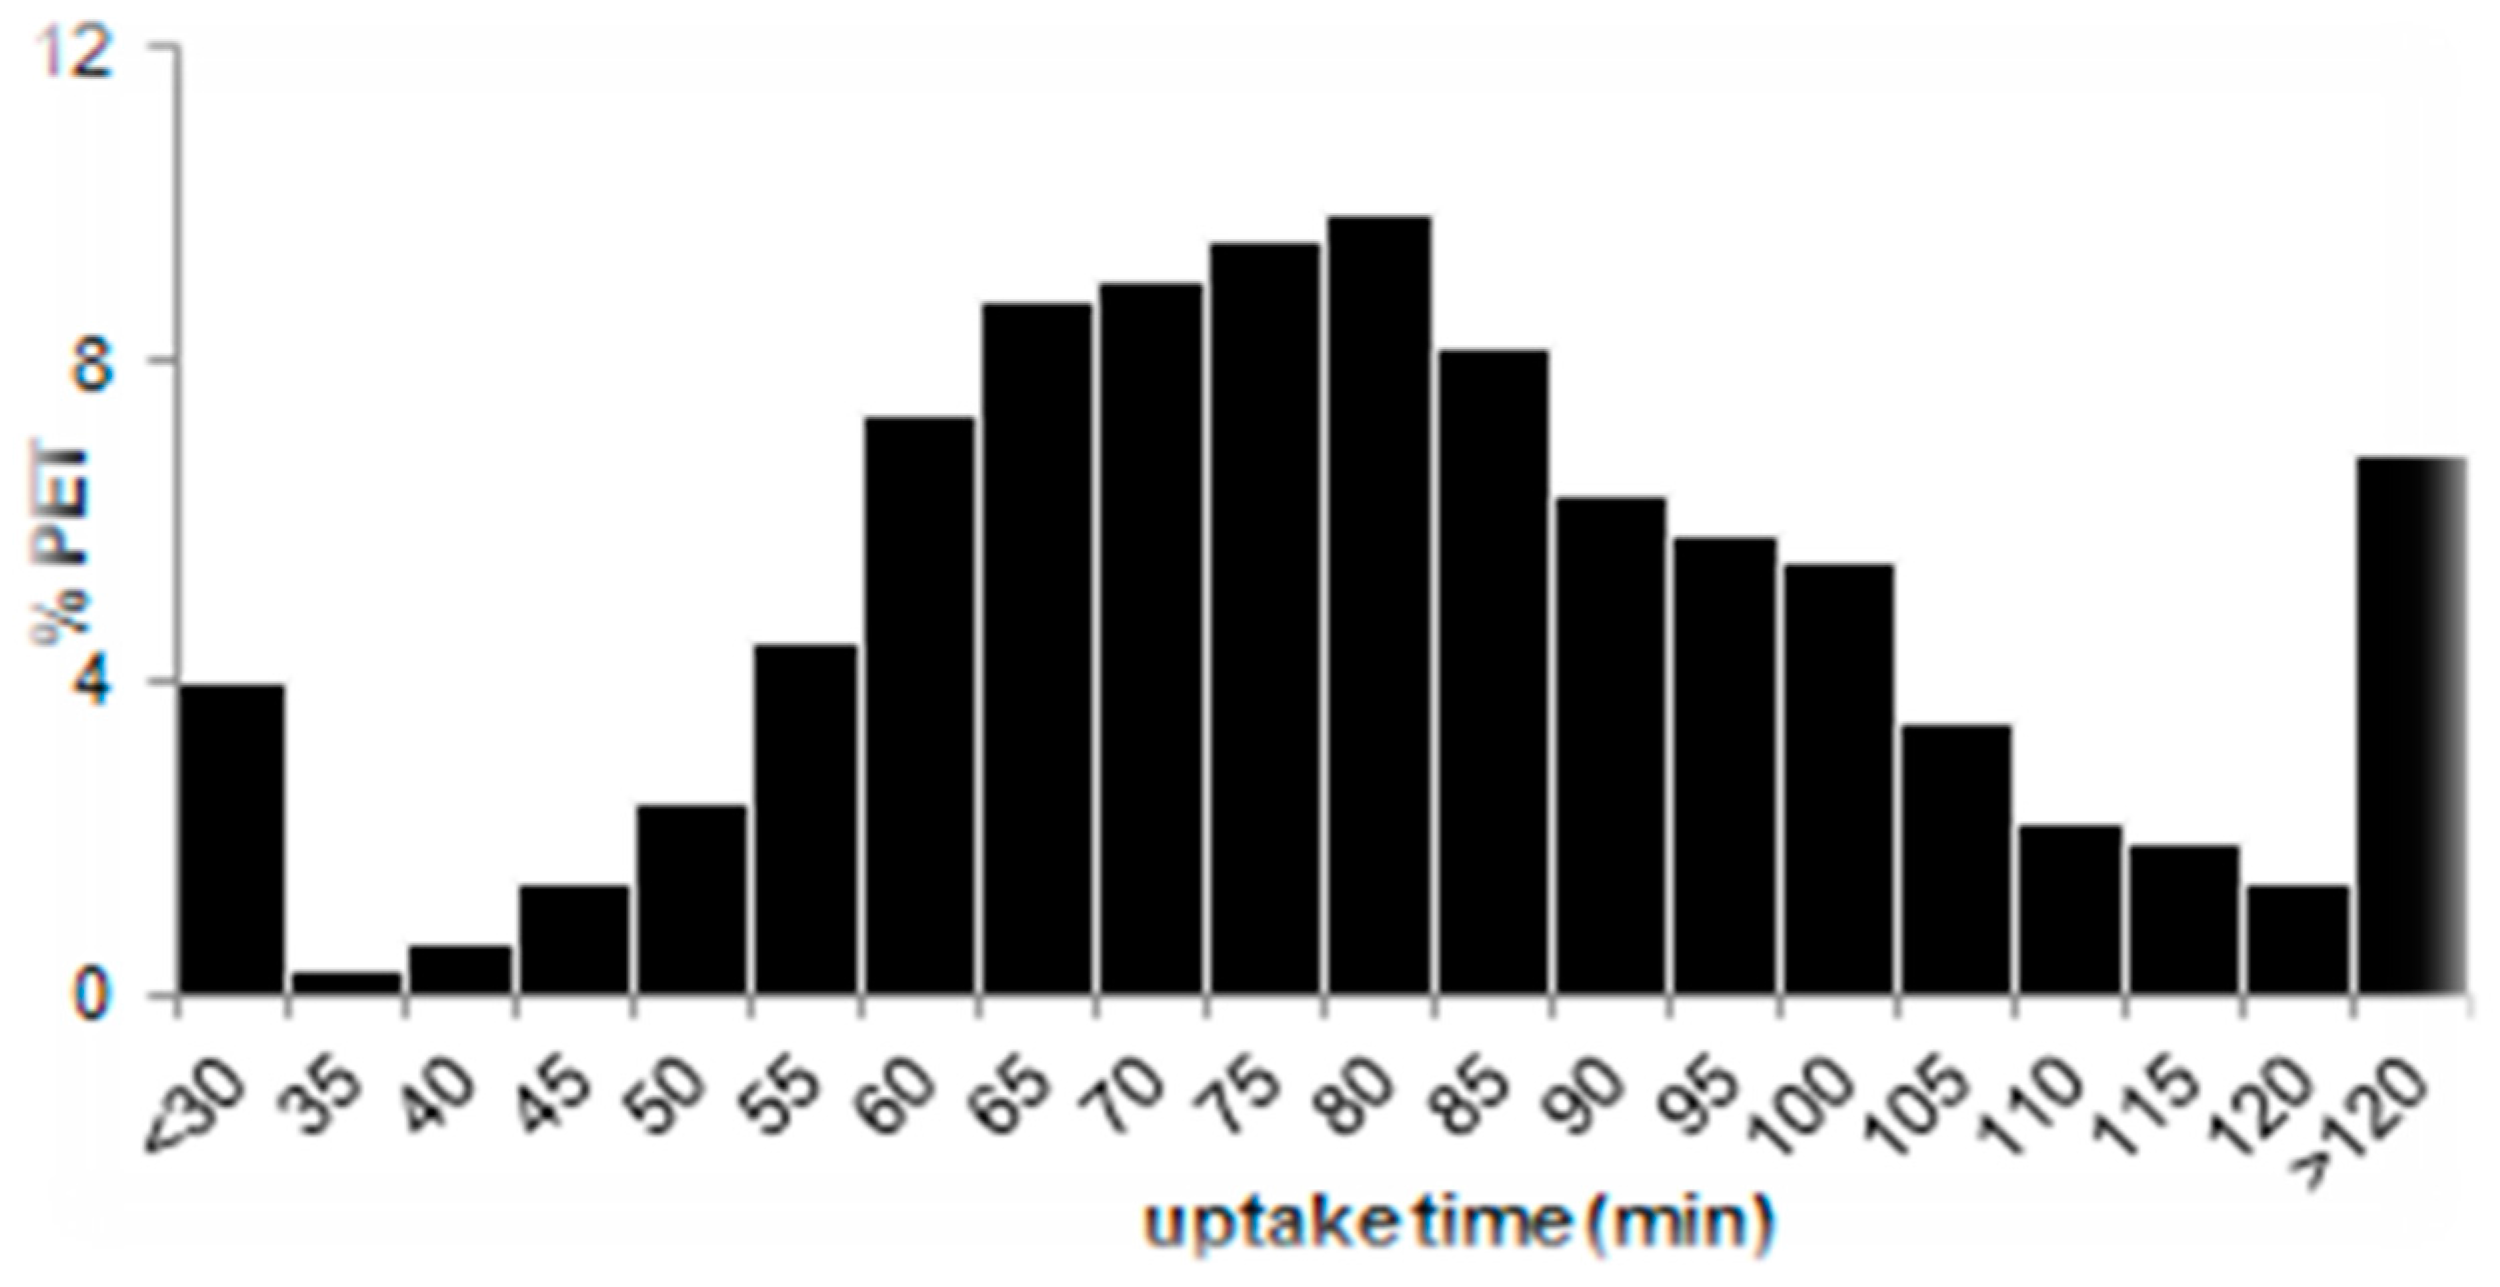
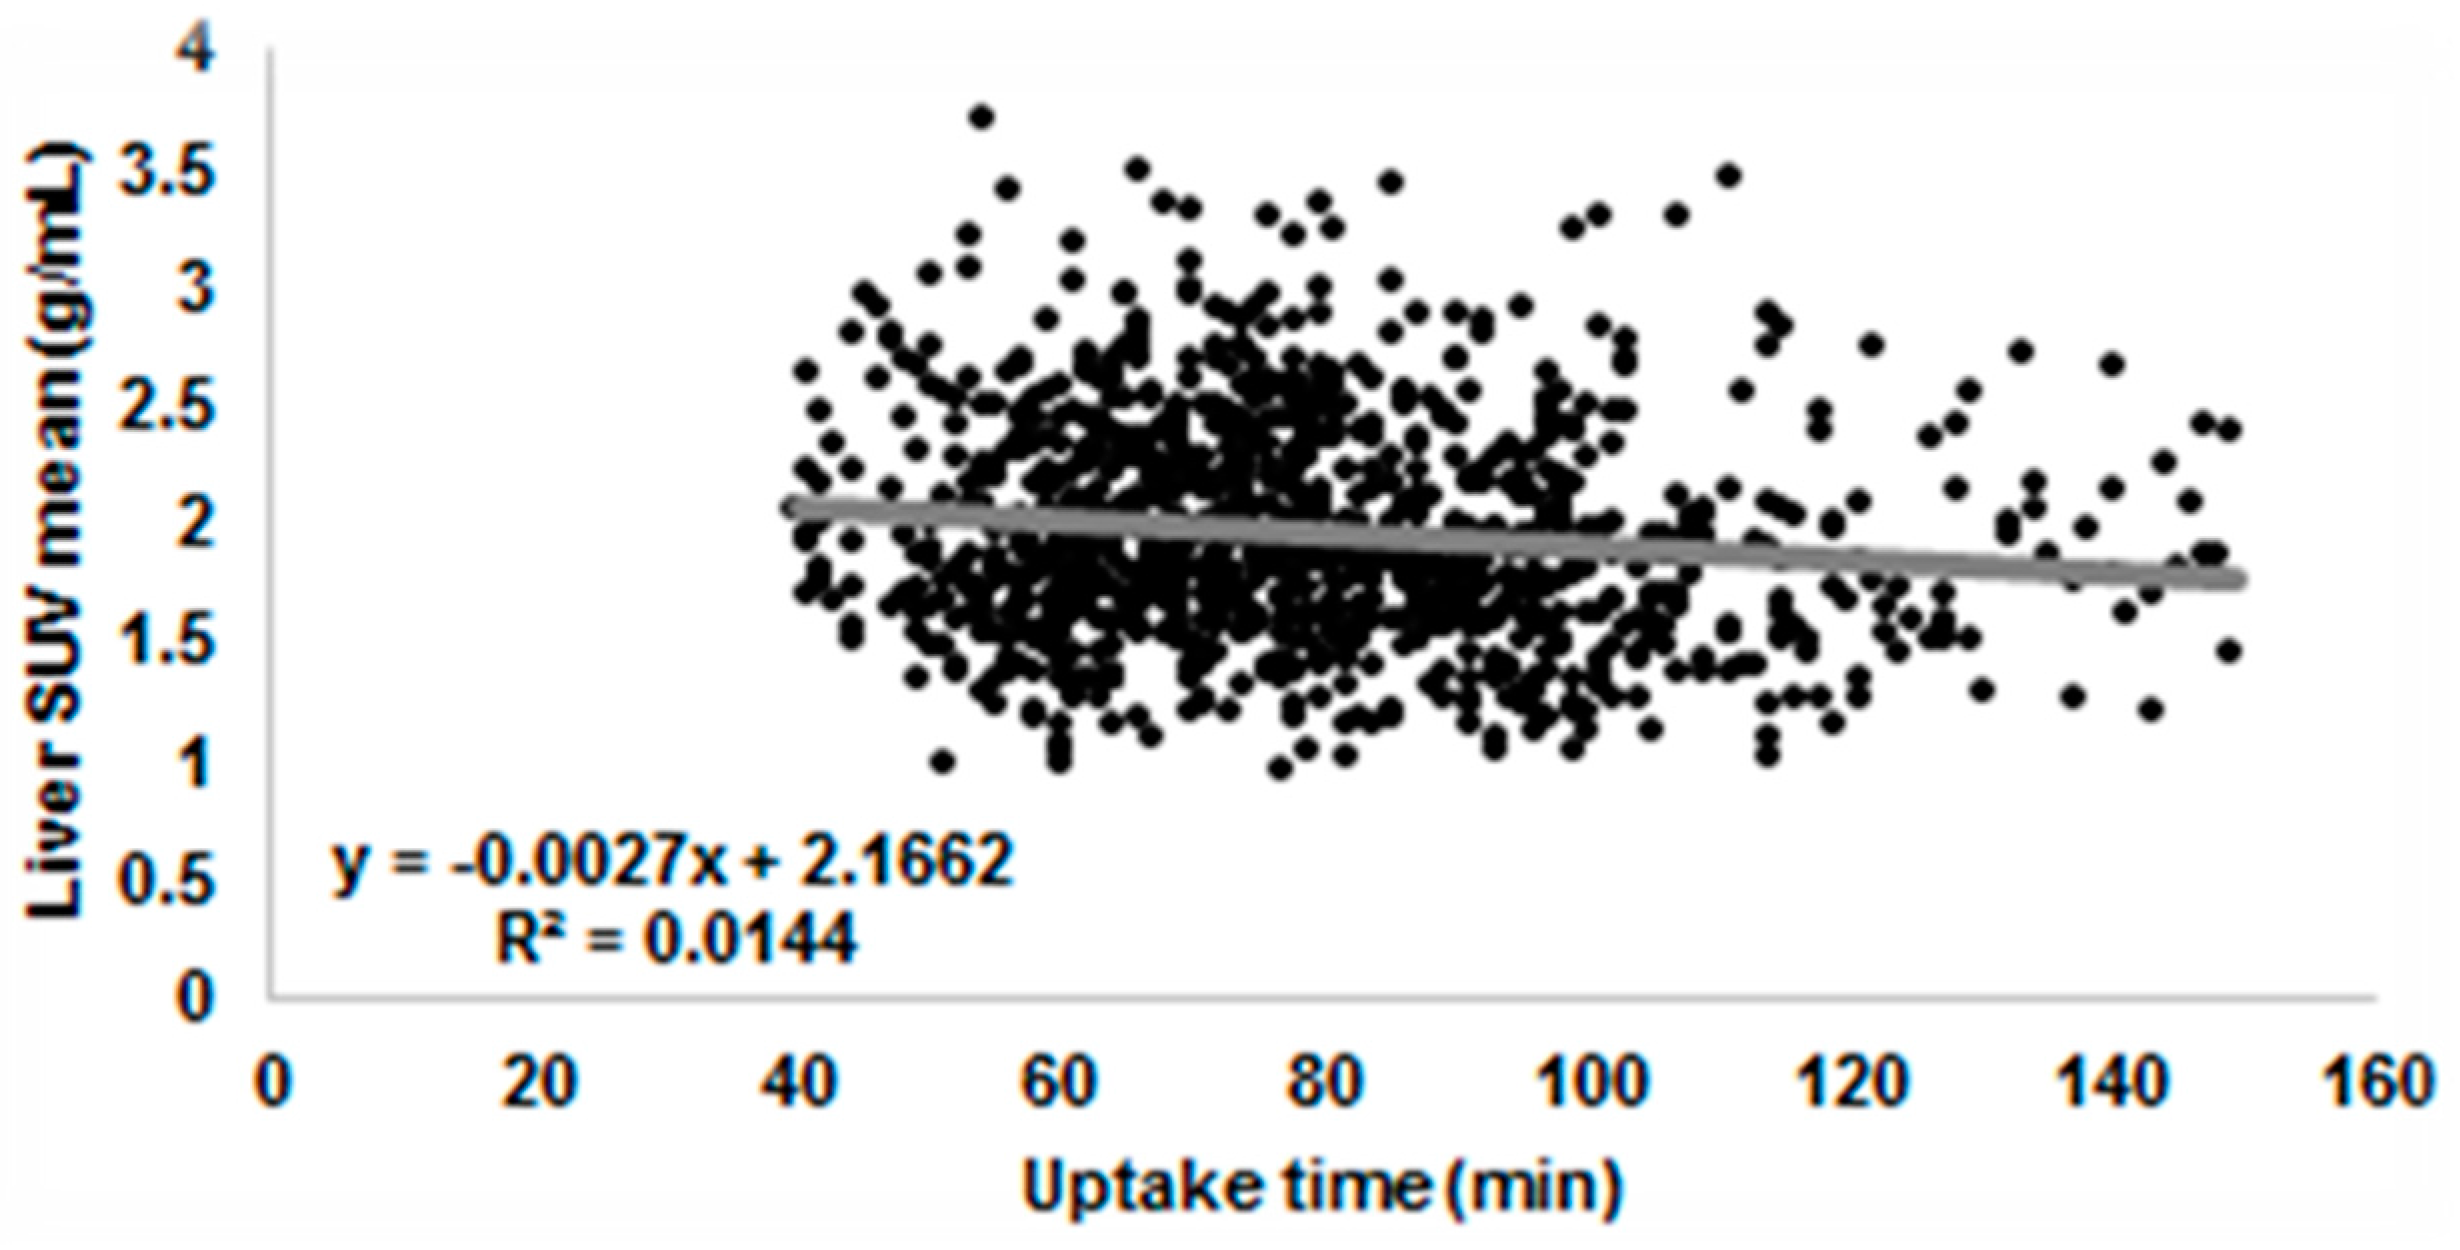
3.3.1. Uptake Time
3.3.2. Glucose Level
3.3.3. Extravasation
3.3.4. Other Factors
4. Strategies of Error Reduction in Onco-Heamatological Clinical Trials
4.1. Hodgkin Lymphoma (HL)
4.1.1. RAPID
- (1)
- The images were transmitted to the core laboratory at St. Thomas’ Hospital, King’s College, London, for central review. Two experienced reporters independently scored the scans with the use of the 5-point Deauville scale to evaluate the degree of FDG uptake, if present, as well as the likelihood of residual disease. Any differences in opinion were resolved by consensus.
- (2)
- PET scanning was performed on full-ring PET or PET/CT cameras at sites within the United Kingdom NCRI PET Research Network. Sites complied with commonly agreed methods for quality control to ensure that the performance of imaging equipment, data transfer, and image quality were within an acceptable range which was pre-specified by the core laboratory [29]. Physicists from the core laboratory visited each PET site and scanned two phantoms to check image quality and quantitative accuracy before starting the study. If the difference between expected and measured activity in the cylindrical phantom used for cross-calibration is below 10% and if the recovery coefficient of the different scanners are within ±0.25 SUV variation, the PET/CT scanner is qualified for the trial.
- (3)
- Before undergoing scanning, patients fasted for 6 h, after which 350–400 MBq of FDG was administered intravenously. Scans were acquired 60 min later from the skull vertex or base of the brain to the upper thighs.
4.1.2. RATHL
- (1)
- Scans were centrally reported by a network of national core laboratories in the United Kingdom, Italy, Sweden, Denmark, and Australia. Images were centrally reviewed with the use of the 5-point Deauville scale. Two readers at each core laboratory who were unaware of the patient’s clinical status scored the scans. Differences were resolved by consensus between two doctors at the same core laboratory or, when agreement could not be reached, by a third doctor at another core laboratory.
- (2)
- No information was given about the equalization of PET/CT scanners. Patients from the UK nevertheless rely on the NCRI network for PET sites as described in the RAPID trial.
- (3)
- Baseline PET/CT was performed within 28 days before enrolment. Interim PET/CT scanning was performed 9 to 13 days after the preceding dose of chemotherapy. Patients underwent PET/CT scanning with low-dose unenhanced PET/CT scans and were acquired at 60 ± 10 min after the intravenous injection of 350–550 MBq of FDG. Subsequent PET/CT scanning was performed under the same conditions and on the same scanner as baseline scanning.
4.1.3. S0816
- (1)
- There were 331 of 358 PET/CT scans submitted for centralized review to the CALGB imaging core lab. The CALGB Imaging Core Lab enables internet-based visual and virtual conferences that allow the simultaneous display of and mutual communication between participating sites and the core lab in a secure manner. The central PET/CT review was completed in less than two days in 78% and in less than four days in 95% of the patients. The 5 reviewers scored the scans using the 5-point Deauville scale. There was one adjudicator in the CALGB Core Lab, for cases where major discrepancies existed between the local site and the central PET/CT interpretation. Scans given Deauville scores 1 to 3 were considered PET2-negative, and scans given Deauville scores 4 to 5 were considered PET-positive.
- (2)
- Only full-ring dedicated PET/CT scanners were acceptable and older “stand-alone” PET scans were not adequate for this study. A documented daily quality control procedure had to be in place at each imaging facility. The proposed data acquisition/reconstruction protocol (including details of all the parameters above) had to be discussed with the core lab prior to the start of the study.
- (3)
- The clinical trial protocol foresaw very detailed instruction for PET/CT scanning including patient preparation, FDG administration, uptake time in the range 60–80 min which are furnished in supplemental material along with the published article [40]. The CT of the PET/CT was used for attenuation correction of PET data and anatomic localization. CT settings followed institutional guidelines (usually 120–140 kV, at least 60 mA).
4.1.4. HD15
4.1.5. H10
4.1.6. BV-ABVD
- (1)
- A panel consisting of three independent reviewers centrally assessed baseline and after two cycles of brentuximab vedotin PET/CT scans. The review process was coordinated through the Widen website platform [17]. Widen is a system for real-time central review which collects PET/CT images from participant sites, automatically verifies protocol violations, distributes images to reviewers, permits the online submission of the PET/CT evaluations and automatically merges them, transmitting the final results of the PET/CT reviews to the local investigators and to the clinical trial data centre. The response was assessed by adopting the 5-point scale Deauville criteria as a qualitative index and the SUVmax as a quantitative index. A response was defined as a reduction in the Deauville score or, if there was no change in it, a reduction in SUV compared to baseline.
- (2)
- Scanners underwent clinical trial qualification for semi-quantitative analysis from the FIL core lab [30]. That is, before patients’ accrual, all PET/CT sites acquire two phantoms and sends them to the core lab. If the difference between expected and measured activity in the cylindrical phantom used for cross-calibration is below 10% and if the recovery coefficient curves are smooth and within the limits given by the European Association for Nuclear Medicine (EANM) guidelines [35], the PET/CT scanner is qualified for the trial.
- (3)
- All FIL PET/CT-oriented protocols starting after 2011 use a shared PET/CT procedure that follows 2010 EANM guidelines [35] for patient preparation, FDG and other contrast agent administration, and PET/CT acquisition protocol.
4.1.7. HD0607
- (1)
- A panel consisting of six independent readers assessed baseline and after two cycles of ABVD PET/CT scans. The response was assessed by adopting the 5-point scale Deauville criteria, considering score 4–5 positive. The readers reviewed independently the interim PET/CT scans and inserted the review in the Widen website platform [17] that calculated automatically the majority and forwarded the results of the review to the participating site. Real-time independent review was carried out: the average and median times for diagnosis exchange were 48 h and 38 h, respectively.
- (2)
- Scanners underwent clinical trial qualification for visual analysis from the FIL core lab [30]. That is, before patients’ accrual, all PET/CT sites acquire a cylindrical phantom and send them to the core lab. If the difference between expected and measured activity in the cylindrical phantom used for cross-calibration is below 10%, the PET/CT scanner is qualified for the trial.
- (3)
- The participating site used a shared PET/CT procedure that followed 2003 EANM guidelines [45] for patient preparation, FDG and other contrast agent administration, and PET/CT acquisition protocol.
4.2. Non-Hodgkin Lymphoma
4.2.1. E3404
4.2.2. SAKK38/07
- (1)
- The central review was retrospectively performed at the Nuclear Medicine Department of the University Hospital of Zürich (Zürich, Switzerland). PET scans were analysed using the Deauville 5-point scale and semi-quantitative analysis; PET was considered negative if variation in SUVmax between baseline and interim scan was >66% [49].
- (2)
- No information was given for PET/CT scanner equalization.
- (3)
- All patients were instructed to fast for at least 4 h before injection of 370 MBq of FDG. Blood glucose level had to be measured before injection of the radiotracer. Whole-body PET scans were performed after a standardized uptake time of 60 min. Interim PET scans were performed between day 11 and day 14 of the R-CHOP-14 cycle and between day 14 and day 28 after the last rituximab infusion (after treatment ended).
4.2.3. GELTAMO-2006
- (1)
- Baseline and interim PET/CT scans were retrospectively evaluated by central review in 51/71 patients by a single nuclear medicine expert. Interim PET/CT was evaluated along baseline scan with the 5-point scale Deauville criteria—considering scores of 1, 2 or 3 as negative and scores of 4 or 5 as positive—and with semi-quantitative analysis considering PET as negative if variation in SUVmax between baseline and interim scan was >66% [49].
- (2)
- Each patient was scanned on the same PET/CT machine for baseline and subsequent assessments.
- (3)
- No information was given for PET/CT procedure harmonization.
4.2.4. IELSG26
- (1)
- CD-ROMs together with essential information on the PET/CT acquisition were sent to the core laboratory for central review. A single physician with expertise in nuclear medicine performed this after the end of treatment. Uncertain interpretations were resolved with the agreement of a second expert. The review was blinded to the clinical information. The achievement of a metabolic complete response was defined, according to the IHP criteria [10] equating score 1 or 2 on the Deauville scale. The post-chemotherapy and post-radiotherapy scans were assessed according to the Deauville scale. Diffuse uptake in the spleen or marrow on the post-chemoimmunotherapy scan is considered to be a result of chemotherapy and was not scored as active disease.
- (2)
- PET/CT imaging was performed on full-ring integrated PET/CT systems. Baseline and response PET/CT examinations for a patient were performed in the same centre by using the same PET/CT system. Each centre was required to follow active quality control and quality assessment programs.
- (3)
- PET and CT images were acquired in the same session. Intravenous CT contrast media were not administered before the PET study. If a diagnostic CT scan using contrast was routinely performed as part of the PET/CT examination, it was performed after the PET scan. All patients fasted for at least 6 h before the injection of 4.5 MBq/kg of FDG. Serum glucose level measured before injection of the radiotracer was less than 160 mg/dL in all patients. After a standardized uptake time of 55–65 min, PET/CT data were acquired from the mid-thigh toward the base of the skull in two-dimensional or three-dimensional mode. The PET/CT acquisition time was at least 3 min per cradle position.
4.2.5. PRIMA
- (1)
- For the retrospective central review, all participating investigators having performed PET/CT scans in the initial analysis were asked to submit on CD-ROM the PET/CT data at baseline and/or post-induction. The scans were read independently by two experienced nuclear medicine physicians. In the event of a discrepant interpretation, a third reader provided adjudication. Post-induction PET response was assessed using the IHP criteria and the Deauville 5-point scale. SUVmax was measured for each involved nodal and extranodal site.
- (2)
- No information was given for PET/CT scanner equalization.
- (3)
- PET/CT scanners varied among centres but for all scans data acquisition was from the skull base to the upper thighs, after fasting 4–6 h with a recorded median blood glucose of 5.3 mmol/L for baseline scans and 5.9 mmol/L for post-induction scans. Median injected FDG activity was 360 MBq (range 200–668 MBq) with a median activity per weight of 5.0 MBq/kg. The median uptake time was 60 min (range 45–110).
4.2.6. PET-Folliculaire
- (1)
- PET scans were centrally reviewed by three experienced nuclear medicine physicians on a dedicated network of workstations [43]. Differences between observers were resolved by majority view. PET/CT results were reported using the Deauville 5-point scale. Two different thresholds were compared to define positivity and negativity: residual activity greater than the liver activity (scores 4 and 5), and residual activity greater than the mediastinal blood pool (scores 3, 4, and 5).
- (2)
- Regular testing of image quality performed by a qualified physicist as recommended by the SFPM (French Society of Medical Physics) was required from each centre.
- (3)
- PET/CT was performed in each centre on a dedicated PET/CT scanner according to standardized modalities, taking into account the technical characteristics of each camera. Patients fasted for at least 6 h before each scan and had to have a blood glucose concentration <10 mmol/L. They were administered intravenous injections of 3.5 to 8 MBq/kg (minimal activity, 185 MBq) FDG and were asked to lie in supine position for 1 h to avoid muscular uptake. Imaging was performed to cover a volume starting from the upper thigh to the skull base. Images were reconstructed iteratively with and without attenuation correction.
5. Evaluation of Error Reduction Strategies in Onco-Heamatological Clinical Trials
5.1. Central Review
5.1.1. Independent versus Consensus versus Adjudicator
5.1.2. Multi versus Single Readers
5.1.3. Concentrated versus Distributed
5.1.4. Stand-Alone versus Mixed
5.1.5. Real-Time versus Retrospective
5.2. PET/CT Scanner Equalization
5.3. Harmonization of PET Procedure
6. Conclusions
Acknowledgments
Conflicts of Interest
References
- Jerusalem, G.; Hustinx, R.; Beguin, Y.; Fillet, G. The value of positron emission tomography (PET) imaging in disease staging and therapy assessment. Ann. Oncol. 2002, 13 (Suppl. S4), 227–234. [Google Scholar] [CrossRef] [PubMed]
- Gallamini, A.; Zwarthoed, C.; Borra, A. Positron Emission Tomography (PET) in Oncology. Cancers 2014, 6, 1821–1889. [Google Scholar] [CrossRef] [PubMed]
- Kostakoglu, L.; Cheson, B.D. Current role of FDG PET/CT in lymphoma. Eur. J. Nucl. Med. Mol. Imaging 2014, 41, 1004–1027. [Google Scholar] [CrossRef] [PubMed]
- Biggi, A.; Guerra, L.; Hofman, M.S. Current status of FDG-PET/CT in staging of adult lymphoma. Clin. Transl. Imaging 2015, 3, 253–269. [Google Scholar] [CrossRef]
- Cheson, B.; Fisher, R.; Barrington, S. Recommendations for initial evaluation, staging, and response assessment of Hodgkin and Non-Hodgkin lymphoma: The Lugano classification. J. Clin. Oncol. 2014, 32, 3059–3068. [Google Scholar] [CrossRef] [PubMed]
- Hutchings, M.; Barrington, S.F. PET/CT for therapy response assessment in lymphoma. J. Nucl. Med. 2009, 50 (Suppl. S1), 21S–30S. [Google Scholar] [CrossRef] [PubMed]
- Hutchings, M.; Barrington, S. FDG-PET for the early treatment monitoring, for final response and follow-up evaluation in lymphoma. Clin. Transl. Imaging 2015, 3, 271–281. [Google Scholar] [CrossRef]
- Meignan, M.; Gallamini, A.; Haioun, C. Report on the First International Workshop on Interim-PET-Scan in Lymphoma. Leuk. Lymphoma 2009, 50, 1257–1260. [Google Scholar] [CrossRef] [PubMed]
- Wahl, R.L.; Jacene, H.; Kasamon, Y.; Lodge, M.A. From RECIST to PERCIST: Evolving Considerations for PET response criteria in solid tumors. J. Nucl. Med. 2009, 50 (Suppl. S1), 122S–150S. [Google Scholar] [CrossRef] [PubMed]
- Juweid, M.E.; Stroobants, S.; Hoekstra, O.S.; Mottaghy, F.M.; Dietlein, M.; Guermazi, A.; Wiseman, G.A.; Kostakoglu, L.; Scheidhauer, K.; Buck, A.; et al. Use of Positron Emission Tomography for Response Assessment of Lymphoma: Consensus of the Imaging Subcommittee of International Harmonization Project in Lymphoma. J. Clin. Oncol. 2007, 25, 571–578. [Google Scholar] [CrossRef] [PubMed]
- Meignan, M.; Itti, E.; Gallamini, A. FDG PET/CT imaging as a biomarker in lymphoma. Eur. J. Nucl. Med. Mol. Imaging 2015, 42, 623–633. [Google Scholar] [CrossRef] [PubMed]
- Kostakoglu, L.; Chauvie, S. PET-derived metabolic volume metrics in lymphoma. Clin. Transl. Imaging 2015, 3, 331–341. [Google Scholar] [CrossRef]
- Gallagher, B.M.; Fowler, J.S.; Gutterson, N.I.; Macgregor, R.R.; Wolf, A.P. Metabolic Trapping as a Principle of Radiopharmaceuticals Design: Some Factors Responsible for the Biodistribution of FDG. J. Nucl. Med. 1978, 19, 1154–1161. [Google Scholar] [PubMed]
- Laffon, E.; Adhoute, X.; de Clermont, H.; Marthan, R. Is Liver SUV Stable over Time in 18F-FDG PET Imaging? J. Nucl. Med. Technol. 2011, 39, 258–263. [Google Scholar] [CrossRef] [PubMed]
- Barrington, S.; Qian, W.; Somer, E.; Franceschetto, A.; Bagni, B.; Brun, E.; Almquist, A.; Højgaard, L.; Federico, M.; Gallamini, A.; et al. O’Doherty Concordance between four European centres of PET reporting criteria designed for use in multicentre trials in Hodgkin lymphoma. Eur. J. Nucl. Med. Mol. Imaging 2010, 37, 1824–1833. [Google Scholar] [CrossRef] [PubMed]
- Biggi, A.; Gallamini, A.; Chauvie, S.; Hutchings, M.; Kostakoglu, L.; Gregianin, M.; Meignan, M.; Malkowski, B.; Hofman, M.S.; Barrington, S.F. International validation study for interim PET in ABVD-treated, advanced-stage hodgkin lymphoma: Interpretation criteria and concordance rate among reviewers. J. Nucl. Med. 2013, 54, 683–690. [Google Scholar] [CrossRef] [PubMed]
- Chauvie, S.; Biggi, A.; Stancu, A.; Cerello, P.; Cavallo, A.; Fallanca, F.; Ficola, U.; Gregianin, M.; Guerra, U.P.; Chiaravalloti, A.; et al. WIDEN: A tool for medical image management in multicenter clinical trials. Clin. Trials 2014, 11, 1–7. [Google Scholar] [CrossRef] [PubMed]
- Itti, E.; Meignan, M.; Berriolo-Riedinger, A.; Biggi, A.; Cashen, A.F.; Véra, P.; Tilly, H.; Siegel, B.A.; Gallamini, A.; Casasnovas, R.-O.; et al. An international confirmatory study of the prognostic value of early PET/CT in diffuse large B-cell lymphoma: Comparison between Deauville criteria and ΔSUVmax. Eur. J. Nucl. Med. Mol. Imaging 2013, 40, 1312–1320. [Google Scholar] [CrossRef] [PubMed]
- Ceriani, L.; Barrington, S.; Biggi, A.; Malkowski, B.; Metser, U.; Versari, A.; Martelli, M.; Davies, A.; Johnson, P.W.; Zucca, E.; et al. Training improves the interobserver agreement of the expert positron emission tomography review panel in primary mediastinal B-cell lymphoma: Interim analysis in the ongoing International Extranodal Lymphoma Study Group-37 study. Hematol. Oncol. 2016. [Google Scholar] [CrossRef] [PubMed]
- Kalpadakis, C.; Pangalis, G.A.; Dimopoulou, M.N.; Vassilakopoulos, T.P.; Kyrtsonis, M.-C.; Korkolopoulou, P.; Kontopidou, F.N.; Siakantaris, M.P.; Dimitriadou, E.M.; Kokoris, S.I.; et al. Rituximab monotherapy is highly effective in splenic marginal zone lymphoma. Hematol. Oncol. 2007, 25, 127–131. [Google Scholar] [CrossRef] [PubMed]
- Boellaard, R.; O’Doherty, M.J.; Weber, W.A.; Mottaghy, F.M.; Lonsdale, M.N.; Stroobants, S.G.; Oyen, W.J.G.; Kotzerke, J.; Hoekstra, O.S.; Pruim, J.; et al. FDG PET and PET/CT: EANM procedure guidelines for tumour PET imaging: Version 1.0. Eur. J. Nucl. Med. Mol. Imaging 2010, 37, 181–200. [Google Scholar] [CrossRef] [PubMed] [Green Version]
- Boellaard, R.; Delgado-Bolton, R.; Oyen, W.J.G.; Giammarile, F.; Tatsch, K.; Eschner, W.; Verzijlbergen, F.J.; Barrington, S.F.; Pike, L.C.; Weber, W.A.; et al. European Association of Nuclear Medicine (EANM) FDG PET/CT: EANM procedure guidelines for tumour imaging: Version 2.0. Eur. J. Nucl. Med. Mol. Imaging 2015, 42, 328–354. [Google Scholar] [CrossRef] [PubMed]
- Zijlstra, J.M.; Boellaard, R.; Hoekstra, O.S. Interim positron emission tomography scan in multi-center studies: Optimization of visual and quantitative assessments. Leuk. Lymphoma 2009, 50, 1748–1749. [Google Scholar] [CrossRef] [PubMed]
- Makris, N.E.; Huisman, M.C.; Kinahan, P.E.; Lammertsma, A.A.; Boellaard, R. Evaluation of strategies towards harmonization of FDG PET/CT studies in multicentre trials: Comparison of scanner validation phantoms and data analysis procedures. Eur. J. Nucl. Med. Mol. Imaging 2013, 40, 1507–1515. [Google Scholar] [CrossRef] [PubMed]
- Lammertsma, A.A.; Boellaard, R. The need for quantitative PET in multicentre studies. Clin. Transl. Imaging 2014, 2, 277–280. [Google Scholar] [CrossRef]
- Adams, M.C.; Turkington, T.G.; Wilson, J.M.; Wong, T.Z. A systematic review of the factors affecting accuracy of SUV measurements. Am. J. Roentgenol. 2010, 195, 310–320. [Google Scholar] [CrossRef] [PubMed]
- Boellaard, R. Methodological aspects of multicenter studies with quantitative PET. Methods Mol. Biol. 2011, 727, 335–349. [Google Scholar] [PubMed]
- Geworski, L.; Knoop, B.O.; de Wit, M.; Ivancević, V.; Bares, R.; Munz, D.L. Multicenter comparison of calibration and cross calibration of PET scanners. J. Nucl. Med. 2002, 43, 635–639. [Google Scholar] [PubMed]
- Barrington, S.F.; Mackewn, J.E.; Schleyer, P.; Marsden, P.K.; Mikhaeel, N.G.; Qian, W.; Mouncey, P.; Patrick, P.; Popova, B.; Johnson, P.; et al. Establishment of a UK-wide network to facilitate the acquisition of quality assured FDG-PET data for clinical trials in lymphoma. Ann. Oncol. 2011, 22, 739–745. [Google Scholar] [CrossRef] [PubMed]
- Chauvie, S. The 68Ge phantom-based FDG-PET site qualification program for clinical trials adopted by FIL (Italian Foundation on Lymphoma). Phys. Med. 2016, 32, 651–656. [Google Scholar] [CrossRef] [PubMed]
- Scheuermann, J.S.; Saffer, J.R.; Karp, J.S.; Levering, A.M.; Siegel, B.A. Qualification of PET scanners for use in multicenter cancer clinical trials: The American College of Radiology Imaging Network experience. J. Nucl. Med. 2009, 50, 1187–1193. [Google Scholar] [CrossRef] [PubMed]
- Christian, P. Use of a precision fillable clinical simulator phantom for PET/CT scanner validation in multi-center clinical trials: The SNM Clinical Trials Network (CTN) Program. J. Nucl. Med. 2012, 53 (Suppl. S1), 437. [Google Scholar]
- Soret, M.; Bacharach, S.L.; Buvat, I. Partial-volume effect in PET tumor imaging. J. Nucl. Med. 2007, 48, 932–945. [Google Scholar] [CrossRef] [PubMed]
- Matheoud, R.; Della Monica, P.; Secco, C.; Loi, G.; Krengli, M.; Inglese, E.; Brambilla, M. Influence of different contributions of scatter and attenuation on the threshold values in contrast-based algorithms for volume segmentation. Phys. Med. 2011, 27, 44–51. [Google Scholar] [CrossRef] [PubMed]
- Lasnon, C.; Houdu, B.; Kammerer, E.; Salomon, T.; Devreese, J.; Lebasnier, A.; Aide, N. Patient’s weight: A neglected cause of variability in SUV measurements? A survey from an EARL accredited PET centre in 513 patients. Eur. J. Nucl. Med. Mol. Imaging 2016, 43, 197–199. [Google Scholar] [CrossRef] [PubMed]
- Weber, W.A.; Ziegler, S.I.; Thödtmann, R.; Hanauske, A.R.; Schwaiger, M. Reproducibility of metabolic measurements in malignant tumors using FDG PET. J. Nucl. Med. 1999, 40, 1771–1777. [Google Scholar] [PubMed]
- Silva-rodríguez, J.; Aguiar, P.; Sánchez, M.; Mosquera, J.; Luna-vega, V.; Cortés, J.; Garrido, M.; Pombar, M.; Ruibal, Á. Correction for FDG PET dose extravasations: Monte Carlo validation and quantitative evaluation of patient studies Correction for FDG PET dose extravasations: Monte Carlo validation. Med. Phys. 2014, 41, 052502. [Google Scholar] [CrossRef] [PubMed]
- Graham, M.M.; Wahl, R.L.; Hoffman, J.M.; Yap, J.T.; Sunderland, J.J.; Boellaard, R.; Perlman, E.S.; Kinahan, P.E.; Christian, P.E.; Hoekstra, O.S.; et al. Summary of the UPICT Protocol for 18F-FDG PET/CT Imaging in Oncology Clinical Trials. J. Nucl. Med. 2015, 56, 955–961. [Google Scholar] [CrossRef] [PubMed]
- Radford, J.; Illidge, T.; Counsell, N.; Hancock, B.; Pettengell, R.; Johnson, P.; Wimperis, J.; Culligan, D.; Popova, B.; Smith, P.; et al. Results of a Trial of PET-Directed Therapy for Early-Stage Hodgkin’s Lymphoma. N. Engl. J. Med. 2015, 372, 1598–1607. [Google Scholar] [CrossRef] [PubMed]
- Press, O.W.; Li, H.; Sch, H.; Straus, D.J.; Moskowitz, C.H.; Leblanc, M.; Rimsza, L.M.; Bartlett, N.L.; Evens, A.M.; Mittra, E.S.; et al. US Intergroup Trial of Response-Adapted Therapy for Stage III to IV Hodgkin Lymphoma Using Early Interim Fluorodeoxyglucose-Positron Emission Tomography Imaging: Southwest Oncology Group S0816. J. Clin. Oncol. 2016, 34, 2020–2027. [Google Scholar] [CrossRef] [PubMed]
- Kobe, C.; Kuhnert, G.; Kahraman, D.; Haverkamp, H.; Eich, H.T.; Franke, M.; Persigehl, T.; Klutmann, S.; Amthauer, H.; Bockisch, A.; et al. Assessment of tumor size reduction improves outcome prediction of positron emission tomography/computed tomography after chemotherapy in advanced-stage Hodgkin lymphoma. J. Clin. Oncol. 2014, 32, 1776–1781. [Google Scholar] [CrossRef] [PubMed]
- Raemaekers, J.M.M.; André, M.P.E.; Federico, M.; Girinsky, T.; Oumedaly, R.; Brusamolino, E.; Brice, P.; Fermé, C.; Van Der Maazen, R.; Gotti, M.; et al. Omitting Radiotherapy in early positron emission tomography-negative stage I/II Hodgkin lymphoma is associated with an increased risk of early relapse: Clinical results of the preplanned interim analysis of the randomized EORTC/LYSA/FIL H10 trial. J. Clin. Oncol. 2014, 32, 1188–1194. [Google Scholar] [CrossRef] [PubMed]
- Meignan, M.; Itti, E.; Bardet, S.; Al, E. Development and application of a real-time on-line blinded independent central review of interim PET scans to determine treatment allocation in lymphoma trials. J. Clin. Oncol. 2009, 27, 2739–2741. [Google Scholar] [CrossRef] [PubMed]
- Federico, M.; Luminari, S.; Pellegrini, C.; Merli, F.; Pesce, E.A.; Chauvie, S.; Gandolfi, L.; Capodanno, I.; Salati, M.; Argnani, L.; et al. Brentuximab vedotin followed by ABVD +/− radiotherapy in patients with previously untreated Hodgkin lymphoma: Final results of a pilot phase II study. Haematologica 2015, 101, 139–141. [Google Scholar] [CrossRef] [PubMed]
- Bombardieri, E.; Aktolun, C.; Baum, R.P.; Bishof-Delaloye, A.; Buscombe, J.; Chatal, J.F.; Maffioli, L.; Moncayo, R.; Mortelmans, L.; Reske, S.N. FDG-PET: Procedure guidelines for tumour imaging. Eur. J. Nucl. Med. Mol. Imaging 2003, 30, 1. [Google Scholar] [CrossRef]
- Gurung, P.; Lukens, J.R.; Kanneganti, T. HHS Public Access. Br. J. Haematol. 2016, 21, 193–201. [Google Scholar]
- Horning, S.J.; Juweid, M.E.; Schöder, H.; Wiseman, G.; Mcmillan, A.; Lode, J.; Advani, R.; Gascoyne, R.; Quon, A.; Horning, S.J.; et al. Interim positron emission tomography scans in diffuse large B-cell lymphoma: An independent expert nuclear medicine evaluation of the Eastern Cooperative Oncology Group E3404 study CME article Interim positron emission tomography scans in diffuse large B. Blood 2010, 115, 775–777. [Google Scholar] [CrossRef] [PubMed]
- Mamot, C.; Klingbiel, D.; Hitz, F.; Renner, C.; Pabst, T.; Driessen, C.; Mey, U.; Pless, M.; Bargetzi, M.; Krasniqi, F.; et al. Final Results of a Prospective Evaluation of the Predictive Value of Interim Positron Emission Tomography in Patients with Diffuse Large B-Cell Lymphoma Treated With R-CHOP-14 (SAKK 38/07). J. Clin. Oncol. 2015, 33, 2523–2529. [Google Scholar] [CrossRef] [PubMed]
- Lin, C.; Itti, E.; Haioun, C.; Petegnief, Y.; Luciani, A.; Dupuis, J.; Paone, G.; Talbot, J.-N.; Rahmouni, A.; Meignan, M. Early 18F-FDG PET for prediction of prognosis in patients with diffuse large B-cell lymphoma: SUV-based assessment versus visual analysis. J. Nucl. Med. 2007, 48, 1626–1632. [Google Scholar] [CrossRef] [PubMed]
- Pardal, E.; Coronado, M.; Martín, A.; Grande, C.; Marín-Niebla, A.; Panizo, C.; Bello, J.L.; Conde, E.; Hernández, M.T.; Arranz, R.; et al. Intensification treatment based on early FDG-PET in patients with high-risk diffuse large B-cell lymphoma: A phase II GELTAMO trial. Br. J. Haematol. 2014, 167, 327–336. [Google Scholar] [CrossRef] [PubMed]
- Martelli, M.; Ceriani, L.; Zucca, E.; Zinzani, P.L.; Ferreri, A.J.M.; Vitolo, U.; Stelitano, C.; Brusamolino, E.; Cabras, M.G.; Rigacci, L.; et al. [18F]fluorodeoxyglucose positron emission tomography predicts survival after chemoimmunotherapy for primary mediastinal large B-cell lymphoma: Results of the International Extranodal Lymphoma Study Group IELSG-26 study. J. Clin. Oncol. 2014, 32, 1769–1775. [Google Scholar] [CrossRef] [PubMed]
- Tychyj-Pinel, C.; Ricard, F.; Fulham, M.; Fournier, M.; Meignan, M.; Lamy, T.; Vera, P.; Salles, G.; Trotman, J. PET/CT assessment in follicular lymphoma using standardized criteria: Central review in the PRIMA study. Eur. J. Nucl. Med. Mol. Imaging 2014, 41, 408–415. [Google Scholar] [CrossRef] [PubMed]
- Dupuis, J.; Berriolo-Riedinger, A.; Julian, A.; Brice, P.; Tychyj-Pinel, C.; Tilly, H.; Mounier, N.; Gallamini, A.; Feugier, P.; Soubeyran, P.; et al. Impact of [18F]fluorodeoxyglucose positron emission tomography response evaluation in patients with high-tumor burden follicular lymphoma treated with immunochemotherapy: A prospective study from the Groupe d’Etudes des Lymphomes de l’Adulte and GOELAMS. J. Clin. Oncol. 2012, 30, 4317–4322. [Google Scholar] [CrossRef] [PubMed]
- US Food and Drug Administration. Guidance for Industry: Clinical Trial Endpoints for the Approval of Cancer Drugs and Biologics; US Food and Drug Administration: Washington, DC, USA, 2007.
- Fahey, F.H.; Kinahan, P.E.; Doot, R.K.; Kocak, M.; Thurston, H.; Poussaint, T.Y. Variability in PET quantitation within a multicenter consortium. Med. Phys. 2010, 37, 3660–3666. [Google Scholar] [CrossRef] [PubMed]
- Boellaard, R.; Hristova, I.; Ettinger, S.; Sera, T.; Stroobants, S.; Chiti, A.; Bauer, A.; Tatsch, K.; Verzijlbergen, F.; Oyen, W. EARL FDG-PET/CT accreditation program: Feasibility, overview and results of first 55 successfully accredited sites. J. Nucl. Med. 2013, 54 (Suppl. S2), 2052. [Google Scholar]
- Sunderland, J.J.; Christian, P.E. Quantitative PET/CT Scanner Performance Chracterization Based upon the SNMMI Clinical Trial Networ Oncology Clinical Simulator Phantom. J. Nucl. Med. 2015, 56, 145–152. [Google Scholar] [CrossRef] [PubMed]
- Daisaki, H.; Tateishi, U.; Terauchi, T.; Tatsumi, M.; Suzuki, K.; Shimada, N.; Nishida, H.; Numata, A.; Kato, K.; Akashi, K.; et al. Standardization of image quality across multiple centers by optimization of acquisition and reconstruction parameters with interim FDG-PET/CT for evaluating diffuse large B cell lymphoma. Ann. Nucl. Med. 2013, 27, 225–232. [Google Scholar] [CrossRef] [PubMed]
- Delbeke, D.; Coleman, R.E.; Guiberteau, M.J.; Brown, M.L.; Royal, H.D.; Siegel, B.A.; Townsend, D.W.; Berland, L.L.; Parker, J.A.; Hubner, K.; et al. Procedure guideline for tumor imaging with 18F-FDG PET/CT 1.0. J. Nucl. Med. 2006, 47, 885–895. [Google Scholar] [PubMed]
- Graham, M.M.; Badawi, R.D.; Wahl, R.L. Variations in PET/CT methodology for oncologic imaging at U.S. academic medical centers: An imaging response assessment team survey. J. Nucl. Med. 2011, 52, 311–317. [Google Scholar] [CrossRef] [PubMed]
- Beyer, T.; Czernin, J.; Freudenberg, L.S. Variations in clinical PET/CT operations: Results of an international survey of active PET/CT users. J. Nucl. Med. 2011, 52, 303–310. [Google Scholar] [CrossRef] [PubMed]
- Boellaard, R.; Oyen, W.J.G.; Hoekstra, C.J.; Hoekstra, O.S.; Visser, E.P.; Willemsen, A.T.; Arends, B.; Verzijlbergen, F.J.; Zijlstra, J.; Paans, A.M.; et al. The Netherlands protocol for standardisation and quantification of FDG whole body PET studies in multi-centre trials. Eur. J. Nucl. Med. Mol. Imaging 2008, 35, 2320–2333. [Google Scholar] [CrossRef] [PubMed]
- Boellaard, R. Standards for PET image acquisition and quantitative data analysis. J. Nucl. Med. 2009, 50 (Suppl. S1), 11S–20S. [Google Scholar] [CrossRef] [PubMed]


| Clinical Trials | Independent vs. Consensus vs. Adjudicator | Multi vs. Single Readers | Concentrated vs. Distributed | Stand-Alone vs. Mixed | Real-Time vs. Retrospective |
|---|---|---|---|---|---|
| RAPID | A | M | C | S | RT |
| RATHL | A | M | C | S | RT |
| S0816 | A | M | D | M | RT |
| HD15 | C | M | C | S | RT |
| H10 | - | M | D | M | RT |
| BV-ABVD | I | M | D | S | R |
| HD0607 | I | M | D | M | RT |
| E3404 | I | M | D | S | RT |
| SAKK38/07 | I | S | C | S | R |
| GELTAMO-2006 | - | S | C | S | R |
| IELSG26 | - | S | C | S | R |
| PRIMA | A | M | C | M | R |
| PET-Folliculaire | I | M | D | S | R |
© 2016 by the authors. Licensee MDPI, Basel, Switzerland. This article is an open access article distributed under the terms and conditions of the Creative Commons Attribution (CC-BY) license ( http://creativecommons.org/licenses/by/4.0/).
Share and Cite
Chauvie, S.; Bergesio, F. The Strategies to Homogenize PET/CT Metrics: The Case of Onco-Haematological Clinical Trials. Biomedicines 2016, 4, 26. https://doi.org/10.3390/biomedicines4040026
Chauvie S, Bergesio F. The Strategies to Homogenize PET/CT Metrics: The Case of Onco-Haematological Clinical Trials. Biomedicines. 2016; 4(4):26. https://doi.org/10.3390/biomedicines4040026
Chicago/Turabian StyleChauvie, Stephane, and Fabrizio Bergesio. 2016. "The Strategies to Homogenize PET/CT Metrics: The Case of Onco-Haematological Clinical Trials" Biomedicines 4, no. 4: 26. https://doi.org/10.3390/biomedicines4040026