
Risk Self-Selection and the Concept of Equilibrium in a Competitive Insurance Market


Department of Risk and Insurance, Collegium of Management and Finance, Warsaw School of Economics (SGH), 162 al. Niepodległości, 02-554 Warsaw, Poland
*
Author to whom correspondence should be addressed.
Risks 2022, 10(1), 9; https://doi.org/10.3390/risks10010009
Submission received: 24 November 2021
/
Revised: 17 December 2021
/
Accepted: 21 December 2021
/
Published: 2 January 2022
Abstract
:The purpose of this paper is an analysis of the presence of self-selection mechanisms on the market that could bring the market closer to the separating equilibrium state, in line with the Rothschild–Stiglitz equilibrium model and its subsequent modifications. An example is the Polish market of compulsory third-party liability insurance of vehicle owners. This paper describes this market in terms of both its structure and its financial results. The main focus is on describing the assumptions of the Rothschild–Stiglitz model for markets operating under the conditions of information asymmetry and based on the self-selection mechanism, allowing for an unequivocal determination of the insured’s profile without the need to actually observe the insured’s behaviour. Finally, we show that thanks to the self-selection induced by the possibility of driving behaviour monitoring, the industry can minimise the negative effect information asymmetry has on the motor insurance market. This can be achieved, for example, by observing the choices made by the insured after being offered a new voluntary contract with a premium based on telematics data. Our analysis was carried out with the use of three selected characteristics that can determine the insured’s risk profile, i.e., distance covered, self-assessment, and insurance premium paid; the significance of the latter—although it may be intuitive—is questionable at commonly accepted significance levels. Therefore, the main result is that although there is some evidence on the disputed matter, there can be no definitive conclusion—especially in terms of risk as measured by insurance premium.
1. Introduction
Equilibrium takes place when supply and demand balance one another, which results in stable prices. Some scientists (e.g., A. Smith) thought that free market would naturally reach a state of equilibrium. However, there are some biases that cause difficulties in this process. One of the most common features of disequilibrium is information asymmetry. The effectiveness of potential equilibrium in markets with asymmetric information has been the subject of intensive research. Thus far, it has been found that the strength of the impact of information asymmetry on market equilibrium depends mainly on whether the source of information has a private or a common value. In their now-classic paper, Rothschild and Stiglitz (1976) analysed the competitive market with adverse selection, and argued that when insurers offer contracts to clients who have information about their risk profile (such information has a common value, both for insurers and for their clients), equilibrium in pure strategies may not be achievable. The results of their deliberations and, in particular, the thesis concerning such imbalance, became the impetus for many treatises on economic theory. One of aspect of markets with asymmetric information that can help them to achieve equilibrium is self-selection, which refers to the pattern of choices made by individuals with distinct personal attributes when an entity is facing a set of possible contracts (Puelz and Snow 1994; Shapira and Venezia 1999). The main aim of this paper is to analyse the presence of self-selection mechanisms on the market that could bring the market closer to the separating equilibrium state, consistent with the assumptions of the Rothschild–Stiglitz model (RS). We analysed the motor insurance market in Poland as the largest among other CEE insurance markets.
Rothschild and Stiglitz formulated a definition of equilibrium in a competitive insurance market, assuming that equilibrium is a menu of contracts, such that when the insured make choices that maximise their expected utility, the following is true:
- None of its elements make negative expected profits;
- Outside the equilibrium set, no contract can make a non-negative profit.
According to the above definition, the market in Poland does not reach a state of equilibrium. We can note that the long-term technical losses recorded on the Polish market vis-à-vis the compulsory motor third-party liability insurance (MTPL) suggest that the market does not meet the first of the conditions, as a minimum.
This may be reflected in the sharp increase in average premiums that was noticeable from the second quarter of 2016. In spite of this, premiums are still low, and long-term policies may need to be adopted to ensure stability and predictability in the market. To achieve this, more efforts should be made towards the individualisation of premiums.
2. Characteristics of the Polish MTPL Insurance Market between 2007 and 2020
2.1. Market Concentration
The motor insurance market in Poland is constantly changing, in terms of both the number of insurance companies operating in this field and the share structure of individual insurers. Since the 1989 systemic transition, the Polish market has become the biggest among all other CEE P&C markets (Figure 1).
According to the Polish Financial Supervision Authority (UKNF 2021), at the end of Q3 of 2020, 32 domestic insurance companies, including 23 companies with a permit to conduct direct activity within Group 10 (liability insurance arising out of the possession of self-propelled land vehicles), had a permit to conduct insurance activity in Section II (other personal and property insurance). At the end of 2020, the largest share in the MTPL market, as measured by the amount of gross written premium, was held by PZU S.A (28.03%), TUiR WARTA S.A. (19.49%), and STU Ergo Hestia S.A. (17.05%). Even though these three insurers held a total of 65% of the market share, the value of the Herfindahl–Hirschman Index (HHI) can be given by the following formula:
where is the share of the ith insurance company in the market measured by gross written premium, amounting to 1598 (calculated on the basis of UKNF 2021); this represents a moderate concentration. The index level is gradually reducing, which may indicate a decline in the competitiveness of the motor insurance market in Poland. This amount was mostly influenced by the market share of PZU S.A. Shares in the MTPL insurance market of the main insurers between the years 2007 and 2020 are presented in Table 1.
Although PZU S.A. continues to hold the largest share of the motor insurance market, their share is systematically decreasing. In 2007, the gross premium attributable to PZU from the MTPL accounted for 43.36% of all premiums on the market for this insurance. After 10 years, the share of PZU had been reduced to less than 31%, while the simultaneous increase in the shares of other insurers may indicate an increase in competition and an increasingly less concentrated market. By the end of 2020, the share of the largest insurer had fallen to just over 20%. The change in the share of the biggest insurer and the diminishing market concentration makes the market more competitive. Theoretically, this should result in the market being closer to an equilibrium state; however, without the relevant data, we cannot conclude that.
2.2. Premiums and Compensation
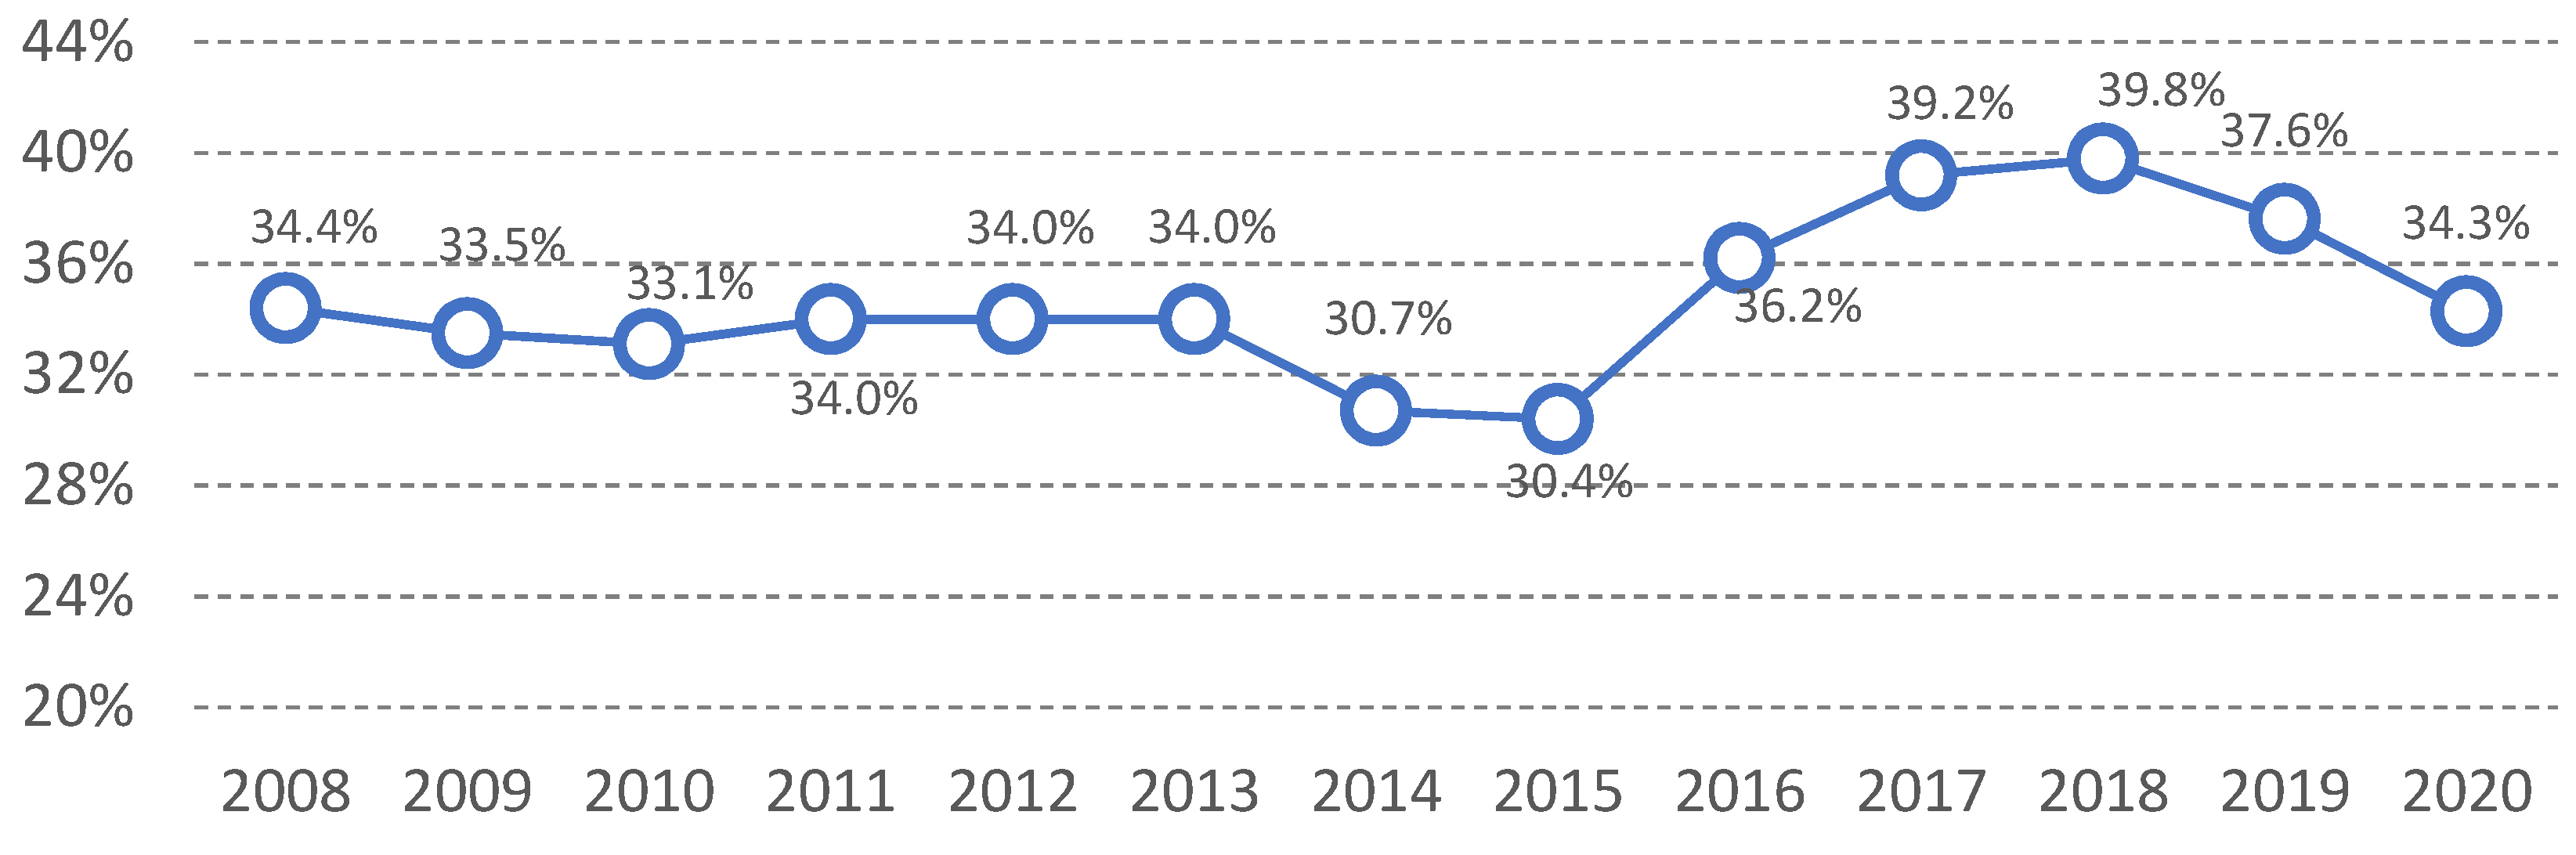
Compulsory motor third-party liability insurance is the most frequently purchased insurance in Poland. According to research, as many as 83.8% of individual clients have MTPL (Nowotarska-Romaniak 2014). This, therefore, also represents the largest share of the total insurance non-life premiums. Almost continuously (except 2014 and 2015), the share of MTPL in total non-life premiums has remained above 33%, as can be seen in Figure 2.
Table 2 presents basic data on the activity in the MTPL market between 2007 and 2020 for the entire insurance sector.
In 2020, the gross written premium for MTPL in Poland amounted to PLN 14.631 million, and it had decreased by 2% y/y. After a period characterised by rapid acceleration in premium dynamics (2016), stagnation has been the case since 2018, with a slight downward trend. In 2020, gross claims and benefits paid under MTPL amounted to PLN 9.002 million. As is the case with gross written premium, there was a decrease, compared to 2019, of less than 5% y/y. An upward trend has been observed since 2007, but in 2020 there was a decline—probably due pandemic-related traffic restrictions.
2.3. Technical Result
Between 2007 and 2016, the technical results for MTPL insurance were negative. Technical loss at the end of 2016 amounted to PLN 1.093 million, but had increased in comparison with the same period of the previous year, when it amounted to PLN 1.056 million PLN. The technical loss in this insurance segment has continued since 2007, when it amounted to PLN 148.770.000. It has long been indicated that negative financial outcomes in MTPL can be the result of the premiums set at an underestimated level. This is, among other things, the consequence of the price war observed in Poland, which is particularly evident in the motor insurance field, and which has led to a significant decrease in the amount of insurance premiums (Tomaszewska 2017). Regardless of an increase in the MTPL premiums, between 2016 and 2017, the following was the case:
- Vehicle repair costs were constantly rising, as were the costs for medical procedures;
- Costs incurred by insurers were growing, in connection with the guidelines for claims settlement introduced by the Polish Financial Supervision Authority;
- Changes in the legal environment were proliferating, such as the tendency of courts to award ever-higher compensation to accident victims and their relatives;
- The taxation rules regarding, for example, the inclusion of VAT in the claims settlement process, were being amended;
- Changes in societal income, leading to an increase in future compensatory pensions and to increased needs, were also on the increase.
This resulted, in 2016, in the losses of MTPL remaining at a level similar to that of 2015, while 2017 was the first year in which the technical result reached a positive value, amounting only to PLN 482.6 million. A similar situation occurred in 2018, when the technical profit was PLN 447 million. A positive technical result also occurred at the end of 2019 and in 2020. In 2020, the technical result fell by just over 42% y/y. Undoubtedly, one of the reasons for the improvement in the technical efficiency of the MTPL market was the decline in the value of gross claims and claims related to the COVID-19 pandemic, which has forced many drivers to change their habits, and led to far fewer vehicles being on the roads.
It should be borne in mind that the global pandemic and lockdown not only had a positive impact on the number of claims—which was a consequence of the economic slowdown and the fact that people were forced to immediately transfer their activities to an Internet environment (Gębski 2021)—but also caused negative or undesirable effects to appear.
Due to the limitation of income, some of the insured resigned from insurance (including compulsory insurance), while others decided not to provide insurers with reliable information about their risk—leading in turn to an underestimation of their insurance premiums. A separate group is also made up of the insured who decided to extort compensation in order to protect their own budgets. All of these actions had unforeseen effects on both the performance of individual insurers and the overall market equilibrium.
3. The RS Model and the MTPL Insurance Market in Poland
Considering the market and legal conditions of motor third-party liability insurance in Poland, we concluded that the RS model of competitive markets with asymmetric information is sufficient for the correct description of the situation of the MTPL market. This model most accurately reflects the conditions for the functioning of the market, and the following arguments should be mentioned among the premises behind the choice of the above model:
- The RS model, unlike its later modifications, does not allow contracts to be cancelled once offered, meaning that there are significant barriers to exiting the market; this is in line with the compulsory nature of MTPL insurance;
- The MTPL market in Poland can be considered a competitive market, despite the dominant role of one of the market players; evidence of this may be found in the entry of new players into the market, based on their freedom to provide insurance and re-insurance services; moreover, the HHI value of 1683 shows a moderate concentration;
- Insurers operating on the market try to select the risk and differentiate insurance premiums—for example, through the widespread use of no-claims bonuses—due to which the market strives to achieve a separating rather than a pooling equilibrium;
- Although insurers seek to maximize profits, they must follow the premium–compensation balance principle, which requires the insurance fund and expected compensations to be balanced; this is directly reflected in the definition of equilibrium, assuming no long-term profits at the technical level;
- The insured are in possession of private information of a common value, especially regarding the way in which the vehicle is used, which results in information asymmetry on the market, possibly resulting in adverse selection;
- The RS model is based on two variables—the premium, and the value of the potential compensation—ignoring the issue of product differentiation through additional services.
In addition, the presence of a negative technical result in the Polish market may suggest market imbalance caused by the following:
- The introduction by some market players of cream-skimming contracts, causing losses among other insurers;
- High-risk insured persons withholding information relevant to the correct premium calculation, and their purchase of contracts dedicated to low-risk groups.
Both situations are consistent with the consequences of the model assumptions adopted, making the achievement of a state of separating equilibrium dependent on the narrowing of the scope of cover offered to low-risk insured persons, as well as the impossibility of introducing cream-skimming contracts by one or more market participants. This confirms the correct selection of the model to describe the situation of the Polish motor third-party liability insurance market.
However, under asymmetric information, with the assumptions of the RS model having been adopted, the market cannot reach the pooling equilibrium, while the existence of a separating equilibrium is also not guaranteed. Having full knowledge of the insured’s risk type, the insurer could achieve financial balance by offering them contracts that provide full coverage. The monopolist can also achieve full premium extraction from each risk class. This efficiency cannot be achieved when information is asymmetric (Snow 2015). The consequences of information asymmetry primarily affect low-risk insured persons who experience loss of utility due to a premium that is too high, in relation to their probability of loss incurrence, or in connection with partial insurance. The Nash equilibrium concept, which does not allow a contract that can generate a non-negative profit to exist outside an equilibrium set, is therefore insufficient for the correct description of the motor insurance market in the RS model (the conditions of the Nash equilibrium may not be met once the market has offered a CP contract). Authors such as Wilson (1977); Janes (1978); Beliveau (1984); Dionne and Doherty (1991); and Donnelly et al. (2014) have indicated that adverse selection can be reduced by using screening. This can be done when the insured are offered a menu of alternative contracts in order to induce self-selection. The question remains as to whether there are effective tools for the application of the selection mechanism, which allows for the correct categorisation of insured persons.
4. Research Assumptions and Design
4.1. Research Question
As part of the discussion on the insurance market equilibrium, the question arises as to whether the use of tools by insurers to monitor the driving style of the insured will activate the self-selection mechanism, which would allow for an unequivocal determination of the insured’s profile without the need to actually observe their behaviour—especially those who do not allow for their driving patterns to be monitored. The question comes down to assessing the truthfulness of the statement that the insured disclose their risk profile when deciding on the type of insurance contract they want to purchase.
For the purposes of further analysis, the original RS model was modified by assuming that the insurers, in addition to the original separating contracts CH (qH, rH) i CL’(qL’, rL’), decide to introduce an additional contract CD with a tariff using information about the insured’s driving style, where q is the value of potential compensation and r is the amount of the premium for low (L)- and high (H) risk groups, respectively.
This contract, graphically presented in Figure 3, provides full qD coverage with the premium rL if the insured uses the vehicle responsibly and safely, or with the premium rH if they are assigned to the H group; it provides full coverage qD = qL = qH = d with the following premium:
where rL < rH.
As can be inferred from the market model, when selecting a specific type of insurance contract from the set of possible types of contracts, the following is true:
- Group L have an incentive to provide the insurer with data on their driving style, as this would enable them to choose the contract on the higher indifference curve. At the same time, they will not suffer the limitation of usefulness due to information asymmetry. Thus, they reveal their risk group to the insurer, and in return receive full coverage with a still-low premium;
- Group H are indifferent to the contracts offered, as both the dedicated contract with the traditional tariff and the insurance contract using data on their behaviour provide full coverage. Insured persons are also aware that the lower premium, in the event of concluding a CD contract, will only be available if they change their driving style and use the vehicle safely. It can be expected that at least some of the insured—aware of the consequences of introducing the possibility of the insurer monitoring their behaviour, and encouraged by the vision of a lower premium—will verify their driving style and conclude a CD contract; others, who do not see the need to change their driving style, will remain with the traditional contract.
As can be seen in Table 3, high-risk insured persons who conclude a contract with the traditional tariff will unambiguously disclose their profile to the insurer without the insurer having to verify it with monitoring devices.
4.2. Research Methods and Data
The analysis was based on the data collected through a survey conducted in the period from 1 April to 9 July 2018. The insurance companies’ clients were asked to fill in a standardised questionnaire with 8 closed questions regarding their attitudes and 10 demographic questions. The questions reflect several risk factors used by insurance companies in their pricing and risk assessment, such as insured age, the approximate distance they cover annually, or their place of residence. In addition, some questions designed to investigate the attitudes of the insured to allowing some form of violation of their privacy were included.
Participation in the study was voluntary, free of charge, and the authors had no influence on the selection of the research sample.
The data used in the research were based on the opinions of 624 respondents. The respondents group was diverse in terms of sex (women accounted for almost half of the survey’s participants—47.76%) and age (the most numerous group was between 36 and 40 years old—20.67%). Approximately 7 out of 10 respondents were below 41 years old. The mean age was 36.5 years. The most numerous group were men between 31 and 35 years old (67 participants), while the smallest group were women from 56 to 60 years old (6 respondents).1
Pearson’s chi-squared test was used in the analysis, allowing the authors to test the relationship between selected nominal variables. In order to describe the contingency, coefficients such as Cramér’s V, Pearson’s Cadj, and Tschuprow’s T were used. Additionally, a logistic regression model was used to determine the direction of the observed relationships.
As part of the survey, respondents were asked about their attitudes to MTPL insurance with a premium based on their driving-style data. Answering the question “Would you be willing to allow for the monitoring of your driving style in exchange for a car insurance premium reduction?”, 56.09% of the participants gave one of the possible positive responses (17.95% of them indicated “Definitely Yes”); 15.71% of them said “Definitely Not”. In consequence, it can be concluded that the rest will agree to some form of violation of their privacy, expecting additional financial incentives, e.g., an insurance premium reduction. The participants’ attitudes to driving style monitoring are presented in Table 4.
5. Results
In Table 5, the results of the analysis are shown.
5.1. Driving Style Monitoring and Risk Exposition
The first parameter considered in this study as a risk measure (which potentially allows the insured to qualify for one of the groups) was the average annual distance covered by the respondents as a driver. For example, Boucher and Turcotte (2020) analysed how the distance impacts the claim frequency when all other individual characteristics of the insured have been considered; for the purposes of this paper, it can be taken as the average measure of risk exposure over a set period.
The most numerous group of the survey participants, in case of the average extent of annual travel, were respondents who drive from 10,001 km to 15,000 km (182 responses; 29.17%), followed by drivers covering from 5001 km to 10,000 km per year (144 respondents; 23.08%). The smallest group, 69 respondents (11.06%), were the participants characterized by a distance travelled of no greater than 5000 km. The median of the average distance travelled annually was 14 629.2 km.
It may be assumed that the willingness to consent to the monitoring is not independent of the average distance travelled, because the chi-squared coefficient value exceeded the critical value. The low p-value suggests that the probability of a type 1 error was negligible. Because the strength of the relationship may be insignificant, the contiguity is unclear. This also explains the values of the T, V, and Cadj coefficients.
As can be seen, in most cases—except for the 15,001–20,000 km category—the absolute value of regression coefficients ai increases as the average distance travelled yearly increases. This may mean that the probability of a given unit agreeing to monitoring of their driving style decreases with increasing number of kilometres covered.
This result is consistent with the expected result, allowing the conclusion that the probability of the insured consenting to monitoring of their driving style decreases with the increase in the distance covered annually. In addition, the high-risk insured, by refusing to allow monitoring of their driving style (remaining with the traditional contract), reveal their risk profile to the insurer.
5.2. Driving Style Monitoring and Insurance Premium Value
The value of the last paid premium for compulsory third-party liability insurance in this study was considered as another measure used to differentiate respondents in terms of their risk profiles. The main argument in favour of using this feature is the fact that the insurer, when quoting their premium value, uses the available ex ante and ex post information on the factors that individualise risk. Therefore, discrimination of the insurance premium should consider the characteristics related to both the vehicle and the insured, as well as information on the realisation of the risk in the past.
When asked about the cost of their premiums for MTPL insurance, the respondents mainly declared values not exceeding PLN 1000 (70.67%). The dominant value ranged from PLN 601 to PLN 800 (157 responses; 25.16%), and the median was PLN 1028.53. Premiums below PLN 401 were declared by 31 respondents (4.97%), and from PLN 1501 to PLN 2000 by 43 respondents (6.89%).
At a significance level of α = 0.05, the variables are independent, so there is no basis to prove the existence of a relationship between the willingness to consent to monitoring and the value of the last paid MTPL insurance premium. Taking into account the intuitiveness of the relationship (also resulting from the literature), such a relationship can be found using a narrower confidence interval, at a significance level of α = 0.08 (). However, the strength of the relationship is still insignificant, and the contingency is unclear.
The p-value is close to the assumed significance level of α = 0.08; therefore, the probability of making a type 1 error has to be considered significant. The estimation of the logistic regression coefficients does not allow for the determination of a homogeneous trend in the case of the probability of consenting to monitoring.
When analysing the individual values of the ai coefficients, it can be observed that their value decreases along with the increase in the value of the last premium paid in the range < 401 PLN, 2000 PLN >. This may mean that the probability of the insured consenting to the monitoring of their driving style will decrease with the increase in the value of the premiums paid and, thus, with the increase in the risk represented by the insured. The extreme ranges are a derogation from this rule. The size of these groups was insignificant within the sample, so the estimation of the corresponding coefficients could be burdened with a greater error than in other cases. Additionally, in the case of the insured whose insurance premiums are up to PLN 400 (the group potentially characterised by the lowest risk), the achieved result may be explained by the lack of interest in a new type of contract, due to insufficient benefits resulting from concluding such a contract; for those insured persons, their premiums are already lower than the average, and they may not see the benefit of changing their contract.
Considering the above, we may suspect that insured persons who pay higher premiums may be less willing to consent to monitoring of their driving behaviour than those whose premiums are lower, and the self-selection mechanism may be sufficient to assign risk profiles to individual insured persons. However, the observed relationship is very weak (even with a changed level of significance), so there is a need to continue research in this area.
5.3. Driving Style Monitoring and Drivers’ Self-Assessment
There exist significant differences in the habits and behaviour of individual drivers. The choices made in terms of speed adaptation, keeping a distance from the vehicle in front, overtaking, or knowingly violating traffic regulations are determinants of the driving style presented by the driver. In addition to the factors mentioned above, the individual’s general driving skills also influence the driving style; these can be measured using objective measurement techniques (such as information collected by devices monitoring vehicle usage), as well as more subjective ones, including the driver’s self-assessment. Self-assessment is particularly important for this analysis, as it is an unobservable factor for insurers, and remains private information available only to the insured which, as mentioned above, may contribute to the existence of information asymmetry on the market.
When asked about the assessment of their own driving skills, the survey participants described themselves mainly as “Good” (37.5%) and “Quite Good” drivers (45.51%). Approximately 1% of all respondents assessed themselves negatively.
The chi-squared coefficient exceeded the critical value, so it should be assumed that the willingness of the insured to consent to the monitoring of their driving style is not independent of their self-assessment. The obtained p-value suggests that the probability of making a type 1 error is negligible. The strength of the established dependence should, however, be considered insignificant; thus, the contingency is unclear.
The estimation of the logistic regression coefficients does not allow for the determination of a homogeneous trend in the case of the probability of the insured consenting to the monitoring of their driving style. When analysing the individual values of the coefficients, it can be observed that their value in the case of people assessing their skills as quite low is lower than the value obtained for people assessing their skills as quite good. This may mean that the probability of the insured consenting to the monitoring of their driving style is greater in the case of respondents with better self-assessment. However, it should be borne in mind that the numbers in the groups of people with “low” or “quite low” self-assessment were small, which could have resulted in underestimation of the coefficients.
Considering the above, while the chi-squared test showed a significant relationship between the self-assessment and the insured persons’ tendency to consent to monitoring of their driving behaviour, it was not possible to clearly determine the direction of this relationship using logistic regression.
6. Conclusions
The purpose of this paper was an analysis of the presence of self-selection mechanisms on the market that could bring the market closer to the RS model’s separating equilibrium state; this objective was achieved. Considering the data presented, after the transition period, no equilibrium occurred in the Polish motor insurance market. Insurance companies should seek solutions and implement strategies that bring the market closer to a state of equilibrium. This can be achieved by individualising premiums and identifying increasingly homogeneous client groups.
The results obtained as part of the analysis allow for the conclusion that the probability of the insured consenting to the monitoring of their driving style decreases with the increase in the distance they cover and the increase in the value of their recently paid premium. Therefore, it can be concluded that assigning the H profile to insured persons who will not allow monitoring of their driving style will be burdened with a smaller error than classifying them as group L. A contract introduced to the market that is priced based on data on drivers’ behaviour may be an additional, optional contract, because the self-selection mechanism should lead to the correct assignment of the risk profiles of individual insured persons without the need to actually observe their driving behaviour.
Based on the available data, it cannot be unequivocally demonstrated that the insured who evaluate their own driving skills as bad are less likely to consent to the monitoring of driving style than those whose self-assessment is higher.
The above results suggest that achieving an equilibrium consistent with the RS model on the Polish motor insurance market and, thus, improving the technical results in this market, is potentially possible thanks to the use of self-selection mechanisms.
This may be possible thanks to the development of modern technologies, e.g., insurance telematics. Insurance companies should take advantage of the opportunities created by new technologies (Śliwiński et al. 2017; Kuryłowicz 2021), and after their implementation, insurers should offer a new voluntary contract that will allow for unambiguous disclosure of insured persons’ risk profiles. Such a contract will be willingly selected by the insured from group L (covering short distances, with good self-assessment and—assuming less significance—with lower values of the previously paid premium); thus, they will not suffer the limitation of usefulness due to information asymmetry, and will receive full coverage with a still-low premium. Additionally, some of the insured from group H will choose this contract, automatically informing the insurer that they have previously been incorrectly classified to the high-risk group. In both cases, the actual installation of monitoring devices may turn out to be unnecessary and uneconomic. It should be also borne in mind that in the case of the insured potentially characterised by the lowest risk, they may not be aware of the benefits resulting from concluding this new type of contract, or may assess those benefits as insufficient. Therefore, insurers can freely shape their policy in this regard, taking into account the optimisation of their costs.
The H group of insured persons who choose not to change their behaviour, and instead choose the traditional contract, will be correctly assigned to a high-risk group and burdened with a higher premium. This way, insurers will also be able to reduce their costs, without even having to verify the high-risk insured with monitoring devices.
Author Contributions
Conceptualization, Ł.K. and A.Ś.; Formal analysis, Ł.K. and A.Ś.; Investigation, Ł.K. and A.Ś.; Methodology, A.Ś.; Writing—review & editing, Ł.K. and A.Ś. All authors have read and agreed to the published version of the manuscript.
Funding
This research received no external funding.
Informed Consent Statement
Data were received and stored anonymously from participants who ticked a consent box before proceeding with the survey.
Conflicts of Interest
The authors declare no conflict of interest.
| 1 | A detailed description of the sample can be found in (Kuryłowicz 2021) or (Śliwiński and Kuryłowicz 2021). |
References
- Beliveau, Barbara. 1984. Theoretical and Empirical Aspects of Implicit Information in the Market for Life Insurance. Journal of Risk and Insurance 51: 286–307. [Google Scholar] [CrossRef]
- Boucher, Jean-Philippe, and Roxane Turcotte. 2020. A Longitudinal Analysis of the Impact of Distance Driven on the Probability of Car Accidents. Risks 8: 91. [Google Scholar] [CrossRef]
- Dionne, Georges, and Neil Doherty. 1991. Adverse Selection in Insurance Markets: A Selective Survey. Working Paper #9105. Montreal: Department of Economic Sciences, Universit’e de Montreal. [Google Scholar]
- Donnelly, Catherine, Martin Englund, Jens Perch Nielsen, and Carsten Tanggaard. 2014. Asymmetric Information, Self-selection, and Pricing of Insurance Contracts: The Simple No-Claims Case. The Journal of Risk and Insurance 81: 757–79. [Google Scholar] [CrossRef] [Green Version]
- Gębski, Łukasz. 2021. The Impact of the Crisis Triggered by the COVID-19 Pandemic and the Actions of Regulators on the Consumer Finance Market in Poland and Other European Union Countries. Risks 9: 102. [Google Scholar] [CrossRef]
- Insurance Europe. 2021. European Insurance Industry Database. Available online: https://www.insuranceeurope.eu/statistics (accessed on 19 November 2021).
- Janes, Gerald. 1978. Equilibrium in Monopolistically Competitive Insurance Markets. Journal of Economic Theory 19: 394–422. [Google Scholar] [CrossRef]
- Kuryłowicz, Łukasz. 2021. Telematyka Ubezpieczeniowa i jej Wpływ na Równowagę rynku Ubezpieczeń Komunikacyjnych. Warsaw: Oficyna Wydawnicza SGH. [Google Scholar]
- Nowotarska-Romaniak, Beata. 2014. Nowe uwarunkowania wpływające na zachowania klientów w procesie zakupu usługi ubezpieczeniowej. Zeszyty Naukowe Uniwersytetu Szczecińskiego. Problemy Zarządzania, Finansów i Marketingu 36: 105–14. [Google Scholar]
- Puelz, Robert, and Arthur Snow. 1994. Evidence on Adverse Selection: Equilibrium Signalling and CrossSubsidization in the Insurance Market. Journal of Political Economy 102: 236–57. [Google Scholar] [CrossRef]
- Rothschild, Michael, and Joseph E. Stiglitz. 1976. Equilibrium in Competitive Insurance Markets: An Essay on the Economics of Imperfect Information. The Quarterly Journal of Economics 90: 629–49. [Google Scholar] [CrossRef] [Green Version]
- Shapira, Zur, and Itzhak Venezia. 1999. Experimental Tests of Self-Selection and Screening in Insurance Decisions. The Geneva Papers on Risk and Insurance Theory 24: 139–58. [Google Scholar] [CrossRef]
- Śliwiński, Adam, and Łukasz Kuryłowicz. 2021. The Value of Privacy—Empirical Research, Using Drivers as an Example. European Research Studies Journal 24: 936–53. [Google Scholar] [CrossRef]
- Śliwiński, Adam, Karmańska Anna, and Tomasz Michalski. 2017. European insurance markets in face of financial crisis. Application of learning curve concept as a tool of insurance products innovation–discussion. Journal of Reviews on Global Economics 16: 404–19. [Google Scholar] [CrossRef]
- Snow, Arthur. 2015. Monopolistic Insurance and the Value of Information. Risks 3: 277–89. [Google Scholar] [CrossRef] [Green Version]
- Tomaszewska, Ilona. 2017. Development Trends in Motor Insurance in Poland-Selected Issues on the Example of the Adequacy of the Premiums. Paper presented at the Joint International Conference, MIC 2017: Managing the Global Economy, Monastier di Treviso, Italy, May 24–27; pp. 365–77. [Google Scholar]
- UKNF. 2021. Annual Bulletins. Insurance Market 2017–2020. In Polish Financial Supervision Authority. Available online: https://www.knf.gov.pl/publikacje_i_opracowania/dane_statystyczne (accessed on 21 November 2021).
- Wilson, Charles. 1977. A Model of Insurance Markets with Asymmetric Information. Journal of Economic Theory 16: 167–207. [Google Scholar] [CrossRef]
Figure 1.
Gross direct P&C premiums written on domestic markets in 2019 (Insurance Europe 2021).
Figure 1.
Gross direct P&C premiums written on domestic markets in 2019 (Insurance Europe 2021).

Figure 2.
MTPL share in non-life premiums between 2007 and 2020 (UKNF 2021).
Figure 2.
MTPL share in non-life premiums between 2007 and 2020 (UKNF 2021).

Figure 3.
Market equilibrium after the introduction of the CD contract.


Table 1.
The share of individual insurers in the MTPL market between 2007 and 2020 (in %; UKNF 2021).
Table 1.
The share of individual insurers in the MTPL market between 2007 and 2020 (in %; UKNF 2021).
| Insurer | 2007 | 2008 | 2009 | 2010 | 2011 | 2012 | 2013 | 2014 | 2015 | 2016 | 2017 | 2018 | 2019 | 2020 |
|---|---|---|---|---|---|---|---|---|---|---|---|---|---|---|
| PZU S.A. | 43.36 | 40.65 | 36.73 | 34.41 | 33.60 | 33.15 | 33.39 | 32.64 | 32.39 | 30.93 | 30.78 | 30.77 | 29.75 | 28.03 |
| TUiR WARTA S.A. | 8.76 | 8.21 | 7.79 | 8.41 | 8.83 | 15.95 | 15.36 | 15.57 | 15.50 | 16.34 | 19.00 | 18.68 | 19.59 | 19.49 |
| STU ERGO HESTIA S.A. | 5.22 | 6.37 | 7.13 | 6.56 | 6.76 | 7.33 | 8.23 | 15.42 | 15.14 | 14.02 | 15.30 | 15.56 | 15.96 | 17.05 |
| GENERALI T.U. S.A. | 2.21 | 3.22 | 3.44 | 3.35 | 3.78 | 4.09 | 3.72 | 3.60 | 4.00 | 6.31 | 4.41 | 4.08 | 4.01 | 4.07 |
| AXA UBEZPIECZENIA TUiR S.A. | - | - | - | - | - | - | - | - | 0.78 | 4.73 | 6.83 | 6.62 | 6.33 | 6.74 |
| LINK4 TU S.A. | 2.25 | 1.87 | 2.05 | 1.93 | 2.09 | 2.55 | 2.96 | 3.25 | 3.93 | 4.79 | 5.34 | 5.13 | 5.04 | 5.31 |
| COMPENSA TU S.A. | 3.53 | 3.62 | 4.06 | 4.23 | 4.92 | 4.92 | 4.59 | 4.85 | 4.98 | 3.37 | 3.46 | 3.74 | 4.13 | 4.44 |
| TUW TUW | 1.41 | 1.70 | 2.09 | 2.34 | 2.68 | 3.02 | 3.41 | 3.42 | 3.42 | 3.66 | 3.02 | 2.49 | 2.14 | 2.29 |
| TUiR ALLIANZ POLSKA S.A. | 5.41 | 5.45 | 5.74 | 5.98 | 5.11 | 4.32 | 4.65 | 4.43 | 4.92 | 3.51 | 2.74 | 3.43 | 3.19 | 4.49 |
| UNIQA TU S.A. | 4.19 | 4.11 | 4.38 | 4.57 | 4.59 | 4.73 | 4.54 | 4.22 | 3.74 | 3.38 | 2.70 | 2.81 | 2.43 | 2.20 |
| GOTHAER TU S.A. 1 | 3.65 | 3.58 | 3.57 | 3.25 | 2.76 | 2.72 | 2.60 | 3.17 | 3.15 | 2.46 | 2.02 | - | - | - |
| Others | 20.01 | 21.22 | 23.02 | 24.97 | 24.88 | 17.23 | 16.56 | 9.42 | 8.06 | 6.51 | 4.41 | 6.69 | 7.43 | 5.89 |
1: Currently WIENER TU S.A.
Table 2.
Technical results of the MTPL market in Poland between 2007 and 2020 (PLN million; UKNF 2021).
Table 2.
Technical results of the MTPL market in Poland between 2007 and 2020 (PLN million; UKNF 2021).
| Category | 2007 | 2008 | 2009 | 2010 | 2011 | 2012 | 2013 | 2014 | 2015 | 2016 | 2017 | 2018 | 2019 | 2020 |
|---|---|---|---|---|---|---|---|---|---|---|---|---|---|---|
| Gross assigned premium | 6205 | 7010 | 7135 | 7528 | 8600 | 8931 | 8465 | 8071 | 8158 | 11,655 | 14,810 | 14,799 | 14,924 | 14,631 |
| Gross compensation and benefits | 3906 | 4383 | 6161 | 5284 | 5465 | 5447 | 5512 | 5895 | 6826 | 7980 | 8553 | 8764 | 9452 | 9002 |
| Technical result | −149 | −709 | −963 | −891 | −640 | −472 | −330 | −796 | −1056 | −1093 | 483 | 447 | 904 | 521 |
Table 3.
Risk profiles that can be observed by the insurer after the insured person chooses the type of contract.
Table 3.
Risk profiles that can be observed by the insurer after the insured person chooses the type of contract.
| Risk Group of Insured (Unobservable by Insurers) | Available Contracts | Insured’s Willingness to Change Their Driving Style | Contract Chosen According to the Market Model | Risk Profile Observable by Insurers (after Disclosure of Preferences by the Insured) |
|---|---|---|---|---|
| Low-risk | CL’ CD | n/a | CD | Low-risk |
| High-risk | CH CD | Yes | CD | Low-risk |
| High-risk | CH CD | No | CH | High-risk |
Table 4.
Insured persons’ willingness to consent to the monitoring of their driving style, and the characteristics analysed.
Table 4.
Insured persons’ willingness to consent to the monitoring of their driving style, and the characteristics analysed.
| Variables | Consent to Monitoring of the Driving Style (%) | Total | |||
|---|---|---|---|---|---|
| Definitely No | Rather No | Rather Yes | Definitely Yes | ||
| Average distance covered (km) | |||||
| ≤5000 | 8 | 23 | 28 | 10 | 69 |
| 5001–10,000 | 22 | 42 | 63 | 17 | 144 |
| 10,001–15,000 | 18 | 52 | 80 | 32 | 182 |
| 15,001–20,000 | 19 | 32 | 39 | 22 | 112 |
| >20,000 | 31 | 27 | 28 | 31 | 117 |
| Previous premium (PLN) | |||||
| ≤400 | 8 | 13 | 9 | 1 | 31 |
| 401–600 | 12 | 36 | 45 | 24 | 117 |
| 601–800 | 28 | 39 | 57 | 33 | 157 |
| 801–1000 | 14 | 42 | 59 | 21 | 136 |
| 1001–1500 | 21 | 26 | 34 | 18 | 99 |
| 1501–2000 | 4 | 13 | 19 | 7 | 43 |
| >2000 | 11 | 7 | 15 | 8 | 41 |
| Self-reported driving style | |||||
| Bad, quite bad, or average 1 | 13 | 31 | 45 | 17 | 106 |
| Quite good | 40 | 97 | 116 | 31 | 284 |
| Good | 45 | 48 | 77 | 64 | 234 |
1: Due to the small number of respondents with “bad” or “quite bad” self-assessment, for the needs of later calculations, a transformation was made by combining data representing “bad” (n = 1), “quite bad” (n = 6), and “average” (n = 99) self-assessment.
Table 5.
Statistical analysis results.
| Variables | df | T | V | Cadj | ai | σ | Value | |||
|---|---|---|---|---|---|---|---|---|---|---|
| Average distance (km) | 12 | 33.1283 | 21.0261 | 19.3692 | 0.1238 | 0.1330 | 0.2551 | 0.0009 | ||
| ≤5000 | −0.2075 | 0.3383 | 0.5397 | |||||||
| 5001–10,000 | −0.2298 | 0.2699 | 0.3945 | |||||||
| 15,001–20,000 | −0.2228 | 0.3000 | 0.4577 | |||||||
| >20,000 | −0.5492 | 0.2881 | 0.0566 | |||||||
| Previous premium (PLN) | 18 | 27.0032 | 28.869 | 26.9467 | 0.1010 | 0.1201 | 0.2273 | 0.0789 | ||
| ≤400 | −0.7066 | 0.4716 | 0.1341 | |||||||
| 401–600 | 0.2854 | 0.3285 | 0.3850 | |||||||
| 601–800 | 0.1599 | 0.3080 | 0.6036 | |||||||
| 801–1000 | 0.1479 | 0.3136 | 0.6372 | |||||||
| 1501–2000 | −0.2226 | 0.4334 | 0.6076 | |||||||
| >2000 | −0.0184 | 0.4518 | 0.9676 | |||||||
| Self-reported driving style | 6 | 33.9493 | 12.5916 | 11.2835 | 0.1490 | 0.1649 | 0.2700 | <0.0001 | ||
| Bad | 8.5676 | 101.7225 | 0.9329 | |||||||
| Quite bad | −0.9076 | 0.9645 | 0.3467 | |||||||
| Average | −0.0158 | 0.3077 | 0.9591 | |||||||
| Quite good | −0.4056 | 0.2212 | 0.0668 |
Publisher’s Note: MDPI stays neutral with regard to jurisdictional claims in published maps and institutional affiliations. |
© 2022 by the authors. Licensee MDPI, Basel, Switzerland. This article is an open access article distributed under the terms and conditions of the Creative Commons Attribution (CC BY) license (https://creativecommons.org/licenses/by/4.0/).
Share and Cite
MDPI and ACS Style
Kuryłowicz, Ł.; Śliwiński, A. Risk Self-Selection and the Concept of Equilibrium in a Competitive Insurance Market. Risks 2022, 10, 9. https://doi.org/10.3390/risks10010009
AMA Style
Kuryłowicz Ł, Śliwiński A. Risk Self-Selection and the Concept of Equilibrium in a Competitive Insurance Market. Risks. 2022; 10(1):9. https://doi.org/10.3390/risks10010009
Chicago/Turabian StyleKuryłowicz, Łukasz, and Adam Śliwiński. 2022. "Risk Self-Selection and the Concept of Equilibrium in a Competitive Insurance Market" Risks 10, no. 1: 9. https://doi.org/10.3390/risks10010009
Note that from the first issue of 2016, this journal uses article numbers instead of page numbers. See further details here.