
CEO Social Capital and the Value Relevance of Accounting Metrics

1
College of Business, Louisiana Tech University, Ruston, LA 71272, USA
2
Else School of Management, Millsaps College, Jackson, MA 39210, USA
*
Author to whom correspondence should be addressed.
Risks 2023, 11(4), 78; https://doi.org/10.3390/risks11040078
Submission received: 24 February 2023
/
Revised: 28 March 2023
/
Accepted: 14 April 2023
/
Published: 18 April 2023
(This article belongs to the Special Issue Accounting, Financial Reporting, and Disclosure)
Abstract
:Equity investors value CEO social capital when pricing firm equity. When CEO social capital is high, the value relevance of the book value of equity declines, whereas the value relevance of earnings measures increases. Results are stronger for firms in high-tech industries where information asymmetries are higher. Social capital may be deconstructed into informational and reputational effects and we report that social capital is a meaningful determinant of value relevance in both scenarios. Results are robust to alternative variable definitions, controls and tests for endogeneity. The results strongly suggest that CEO social capital improves the information environment around firms, benefiting users of accounting metrics.
1. Introduction
Social capital is first defined by Woolcock (1998) as the information, trust and norms of reciprocity inherent in a social network, and it measures the power and influence of an individual within the network. Literature to date suggests that the social capital of chief executive officers (CEO social capital hereafter) is associated with firms’ economic activities and financial policies (Bebchuk et al. 2011; Engelberg et al. 2012; Fracassi and Tate 2012; Larcker et al. 2013; El-Khatib et al. 2015; Ferris et al. 2017a, 2017b; Fracassi 2017). Specifically, these authors argue that CEO social capital is a great resource; that is, an important intangible asset to a firm, and that higher social capital affords the CEO more efficient information flows and resource acquisition thus empowering the CEO to make better decisions for the firm. Social capital may also incentivize both reputation-enhancing behaviors and rent-seeking behaviors; the former since higher social capital is associated with greater future opportunities and the latter because social capital may shield managers from corporate governance discipline. Thus, CEO social capital represents a double-edged sword in terms of its potential impact on firm performance. In turn, this paper explores the relationship between CEO social capital and the value relevance of accounting metrics, specifically the relevance of the book value of equity and earnings per share.
The value relevance of accounting metrics is important as it measures the usefulness of accounting metrics from the perspective of equity investors (Barth et al. 2001). When equity investors are able to rely upon accounting data to make appropriate investment decisions, the accounting data are said to be value relevant. Greater value relevance of accounting measures helps to improve the quality of the overall informational environment of the firm and, in turn, helps lower the informational risk to investors, which, in turn, potentially reduces the cost of equity capital for the firm (Francis et al. 2004).
Research concerning the value relevance of accounting metrics has garnered much attention. Ball and Brown (1968) were the first to explore the concept and reported that unexpected earnings are significantly related to abnormal stock returns. Almost two decades later, Ohlson (1995) and its subsequent refinements (e.g., Feltham and Ohlson 1995, 1996; Ohlson 1999) gave rise to a model that is the foundation for much of the research on the association between financial statement data and firm value. Since that time, many researchers have examined the importance of accounting metrics in various markets and found that certain firm characteristics, such as size, profitability, growth potential, corporate governance and negative book value, may be associated with the value relevance of earnings (e.g., Collins et al. 1997, 1999; Francis and Schipper 1999; Hodgson and Stevenson-Clarke 2000; Brown and Sivakumar 2003; Davis-Friday et al. 2006). Francis and Schipper (1999) find that the value relevance of earnings is significantly lower in technology industries; the increasing percentage of market capitalization held by technology firms may contribute to the overall decline in the value relevance of earnings in the capital markets.
While the above-noted research assumes operational efficiency and does not consider managerial characteristics, there is ample evidence that the personal characteristics of CEOs affect firm and market outcomes, including the value relevance of accounting metrics (e.g., Engel et al. 2003; Banker et al. 2009; Francis et al. 2020). Importantly, Francis et al. (2020) argue that managerial ability is an important intangible asset that partially reflects the overall human capital of the firm as well as provides evidence that managerial ability affects the value relevance of earnings metrics. We complement the literature encompassing behavioral studies in accounting and finance by investigating if and the extent to which CEO social capital affects the value relevance of accounting metrics. In this regard, we focus on the CEO, since the CEO, as the top executive of the firm, is the most visible individual of the firm from a market perspective and is also the individual ultimately responsible for firm operations and financial reporting.
Empirical evidence to date suggests that CEOs with higher social capital have informational advantages and reputational incentives to ensure value creation and effective financial reporting for firms (Bhandari et al. 2018; Ferris et al. 2017a; Larcker et al. 2013). However, there is also evidence to support that CEOs with greater social capital are more entrenched and may not always act in shareholders’ best interests (El-Khatib et al. 2015). Investors may positively or negatively weigh CEO social capital, may provide different weights to the effects of social capital on the value relevance of accounting measures or may simply ignore social capital as it is not measurable by traditional accounting standards (Amir and Lev 1996; Hughes 2000; Francis et al. 2020). The adjustment effect of CEO social capital may be stronger for firms within high-tech industries where information asymmetries are higher.
To gain insights regarding CEO social capital, we first follow the extant literature (e.g., Ferris et al. 2017a) to create two proxies for CEO social capital, Degree and Eigen, where Degree is the size of the CEO’s direct network and Eigen measures the importance of the CEO’s network. CEOs with higher social capital will typically have large networks (Degree) and be connected to people who are, in turn, well-connected (Eigen). We find that when CEO social capital is higher, investors rely less upon the book value of equity in pricing common equity; that is, the value relevance of the book value of equity is lower when CEO social capital is higher. Additionally, we find that when CEO social capital is higher, investors find more value relevance in earnings measures. Results are statistically significant and economically meaningful, suggesting that CEO social capital improves the contemporaneous information environment around their firms. We find that these effects are more pronounced when information asymmetry is higher, as in the technology sector. Since proxies for CEO social capital (that is, the network centrality measures Degree and Eigen) have been shown to exhibit both informational and reputational effects, we deconstruct our variables of interest to informational and reputational components. While the majority of our results may be attributable to CEO reputation, which makes intuitive sense, there is also ample evidence that the information environment enabled by CEO connections also affects the value relevance of accounting metrics.
To our knowledge, this is the first study to examine the relationship between CEO social capital and the value relevance of accounting metrics. We make several contributions. First, we contribute to the literature on executive networks and information environments around firms (e.g., Egginton and McCumber 2019) by providing evidence that CEO social capital improves the information available to investors. Second, we provide evidence that intangible, non-financial and unmeasurable assets provide value to firms and investors. Third, we lend support to Francis et al. (2020) that managerial characteristics affect the value relevance of accounting metrics. Finally, we contribute to the growing behavioral accounting and finance literature (e.g., El-Khatib et al. 2015) by providing additional evidence that the personal characteristics of managers affect firm and market outcomes. Our findings are also of practical importance to investors in that CEO networks and CEO reputation contribute to the relevance of publicly available information, accounting measures and thus the informational efficiency of the markets.
The remainder of the paper is organized as follows: Section 2 discusses the extant literature and develops hypotheses; Section 3 presents the construction and description of variables of interest, sample construction and research design; Section 4 reports the main empirical results; and Section 5 concludes the paper.
2. Literature Review and Hypotheses Development
2.1. CEO Social Capital and Firm Outcomes
Traditional economic theories (e.g., neoclassical economic theory; agency theory) assume operational efficiency and homogeneity with respect to corporate executives, wherein an executive is a rational agent hired to maximize the value of shareholder equity. In contrast, modern behavioral theories (e.g., upper echelons theory from Hambrick and Mason 1984) argue that executives are heterogeneous in nature and that the characteristics of the executives affect corporate decisions and policies. Numerous studies provide empirical evidence that executives’ characteristics, such as educational background, social connections, attitudes and preferences, have meaningful impacts on firm and market outcomes (e.g., Bhandari et al. 2018; Milbourn 2003; Malmendier and Tate 2008; El-Khatib et al. 2015).
CEO social capital is a personal characteristic of the executive that measures the size and influence of their immediate network. Network studies (graph theory) posit that social networks are valuable in that they promote efficient information flows (Nohria 1992), promulgate best practices amongst nodes (that is, direct interpersonal connections), enable trust transactions and sanction suboptimal behavior (Burt 1997, 2005). In the aggregate, CEO social capital is a valuable intangible asset of a firm that is not specifically measured under traditional accounting standards (Amir and Lev 1996; Hughes 2000; Francis et al. 2020).1 A growing amount of literature suggests that CEO social capital can significantly affect firms’ financial policies and performance, such as mergers and acquisitions (El-Khatib et al. 2015), corporate risk-taking (Ferris et al. 2017a), cost of equity (Ferris et al. 2017b), capital investment (Fracassi 2017) and executive compensation (Engelberg et al. 2012). Empirical research also suggests that CEO social capital can affect a firm’s accounting choices and financial reporting quality (Griffin et al. 2021; Bhandari et al. 2018). Overall, the empirical evidence suggests that CEOs with higher social capital have the informational advantage and reputational incentive to create value for their firms (Ferris et al. 2017a) and report “trustworthy” financial information to the market (Bhandari et al. 2018).
2.2. CEO Social Capital and Value Relevance
For accounting measures to be value relevant to investors, they must both appropriately reflect the performance of the firm and be relied upon by investors to inform their investment decisions.2 As CEO social capital has been shown to create value for firms (e.g., Ferris et al. 2017a), it is theoretically and empirically interesting to investigate to what extent investors value CEO social capital when evaluating the firm’s accounting-based performance measures.
The valuation process is complex and invisible; it is difficult to observe how investors evaluate a firm. Additionally, investors are not able to directly evaluate CEO social capital as it is an intangible asset that is not specifically measured under traditional accounting standards (Amir and Lev 1996; Hughes 2000; Francis et al. 2020). To explore the plausible relationship between CEO social capital and the value relevance of accounting metrics, it is important to understand the role of CEO social capital with respect to the firm valuation process.
CEO social capital may influence investors’ ability to evaluate firm performance and the accounting metrics reported by the firm via two mechanisms, an informational effect and a reputational effect. A CEO with greater social capital enjoys more direct connections to others who, in turn, have more connections to others and so on. With respect to information, a CEO with higher social capital is well positioned to more effectively obtain and interpret information, both internally and externally, about their firm, industry, opportunities and threats, allowing them to more effectively manage the firm and more appropriately measure its performance. Additionally, more connected CEOs are more “visible” to market participants, who are able to efficiently gather and evaluate firm information.
With respect to reputation, more connected CEOs have greater incentives to comply with explicit and implicit expectations with regard to accounting accuracy and reporting. Networks are the mechanism through which excellence is rewarded (e.g., with future employment opportunities) and deviance is punished (e.g., via reduced future opportunities).
Interestingly, the literature reports that greater connectedness displays both positive and negative outcomes. El-Khatib et al. (2015) argue that the “more central” CEOs are more likely to initiate and successfully complete merger and acquisition activities; admittedly, more often than not, those business combination events are value-destroying, suggesting that more connected managers are entrenched and partially shielded from internal or external governance. On the other hand, Ferris et al. (2017a) find that firms led by CEOs with greater social capital, proxied by CEO network centrality, are more likely to engage in corporate risk activities that are value-enhancing. Since CEO social capital is found to be situationally positive or negative, whether CEO social capital affects the value relevance of accounting information is an empirical matter.
It is worth noting that studies by practitioners show that CEO reputation does affect stakeholders’ valuation of firms (Hill and Knowlton 2002; Burson-Marsteller 2003). For example, survey evidence from Burson-Marsteller (2003) suggests that CEO reputation influences 58% of investors’ decisions to buy a company’s stock, 62% of analysts’ recommendations on the stock and 70% of journalists’ confidence in the company.
We posit that the value relevance of accounting measures is conditional upon CEO social capital. Specifically, we are interested in the value relevance of the per-share book value of equity and earnings metrics, expecting investors to differently weight the value of the book value of equity and earnings metrics when CEO social capital is higher or lower. We also assess the extent to which the accounting metrics can jointly determine firm value.
2.3. The Ohlson (1995) Model and the Residual Income Model
Empirical research on value relevance is based on the traditional financial theory that the value of firm equity is the present value of all expected future dividend payouts or “free cash flow to the equity” (Williams 1938).3
where V0 = current equity price, = expected dividend payout for period t, = expected free cash flow to the equity for year t, rt = required rate of return on equity (cost of equity). If the clean surplus relation holds, in that changes in the book value of equity relate solely to the changes in retained earnings (that is, net income minus dividends paid), then the fair value may be expressed as a function of accounting variables, thus:
where V0 = current equity price, BV0 = current per-share book value of equity, Et = expected earnings per share for period t, rt = required rate of return on equity (cost of equity) and Bt−1 = expected per-share book value of equity at time t − 1. The term is defined as residual income; the model is typically referred to as the residual income model.4 The residual income model assumes that a company’s equity value is equal to the book value of equity plus the present value of future residual income. With additional assumptions of linear information dynamics, a company’s equity value can be written as a linear function of current earnings and book value of equity as follows (Ohlson 1995):
where Book value per share is calculated by common equity scaled by the number of shares outstanding and Earnings per share is the bottom-line earnings metric (EPS hereafter) that is calculated using net income scaled by the number of shares outstanding; this model is typically referred to as the Ohlson (1995) model (Ohlson model hereafter). Importantly, we adopt the Ohlson model as our baseline model because it allows us to evaluate the impact of CEO social capital on both the book value of equity and earnings per share.5 In turn, we employ a value relevance test to evaluate whether the accounting metrics are value relevant.6
Consistent with the residual income framework, the Ohlson model indicates that a company’s equity value can be estimated by a function of book value and earnings where the book value of the equity serves as a floor value for a company’s equity value, whereas the portion from earnings represents the addition to the book value; in turn, this function underpins the following two assumptions of our value relevance test. First, if a company reports earnings that reflect its economic performance and those earnings can be used to predict future earnings, then investors would form a more positive outlook toward the company and, thus, rely more on the earnings portion to estimate a company’s value. Second, if a company reports earnings that do not reflect its economic performance and thus such earnings cannot be used to predict future earnings, then investors would rely more on a company’s book value as a floor value to estimate a company’s value (Barth et al. 1998).
2.4. Hypotheses Development
Given that CEO social capital is an intangible asset of the firm that is not specifically measured under traditional accounting standards (Amir and Lev 1996; Hughes 2000; Francis et al. 2020), the book value of equity for the firm with higher CEO social capital is underestimated under the residual income framework and, in turn, the Ohlson model. If CEO social capital is a net-positive intangible firm asset, it may create value for the firm in the long run and provide more efficient operations and earnings information to the market. In turn, the positive impact of CEO social capital on firm value will be reflected in earnings. In an efficient market, investors will rely more upon earnings metrics but less upon the book value of equity to measure the equity value of the firms managed by CEOs with higher social capital. Alternatively, CEO social capital may partially shield more powerful executives from internal or external discipline. More connected CEOs may be able to extract rents at the expense of owners at a lower cost than their less-connected peers. In this case, one would expect market participants to rely less upon earnings metrics and more upon the book value of equity in their estimations of firm value (Barth et al. 1998).7 Thus, we have a dual hypothesis:
H1a.
The value relevance of the book value (earnings metrics) will be lower (higher) for firms with higher CEO social capital.
H1b.
The value relevance of the book value (earnings metrics) will be higher (lower) for firms with higher CEO social capital.
If CEO social capital affects the information environment for market participants, it is likely that CEO social capital is heterogeneously deterministic across industries. When an industry is prone to greater information asymmetry between firms and investors, we expect CEO social capital to play a greater role in investors’ reliance upon accounting metrics to estimate firm value (e.g., Egginton and McCumber 2019);8 thus, the impact of CEO social capital on the value relevance of accounting metrics is enlarged. Technology firms are shown to have greater information asymmetries, including but not limited to difficulty in valuing intangible assets (e.g., intellectual property) and complex earnings regimes. For example, Francis and Schipper (1999) find that firms in high-tech related industries have significantly lower value relevance with respect to earnings metrics, potentially due to the immediate recognition of research and development expenses (R&D) and the non-capitalization of intangible assets under traditional accounting standards (Amir and Lev 1996; Hughes 2000; Francis et al. 2020). Amir and Lev (1996) argue that a potential cause of depressed earnings of communication companies is the immediate expensing of customer acquisitions and brand development that may be capitalized as intangible assets on the balance sheets of firms. Additionally, prior empirical evidence also suggests that firms in high-tech-related industries (e.g., firms with high R&D intensity) have the tendency to manage earnings that may intensify information asymmetry between investors and firms (Graham et al. 2005; Shust 2015). Thus, greater information asymmetry may lead investors to put more weight on more reliable information channels, such as the channels provided by CEO social capital, to obtain more accurate information to evaluate the firm value. Given the increased uncertainty in the valuation process for more complex firms, we hypothesize:
H2.
The impact of CEO social capital on the value relevance of accounting metrics is more pronounced for firms in high-tech industries than in low-tech industries.
3. Sample Construction, Variables Description, and Research Methodology
3.1. Sample Construction
We began our sample construction by extracting data from the BoardEx dataset. From this dataset, we obtained information pertaining to the executive and non-executive board appointments at North American firms, non-profit organizations and public entities and, in turn, constructed CEO network centrality measures to proxy for CEO social capital each year from 1998–2017. Specifically, we constructed degree centrality (Degree) and eigenvector centrality (Eigen) to capture the number of connections and the connection to the connected people; thereafter, we used principal component analysis to create a third centrality measurement, PCA, to capture the common features between Degree and Eigen. Please refer to Section 3.2 for the detailed calculation process for CEO network centrality measures.
We next obtained firm financial and price information from the Thomson Reuters Worldscope dataset and merged the information with our centrality measures. We excluded data for firms in the financial (SIC 6000–6999) and utility (SIC 4900–4999) industries, non-US firms and firms with missing data for variables required for the regression procedures. Our final dataset contains 20,691 firm-year observations from 2938 unique firms.
Figure 1 and Figure 2 provide information about the sample distribution by industries classified by Fama and French (1997) and by years, respectively. Interestingly, Figure 1 indicates that the “Business Service” industry contributes the largest number of observations (3455) in our sample, followed by “Electronic Equip” industry (1946) and “Pharmaceutical P” industry (1547). Figure 2 reveals that the number of observations increases from 534 in 1998 to 1041 in 2004 and remains above 1000 after that.
3.2. CEO Social Capital/Network Centrality
In this study, we used CEO network centrality measures to proxy for CEO social capital as such measures can capture the importance and influence of CEOs within their networks. In turn, such measures capture the essential elements of social capital: information, trust and norms of reciprocity inherent in a social network.
When calculating CEO network centrality measures, we focused on CEOs’ current network connections; specifically, we only considered that two people are connected if they serve concurrently on the same board. Thus, when one person leaves the board, the two were no longer considered connected. We focused on the contemporaneous network connections because we believe that current relationships better capture the current informational environment and the reputations of the executives. Additionally, focusing on the contemporaneous network connections, rather than the past network connections, allows our network centrality measures to be more dynamic and capture the changes in the CEO network.
Adding up the number of direct connections to other directors gave us the degree centrality (Degree), which is simply the number of direct and current connections a CEO has to other executives. Degree is hence a measure of the size of a CEO’s direct network. An extension of the degree centrality is the eigenvector centrality (Eigen), which takes into consideration the connection to the connected people. In other words, a CEO with a higher eigenvector centrality is connected to other executives who, in turn, are connected to many other executives. Eigen is therefore an indication of the “importance” of a CEO’s network. Degree and eigenvector centralities are informative as to both the efficiency of information acquisition and dissemination given that executives with more (and better connected) connections are more likely to have access to more information at less cost, as well as with less reputational risk (since presumably more reputable and experienced executives are granted more board appointments).
Following the extant literature (El-Khatib et al. 2015; Fogel et al. 2018; Georgieva et al. 2016), we calculated the raw value for degree and eigenvector centrality measures as:
where xji is 1 for presence of a social connection between i and j
where E is an eigenvector of the matrix of connections A and λ is its associated eigenvalue Ei is taken as the elements of the eigenvector E* associated with A’s principal eigenvalue, λ*.
Interpreting the raw degree centrality is relatively intuitive. For example, one can easily infer that a CEO with 180 direct connections likely enjoys more informational and other advantages than a CEO with 8 connections; in contrast, interpreting the raw eigenvector centrality is not so intuitive from a comparability viewpoint. To enhance comparability, we ranked the raw value of the CEOs’ network centrality into percentiles value for each year; for example, a CEO in the 61st percentile of eigenvector centrality in a specific year has a higher eigenvector centrality than 60% of all executives in the network that same year. Additionally, as previously indicated, we also used principal component analysis to create a third centrality measurement, PCA, to capture the common features of degree and eigenvector centrality.
3.3. Summary Statistics and Correlation Matrix
Table 1 presents the summary statistics. All of the continuous variables in the sample are winsorized at 1% and 99% levels to eliminate the impact of the extreme value of variables in the regression model.
As for the CEO social capital measures, the mean (median) values for Degree and Eigen are 65 (64) and 58 (60), respectively. In addition, there is considerable heterogeneity in our sample of CEO social capital measures. For example, at the 25th percentile, in-sample Degree and Eigen are in the 52nd and 41st percentile of all executives in the network while at the 75th percentile, Degree and Eigen are in the 78th and 76th percentile of all executives; the standard deviations for Degree and Eigen are approximately 16 and 22 percentiles, respectively.
Figure 3 and Figure 4 provide information about the mean values of CEO social capital by industries classified by Fama and French (1997) and by years, respectively. Interestingly, Figure 3 indicates that in terms of Degree, on average, CEOs in our sample rank over the 70th percentile of all executives in the “Tobacco Products”, “Chemicals”, “Shipbuilding, Ra” and “Coal” industries. However, in terms of Eigen, on average, CEOs in our sample rank over the 70th percentile of all executives only in the “Tobacco Products” industry. Figure 4 reveals that in terms of Degree and Eigen, the average rankings of CEOs in our sample among all executives are stable from 2008–2017; specifically, on average, CEOs in our sample rank between the 60th and 70th percentile and between the 50th and 60th percentile of all executives from 2008–2017.
As for the summary statistics of other variables, Table 1 also reveals that the mean (median) values of several proxies for the market price of equity, the dependent variable, are comparable; and that the mean (median) values for Exclusions per share and Accruals per share are negative because the value of Earnings per share is smaller than the values of Op earnings per share and Cash flow per share.
Table 2 reports the Pearson correlation matrix for dependent variables and variables of interest with the significance levels underneath. As expected, all of the different proxies for the market price of common equity have significantly positive correlations with all of the CEO social capital measures, as well as with the Book value per share and all of the different proxies for earnings (e.g., Earnings per share, Op earnings per share and Cash flow per share), but have significantly negative correlations with the adjustments from Earnings per share (e.g., Accruals per share and Exclusions per share). All CEO social capital measures are also highly correlated.
3.4. Research Methodology
As previously indicated, we adopted the Ohlson model as our baseline model. We primarily focused on the incremental explanatory power of the book value of equity and earnings metrics on the market price (that is, the coefficient of the book value of equity and earnings metrics), as it allowed us to test the effect of CEO social capital on the value relevance of the book value of equity and earnings metrics (Collins et al. 1997; Brown and Sivakumar 2003; Entwistle et al. 2010). We also addressed the overall explanatory power of the regression model as it presents the combined explanatory power of the equity price by all of the variables in the regression model.
To test the first hypothesis of whether CEO social capital has a positive or negative effect on the value relevance of accounting metrics, we first divided our sample into high and low social capital groups by median value of CEO social capital9 and then we ran the baseline model for each group and compared the coefficients of the book value and earnings metrics, as well as the overall explanatory power of the regression model.10 It is worth noting that we included several control variables in the baseline model that have been documented in the literature as partially determining the value relevance of accounting metrics.11 The equation is shown as follows:
The dependent variable, Pricei,t, represents the market price of common equity. To address the potential “look-ahead bias” problem identified by Banz and Breen (1986), we initially used the equity price at three months subsequent to fiscal year-end, Pricethree, as the dependent variable.12 Our variables of interest are the coefficients for Book value per share (β1) and Earnings per share (β2). If CEO social capital has a negative (positive) effect on the value relevance of the book value of equity (earnings), we would expect the β1 (β2) in the “high social capital” groups to be significantly smaller (larger) than the ones in the “low social capital” groups. To control for other omitted variables that may affect the value relevance of accounting metrics, we followed the literature (Davis-Friday et al. 2006; Barth and Kallapur 1996; Burgstahler and Dichev 1997; Collins et al. 1999) by including the following firm-level characteristics as control variables: Size (natural log of one plus book value of asset), ROA_std (rolling standard deviation of return on asset), Leverage (total current and long-term debt scaled by total asset), Op_loss (whether the firm has operating loss in the year), Sales Growth (sales growth rate in the current year) and Big4 (whether the firm uses a Big Four auditing firm). Additionally, to separate the effect of CEO social capital on the value relevance of accounting metrics from the effect of other CEO characteristics, we also controlled for the following CEO characteristics: Duality (whether a CEO also serves on the board of directors) and Tenure (natural log of one plus the number of years a CEO is in the position).13 All regression models include time- and industry-fixed effects. Additionally, all errors are robust with respect to firm heteroscedasticity.
To test the second hypothesis of whether CEO social capital has a more significant effect on the value relevance of accounting metrics for firms in high-tech related industries, we first followed Francis and Schipper (1999) to create three proxies for the high-tech indicator variable and split the sample into two subsamples by the zero or one value of the high-tech indicator variables. Thereafter, we divided each subsample into high and low social capital groups, ran the regression model (1) within each group and compared the coefficients for Book value per share and Earnings per share between the high and low social capital groups. Specifically, based on the median value of the market-to-book equity (MTB) ratio each year,14 we first created High MTB and, thereafter, created High R&D and High Tech based on the median value of R&D expenditures per share for each year and on the relevant SIC codes as defined by Francis and Schipper (1999), respectively15. In an un-tabulated analysis, we used an alternative method to check the robustness of the results. Specifically, we inserted a high-tech indicator variable in the regression model (1), interacted the high-tech indicator variable with the variables of interest16, ran a regression procedure for each subsample to obtain the corresponding coefficients and tested whether a significant difference exists between the coefficients from the two subsamples.
4. Empirical Results
4.1. CEO Social Capital and the Value Relevance of Accounting Metrics
4.1.1. OLS Regressions
Table 3 reports the results of the OLS regressions explaining the effect of CEO social capital on the value relevance of the book value of equity and earnings metrics. Specifically, column (1) of Table 3 reports the results for the entire dataset, while columns (2) to (6) report the results for the high and low social capital groups. As displayed in column (1), the coefficients for both Book value per share (β1) and Earnings per share (β2) are positive and highly significant (p < 0.01), consistent with findings in the literature (e.g., Ohlson 1995, 1999; Feltham and Ohlson 1995, 1996; Collins et al. 1999; Francis and Schipper 1999; Brown and Sivakumar 2003; Davis-Friday et al. 2006). Regarding the marginal effects, holding other factors constant at mean value, an increase of USD 1 in Book value per share and Earnings per share represents an increase of USD 1.612 and USD 1.453, respectively, in the market price of common equity on average. As displayed in columns (2) to (6), the difference in the coefficients of Book value per share (β1) between the high and low social capital groups are negative and highly significant (p < 0.01), whereas the difference for the coefficients of Earnings per share (β2) are positive and highly significant (p < 0.01). The marginal analyses confirm that the effects are economically large. Using Degree centrality as an example, holding covariates at the means and moving from low to high social capital group (e.g., moving from the 52nd percentile to the 78th percentile in Degree centrality), an increase of USD 1 in Book value per share and Earnings per share results in a roughly 2.4% decrease and 6.4% increase, respectively, in the market price of common equity in the sample17. The effect is comparable to the average marginal effect of the Book value per share and Earnings per share, as shown in column (1)18. The coefficients of the other control variables are as expected. Not surprisingly, the increase in Size, Leverage and Sales Growth is associated with significant increases in the market price of common equity, whereas the increase in Op loss is associated with a significant decrease in the market price of common equity. Interestingly, the values for the overall explanatory power of the regression models in “high social capital” groups are also higher than the ones in the “low social capital” groups.
In an untabulated analysis, we used an alternative method and found consistent results. Specifically, we included the high social capital indicator variable in the regression model (1)19, reran the regression procedures and obtained significant negative values for the coefficient terms between “high social capital” and Book value per share and significant positive values for the coefficient terms between “high social capital” and Earnings per share, respectively. Finally, we reran the analysis using the Fama and MacBeth (1973) cross-sectional regression procedure and found that all results hold.
The preponderance of evidence presented in Table 3 (and previously noted in the related untabulated analysis) supports hypothesis H1a; we found a strong negative relationship between CEO social capital and the value relevance of book equity but a strong positive relationship between CEO social capital and the value relevance of earnings metrics.
4.1.2. The Use of Other Proxies for Equity Price
While debates exist concerning what equity price should be used for the Ohlson model, the consensus view is that the equity price at three months subsequent to fiscal year-end is the optimal choice (Banz and Breen 1986). To double-check the robustness of the regression results, we reran the regression model (1) by replacing the dependent variable with equity price at two months subsequent to fiscal year-end, one month subsequent to fiscal year-end and as of fiscal year-end. Table 4 presents the results, with the dependent variable as equity price at two months subsequent to fiscal year-end, one month subsequent to fiscal year-end and at the fiscal year-end in Panel A, B and C, respectively. As indicated in Table 4, regardless of what market price proxy is used as the dependent variable, CEO social capital has a similar impact on both the book value and earnings metrics as those displayed in Table 3.20
4.1.3. The Use of Other Proxies for Earnings Metrics
Motivated by previous findings concerning the relationship between alternative earnings metrics and higher value relevance (Barth et al. 1999; Brown and Sivakumar 2003; Entwistle et al. 2010), we extended our analysis to address the impact of CEO social capital on book value and alternative earnings metrics, as well as their adjustments to EPS. Following Brown and Sivakumar (2003), we decomposed Earnings per share into a combination of alternative earnings metrics and their adjustments; that is, Op earnings per share and Exclusions per share and Cash flow per share and Accruals per share, respectively and rerun the regression by replacing EPS with the alternative earnings metrics and their related adjustments.
Table 5 reports results, with Panel A and B presenting results related to Op earnings per share and Cash flow per share, respectively. As reported in columns (1) and (8) of both panels in Table 5, the coefficients for Book value per share are comparable, whereas the coefficients for Op earnings per share and Cash flow per share are significantly higher than the coefficients for Earnings per share as reported in column (1) of Table 3; this is consistent with the findings from the literature that the alternative earnings metrics are more value relevant than EPS (Brown and Sivakumar 2003; Entwistle et al. 2010). As reported in columns (2) to (7) and (9) to (14) of both panels, compared to the values for the corresponding coefficients in “low social capital” groups, the values for the coefficients of Book value per share are significantly lower (p < 0.01) while the values for coefficients of Op earnings per share and Cash flow per share are significantly higher (p < 0.01) in the “high social capital” groups, indicating that the effect of CEO social capital also applies to the scenario of replacing EPS with alternative earnings metrics as well. Interestingly, column (8) of Panel A reports that the coefficient of Exclusions per share is negative and significant (p < 0.01), while column (8) of Panel B indicates positive and significant coefficients for Accruals per share.21 Additionally, the results from columns (9) to (14) of both panels suggest a positive effect of CEO social capital on the adjustments from Earnings per share as the difference for all of the coefficients of Exclusions per share and Accruals per share between high and low social capital groups are positive and highly significant (p < 0.01). Overall, the results indicate that CEO social capital has a positive impact on both alternative earnings metrics and their adjustments from EPS. Further, the results of several untabulated analyses indicate that CEO social capital has a positive relationship with both recurring and nonrecurring adjustments from EPS.22 In summary, the results suggest that firms with higher CEO social capital are associated with more value-relevant earnings metrics and related adjustments which, in turn, may support efficient equity pricing from investors.
4.1.4. CEO Social Capital and the Value Relevance of Accounting Metrics: Second-Order Effects
A potential concern is that other factors may drive our results. Bhandari et al. (2018) document that firms with better CEO network connections are associated with enhanced financial reporting quality and the result could suggest that higher earnings quality may be the first-order effect, whereas the value relevance of accounting metrics is just the second-order effect of CEO social capital. Additionally, the prior literature also suggests that the value relevance of accounting metrics could be driven by the increasing use of accounting conservatism by firms (e.g., Balachandran and Mohanram 2011; Elliott and Jacobson 1991; Jenkins 1994). Further, firms with higher CEO social capital may be associated with better investment efficiency that, in turn, promotes more relevant accounting metrics. To ensure that the effect of CEO social capital on the value relevance of accounting metrics is not associated with other confounding factors, we controlled for the factors noted earlier in this section that could potentially affect the value relevance in the regression and, thereafter, tested whether the effect of CEO social capital on the value relevance of accounting metrics persists in different subsamples with respect to the three potentially confounding factors addressed in this section. Specifically, we first divided our sample into two subsamples by the median values of the factors noted earlier in this section, divided each subsample into high and low social capital groups, reran the regression model (1) for each group and compared the coefficients of Book value per share and Earnings per share between high and low social capital groups.
We started our analysis by examining the conditioning effect on earnings quality. To create the proxy for earnings quality, we adopted the Dechow and Dichev (2002) model that considers accruals as a function of past, present and future cash flows. We also incorporated the thoughts of McNichols (2002) by including the change associated with the change in sales as well as the level of property, plant and equipment in the regression. Specifically, we first ran the following cross-sectional regression by each industry based on the 2-digit SIC code and year:23
where ΔWC is the change in working capital from year t − 1 to year t, CFO is the cash flow from operations, ΔREV is the change in sales from year t − 1 to year t and PPE is the level of property, plant and equipment at year t. All variables were scaled by average total assets between the year t − 1 and t. We required each industry-year to have at least 10 observations to run the regression and generate residuals. Next, we calculated the standard deviation of the residuals over a rolling window of three years as our measure of earnings quality.
Panel A of Table 6 reports the results with respect to our analysis of the possible effects of earning quality. As reported in Panel A, the negative (positive) effect of CEO social capital on the value relevance of the book value of equity (earnings) is comparable and significant across all subsamples based on high and low earnings quality. The overall explanatory power of the regression model indicates that the firms managed by CEOs with higher social capital report more value-relevant accounting metrics in the “low earnings quality” subsample. Thus, we concluded that the overall results from Table 3 are not driven by the earnings quality of the firms.
We next turned to the conditional effect of accounting conservatism. To create the accounting conservatism proxy, we followed Khan and Watts (2009) to obtain the G_ and C_ score and sum the two numbers together to get the firm-year measure of accounting conservatism.24 Specifically, we ran annual cross-sectional regressions:
where is the total income before extraordinary items divided by the market value of equity for year t − 1 of firm C; represents the stock returns from year t − 1 to year t; is an indicator variable that equals to one if the value of R is negative and zero otherwise in year t; is the natural logarithm of total assets; M/Bi is the market value of equity over the book value of equity and is the leverage representing the sum of both the short-term debt and long-term debt scaled by total assets. The combined effect of the coefficients of (G_score) and (C_score) presents the joint effects of conservatism and is used as our measurement of accounting conservatism.
Panel B of Table 6 reports the results with respect to our analysis of the possible effects of accounting conservatism. Panel B reports the differences for the coefficients of Book value per share and Earnings per share between high and low social capital groups in both high and low accounting conservatism subsamples have the expected signs and remain statistically significant. In turn, the results indicate that the negative (positive) effect of CEO social capital on the value relevance of book value of equity (earnings) remains in both high and low accounting conservatism subsamples although the effect from the high accounting conservatism group is marginally higher than the one from low accounting conservatism group. The overall explanatory power of the regression model reveals that the firms managed by CEOs with higher social capital report more value-relevant accounting metrics in the “low accounting conservatism” subsample. Overall, we concluded that accounting conservatism may weaken or strengthen, but not mitigate, the effect of CEO social capital on the accounting metrics. The overall results reported in Table 3 held after controlling for the level of accounting conservatism of the firms.
Finally, we addressed the investment efficiency of firms. To divide the sample into subgroups by investment efficiency, we followed the method employed by Biddle et al. (2009). Specifically, we identified the firm-year observations ranking in the two middle quartiles of investment efficiency as the efficient investment group and identify the firm-year observations ranking in the top and bottom quartiles of the investment measurement as the inefficient investment group. To calculate the investment efficiency measurement, we first ran cross-sectional regressions by industry group, using two-digit SIC codes and year using the following regression model:
where represents the investment of a firm in R&D, capital expenditures and acquisitions, scaled by lagged total assets, in year t + 1; represents the growth of sales of a firm from year t − 1 to t. Again, we required each regression to have at least 10 observations to run the regression procedures and obtain the residuals as the measurement of investment efficiency.
Panel C of Table 6 reports the results with respect to our analysis of the possible effects of investment efficiency. Specifically, as reported in Panel C, the directional signs and significance level of the differences for the coefficients of Book value per share and Earnings per share between high and low social capital groups in both high and low investment efficiency subsamples are as expected. We thereby concluded that the effect of CEO social capital on accounting metrics persists in the firms regardless of the level of investment efficiency. Interestingly, the overall explanatory power of the regression model suggests that the firms managed by CEOs with higher social capital report more value-relevant accounting metrics in the “high investment efficiency” subsample.
Overall, the results documented in this subsection provide evidence that the effects of CEO social capital on the book value and earnings metrics are not significantly influenced by the earnings quality, accounting conservatism and investment efficiency of the firms included in our analyses.
It is also worth noting that the extant literature reports that the value relevance of accounting metrics significantly differs between profitable and loss firms (Collins et al. 1999; Hayn 1995; Shust and Weiss 2022). To ensure that the effect of CEO social capital on the value relevance of accounting metrics does not significantly vary with the operational profitability of the firms, we used the same method described earlier in this subsection and run the following additional analysis. First, we divided our sample into two subsamples based on whether the firm has an operating profit or loss for the year. Then we divided each subsample into high and low social capital groups and reran the regression model (1) without Op_loss as the control variable for each group. Thereafter, we compared the coefficients of Book value per share and Earnings per share between high and low social capital groups. The empirical result (untabulated) from this analysis indicates that the effect of CEO social capital on the value relevance of accounting metrics persists across profitable and unprofitable firms.25
4.1.5. Controlling for Firm Human Capital
CEO social capital could potentially proxy for the human capital of the management team associated with a firm. In this regard, Francis et al. (2020) find that managerial ability, as a proxy for the human capital of the firm, has a positive impact on the value relevance of earnings metrics. To ensure that our findings primarily relate to the effect of social capital, rather than solely from the effect of the human capital of the management team in the firms, we included managerial ability (Demerjian et al. 2012) in our regression model26.
Due to limited data availability, our sample size is limited to 19,898 firm-year observations. Based on the results reported in Table 7, after controlling for managerial ability, the differences in the coefficients of Book value per share and Earnings per share between high and low social capital groups have the expected signs and remain statistically significant (p < 0.05).27 Thus, the overall results documented in this subsection indicate that the impact of social capital on the value relevance of book value and earnings metrics remains the same even after controlling for managerial ability; that is, controlling for the human capital of the firm.
4.1.6. Endogeneity Concerns
It is plausible that firms with negative (positive) value relevance with respect to the book value of equity (earnings) are more likely to hire CEOs that are more powerful and reputable. In turn, we attempted to triangulate against possible reverse causality and endogeneity concerns. Specifically, we reassigned the high and low social capital groups by the median value of one-year lagged social capital and found that the untabulated results hold. We then instrumented CEO social capital in a two-stage IV model and reassigned the high and low social capital groups by the medium value predicted by the two-stage IV model. Specifically, under the assumption that the industry mean CEO social capital in a year will be correlated with the firm CEO social capital but should not be a determinant of the value relevance of accounting metrics of a firm, we instrumented CEO social capital with industry mean CEO social capital and reran the analyses. Table 8 presents the second-stage results related to the two-stage IV regression. As indicated in Table 8, the differences for the coefficients of Book value per share and Earnings per share between high and low social capital groups have the expected signs and remain statistically significant (p < 0.01); all results hold.
Overall, we provide evidence that CEO social capital has a negative (positive) impact on the value relevance of the book value of equity (earnings). The effect is robust after controlling for earnings quality, accounting conservatism, investment efficiency and human capital of the management teams of the firms and is not due to the endogeneity of social capital measures. These results suggest that investors recognize the effect of CEO social capital and assign different weights on accounting metrics reported by firms managed by CEOs with higher social capital to price the firm equity. In the following, we address the results related to the second hypothesis.
4.2. CEO Social Capital and the Value Relevance of Accounting Metrics in High-Tech Related Industries
Table 9 reports the results related to the second hypothesis, with Panel A, Panel B and Panel C presenting results based on three different measures of high-tech industries, explicitly, high MTB equity ratio, high R&D expenditures and SIC codes employed by Francis and Schipper (1999), respectively. We expected social capital to be more impactful in industries with relatively higher information asymmetry between firms and investors.
As we were interested in evaluating whether the effect of CEO social capital on the value relevance of accounting metrics would be weakened/strengthened in firms associated with high-tech related industries, we focused on examining whether there are significant differences for the coefficients for Book value per share and Earnings per share between high and low social capital groups in both high- and low-tech subsamples. Columns (1), (2), (5), (6), (9) and (10) of all three panels (related to the high-tech subsample) report that the differences for the coefficients for Book value per share (Earnings per share) between high and low social capital groups in the high-tech subsample are negative (positive) and highly significant (p < 0.01); however, columns (3), (4), (7), (8), (11) and (12) (related to the low-tech subsample) reported mixed results28. The results indicate that the negative (positive) effect of CEO social capital on the value relevance of the book value of equity (earnings) only exists for firms in the high-tech subsample. The marginal effect is economically significant. Using the results from columns (1) to (4) of Panel A as an example, moving from the low to high CEO social capital group (e.g., moving from the 52nd percentile to the 80th percentile in Degree centrality in the High MTB group and from the 50th percentile to 78th percentile in Degree centrality in the low MTB group), an increase of USD 1 in Earnings per share results in about an 8.1% increase in the market price of common equity in the High MTB group, compared to a statistically and economically insignificant 0.1% increase in the Low MTB group29.
Overall, with respect to H2, we find a strong negative relationship between CEO social capital and the value relevance of book equity but a strong positive relationship between CEO social capital and the value relevance of earnings metrics—albeit, we find that both of these directional relationships are particularly stronger (that is, more significant) with respect to firms in high-tech industries. The results also suggest that firms with higher CEO social capital can better address certain complex operating situations, partially mitigating information asymmetry and, in turn, report more relevant information to the market.
4.3. Additional Analysis: Information vs. Reputation Channels
As stated in Section 2, both information and reputation channels could potentially drive the effect of CEO social capital on the value relevance of accounting metrics. In this section, we analyze which channels drive the negative (positive) effect of CEO social capital on the value relevance of the book value of equity (earnings) in the overall sample and the high-tech subsample.
We followed Egginton et al. (2022) to create proxies for information and reputation channels. First, we regressed the aggregate CEO social capital measurement on a vector of plausible variables of firm and personal CEO characteristics that are likely to be correlated with our CEO social capital measures. Since larger and more profitable firms are more likely to hire reputable and experienced CEOs, the vector of firm characteristics includes firm size, leverage and profitability. The vectors of CEO personal characteristics include the total executive tenure of the executive (from the first executive appointment at any firm), the total number of boards on which the CEO has served, whether the CEO has a degree from an elite university and whether and how many times the CEO has been recognized with a meaningful award. The predicted value and the residual from this first stage are proxies for the reputation and information channels, respectively. Next, we created the high and low social capital groups based on the proxy for both information and reputation channels, run the regression model (1) and compare the differences for the coefficient of Book value per share and Earnings per share between high and low social capital groups.
Table 10 reports the results of the additional analyses, with Panels A, B, C and D presenting the results related to the entire sample and high-tech subsample defined by high MTB ratio, high R&D and SIC codes employed by Francis and Schipper (1999), respectively. As indicated in all panels, from the perspective of the incremental explanatory power of the book value of equity and earnings metrics, both the information and reputation channels seem to drive the effect of CEO social capital on the value relevance of accounting metrics. However, the effect from the reputation channel seems to be somewhat stronger, particularly for the entire sample. In contrast, from the perspective of the overall explanatory power of the regression models, the information channel seems to be somewhat stronger. We conclude that the market benefits from both the reputation of the CEO as well as the increased informational efficiency around firms led by more connected managers.
5. Conclusions
Prior research suggests that social capital, as an important intangible asset of a firm, influences the value creation process of the firms. We examined the relationship between CEO social capital and the value relevance of accounting metrics of the firm. Specifically, we investigated how CEO social capital, proxied by the CEO network centrality measures, affects the extent to which the capital market relies on the book value of equity and earnings metrics to price equity. Our results indicate a strong negative relationship between CEO social capital and the value relevance of book equity but a strong positive relationship between CEO social capital and the value relevance of earnings metrics. Moreover, additional analyses indicate that our results are robust across different proxies for market price and earnings metrics and after controlling for earnings quality, earnings conservatism, investment efficiency and the human capital of the firms. Further, additional analyses also confirm that our results are not influenced by endogeneity. Our results reveal that the directional relationships are particularly stronger with respect to firms in high-tech industries, which may suggest that firms with higher CEO social capital have a greater ability to address certain complex operating situations and, in turn, report more relevant information to the market when information asymmetries are higher. Lastly, additional analyses suggest that market participants benefit both via a reputational effect and greater information efficiencies when CEO social capital is higher.
Overall, our results indicate that the capital market does recognize and value CEO social capital as it has a significant impact on the value relevance of accounting metrics. From the perspective of the firm, greater CEO social capital serves an important role in improving the overall information environment of the firm by providing more relevant accounting metrics to the market. Our findings have important practical implications for investors and analysts in that CEO social capital improves the value relevance of accounting information. Specifically, investors and analysts should assess the impact of CEO social capital on the value relevance of accounting metrics when evaluating the equity value of a firm using models grounded in the residual income framework.
One potential limitation regarding our results relates to the fact that we only used US firms in our sample and we only considered the executive networks in North America to calculate the CEO social capital/network centrality measures. In other countries, such as East Asian countries, business connections may not be the only connection that matters for market and firm outcomes. Some other country-level factors, such as culture, legal environment and political stability, may also influence CEOs’ behavior and in turn, “more connected” CEOs may be entrenched and engage in rent-seeking behaviors that may significantly influence the capital market’s view on CEO social capital. Thus, our results may be limited to US firms only. In this regard, we believe that it would be exceedingly fruitful for future research to address the effect of CEO social capital on the value relevance of accounting metrics on a broader international basis.
It is also worth noting that the study may have other potential limitations. For example, we adopted the Ohlson (1995) model as our baseline model and therefore relied on the major assumptions underpinning the Ohlson (1995) model, as well as the theoretical framework underpinning the residual income model. Specifically, the adoption of these theories and assumptions leads to potential scope limitations of our study; for instance, we were unable to conduct a difference-in-difference (DID) analysis to fully address the potential persistence of CEO social capital measures as well as potential endogeneity concerns. Additionally, the interpretation of our results may differ if the theories and assumptions in our study are violated. For example, if the US market is inefficient, the market may overstate the effect of CEO social capital on the value relevance of earnings measures; thus, market perceptions of CEO social capital as a net-positive asset may be biased.
Author Contributions
Conceptualization, H.Q.; Methodology, W.R.M. and H.Q.; Software, H.Q.; Validation, H.Q.; Formal analysis, H.Q.; Investigation, M.S.L.; Resources, H.Q.; Data curation, H.Q.; Writing—original draft, H.Q.; Writing—review & editing, M.S.L., W.R.M. and H.Q.; Visualization, M.S.L. and W.R.M.; Supervision, M.S.L. and W.R.M.; Project administration, H.Q.; Funding acquisition, M.S.L. All authors have read and agreed to the published version of the manuscript.
Funding
This research received no external funding.
Data Availability Statement
The data presented in this study are available on request from the corresponding author. The data that support the findings of this study are collected from the WRDS platform (e.g., Boardex; Thomson Reuters Worldscope). Restrictions apply to the availability of these data, which were used under license for this study.
Acknowledgments
We thank the Risks’ editors and anonymous reviewers for their critical intellectual contributions pertaining to our current manuscript. With respect to the most recent previous version of our manuscript, we are particularly grateful for the insightful comments provided by the anonymous reviewers associated with the Hawaii Accounting Research Conference 2023 (HARC2023). Additionally, with respect to an earlier version of our manuscript, we appreciate the suggestions provided by participants at the 16th NYCU International Finance Conference, Research Symposium on Finance and Economics (RSFE) 2022 and the Southwestern Finance Association 2022 Annual Meeting. For this project, Michael S. Luehlfing received funding through his George E. Breazeal Family Endowed Professorship which is made available through the State of Louisiana Board of Regents Support Funds. For this project, William R McCumber received funding through his JPJ Investments Endowed Professorship which is made available through the State of Louisiana Board of Regents Support Funds. For this project, Huan Qiu received funding from McMillan Fund of Else School of Management, Millsaps College.
Conflicts of Interest
The authors declare no conflict of interest.
Appendix A. Variable Description
The appendix summarizes the definitions of the variables employed in our study. All continuous variables are winsorized at 1% and 99% levels.
| Variables | Descriptions |
| Dependent Variables: | |
| Pricethree | Market price of the common equity at the end of three months after fiscal year end of year t |
| Pricetwo | Market price of the common equity at the end of two months after fiscal year end of year t |
| Priceone | Market price of the common equity the end of one month after fiscal year end of year t |
| Priceyear-end | Market price of the common equity right at fiscal year-end of year t |
| Variables of interest: CEO Social Capital Measurement | |
| Degree | Number of direct ties with others in the network |
| Eigen | Connection to “connected” people in the network |
| PCA | Principal Component of percentile value of Degree and Eigen centrality measures |
| Reputation channel | The predicted value generated by regressing the raw CEO social capital data on a vector of plausible variables of firm and personal CEO characteristics that are likely to be correlated with our CEO social capital measures |
| Information channel | The residual value generated by regressing the raw CEO social capital data on a vector of plausible variables of firm and personal CEO characteristics that are likely to be correlated with our CEO social capital measures |
| Variables of interest: Others | |
| Book value per share | Common equity scaled by number of shares outstanding in year t |
| Earnings per share | Net income scaled by number of shares outstanding in year t |
| Op earnings per share | Operating income scaled by number of shares outstanding in year t |
| Cash flow per share | Cash flow from operating activities scaled by number of shares outstanding in year t |
| Accruals per share | The difference between net income and cash flow from operating activities scaled by the number of shares outstanding in year t |
| Exclusions per share | The difference between net income and operating income scaled by the number of shares outstanding in year t |
| Control Variables: | |
| Size | Firm size at year t (natural log of one plus book value of assets) |
| ROA_std | Rolling standard deviation of ROA for past three years including current year |
| Leverage | One measurement of leverage (at year t), as total current and long-term debt scaled by total asset |
| Sales growth | Current year sales growth rate: calculated by the difference in sales amounts between the current and previous year scaled by the total sales amounts last year |
| Op loss | Indicator variable equals to 1 if the firm incurs an operational loss in year t, 0 otherwise |
| Big4 | Indicator variable equals to 1 if a firm uses Big 4 auditors, 0 otherwise |
| Duality | Indicator variable equals to 1 if the CEO also serves as the board director |
| Tenure | Natural log of 1 plus years that the person serves as CEO in a firm |
| Others: | |
| year | Used to control for year fixed effect |
| ff48 | Fama and French (1997) classifications of 48 industries, used to control for industry fixed effect |
| 1 | As CEO social capital is a valuable non-physical resource of a firm that can potentially bring future benefits to the firm, we believe that it qualifies as an intangible asset under traditional accounting standards. However, since CEO social capital is not currently recorded under traditional accounting standards, we also believe that (similar to the unrecorded value of the overall workforce of a firm) CEO social capital qualifies as an unrecorded intangible asset of a firm. |
| 2 | For example, investors need to be able to predict future operating results based on accounting metrics measured under traditional accounting standards. |
| 3 | The first model version expressed is normally referred to as the dividend discounted model and the second model version expressed is normally referred to as the free cash flow model. If a company pays out all of its free cash flows to the equity shareholders as dividends, then the free cash flow model is equivalent to the dividend discounted model. |
| 4 | Skogsvik and Skogsvik (2010, note 2) attribute the theory underpinning the residual income model to Preinreich (1938, formula (57)). |
| 5 | The Ohlson model is sometimes referred to as the price model (e.g., Barth et al. 2001). While we address the existence of the return model (Ball and Brown 1968; Easton 1999; Kothari and Zimmerman 1995), the return model primarily focuses on the explanation power of equity return based on the change in earnings metrics and does not incorporate the book value of equity in the regression model. Additionally, the literature (e.g., Kothari and Zimmerman 1995) indicates that the price model can better measure the incremental effect of accounting metrics on equity price. Thus, we prefer to use the price model as it allows us to fully test our hypotheses (in contrast to the return model). |
| 6 | Our value relevance test assumes market efficiency to the extent that the equity price has incorporated a certain amount of public and/or private information There are three forms of efficient market hypotheses: weak form, semi-strong form and strong form. Similar to the residual income framework, the Ohlson model assumes (at a minimum) the semi-strong form of efficient market, which assumes that the equity price reflects (at a minimum) all currently available information. |
| 7 | According to the Ohlson (1995) model, as well as the framework underpinning the residual income model, the book value of equity serves as the floor value for a company’s equity value, whereas the portion from earnings represents an addition to the floor of the book value. Thus, if CEOs with higher social capital can extract rents at the expense of the investors at a lower cost than their less-connected peers and, in turn, the financial health of the firm deteriorates, then investors would be hesitant to rely on earnings and assign additional value for the firm; therefore, the value of the firms would likely deteriorate. Admittedly, although the book value of the equity does not account for CEO social capital, the lower equity value leads to a closer relationship with the floor value; that is, the book value of equity. |
| 8 | We argue that since CEOs with higher social capital are more “visible” to market participants, such participants will more heavily depend on the information obtained through CEO social capital channels; that is, market participants will form their evaluation of firm value based on the information they possess. In essence, a participant’s increased reliance on such information will also increase their reliance on accounting metrics (via a spillover effect) to estimate the value of a firm. |
| 9 | Given that our purpose is to examine the effect of CEO social capital on the value relevance of the book value per share of equity and earnings per share, we initially interact the percentile value of CEO social capital with the variables of interest in the Ohlson (1995) model; however, using the percentile values causes a multicollinearity issue for the regression. Thus, to address multicollinearity, we divided our sample into high and low social capital groups. |
| 10 | In an untabulated analysis, we also employed an alternative method by including an indicator variable of “high social capital” and interacted that indicator variable with the variables of interest in the regression based on the entire sample and the results hold. |
| 11 | In an untabulated analysis, we also included the interaction terms between the control variables and the variables of interest in the regression; however, including the interaction terms caused severe multicollinearity issues, especially for the interaction terms between firm size and the variables of interest. Thus, the primary results in the study were determined from the regressions without the interaction term between control variables and the variables of interest. Importantly, the results remain the same with the inclusion of the interaction terms between the control variables and the variables of interest, except for firm size. |
| 12 | To check for the robustness of our results, we used different proxies for future price in the regression. |
| 13 | The regression results are similar without including the control variables in the regression. |
| 14 | In an untabulated analysis, we also employed High MTB and High R&D groups by using the medium value of MTB and R&D expenditures by each industry defined by a two-digit SIC code for each year and then reran the regressions obtaining similar results. |
| 15 | For the regression related to High Tech, we only included a subsample of relevant firm-year observations within the SIC codes defined by Francis and Schipper (1999). |
| 16 | The results stayed the same with the inclusion of the interaction terms between control variables and the variables of interest, except for firm size (since the inclusion of interaction term between firm size and the variables of interest causes a severe multicollinearity issue). |
| 17 | Given that the mean market price of the common equity is 23.55, the 2.4% decrease is calculated as −0.554/23.55, whereas the 6.4% increase is calculated as 1.506/23.55. |
| 18 | The average marginal effect of the Book value per share and Earnings per share is about 1.612 and 1.453, respectively. |
| 19 | The results stayed the same with the inclusion of the interaction terms between control variables and variables of interest, except for firm size (since the inclusion of interaction term between firm size and the variables of interest causes a severe multicollinearity issue). |
| 20 | We performed an untabulated analysis similar to the analysis carried out for Table 3 and obtained similar results. |
| 21 | In addition, the results of an untabulated analysis indicate that the positive and significant relationship arises from the difference between op earnings per share and cash flow per share. |
| 22 | Employing accounting metrics specifically measured under traditional financial accounting standards, the differences between operating income and net income are considered nonrecurring adjustments, while differences between operating income and cash flow from operating activities are considered recurring adjustments. |
| 23 | We used an alternative method to define industry categories based on the Fama and French (1997) industry classifications and obtained similar results. |
| 24 | We employed the C_score (without the G_score) to measure accounting conservatism and obtain similar results. |
| 25 | We thank the anonymous reviewer who suggested that we test whether the effect of CEO social capital on the value relevance of accounting metrics persists across profitable and unprofitable firms. |
| 26 | The data for managerial ability was obtained from: https://peterdemerjian.weebly.com/managerialability.html (accessed on 25 March 2023). |
| 27 | The result does not change with the inclusion of the interaction terms between managerial ability and the variables of interest. |
| 28 | The negative (positive) effect of CEO social capital on the value relevance of the book value of equity (earnings) is diminished in the low-tech subsample, except for the differences for the coefficient of earnings per share between columns (7) and (8) of Panel A, which remained positive and marginally significant (p < 0.1). Nevertheless, compared with the corresponding values in the high-tech subsample, that is, the differences for the coefficient of earnings per share between columns (5) and (6), the magnitude is much smaller in the low-tech subsample. |
| 29 | The 8.1% increase in High MTB group was calculated as 1.918/23.55 and the 0.1% decrease in non-High MTB group was calculated as 0.033/23.55. |
References
- Amir, Eli, and Baruch Lev. 1996. Value-relevance of nonfinancial information: The wireless communications industry. Journal of Accounting and Economics 22: 3–30. [Google Scholar] [CrossRef]
- Balachandran, Sudhakar V., and Partha S. Mohanram. 2011. Is the decline in the value relevance of accounting driven by increased conservatism? Review of Accounting Studies 16: 272–301. [Google Scholar] [CrossRef]
- Ball, Ray, and Philip Brown. 1968. An empirical evaluation of accounting income numbers. Journal of Accounting Research 6: 159–78. [Google Scholar] [CrossRef]
- Banker, Rajiv D., Rong Huang, and Ramachandran Natarajan. 2009. Incentive contracting and value relevance of earnings and cash flows. Journal of Accounting Research 47: 647–78. [Google Scholar] [CrossRef]
- Banz, Rolf W., and William J. Breen. 1986. Sample-dependent results using accounting and market data: Some evidence. The Journal of Finance 41: 779–93. [Google Scholar] [CrossRef]
- Barth, Mary E., and Sanjay Kallapur. 1996. The effects of cross-sectional scale differences on regression results in empirical accounting research. Contemporary Accounting Research 13: 527–67. [Google Scholar] [CrossRef]
- Barth, Mary E., William H. Beaver, and Wayne R. Landsman. 1998. Relative valuation roles of equity book value and net income as a function of financial health. Journal of Accounting and Economics 25: 1–34. [Google Scholar] [CrossRef]
- Barth, Mary E., William H. Beaver, and Wayne R. Landsman. 2001. The relevance of the value relevance literature for financial accounting standard setting: Another view. Journal of Accounting and Economics 31: 77–104. [Google Scholar] [CrossRef]
- Barth, Mary E., William H. Beaver, John R. M. Hand, and Wayne R. Landsman. 1999. Accruals, cash flows, and equity values. Review of Accounting Studies 4: 205–29. [Google Scholar] [CrossRef]
- Bebchuk, Lucian A., K. J. Martjin Cremers, and Urs C. Peyer. 2011. The CEO pay slice. Journal of Financial Economics 102: 199–221. [Google Scholar] [CrossRef]
- Bhandari, Avishek, Babak Mammadov, Austin Shelton, and Maya Thevenot. 2018. It is not only what you know, it is also who you know: CEO network connections and financial reporting quality. Auditing: A Journal of Practice & Theory 37: 27–50. [Google Scholar]
- Biddle, Gary C., Gilles Hilary, and Rodrigo S. Verdi. 2009. How does financial reporting quality relate to investment efficiency? Journal of Accounting and Economics 48: 112–31. [Google Scholar] [CrossRef]
- Brown, Lawrence D., and Kumar Sivakumar. 2003. Comparing the value relevance of two operating income measures. Review of Accounting Studies 8: 561–72. [Google Scholar] [CrossRef]
- Burgstahler, David C., and Ilia D. Dichev. 1997. Earnings, Adaptation and Equity Value. Accounting Review 72: 187–215. [Google Scholar]
- Burson-Marsteller. 2003. CEO Reputation Study. Brussels: Burson-Marsteller. [Google Scholar]
- Burt, Ronald S. 1997. The contingent value of social capital. Administrative Science Quarterly 42: 339–65. [Google Scholar] [CrossRef]
- Burt, Ronald S. 2005. Brokerage and Closure: An Introduction to Social Capital. Oxford and New York: Oxford University Press. [Google Scholar]
- Collins, Daniel W., Edward L. Maydew, and Ira S. Weiss. 1997. Changes in the value-relevance of earnings and book values over the past forty years. Journal of Accounting and Economics 24: 39–67. [Google Scholar] [CrossRef]
- Collins, Daniel W., Morton Pincus, and Hong Xie. 1999. Equity valuation and negative earnings: The role of book value of equity. The Accounting Review 74: 29–61. [Google Scholar] [CrossRef]
- Davis-Friday, Paquita Y., Li Li Eng, and Chao-Shin Liu. 2006. The effects of the Asian crisis, corporate governance and accounting system on the valuation of book value and earnings. The International Journal of Accounting 41: 22–40. [Google Scholar] [CrossRef]
- Dechow, Patricia M., and Ilia D. Dichev. 2002. The quality of accruals and earnings: The role of accrual estimation errors. The Accounting Review 77: 35–59. [Google Scholar] [CrossRef]
- Demerjian, Peter, Baruch Lev, and Sarah McVay. 2012. Quantifying managerial ability: A new measure and validity tests. Management Science 58: 1229–48. [Google Scholar] [CrossRef]
- Easton, Peter D. 1999. Security returns and the value relevance of accounting data. Accounting Horizons 13: 399–412. [Google Scholar] [CrossRef]
- Egginton, Jared F., and William R. McCumber. 2019. Executive network centrality and stock liquidity. Financial Management 48: 849–71. [Google Scholar] [CrossRef]
- Egginton, Jared F., Garrett A. McBrayer, and William R. McCumber. 2022. Executive networks and global stock liquidity. Journal of Financial Research 45: 911–39. [Google Scholar] [CrossRef]
- El-Khatib, Rwan, Kathy Fogel, and Tomas Jandik. 2015. CEO network centrality and merger performance. Journal of Financial Economics 116: 349–82. [Google Scholar] [CrossRef]
- Elliott, Roberi K., and Poter D. Jacobson. 1991. U.S. Accounting: A national emergency. Journal of Accountancy 172: 54–58. [Google Scholar]
- Engel, Ellen, Rachel M. Hayes, and Xue Wang. 2003. CEO turnover and properties of accounting information. Journal of Accounting and Economics 36: 197–226. [Google Scholar] [CrossRef]
- Engelberg, Joseph, Pengjie Gao, and Christopher A. Parsons. 2012. Friends with money. Journal of Financial Economics 103: 169–88. [Google Scholar] [CrossRef]
- Entwistle, Gary M., Glenn D. Feltham, and Chima Mbagwu. 2010. The value relevance of alternative earnings measures: A comparison of pro forma, GAAP, and I/B/E/S earnings. Journal of Accounting, Auditing & Finance 25: 261–88. [Google Scholar]
- Fama, Eugene F., and James D. MacBeth. 1973. Risk, return, and equilibrium: Empirical tests. Journal of Political Economy 81: 607–36. [Google Scholar] [CrossRef]
- Fama, Eugene F., and Kenneth R. French. 1997. Industry costs of equity. Journal of Financial Economics 43: 153–93. [Google Scholar] [CrossRef]
- Feltham, Gerald A., and James A. Ohlson. 1995. Valuation and clean surplus accounting for operating and financial activities. Contemporary Accounting Research 11: 689–731. [Google Scholar] [CrossRef]
- Feltham, Gerald A., and James A. Ohlson. 1996. Uncertainty resolution and the theory of depreciation measurement. Journal of Accounting Research 34: 209–34. [Google Scholar] [CrossRef]
- Ferris, Stephen P., David Javakhadze, and Tijana Rajkovic. 2017a. CEO social capital, risk-taking and corporate policies. Journal of Corporate Finance 47: 46–71. [Google Scholar] [CrossRef]
- Ferris, Stephen P., David Javakhadze, and Tijana Rajkovic. 2017b. The international effect of managerial social capital on the cost of equity. Journal of Banking & Finance 74: 69–84. [Google Scholar]
- Fogel, Kathy, Tomas Jandik, and William R. McCumber. 2018. CFO social capital and private debt. Journal of Corporate Finance 52: 28–52. [Google Scholar] [CrossRef]
- Fracassi, Cesare. 2017. Corporate finance policies and social networks. Management Science 63: 2420–38. [Google Scholar] [CrossRef]
- Fracassi, Cesare, and Geoffrey Tate. 2012. External networking and internal firm governance. The Journal of Finance 67: 153–94. [Google Scholar] [CrossRef]
- Francis, Bill, Iftekhar Hasan, Ibrahim Siraj, and Qiang Wu. 2020. Managerial ability and value relevance of earnings. China Accounting and Finance Review 21: 147–91. [Google Scholar]
- Francis, Jennifer, and Katherine Schipper. 1999. Have financial statements lost their relevance? Journal of Accounting Research 37: 319–52. [Google Scholar] [CrossRef]
- Francis, Jennifer, Ryan LaFond, Per M. Olsson, and Katherine Schipper. 2004. Costs of equity and earnings attributes. The Accounting Review 79: 967–1010. [Google Scholar] [CrossRef]
- Georgieva, Dobrina, Tomas Jandik, and Weineng Xu. 2016. CEO Network Centrality and IPO Performance. Working Paper. Available online: https://economics.uark.edu/conference-files/Jandik-CEO-Network-Centrality-and-IPO-Performance_201606_CIRANO_final.pdf (accessed on 25 March 2023).
- Graham, John R., Campbell R. Harvey, and Shiva Rajgopal. 2005. The economic implications of corporate financial reporting. Journal of Accounting and Economics 40: 3–73. [Google Scholar] [CrossRef]
- Griffin, Paul A., Hyun A. Hong, Yun Liu, and Ji Woo Ryou. 2021. The dark side of CEO social capital: Evidence from real earnings management and future operating performance. Journal of Corporate Finance 68: 101920. [Google Scholar] [CrossRef]
- Hambrick, Donald C., and Phyllis A. Mason. 1984. Upper echelons: The organization as a reflection of its top managers. Academy of Management Review 9: 193–206. [Google Scholar] [CrossRef]
- Hayn, Carla. 1995. The information content of losses. Journal of Accounting and Economics 20: 125–53. [Google Scholar] [CrossRef]
- Hill and Knowlton. 2002. Corporate Reputation Watch. In Business Respect 39. New York: Hill and Knowlton. [Google Scholar]
- Hodgson, Allan, and Peta Stevenson-Clarke. 2000. Earnings, cashflows and returns: Functional relations and the impact of firm size. Accounting & Finance 40: 51–74. [Google Scholar]
- Hughes, K. E. 2000. The value relevance of nonfinancial measures of air pollution in the electric utility industry. The Accounting Review 75: 209–28. [Google Scholar] [CrossRef]
- Jenkins, Edmund L. 1994. An information highway in need of capital improvements. Journal of Accountancy 177: 77. [Google Scholar]
- Khan, Mozaffar, and Ross L. Watts. 2009. Estimation and empirical properties of a firm-year measure of accounting conservatism. Journal of Accounting and Economics 48: 132–50. [Google Scholar] [CrossRef]
- Kothari, Sriprakask P., and Jerold L. Zimmerman. 1995. Price and return models. Journal of Accounting and Economics 20: 155–92. [Google Scholar] [CrossRef]
- Larcker, David F., Eric C. So, and Charles C. Wang. 2013. Boardroom centrality and firm performance. Journal of Accounting and Economics 55: 225–50. [Google Scholar] [CrossRef]
- Malmendier, Ulrike, and Geoffrey Tate. 2008. Who makes acquisitions? CEO overconfidence and the market’s reaction. Journal of Financial Economics 89: 20–43. [Google Scholar] [CrossRef]
- McNichols, Maureen F. 2002. Discussion of the quality of accruals and earnings: The role of accrual estimation errors. The Accounting Review 77: 61–69. [Google Scholar] [CrossRef]
- Milbourn, Todd T. 2003. CEO reputation and stock-based compensation. Journal of Financial Economics 68: 233–62. [Google Scholar] [CrossRef]
- Nohria, N. 1992. Is a Network Perspective a Useful Way of Studying Organizations? In Networks and Organizations. Edited by N. Nohria and R. G. Eccles. Boston: Harvard Business School Press, pp. 1–22. [Google Scholar]
- Ohlson, James A. 1995. Earnings, book values, and dividends in equity valuation. Contemporary Accounting Research 11: 661–87. [Google Scholar] [CrossRef]
- Ohlson, James A. 1999. Earnings, book values, and dividends in a stewardship setting with moral hazard. Contemporary Accounting Research 16: 525–40. [Google Scholar] [CrossRef]
- Preinreich, Gabriel A. 1938. Annual survey of economic theory: The theory of depreciation. Econometrica: Journal of the Econometric Society, 219–41. [Google Scholar] [CrossRef]
- Shust, Efrat. 2015. Does research and development activity increase accrual-based earnings management? Journal of Accounting, Auditing & Finance 30: 373–401. [Google Scholar]
- Shust, Efrat, and Dan Weiss. 2022. Disentangling relevance from reliability in value relevance tests. Sustainability 14: 13449. [Google Scholar] [CrossRef]
- Skogsvik, Stina, and Kenth Skogsvik. 2010. Accounting-based probabilistic prediction of ROE, the residual income valuation model and the assessment of mispricing in the Swedish stock market. Abacus 46: 387–418. [Google Scholar] [CrossRef]
- Williams, John B. 1938. The Theory of Investment Value. Cambridge: Harvard University Press. [Google Scholar]
- Woolcock, Michael. 1998. Social capital and economic development: Toward a theoretical synthesis and policy framework. Theory and Society 27: 151–208. [Google Scholar] [CrossRef]
Figure 1.
Sample Distribution by industries classified by Fama and French (1997).
Figure 1.
Sample Distribution by industries classified by Fama and French (1997).
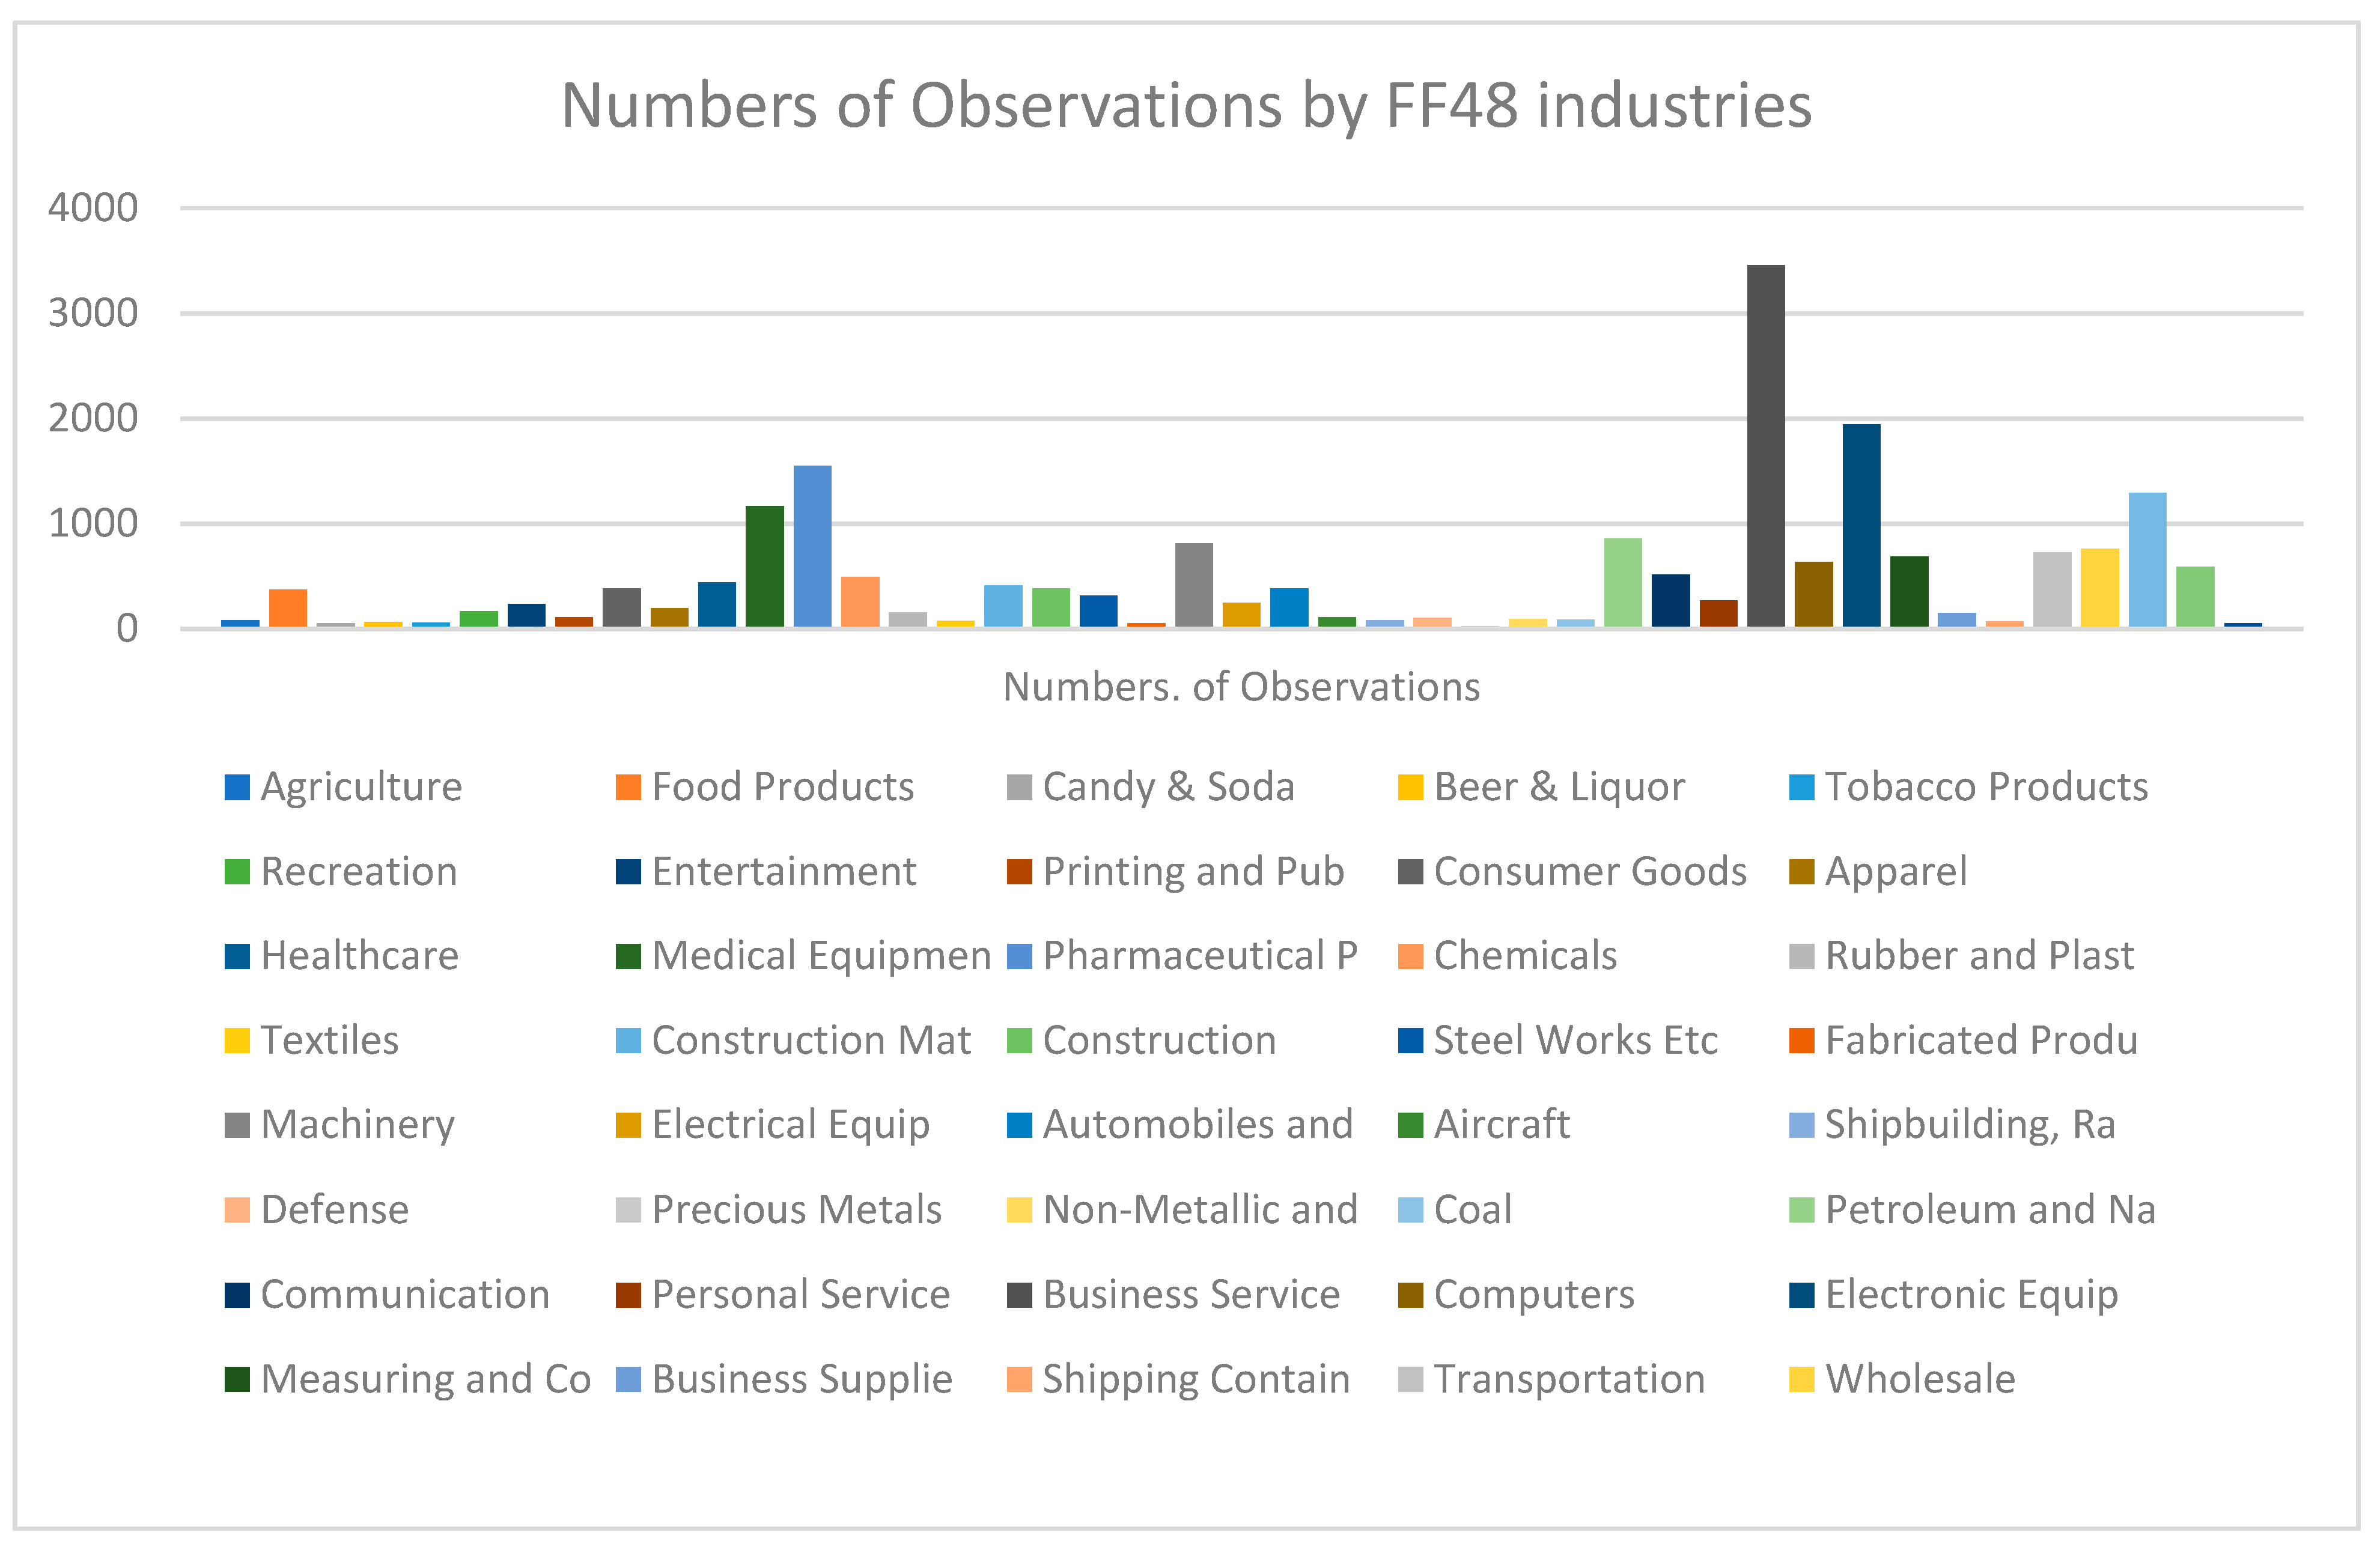
Figure 2.
Sample Distribution by years.

Figure 3.
Mean value of CEO social capital by industries classified by Fama and French (1997).
Figure 3.
Mean value of CEO social capital by industries classified by Fama and French (1997).

Figure 4.
Mean value of CEO social capital by years.


Table 1.
Summary Statistics. This table presents summary statistics for the entire sample.
| Variables | N | Mean | Sd | P25 | P50 | P75 |
|---|---|---|---|---|---|---|
| Dependent Variables | ||||||
| Pricethree | 20,691 | 23.55 | 29.29 | 5.60 | 14.00 | 29.45 |
| Pricetwo | 20,691 | 23.24 | 29.12 | 5.50 | 13.82 | 28.72 |
| Priceone | 20,691 | 23.10 | 28.80 | 5.66 | 13.90 | 28.83 |
| Priceyear-end | 20,691 | 24.57 | 40.40 | 5.62 | 14.03 | 28.93 |
| Variables of Interest | ||||||
| Degree | 20,691 | 65.12 | 16.66 | 52.00 | 64.00 | 78.00 |
| Eigen | 20,691 | 58.02 | 22.39 | 41.00 | 60.00 | 76.00 |
| PCA | 20,691 | 0.00 | 1.32 | −0.99 | −0.03 | 1.02 |
| Book value per share | 20,691 | 8.39 | 9.69 | 2.24 | 5.54 | 11.21 |
| Earnings per share | 20,691 | 0.28 | 2.65 | −0.37 | 0.32 | 1.26 |
| Op earnings per share | 20,691 | 1.28 | 2.73 | −0.12 | 0.74 | 2.32 |
| Cash flow per share | 20,691 | 1.56 | 2.84 | 0.05 | 0.92 | 2.45 |
| Accruals per share | 20,691 | −1.28 | 2.70 | −1.64 | −0.61 | −0.12 |
| Exclusions per share | 20,691 | −1.00 | 1.93 | −1.32 | −0.46 | −0.06 |
| Controlled Variables | ||||||
| Size | 20,691 | 19.70 | 2.03 | 18.27 | 19.61 | 21.09 |
| ROA sd | 20,691 | 0.19 | 0.88 | 0.02 | 0.05 | 0.13 |
| Leverage | 20,691 | 0.22 | 0.27 | 0.01 | 0.17 | 0.34 |
| Sales growth | 20,691 | 3.22 | 267.28 | −0.03 | 0.08 | 0.22 |
| Op loss | 20,691 | 0.36 | 0.48 | 0.00 | 0.00 | 1.00 |
| Big4 | 20,691 | 0.53 | 0.50 | 0.00 | 1.00 | 1.00 |
| Duality | 20,691 | 0.40 | 0.49 | 0.00 | 0.00 | 1.00 |
| Tenure | 20,691 | 1.32 | 0.89 | 0.69 | 1.39 | 1.95 |
Table 2.
Correlation Matrix. This table presents the results of Pearson pairwise correlation between variables.
Table 2.
Correlation Matrix. This table presents the results of Pearson pairwise correlation between variables.
| (1) | (2) | (3) | (4) | (5) | (6) | (7) | (8) | (9) | (10) | (11) | (12) | (13) | ||
|---|---|---|---|---|---|---|---|---|---|---|---|---|---|---|
| (1) | Pricethree | 1 | ||||||||||||
| (2) | Pricetwo | 0.9924 | 1 | |||||||||||
| 0.00 | ||||||||||||||
| (3) | Priceone | 0.9835 | 0.9897 | 1 | ||||||||||
| 0.00 | 0.00 | |||||||||||||
| (4) | Priceyear-end | 0.8804 | 0.8862 | 0.8974 | 1 | |||||||||
| 0.00 | 0.00 | 0.00 | ||||||||||||
| (5) | Degree | 0.2757 | 0.2708 | 0.2708 | 0.2013 | 1 | ||||||||
| 0.00 | 0.00 | 0.00 | 0.00 | |||||||||||
| (6) | Eigen | 0.2178 | 0.2142 | 0.2138 | 0.162 | 0.7343 | 1 | |||||||
| 0.00 | 0.00 | 0.00 | 0.00 | 0.00 | ||||||||||
| (7) | PCA | 0.265 | 0.2604 | 0.2602 | 0.1951 | 0.9312 | 0.9312 | 1 | ||||||
| 0.00 | 0.00 | 0.00 | 0.00 | 0.00 | 0.00 | |||||||||
| (8) | Book value per share | 0.6498 | 0.647 | 0.6557 | 0.6129 | 0.237 | 0.192 | 0.2303 | 1 | |||||
| 0.00 | 0.00 | 0.00 | 0.00 | 0.00 | 0.00 | 0.00 | ||||||||
| (9) | Earnings per share | 0.352 | 0.3447 | 0.337 | 0.2579 | 0.1236 | 0.0938 | 0.1167 | 0.2886 | 1 | ||||
| 0.00 | 0.00 | 0.00 | 0.00 | 0.00 | 0.00 | 0.00 | 0.00 | |||||||
| (10) | Op earnings per share | 0.5489 | 0.5403 | 0.5381 | 0.4459 | 0.2563 | 0.2037 | 0.247 | 0.4947 | 0.7443 | 1 | |||
| 0.00 | 0.00 | 0.00 | 0.00 | 0.00 | 0.00 | 0.00 | 0.00 | 0.00 | ||||||
| (11) | Cash flow per share | 0.5681 | 0.5569 | 0.5571 | 0.4899 | 0.2636 | 0.2116 | 0.2552 | 0.5536 | 0.5174 | 0.7724 | 1 | ||
| 0.00 | 0.00 | 0.00 | 0.00 | 0.00 | 0.00 | 0.00 | 0.00 | 0.00 | 0.00 | |||||
| (12) | Accruals per share | −0.2534 | −0.2486 | −0.2565 | −0.2631 | −0.1564 | −0.1309 | −0.1543 | −0.3001 | 0.4344 | −0.0843 | −0.546 | 1 | |
| 0.00 | 0.00 | 0.00 | 0.00 | 0.00 | 0.00 | 0.00 | 0.00 | 0.00 | 0.00 | 0.00 | ||||
| (13) | Exclusions per share | −0.2959 | −0.2936 | −0.3011 | −0.2788 | −0.1941 | −0.1604 | −0.1903 | −0.306 | 0.317 | −0.3974 | −0.386 | 0.7167 | 1 |
| 0.00 | 0.00 | 0.00 | 0.00 | 0.00 | 0.00 | 0.00 | 0.00 | 0.00 | 0.00 | 0.00 | 0.00 |
Table 3.
CEO social capital and the value relevance of accounting metrics. This table presents the results of the OLS regressions, explaining the effect of CEO social capital on the value relevance of book value of equity and earnings metrics. The dependent variable is Pricethree, a continuous variable measured by the market price of the common equity at the end of three months after fiscal year-end. CEO social capital is measured by Degree in columns (2) and (3), Eigen in columns (4) and (5) and PCA in columns (6) and (7); variables of interest in the regression include Book value per share (book value of common equity scaled by number of shares outstanding) and Earnings per share (net income scaled by number of shares outstanding). All regressions include control variables as defined in Appendix A. All regressions include time- and industry-fixed effects and the errors are robust to firm heteroscedasticity. T-values are reported in parentheses. Statistical significance of the coefficients is designated as ***, ** and * at 1%, 5% and 10% levels, respectively.
| Dependent Variable: Pricethree | Entire Sample | Degree | Eigen | PCA | ||||||
|---|---|---|---|---|---|---|---|---|---|---|
| High | Low | Difference | High | Low | Difference | High | Low | Difference | ||
| (1) | (2) | (3) | (2)–(3) | (4) | (5) | (4)–(5) | (6) | (7) | (6)–(7) | |
| Book value per share | 1.612 *** | 1.380 *** | 1.934 *** | −0.554 *** | 1.371 *** | 1.913 *** | −0.542 *** | 1.404 *** | 1.914 *** | −0.51 *** |
| (41.13) | (28.23) | (30.89) | (29.25) | (31.78) | (29.48) | (30.05) | ||||
| Earnings per share | 1.453 *** | 2.052 *** | 0.546 ** | 1.506 *** | 2.221 *** | 0.479 ** | 1.742 *** | 2.039 *** | 0.594 ** | 1.445 *** |
| (9.12) | (9.63) | (2.34) | (10.77) | (2.11) | (9.83) | (2.48) | ||||
| Size | 2.642 *** | 3.506 *** | 1.096 *** | 3.516 *** | 1.287 *** | 3.489 *** | 1.225 *** | |||
| (22.14) | (19.13) | (6.24) | (21.13) | (7.64) | (19.99) | (6.93) | ||||
| ROA sd | 0.106 | −0.181 | 0.363 * | −0.134 | 0.121 | −0.139 | 0.354 * | |||
| (0.69) | (−0.88) | (1.82) | (−0.59) | (0.63) | (−0.69) | (1.74) | ||||
| Leverage | 4.707 *** | 3.832 *** | 5.035 *** | 4.279 *** | 5.083 *** | 3.898 *** | 4.933 *** | |||
| (7.72) | (3.29) | (7.96) | (3.87) | (7.53) | (3.42) | (7.51) | ||||
| Sales Growth | 1.278 *** | 1.581 *** | 1.224 *** | 1.695 *** | 1.192 *** | 1.490 *** | 1.279 *** | |||
| (4.77) | (3.49) | (4.18) | (3.79) | (4.05) | (3.49) | (4.15) | ||||
| Op loss | −1.798 *** | −1.215 * | −2.852 *** | −0.250 | −3.287 *** | −0.983 | −2.820 *** | |||
| (−4.47) | (−1.81) | (−5.94) | (−0.40) | (−6.52) | (−1.54) | (−5.58) | ||||
| Big4 | −0.119 | −1.178 ** | 1.521 *** | −0.668 | 1.012 *** | −1.166 ** | 1.605 *** | |||
| (−0.38) | (−2.41) | (4.07) | (−1.36) | (2.69) | (−2.40) | (4.27) | ||||
| Duality | 0.385 | 1.167 ** | −0.345 | 1.365 *** | −0.694 * | 1.346 *** | −0.643 * | |||
| (1.29) | (2.52) | (−0.93) | (2.93) | (−1.95) | (2.96) | (−1.76) | ||||
| Tenure | 1.132 *** | 1.237 *** | 0.967 *** | 1.391 *** | 0.901 *** | 1.209 *** | 1.032 *** | |||
| (6.86) | (4.74) | (4.80) | (5.13) | (4.75) | (4.65) | (5.16) | ||||
| _cons | −58.75 *** | −71.15 *** | −32.99 *** | −73.36 *** | −33.71 *** | −71.13 *** | −35.42 *** | |||
| (−20.43) | (−16.42) | (−7.41) | (−17.50) | (−7.63) | (−17.22) | (−7.62) | ||||
| N | 20,691 | 10,122 | 10,569 | 10,009 | 10,682 | 10,337 | 10,354 | |||
| adj. R-sq | 0.530 | 52.6% | 51.7% | 0.9% | 53.2% | 52.6% | 0.6% | 53% | 51.4% | 1.6% |
| Industry Fixed Effect Included | Yes | Yes | Yes | Yes | Yes | Yes | Yes | |||
| Year Fixed Effect Included | Yes | Yes | Yes | Yes | Yes | Yes | Yes | |||
Table 4.
Alternative Measures of equity price. This table presents the results of the OLS regressions explaining the effect of CEO social capital on the value relevance of book value of equity and earnings metrics based on different equity prices as the dependent variable. In Panels A, B and C, the dependent variables are Pricetwo, Priceone and Priceyear-end, which are continuous variables measured by the market price of the common equity at the end of two months after fiscal year-end, at the end of one month after fiscal year-end and at the fiscal year-end, respectively. CEO social capital is measured by Degree in columns (2) and (3), Eigen in columns (4) and (5) and PCA in column (6) and (7); variables of interest in the regression include Book value per share (book value of common equity scaled by number of shares outstanding) and Earnings per share (net income scaled by number of shares outstanding). All regressions include control variables as defined in Appendix A. For brevity, the table only presents coefficients related to the variables of interest. All regressions include time- and industry-fixed effects and the errors are robust to firm heteroscedasticity. T-values are reported in parentheses. Statistical significance of the coefficients is designated as ***, ** and * at 1%, 5% and 10% levels, respectively.
| Panel A. Equity Price at Two-Month after Fiscal Year-End (Pricetwo) as Dependent Variable | ||||||||||
| Dependent Variable: Pricetwo | Entire Sample | Degree | Eigen | PCA | ||||||
| High | Low | Difference | High | Low | Difference | High | Low | Difference | ||
| (1) | (2) | (3) | (2)–(3) | (4) | (5) | (4)–(5) | (6) | (7) | (6)–(7) | |
| Book value per share | 1.609 *** | 1.370 *** | 1.941 *** | −0.571 *** | 1.357 *** | 1.926 *** | −0.569 *** | 1.390 *** | 1.929 *** | −0.539 *** |
| (41.13) | (28.26) | (31.04) | (29.21) | (32.11) | (29.43) | (30.42) | ||||
| Earnings per share | 1.408 *** | 2.030 *** | 0.478 ** | 1.552 *** | 2.192 *** | 0.429 * | 1.763 *** | 2.001 *** | 0.556 ** | 1.445 *** |
| (8.81) | (9.54) | (2.04) | (10.68) | (1.88) | (9.67) | (2.32) | ||||
| N | 20,691 | 10,122 | 10,569 | 10,009 | 10,682 | 10,337 | 10,354 | |||
| adj. R-sq | 52.6% | 52.3% | 51.4% | 0.9% | 52.9% | 52.1% | 0.8% | 52.6% | 51.1% | 1.5% |
| Industry Fixed Effect Included | Yes | Yes | Yes | Yes | Yes | Yes | Yes | |||
| Year Fixed Effect Included | Yes | Yes | Yes | Yes | Yes | Yes | Yes | |||
| Controlled Variables Included | Yes | Yes | Yes | Yes | Yes | Yes | Yes | |||
| Panel B. Equity Price at One-Month after Fiscal Year-End (Priceone) as Dependent Variable | ||||||||||
| Dependent Variable: Priceone | Entire Sample | Degree | Eigen | PCA | ||||||
| High | Low | Difference | High | Low | Difference | High | Low | Difference | ||
| (1) | (2) | (3) | (2)–(3) | (4) | (5) | (4)–(5) | (6) | (7) | (6)–(7) | |
| Book value per share | 1.631 *** | 1.402 *** | 1.952 *** | −0.55 *** | 1.386 *** | 1.942 *** | −0.556 *** | 1.419 *** | 1.945 *** | −0.526 *** |
| (41.28) | (28.26) | (31.07) | (28.96) | (32.11) | (29.40) | (30.40) | ||||
| Earnings per share | 1.279 *** | 1.879 *** | 0.374 | 1.505 *** | 2.028 *** | 0.345 | 1.683 *** | 1.837 *** | 0.478 * | 1.396 *** |
| (7.86) | (8.60) | (1.56) | (9.56) | (1.48) | (8.64) | (1.95) | ||||
| N | 20,691 | 10,122 | 10,569 | 10,009 | 10,682 | 10,337 | 10,354 | |||
| adj. R-sq | 53.1% | 52.3% | 52.8% | −0.5% | 0.530 | 0.534 | −0.4% | 0.526 | 0.525 | 0.1% |
| Industry Fixed Effect Included | Yes | Yes | Yes | Yes | Yes | Yes | Yes | |||
| Year Fixed Effect Included | Yes | Yes | Yes | Yes | Yes | Yes | Yes | |||
| Controlled Variables Included | Yes | Yes | Yes | Yes | Yes | Yes | Yes | |||
| Panel C. Equity Price at Fiscal Year-End (Priceyear-end) as Dependent Variable | ||||||||||
| Dependent Variable: Priceyear-end | Entire Sample | Degree | Eigen | PCA | ||||||
| High | Low | Difference | High | Low | Difference | High | Low | Difference | ||
| (1) | (2) | (3) | (2)–(3) | (4) | (5) | (4)–(5) | (6) | (7) | (6)–(7) | |
| Book Value per share | 2.397 *** | 1.987 *** | 3.028 *** | −1.041 *** | 1.982 *** | 2.969 *** | −0.987 *** | 2.009 *** | 3.045 *** | −1.036 *** |
| (23.94) | (17.03) | (17.18) | (17.28) | (17.58) | (17.47) | (16.88) | ||||
| Earnings per share | 1.200 *** | 1.914 *** | 0.364 | 1.55 *** | 2.117 *** | 0.257 | 1.86 *** | 1.745 *** | 0.691 | 1.054 *** |
| (3.59) | (4.37) | (0.72) | (5.03) | (0.52) | (4.04) | (1.36) | ||||
| N | 20,691 | 10,122 | 10,569 | 10,009 | 10,682 | 10,337 | 10,354 | |||
| adj. R-sq | 42.7% | 40.3% | 46.4% | −6.1% | 41.2% | 46.3% | −5.1% | 40.5% | 46.3% | −5.8% |
| Industry Fixed Effect Included | Yes | Yes | Yes | Yes | Yes | Yes | Yes | |||
| Year Fixed Effect Included | Yes | Yes | Yes | Yes | Yes | Yes | Yes | |||
| Controlled Variables Included | Yes | Yes | Yes | Yes | Yes | Yes | Yes | |||
Table 5.
Alternative earnings proxies and their adjustments from earnings per share. This table presents the results of the OLS regressions explaining the effect of CEO social capital on the value relevance of book value of equity and alternative earnings proxies and their adjustments from earnings per share. There are two panels in the table: Panel A presents results related to Op earnings per share (operating earnings scaled by number of shares outstanding) and its adjustment: Exclusions per share (difference between net income and operating income scaled by the number of shares outstanding); Panel B presents results related to Cash flow per share (cash flow from operating activities scaled by the number of shares outstanding) and its adjustment: Accruals per share (difference between net income and cash flow from operating activities scaled by number of shares outstanding). In all panels, the dependent variable is Pricethree, a continuous variable measured by the market price of the common equity at the end of three months after fiscal year-end. CEO social capital is measured by Degree in columns (2), (3), (9) and (10), Eigen in columns (4), (5), (11) and (12) and PCA in column (6), (7), (13) and (14). Variables of interest in the regression include Book value per share (book value of common equity scaled by the number of shares outstanding), alternative earnings proxies and their adjustments from earnings per share. All regressions include control variables as defined in Appendix A. For brevity, the table only presents coefficients related to the variables of interest. All regressions include time- and industry-fixed effects and the errors are robust to firm heteroscedasticity. T-values are reported in parentheses. Statistical significance of the coefficients is designated as *** and * at 1% and 10% levels, respectively.
| Panel A. CEO Social Capital, Op Earnings per Share, and Its Adjustments from Earnings per Share | ||||||||||
| Dependent Variable: Pricethree | Entire Sample | Degree | Eigen | PCA | ||||||
| High | Low | Difference | High | Low | Difference | High | Low | Difference | ||
| (1) | (2) | (3) | (2)–(3) | (4) | (5) | (4)–(5) | (6) | (7) | (6)–(7) | |
| Book value per share | 1.415 *** | 1.127 *** | 1.826 *** | −0.699 *** | 1.115 *** | 1.806 *** | −0.691 *** | 1.153 *** | 1.806 *** | −0.653 *** |
| (32.77) | (20.90) | (27.14) | (22.62) | (27.09) | (22.50) | (25.94) | ||||
| Op earnings per share | 2.994 *** | 3.613 *** | 2.096 *** | 1.517 *** | 3.768 *** | 1.975 *** | 1.793 *** | 3.598 *** | 2.105 *** | 1.493 *** |
| (17.68) | (16.41) | (8.11) | (17.46) | (7.89) | (16.85) | (7.90) | ||||
| N | 20,691 | 10,122 | 10,569 | 10,009 | 10,682 | 10,337 | 10,354 | |||
| adj. R-sq | 55.8% | 56.1% | 53.5% | 2.6% | 56.8% | 54.2% | 2.6% | 56.5% | 53.2% | 3.3% |
| Industry Fixed Effect Included | Yes | Yes | Yes | Yes | Yes | Yes | Yes | |||
| Year Fixed Effect Included | Yes | Yes | Yes | Yes | Yes | Yes | Yes | |||
| Controlled Variables Included | Yes | Yes | Yes | Yes | Yes | Yes | Yes | |||
| Panel A (Continued) | ||||||||||
| Dependent Variable: Pricethree | Entire Sample | Degree | Eigen | PCA | ||||||
| High | Low | Difference | High | Low | Difference | High | Low | Difference | ||
| (8) | (9) | (10) | (9)–(10) | (11) | (12) | (11)–(12) | (13) | (14) | (13)–(14) | |
| Book value per share | 1.399 *** | 1.126 *** | 1.761 *** | −0.635 *** | 1.117 *** | 1.736 *** | −0.619 *** | 1.152 *** | 1.738 *** | −0.586 *** |
| (33.58) | (21.23) | (27.68) | (22.79) | (28.03) | (22.77) | (26.59) | ||||
| Op earnings per share | 2.817 *** | 3.602 *** | 1.783 *** | 1.819 *** | 3.809 *** | 1.652 *** | 2.157 *** | 3.586 *** | 1.814 *** | 1.772 *** |
| (14.95) | (14.09) | (6.58) | (15.46) | (6.30) | (14.52) | (6.51) | ||||
| Exclusions per share | −0.612 *** | −0.0304 | −1.553 *** | 1.523 *** | 0.114 | −1.579 *** | 1.693 *** | −0.0319 | −1.524 *** | 1.492 *** |
| (−3.70) | (−0.14) | (−6.02) | (0.55) | (−6.24) | (−0.15) | (−5.69) | ||||
| N | 20,691 | 10,122 | 10,569 | 10,009 | 10,682 | 10,337 | 10,354 | |||
| adj. R-sq | 55.90% | 56.1% | 54.2% | 1.9% | 56.8% | 54.9% | 1.9% | 0.565 | 0.538 | 2.7% |
| Industry Fixed Effect Included | Yes | Yes | Yes | Yes | Yes | Yes | Yes | |||
| Year Fixed Effect Included | Yes | Yes | Yes | Yes | Yes | Yes | Yes | |||
| Controlled Variables Included | Yes | Yes | Yes | Yes | Yes | Yes | Yes | |||
| Panel B. CEO Social Capital, Cash Flow per Share, and Its Adjustments from Earnings per Share | ||||||||||
| Dependent Variable: Pricethree | Entire Sample | Degree | Eigen | PCA | ||||||
| High | Low | Difference | High | Low | Difference | High | Low | Difference | ||
| (1) | (2) | (3) | (2)–(3) | (4) | (5) | (4)–(5) | (6) | (7) | (6)–(7) | |
| Book value per share | 1.353 *** | 1.045 *** | 1.796 *** | −0.751 *** | 1.069 *** | 1.740 *** | −0.671 *** | 1.110 *** | 1.734 *** | −0.624 *** |
| (30.99) | (20.01) | (25.97) | (21.00) | (25.51) | (21.26) | (24.25) | ||||
| Cash flow per share | 2.650 *** | 3.382 *** | 1.562 *** | 1.82 *** | 3.228 *** | 1.859 *** | 1.369 *** | 3.107 *** | 1.915 *** | 1.192 *** |
| (17.46) | (17.26) | (6.99) | (16.21) | (8.45) | (15.88) | (8.19) | ||||
| N | 20,691 | 10,122 | 10,569 | 10,009 | 10,682 | 10,337 | 10,354 | |||
| adj. R-sq | 0.554 | 56.3% | 52.8% | 3.5% | 56.1% | 54.2% | 1.9% | 55.9% | 53.1% | 2.8% |
| Industry Fixed Effect Included | Yes | Yes | Yes | Yes | Yes | Yes | Yes | |||
| Year Fixed Effect Included | Yes | Yes | Yes | Yes | Yes | Yes | Yes | |||
| Controlled Variables Included | Yes | Yes | Yes | Yes | Yes | Yes | Yes | |||
| Panel B (Continued) | ||||||||||
| Dependent Variable: Pricethree | Entire Sample | Degree | Eigen | PCA | ||||||
| High | Low | Difference | High | Low | Difference | High | Low | Difference | ||
| (8) | (9) | (10) | (9)–(10) | (11) | (12) | (11)–(12) | (13) | (14) | (13)–(14) | |
| Book value per share | 1.360 *** | 1.042 *** | 1.793 *** | −0.751 *** | 1.054 *** | 1.721 *** | −0.667 *** | 1.100 *** | 1.721 *** | −0.621 *** |
| (31.17) | (19.64) | (26.93) | (21.00) | (26.94) | (20.85) | (25.57) | ||||
| Cash flow per share | 3.007 *** | 4.086 *** | 1.520 *** | 2.566 *** | 4.204 *** | 1.638 *** | 2.566 *** | 3.947 *** | 1.765 *** | 2.182 *** |
| (15.17) | (16.27) | (5.21) | (17.33) | (5.81) | (15.86) | (5.94) | ||||
| Accruals per share | 0.565 *** | 1.032 *** | −0.0716 | 1.104 *** | 1.367 *** | −0.415 * | 1.782 *** | 1.183 *** | −0.284 | 1.467 *** |
| (3.57) | (5.01) | (−0.30) | (6.72) | (−1.87) | (5.79) | (−1.18) | ||||
| N | 20,691 | 10,122 | 10,569 | 10,009 | 10,682 | 10,337 | 10,354 | |||
| adj. R-sq | 0.556 | 56.7% | 52.8% | 3.9% | 56.9% | 54.3% | 2.6% | 56.5% | 53.1% | 3.4% |
| Industry Fixed Effect Included | Yes | Yes | Yes | Yes | Yes | Yes | Yes | |||
| Year Fixed Effect Included | Yes | Yes | Yes | Yes | Yes | Yes | Yes | |||
| Controlled Variables Included | Yes | Yes | Yes | Yes | Yes | Yes | Yes | |||
Table 6.
CEO social capital and the value relevance of accounting metrics: Second-order effect. This table presents the results of the OLS regressions explaining the effect of CEO social capital on the value relevance of book value of equity and earnings metrics, controlling for earnings quality in Panel A, accounting conservatism in Panel B, investment efficiency in Panel C. In all panels, the dependent variable is Pricethree, a continuous variable measured by the market price of the common equity at the end of three months after fiscal year-end. CEO social capital is measured by Degree in columns (1) to (4), Eigen in columns (5) to (8) and PCA in columns (9) to (12); variables of interest in the regression include Book value per share (book value of common equity scaled by number of shares outstanding) and Earnings per share (net income scaled by number of shares outstanding). All regressions include control variables as defined in Appendix A. For brevity, the table only presents coefficients related to the variables of interest. All regressions include time- and industry-fixed effects and the errors are robust to firm heteroscedasticity. T-values are reported in parentheses. Statistical significance of the coefficients is designated as ***, ** and * at 1%, 5% and 10% levels, respectively.
| Panel A. Conditioning on Earnings Quality | ||||||
| Dependent Variable: Pricethree | High Earnings Quality | Low Earnings Quality | ||||
| High Degree | Low Degree | Difference | High Degree | Low Degree | Difference | |
| (1) | (2) | (1)–(2) | (3) | (4) | (3)–(4) | |
| Book value per share | 1.319 *** | 1.836 *** | −0.517 *** | 1.274 *** | 1.730 *** | −0.456 *** |
| (19.05) | (19.45) | (14.69) | (17.46) | |||
| Earnings per share | 3.524 *** | 2.284 *** | 1.24 *** | 0.876 *** | 0.0868 | 0.789 ** |
| (8.46) | (4.92) | (3.25) | (0.29) | |||
| N | 5379 | 4265 | 3769 | 5309 | ||
| adj. R-sq | 58.3% | 60.7% | −2.4% | 44.5% | 41.9% | 2.6% |
| Industry Fixed Effect Included | Yes | Yes | Yes | Yes | ||
| Year Fixed Effect Included | Yes | Yes | Yes | Yes | ||
| Controlled Variables Included | Yes | Yes | Yes | Yes | ||
| Panel A (Continued) | ||||||
| Dependent Variable: Pricethree | High Earnings Quality | Low Earnings Quality | ||||
| High Eigen | Low Eigen | Difference | High Eigen | Low Eigen | Difference | |
| (5) | (6) | (5)–(6) | (7) | (8) | (7)–(8) | |
| Book value per share | 1.367 *** | 1.724 *** | −0.357 ** | 1.192 *** | 1.768 *** | −0.576 *** |
| (20.20) | (18.36) | (14.63) | (18.73) | |||
| Earnings per share | 3.452 *** | 2.497 *** | 0.955 ** | 1.229 *** | −0.149 | 1.378 *** |
| (8.61) | (5.27) | (4.65) | (−0.52) | |||
| N | 5234 | 4410 | 3874 | 5204 | ||
| adj. R-sq | 58.6% | 60.6% | −2% | 44.2% | 44.9% | −0.7% |
| Industry Fixed Effect Included | Yes | Yes | Yes | Yes | ||
| Year Fixed Effect Included | Yes | Yes | Yes | Yes | ||
| Controlled Variables Included | Yes | Yes | Yes | Yes | ||
| Panel A (Continued) | ||||||
| Dependent Variable: Pricethree | High Earnings Quality | Low Earnings Quality | ||||
| High PCA | Low PCA | Difference | High PCA | Low PCA | Difference | |
| (9) | (10) | (9)–(10) | (11) | (12) | (11)–(12) | |
| Book value per share | 1.348 *** | 1.803 *** | −0.455 *** | 1.298 *** | 1.697 *** | −0.399 *** |
| (20.29) | (18.24) | (15.28) | (17.21) | |||
| Earnings per share | 3.445 *** | 2.436 *** | 1.009 ** | 0.941 *** | 0.0355 | 0.906 ** |
| (8.67) | (4.99) | (3.55) | (0.12) | |||
| N | 5507 | 4137 | 3889 | 5189 | ||
| adj. R-sq | 58.6% | 60.7% | −2.1% | 44.3% | 42.2% | 2.1% |
| Industry Fixed Effect Included | Yes | Yes | Yes | Yes | ||
| Year Fixed Effect Included | Yes | Yes | Yes | Yes | ||
| Controlled Variables Included | Yes | Yes | Yes | Yes | ||
| Panel B. Conditioning on Accounting Conservatism | ||||||
| Dependent Variable: Pricethree | High Accounting Conservatism | Low Accounting Conservatism | ||||
| High Degree | Low Degree | Difference | High Degree | Low Degree | Difference | |
| (1) | (2) | (1)–(2) | (3) | (4) | (3)–(4) | |
| Book value per share | 1.607 *** | 2.232 *** | −0.625 *** | 0.959 *** | 1.533 *** | −0.574 *** |
| (20.26) | (27.34) | (17.97) | (17.44) | |||
| Earnings per share | 3.011 *** | 0.427 | 2.584 *** | 1.028 *** | 0.419 * | 0.609 ** |
| (6.21) | (0.93) | (5.09) | (1.72) | |||
| N | 5106 | 4609 | 4646 | 5650 | ||
| adj. R-sq | 58.5% | 61.3% | −2.8% | 42.3% | 42.4% | −0.1% |
| Industry Fixed Effect Included | Yes | Yes | Yes | Yes | ||
| Year Fixed Effect Included | Yes | Yes | Yes | Yes | ||
| Controlled Variables Included | Yes | Yes | Yes | Yes | ||
| Panel B (Continued) | ||||||
| Dependent Variable: Pricethree | High Accounting Conservatism | Low Accounting Conservatism | ||||
| High Degree | Low Degree | Difference | High Degree | Low Degree | Difference | |
| (5) | (6) | (5)–(6) | (7) | (8) | (7)–(8) | |
| Book value per share | 1.494 *** | 2.231 *** | −0.737 *** | 1.044 *** | 1.410 *** | −0.366 ** |
| (19.06) | (29.99) | (18.52) | (16.34) | |||
| Earnings per share | 3.724 *** | 0.376 | 3.348 *** | 1.003 *** | 0.440 * | 0.563 ** |
| (7.33) | (0.92) | (5.00) | (1.85) | |||
| N | 4914 | 4801 | 4768 | 5528 | ||
| adj. R-sq | 59.9% | 62.3% | −2.4% | 43.3% | 41% | 2.3% |
| Industry Fixed Effect Included | Yes | Yes | Yes | Yes | ||
| Year Fixed Effect Included | Yes | Yes | Yes | Yes | ||
| Controlled Variables Included | Yes | Yes | Yes | Yes | ||
| Panel B (Continued) | ||||||
| Dependent Variable: Pricethree | High Accounting Conservatism | Low Accounting Conservatism | ||||
| High Degree | Low Degree | Difference | High Degree | Low Degree | Difference | |
| (9) | (10) | (9)–(10) | (11) | (12) | (11)–(12) | |
| Book value per share | 1.574 *** | 2.248 *** | −0.674 *** | 1.049 *** | 1.428 *** | −0.379 *** |
| (19.97) | (27.99) | (18.73) | (15.84) | |||
| Earnings per share | 3.262 *** | 0.417 | 2.845 *** | 0.899 *** | 0.581 ** | 0.309 ** |
| (6.71) | (0.92) | (4.45) | (2.36) | |||
| N | 5140 | 4575 | 4837 | 5459 | ||
| adj. R-sq | 59.2% | 61.1% | −1.9% | 42.6% | 41.1% | 1.5% |
| Industry Fixed Effect Included | Yes | Yes | Yes | Yes | ||
| Year Fixed Effect Included | Yes | Yes | Yes | Yes | ||
| Controlled Variables Included | Yes | Yes | Yes | Yes | ||
| Panel C. Conditioning on Investment Efficiency | ||||||
| Dependent Variable: Pricethree | High Investment Efficiency | Low Investment Efficiency | ||||
| High Degree | Low Degree | Difference | High Degree | Low Degree | Difference | |
| (1) | (2) | (1)–(2) | (3) | (4) | (3)–(4) | |
| Book value per share | 1.501 *** | 2.032 *** | −0.531 *** | 1.291 *** | 1.903 *** | −0.612 *** |
| (18.80) | (22.07) | (21.06) | (22.08) | |||
| Earnings per share | 1.440 *** | −0.0146 | 1.455 *** | 2.362 *** | 1.153 *** | 1.209 *** |
| (4.46) | (−0.04) | (8.27) | (3.71) | |||
| N | 4597 | 4961 | 4974 | 5071 | ||
| adj. R-sq | 52.20% | 49.60% | 2.6% | 54.70% | 56.10% | −1.4% |
| Industry Fixed Effect Included | Yes | Yes | Yes | Yes | ||
| Year Fixed Effect Included | Yes | Yes | Yes | Yes | ||
| Controlled Variables Included | Yes | Yes | Yes | Yes | ||
| Panel C (Continued) | ||||||
| Dependent Variable: Pricethree | High Investment Efficiency | Low Investment Efficiency | ||||
| High Degree | Low Degree | Difference | High Degree | Low Degree | Difference | |
| (5) | (6) | (5)–(6) | (7) | (8) | (7)–(8) | |
| Book value per share | 1.467 *** | 1.978 *** | −0.511 *** | 1.306 *** | 1.883 *** | −0.577 *** |
| (19.83) | (22.69) | (20.73) | (22.97) | |||
| Earnings per share | 1.934 *** | −0.315 | 2.249 *** | 2.373 *** | 1.323 *** | 1.05 *** |
| (6.28) | (−0.92) | (8.35) | (4.47) | |||
| N | 4504 | 5054 | 4945 | 5100 | ||
| adj. R-sq | 53.40% | 50.10% | 3.3% | 54.20% | 58.50% | −4.3% |
| Industry Fixed Effect Included | Yes | Yes | Yes | Yes | ||
| Year Fixed Effect Included | Yes | Yes | Yes | Yes | ||
| Controlled Variables Included | Yes | Yes | Yes | Yes | ||
| Panel C (Continued) | ||||||
| Dependent Variable: Pricethree | High Investment Efficiency | Low Investment Efficiency | ||||
| High Degree | Low Degree | Difference | High Degree | Low Degree | Difference | |
| (9) | (10) | (9)–(10) | (11) | (12) | (11)–(12) | |
| Book value per share | 1.520 *** | 2.003 *** | −0.483 *** | 1.319 *** | 1.887 *** | −0.568 *** |
| (19.81) | (21.68) | (21.35) | (21.70) | |||
| Earnings per share | 1.578 *** | −0.117 | 1.695 *** | 2.309 *** | 1.356 *** | 0.953 *** |
| (5.02) | (−0.32) | (8.23) | (4.33) | |||
| N | 4677 | 4881 | 5087 | 4958 | ||
| adj. R-sq | 52.90% | 48.70% | 4.2% | 54.50% | 57% | −2.5% |
| Industry Fixed Effect Included | Yes | Yes | Yes | Yes | ||
| Year Fixed Effect Included | Yes | Yes | Yes | Yes | ||
| Controlled Variables Included | Yes | Yes | Yes | Yes | ||
Table 7.
CEO social capital and the value relevance of accounting metrics: controlling for managerial ability. This table presents the results of the OLS regressions explaining the effect of CEO social capital on the value relevance of book value of equity and earnings metrics, controlling for managerial ability. The dependent variable is Pricethree, a continuous variable measured by the market price of the common equity at the end of three months after fiscal year-end. CEO social capital is measured by Degree in columns (1) and (2), Eigen in columns (3) and (4) and PCA in columns (5) and (6); managerial ability is measured by MA_SCORE, as suggested by Demerjian et al. (2012). Variables of interest in the regression include Book value per share (book value of common equity scaled by number of shares outstanding) and Earnings per share (net income scaled by number of shares outstanding). All regressions include control variables as defined in Appendix A. For brevity, the table only presents coefficients related to the variables of interest. All regressions include time- and industry-fixed effects and the errors are robust to firm heteroscedasticity. T-values are reported in parentheses. Statistical significance of the coefficients is designated as *** and ** at 1% and 5% levels, respectively.
| Dependent Variable: Pricethree | Degree | Eigen | PCA | ||||||
|---|---|---|---|---|---|---|---|---|---|
| High | Low | Difference | High | Low | Difference | High | Low | Difference | |
| (1) | (2) | (1)–(2) | (3) | (4) | (3)–(4) | (5) | (6) | (5)–(6) | |
| Book value per share | 1.354 *** | 1.777 *** | −0.423 *** | 1.336 *** | 1.761 *** | −0.425 *** | 1.358 *** | 1.766 *** | −0.408 *** |
| (25.87) | (28.91) | (27.17) | (28.78) | (27.63) | (27.36) | ||||
| Earnings per share | 2.012 *** | 1.386 *** | 0.626 ** | 2.258 *** | 1.216 *** | 1.042 *** | 2.125 *** | 1.326 *** | 0.799 *** |
| (8.62) | (6.41) | (10.04) | (5.68) | (9.40) | (5.94) | ||||
| MA_SCORE | 10.74 *** | 5.050 *** | 8.862 *** | 7.349 *** | 9.651 *** | 6.427 *** | |||
| (12.35) | (6.66) | (10.34) | (9.24) | (11.51) | (7.91) | ||||
| N | 9308 | 9681 | 9190 | 9799 | 9490 | 9499 | |||
| adj. R-sq | 53.2% | 53% | 0.2% | 53.8% | 53.7% | 0.1% | 53.8% | 52.5% | 1.3% |
| Industry Fixed Effect Included | Yes | Yes | Yes | Yes | Yes | Yes | |||
| Year Fixed Effect Included | Yes | Yes | Yes | Yes | Yes | Yes | |||
| Controlled Variables Included | Yes | Yes | Yes | Yes | Yes | Yes | |||
Table 8.
Instrumented CEO social capital and the value relevance of accounting metrics. This table presents the second-stage results explaining the effect of instrumented CEO social capital on the value relevance of book value of equity and earnings metrics, using the instrumental variable method. The dependent variable is Pricethree, a continuous variable measured by the market price of the common equity at the end of three months after fiscal year-end. Instrumented CEO social capital is measured by Instrumented Degree in columns (1) and (2), Instrumented Eigen in columns (3) and (4) and Instrumented PCA in columns (5) and (6). Variables of interest in the regression include Book value per share (book value of common equity per share) and Earnings per share (net income per share). All regressions include control variables as defined in Appendix A. For brevity, the table only presents coefficients related to the variables of interest. All regressions include time- and industry-fixed effects and the errors are robust to firm heteroscedasticity. T-values are reported in parentheses. Statistical significance of the coefficients is designated as *** at 1% levels.
| Dependent Variable: Pricethree | Instrumented Degree | Instrumented Eigen | Instrumented PCA | ||||||
|---|---|---|---|---|---|---|---|---|---|
| High | Low | Difference | High | Low | Difference | High | Low | Difference | |
| (1) | (2) | (1)–(2) | (3) | (4) | (3)–(4) | (5) | (6) | (5)–(6) | |
| Book value per share | 1.346 *** | 1.945 *** | −0.599 *** | 1.392 *** | 1.889 *** | −0.497 *** | 1.374 *** | 1.920 *** | −0.546 *** |
| (29.15) | (29.75) | (29.95) | (28.75) | (29.40) | (29.40) | ||||
| Earnings per share | 2.240 *** | 0.242 | 1.998 *** | 2.166 *** | 0.267 | 1.899 *** | 2.159 *** | 0.291 | 1.868 *** |
| (10.72) | (1.04) | (10.31) | (1.14) | (10.25) | (1.24) | ||||
| N | 10,345 | 10,346 | 10,345 | 10,346 | 10,345 | 10,346 | |||
| adj. R-sq | 50.9% | 51.8% | −0.9% | 0.515 | 0.504 | 1.1% | 0.511 | 0.511 | 0% |
| Industry Fixed Effect Included | Yes | Yes | Yes | Yes | Yes | Yes | |||
| Year Fixed Effect Included | Yes | Yes | Yes | Yes | Yes | Yes | |||
| Controlled Variables Included | Yes | Yes | Yes | Yes | Yes | Yes | |||
Table 9.
CEO social capital and the value relevance of accounting metrics in high-tech related industries. This table presents the results of OLS regressions explaining the effect of CEO social capital on the value relevance of book value of equity and earnings metrics in high-tech-related industries. The high-tech-related industries are defined by groups with a high market-to-book equity ratio each year in Panel A, with high research and development expenditures each year in Panel B and within SIC codes defined by Francis and Schipper (1999) as high-tech-related industries. In all panels, the dependent variable is Pricethree, a continuous variable measured by the market price of the common equity at the end of three months after fiscal year-end. CEO social capital is measured by Degree in columns (1) to (4), Eigen in columns (5) to (8) and PCA in columns (9) to (12). Variables of interest in the regression include Book value per share (book value of common equity scaled by number of shares outstanding) and Earnings per share (net income scaled by number of shares outstanding). All regressions include control variables as defined in Appendix A. For brevity, the table only presents coefficients related to the variables of interest. All regressions include time- and industry-fixed effects and the errors are robust to firm heteroscedasticity. T-values are reported in parentheses. Statistical significance of the coefficients is designated as ***, ** and * at 1%, 5% and 10% levels, respectively.
| Panel A. High-Tech Defined by Market-to-Book Equity Ratio | ||||||
| Dependent Variable: Pricethree | High Market-to-Book Equity Ratio | Low Market-to-Book Equity Ratio | ||||
| High Degree | Low Degree | Difference | High Degree | Low Degree | Difference | |
| (1) | (2) | (1)–(2) | (3) | (4) | (3)–(4) | |
| Book value per share | 2.567 *** | 3.111 *** | −0.544 *** | 1.324 *** | 1.220 *** | 0.104 |
| (33.96) | (45.49) | (22.19) | (18.84) | |||
| Earnings per share | 2.239 *** | 0.321 | 1.918 *** | 0.589 ** | 0.556 *** | 0.033 |
| (6.98) | (0.98) | (2.43) | (2.82) | |||
| N | 5297 | 5044 | 4582 | 5768 | ||
| adj. R-sq | 70.2% | 68.5% | 1.7% | 60.1% | 57.8% | 2.3% |
| Industry Fixed Effect Included | Yes | Yes | Yes | Yes | ||
| Year Fixed Effect Included | Yes | Yes | Yes | Yes | ||
| Controlled Variables Included | Yes | Yes | Yes | Yes | ||
| Panel A (Continued) | ||||||
| Dependent Variable: Pricethree | High Market-to-Book Equity Ratio | Low Market-to-Book Equity Ratio | ||||
| High Eigen | Low Eigen | Difference | High Eigen | Low Eigen | Difference | |
| (5) | (6) | (5)–(6) | (7) | (8) | (7)–(8) | |
| Book value per share | 2.643 *** | 2.981 *** | −0.338 *** | 1.254 *** | 1.278 *** | −0.024 |
| (34.33) | (47.65) | (23.07) | (19.21) | |||
| Earnings per share | 2.196 *** | 0.450 | 2.646 *** | 0.846 *** | 0.290 | 0.556 * |
| (6.53) | (1.49) | (3.67) | (1.38) | |||
| N | 5181 | 5160 | 4722 | 5628 | ||
| adj. R-sq | 69.4% | 69.1% | 0.3% | 60.9% | 58.4% | 2.5% |
| Industry Fixed Effect Included | Yes | Yes | Yes | Yes | ||
| Year Fixed Effect Included | Yes | Yes | Yes | Yes | ||
| Controlled Variables Included | Yes | Yes | Yes | Yes | ||
| Panel A (Continued) | ||||||
| Dependent Variable: Pricethree | High Earnings Quality | Low Earnings Quality | ||||
| High PCA | Low PCA | Difference | High PCA | Low PCA | Difference | |
| (9) | (10) | (9)–(10) | (11) | (12) | (11)–(12) | |
| Book value per share | 2.599 *** | 3.070 *** | −0.471 *** | 1.292 *** | 1.242 *** | 0.05 |
| (34.75) | (45.75) | (22.87) | (18.64) | |||
| Earnings per share | 2.229 *** | 0.386 | 1.843 *** | 0.760 *** | 0.376 * | 0.384 |
| (6.83) | (1.22) | (3.18) | (1.91) | |||
| N | 5355 | 4986 | 4695 | 5655 | ||
| adj. R-sq | 70.1% | 68.2% | 1.9% | 60.7% | 57.6% | 3.1% |
| Industry Fixed Effect Included | Yes | Yes | Yes | Yes | ||
| Year Fixed Effect Included | Yes | Yes | Yes | Yes | ||
| Controlled Variables Included | Yes | Yes | Yes | Yes | ||
| Panel B. High-Tech Defined by High R&D Expenditures | ||||||
| Dependent Variable: Pricethree | High R&D Expenditures | Low R&D Expenditures | ||||
| High Degree | Low Degree | Difference | High Degree | Low Degree | Difference | |
| (1) | (2) | (1)–(2) | (3) | (4) | (3)–(4) | |
| Book value per share | 1.641 *** | 2.154 *** | −0.513 *** | 1.316 *** | 1.503 *** | 0.187 |
| (22.86) | (23.14) | (19.25) | (20.36) | |||
| Earnings per share | 1.896 *** | −0.420 | 2.316 *** | 1.979 *** | 2.354 *** | −0.375 |
| (6.80) | (−1.28) | (6.09) | (8.48) | |||
| N | 5327 | 5009 | 4552 | 5803 | ||
| adj. R-sq | 60.1% | 52.4% | 7.7% | 50.6% | 54.8% | −4.2% |
| Industry Fixed Effect Included | Yes | Yes | Yes | Yes | ||
| Year Fixed Effect Included | Yes | Yes | Yes | Yes | ||
| Controlled Variables Included | Yes | Yes | Yes | Yes | ||
| Panel B (Continued) | ||||||
| Dependent Variable: Pricethree | High R&D Expenditures | Low R&D Expenditures | ||||
| High Eigen | Low Eigen | Difference | High Eigen | Low Eigen | Difference | |
| (5) | (6) | (5)–(6) | (7) | (8) | (7)–(8) | |
| Book value per share | 1.596 *** | 2.179 *** | −0.583 *** | 1.340 *** | 1.461 *** | −0.121 |
| (24.98) | (24.24) | (20.10) | (19.84) | |||
| Earnings per share | 2.094 *** | −0.257 | 2.351 *** | 2.028 *** | 2.371 *** | −0.293 |
| (7.50) | (−0.86) | (6.59) | (8.01) | |||
| N | 5251 | 5085 | 4652 | 5703 | ||
| adj. R-sq | 59.5% | 53.4% | 6.1% | 50.9% | 55.2% | −4.3% |
| Industry Fixed Effect Included | Yes | Yes | Yes | Yes | ||
| Year Fixed Effect Included | Yes | Yes | Yes | Yes | ||
| Controlled Variables Included | Yes | Yes | Yes | Yes | ||
| Panel B (Continued) | ||||||
| Dependent Variable: Pricethree | High R&D Expenditures | Low R&D Expenditures | ||||
| High PCA | Low PCA | Difference | High PCA | Low PCA | Difference | |
| (9) | (10) | (9)–(10) | (11) | (12) | (11)–(12) | |
| Book value per share | 1.621 *** | 2.164 *** | −0.543 *** | 1.340 *** | 1.482 *** | −0.142 |
| (23.61) | (22.93) | (20.07) | (19.66) | |||
| Earnings per share | 2.038 *** | −0.444 | 2.482 *** | 2.067 *** | 2.289 *** | −0.222 |
| (7.16) | (−1.43) | (6.58) | (8.02) | |||
| N | 5377 | 4959 | 4673 | 5682 | ||
| adj. R-sq | 0.599 | 0.523 | 1.9% | 0.515 | 0.540 | −3.1% |
| Industry Fixed Effect Included | Yes | Yes | Yes | Yes | ||
| Year Fixed Effect Included | Yes | Yes | Yes | Yes | ||
| Controlled Variables Included | Yes | Yes | Yes | Yes | ||
| Part C. High-Tech within Sic Codes Defined by Francis and Schipper (1999) | ||||||
| Dependent Variable: Pricethree | High Tech | Low Tech | ||||
| High Degree | Low Degree | Difference | High Degree | Low Degree | Difference | |
| (1) | (2) | (1)–(2) | (3) | (4) | (3)–(4) | |
| Book value per share | 1.684 *** | 2.126 *** | −0.442 *** | 1.543 *** | 1.218 *** | 0.325 *** |
| (16.13) | (15.81) | (6.16) | (10.19) | |||
| Earnings per share | 0.805 ** | −0.996 ** | 1.801 *** | −0.429 | 3.447 *** | −3.876 *** |
| (2.09) | (−2.39) | (−0.46) | (4.18) | |||
| N | 3151 | 3395 | 652 | 748 | ||
| adj. R-sq | 50% | 48.2% | 1.8% | 47.5% | 69% | −21.5% |
| Industry Fixed Effect Included | Yes | Yes | Yes | Yes | ||
| Year Fixed Effect Included | Yes | Yes | Yes | Yes | ||
| Controlled Variables Included | Yes | Yes | Yes | Yes | ||
| Panel C (Continued) | ||||||
| Dependent Variable: Pricethree | High Tech | Low Tech | ||||
| High Eigen | Low Eigen | Difference | High Eigen | Low Eigen | Difference | |
| (5) | (6) | (5)–(6) | (7) | (8) | (7)–(8) | |
| Book value per share | 1.699 *** | 2.087 *** | −0.388 *** | 1.652 *** | 1.192 *** | 0.46 *** |
| (16.14) | (17.00) | (6.56) | (9.67) | |||
| Earnings per share | 0.878 ** | −1.144 *** | 2.022 *** | −0.127 | 2.570 *** | −2.697 *** |
| (2.19) | (−3.03) | (−0.13) | (3.22) | |||
| N | 3143 | 3403 | 648 | 752 | ||
| adj. R-sq | 49% | 49.7% | −0.7% | 48.1% | 65.3% | −17.2% |
| Industry Fixed Effect Included | Yes | Yes | Yes | Yes | ||
| Year Fixed Effect Included | Yes | Yes | Yes | Yes | ||
| Controlled Variables Included | Yes | Yes | Yes | Yes | ||
| Panel C (Continued) | ||||||
| Dependent Variable: Pricethree | High Tech | Low Tech | ||||
| High PCA | Low PCA | Difference | High PCA | Low PCA | Difference | |
| (9) | (10) | (9)–(10) | (11) | (12) | (11)–(12) | |
| Book value per share | 1.706 *** | 2.071 *** | −0.365 *** | 1.533 *** | 1.214 *** | 0.316 *** |
| (16.48) | (16.24) | (6.42) | (10.63) | |||
| Earnings per share | 0.896 ** | −1.181 *** | 2.077 *** | 0.187 | 2.711 *** | −2.524 *** |
| (2.24) | (−3.04) | (0.20) | (4.67) | |||
| N | 3183 | 3363 | 654 | 746 | ||
| adj. R-sq | 49% | 49% | 0% | 45% | 69.1% | −24.1% |
| Industry Fixed Effect Included | Yes | Yes | Yes | Yes | ||
| Year Fixed Effect Included | Yes | Yes | Yes | Yes | ||
| Controlled Variables Included | Yes | Yes | Yes | Yes | ||
Table 10.
Additional Analysis: Information Channel vs. Reputation Channel. This table presents the results of OLS regressions explaining the effect of CEO social capital on the value relevance of book value of equity and earnings metrics based on information and reputation channels. There are four panels in the table: Panel A presents the results for the entire sample; Panels B, C and D present the results for the high-tech group with high market-to-book equity ratio each year, with high research and development expenditures each year and within SIC codes defined by Francis and Schipper (1999) as high-tech related industries, respectively. In all panels, the dependent variable is Pricethree, a continuous variable measured by the market price of the common equity at the end of three months after fiscal year-end. CEO social capital is measured by Information Channel in columns (1) and (2) and Reputation Channel in columns (3) to (4). Variables of interest in the regression include Book value per share (book value of common equity scaled by number of shares outstanding) and Earnings per share (net income scaled by number of shares outstanding). All regressions include control variables as defined in Appendix A. For brevity, the table only presents coefficients related to the variables of interest. All regressions include time- and industry-fixed effects and the errors are robust to firm heteroscedasticity. T-values are reported in parentheses. Statistical significance of the coefficients is designated as ***, ** and * at 1%, 5% and 10% levels, respectively.
| Panel A. Entire Sample | ||||||
| Dependent Variable: Pricethree | Information Channel | Reputation Channel | ||||
| High | Low | Difference | High | Low | Difference | |
| (1) | (2) | (1)–(2) | (3) | (4) | (3)–(4) | |
| Book value per share | 1.481 *** | 1.737 *** | −0.256 *** | 1.476 *** | 1.750 *** | −0.274 *** |
| (28.71) | (29.39) | (28.29) | (30.50) | |||
| Earnings per share | 1.734 *** | 1.213 *** | 0.521 * | 1.872 *** | 0.967 *** | 0.905 *** |
| (7.82) | (5.33) | (8.59) | (4.20) | |||
| N | 10,263 | 10,274 | 10,231 | 10,306 | ||
| adj. R-sq | 53.7% | 51.3% | 2.4% | 52.7% | 54% | −1.3% |
| Industry Fixed Effect Included | Yes | Yes | Yes | Yes | ||
| Year Fixed Effect Included | Yes | Yes | Yes | Yes | ||
| Controlled Variables Included | Yes | Yes | Yes | Yes | ||
| Panel B. High-Tech Group with High Market-to-Book Equity Ratio | ||||||
| Dependent Variable: Pricethree | Information Channel | Reputation Channel | ||||
| High | Low | Difference | High | Low | Difference | |
| (1) | (2) | (1)–(2) | (3) | (4) | (3)–(4) | |
| Book value per share | 2.730 *** | 2.924 *** | −0.194 * | 2.709 *** | 2.943 *** | −0.234 ** |
| (33.49) | (42.39) | (33.73) | (45.67) | |||
| Earnings per share | 1.772 *** | 0.850 *** | 0.922 ** | 1.973 *** | 0.513 * | 1.46 *** |
| (5.30) | (2.60) | (5.53) | (1.75) | |||
| N | 5257 | 5000 | 5363 | 4894 | ||
| adj. R-sq | 69.5% | 68.1% | 1.4% | 68.9% | 69.6% | −0.7% |
| Industry Fixed Effect Included | Yes | Yes | Yes | Yes | ||
| Year Fixed Effect Included | Yes | Yes | Yes | Yes | ||
| Controlled Variables Included | Yes | Yes | Yes | Yes | ||
| Panel C. High-Tech Group with High R&D Expenditures | ||||||
| Dependent Variable: Pricethree | Information Channel | Reputation Channel | ||||
| High | Low | Difference | High | Low | Difference | |
| (1) | (2) | (1)–(2) | (3) | (4) | (3)–(4) | |
| Book value per share | 1.747 *** | 1.971 *** | −0.224 ** | 1.705 *** | 2.090 *** | −0.385 *** |
| (22.86) | (22.05) | (22.38) | (26.03) | |||
| Earnings per share | 1.638 *** | 0.0389 | 1.599 *** | 1.364 *** | 0.0943 | 1.270 *** |
| (5.28) | (0.13) | (4.66) | (0.31) | |||
| N | 5334 | 4926 | 5130 | 5130 | ||
| adj. R-sq | 58.7% | 51.8% | 6.9% | 55.6% | 57.3% | −1.7% |
| Industry Fixed Effect Included | Yes | Yes | Yes | Yes | ||
| Year Fixed Effect Included | Yes | Yes | Yes | Yes | ||
| Controlled Variables Included | Yes | Yes | Yes | Yes | ||
| Panel D. High-Tech Group within Sic Codes Defined by Francis and Schipper (1999) | ||||||
| Dependent Variable: Pricethree | Information Channel | Reputation Channel | ||||
| High | Low | Difference | High | Low | Difference | |
| (1) | (2) | (1)–(2) | (3) | (4) | (3)–(4) | |
| Book value per share | 1.971 *** | 1.831 *** | 0.14 | 1.860 *** | 2.011 *** | −0.151 |
| (16.46) | (15.65) | (16.13) | (16.78) | |||
| Earnings per share | 0.382 | −0.820 ** | 1.202 ** | 0.336 | −0.736 ** | 1.072 ** |
| (0.92) | (−2.10) | (0.80) | (−2.01) | |||
| N | 3091 | 3417 | 3397 | 3111 | ||
| adj. R-sq | 52.6% | 44.5% | 8.1% | 46.8% | 51.2% | −4.4% |
| Industry Fixed Effect Included | Yes | Yes | Yes | Yes | ||
| Year Fixed Effect Included | Yes | Yes | Yes | Yes | ||
| Controlled Variables Included | Yes | Yes | Yes | Yes | ||
Disclaimer/Publisher’s Note: The statements, opinions and data contained in all publications are solely those of the individual author(s) and contributor(s) and not of MDPI and/or the editor(s). MDPI and/or the editor(s) disclaim responsibility for any injury to people or property resulting from any ideas, methods, instructions or products referred to in the content. |
© 2023 by the authors. Licensee MDPI, Basel, Switzerland. This article is an open access article distributed under the terms and conditions of the Creative Commons Attribution (CC BY) license (https://creativecommons.org/licenses/by/4.0/).
Share and Cite
MDPI and ACS Style
Luehlfing, M.S.; McCumber, W.R.; Qiu, H. CEO Social Capital and the Value Relevance of Accounting Metrics. Risks 2023, 11, 78. https://doi.org/10.3390/risks11040078
AMA Style
Luehlfing MS, McCumber WR, Qiu H. CEO Social Capital and the Value Relevance of Accounting Metrics. Risks. 2023; 11(4):78. https://doi.org/10.3390/risks11040078
Chicago/Turabian StyleLuehlfing, Michael S., William R. McCumber, and Huan Qiu. 2023. "CEO Social Capital and the Value Relevance of Accounting Metrics" Risks 11, no. 4: 78. https://doi.org/10.3390/risks11040078
Note that from the first issue of 2016, this journal uses article numbers instead of page numbers. See further details here.