On Market Share Drivers in the Swiss Mandatory Health Insurance Sector


1
Department of Actuarial Science, Faculty of Business and Economics, University of Lausanne, 1015 Lausanne, Switzerland
2
Swiss Finance Institute, 1015 Lausanne, Switzerland
*
Author to whom correspondence should be addressed.
Risks 2019, 7(4), 114; https://doi.org/10.3390/risks7040114
Submission received: 9 October 2019
/
Revised: 28 October 2019
/
Accepted: 31 October 2019
/
Published: 7 November 2019
Abstract
:In the mandatory health insurance market in Switzerland, a range of insurers offer policies that differ in characteristics like premium and service level while benefits are the same and regulated by law. In this paper, we give an overview of the market and analyse the relationship between insurers’ characteristics and the evolution of their market shares. Indeed, in view of substantial differences between the players, the risk that policyholders change their provider is important. We develop a linear model with two-sided lognormally distributed errors and use publicly available data on the Swiss mandatory health insurance market for the years from 2002 to 2015. Thereby we identify and quantify the main drivers for the policyholders’ switching behavior that reflect in changes in market shares. The results suggest that market share changes are particularly linked to the difference between an insurer’s premium and the overall market premium. In addition, the difference to the previous year’s premium also has an impact on the market share while the service level as well as the group affiliation of a provider turn out not be significant in explaining annual market share changes.
1. Introduction
Health insurance systems around the world face major challenges including increasing expenditures and a growing number of elderly leading to a growth of premiums that lies above GDP’s growth. According to the OECD Health Statistics Groninger and Lacher (2017), the average expenditure for health-related services in 2016 was of the GDP in OECD countries. In Switzerland it increased from in 1999 to in 2016 and in the US it amounted to in 2016. While the GDP in Switzerland only grew by and the population by from 1990 to 2014, overall healthcare costs grew by in the same period.
In this paper, we are interested in better understanding the development of health insurers’ size and to link this evolution to the pricing decisions in the mandatory health insurance market in Switzerland. We formulate a model for the impact of the premium decisions on the individual insurer’s market share and test it on publicly available data. In fact, insurers operate in a competitive and highly regulated market that has gone through a process of consolidation and a major reduction of the number of players over the last years. Decreasing lapse risk from existing customers and attracting the better risks are strategic concerns. There are numerous studies in different countries regarding the influence of price changes, service level, number of available insurance plans, the health situation and the age of the insureds on the health plan consumer’s choice. Schut et al. (2003) compare the switching behaviour of insureds in Germany and in the Netherlands. They show that in Germany, insureds react more sensitively to an increase of premium than in the Netherlands. They also find that older policyholders are less sensitive to increasing premiums than younger ones. Christiansen et al. (2016) analyse the policyholders’ switching behaviour in the German private health insurance market. Their findings show that a premium change and its adjustment frequency relate to the switching behaviour of customers between insurers. Schmitz and Ziebarth (2017) use field data to test the effect of price framing on the switching rates in the German health insurance market. They find that presenting differences between the insurer’s premium and a federal reference premium in absolute Euro values instead of percentage points of the gross salary, results in increasing switching rates. In the Dutch health insurance market, Boonen et al. (2015) test the effect of premium and quality rating of the insurer on the switching decision of the insureds. Other studies such as Strombom et al. (2002) and Goldman et al. (2004) also investigate the effect of the price on the insureds’ health insurance choice. Schmeiser (2014) study the perception of risk factors and gender-related price differences in several European countries and insurance products including Switzerland and health insurance. A game-theoretic approach to model pricing decisions and lapse rates of policyholders as a function of the different players’ premium decisions is suggested by Dutang et al. (2013), see also Albrecher (2016) and Albrecher and Daily-Amir (2017) for including asymmetric information in the analysis.
Studies on decision making find that more options to choose from is linked with inertia. Decision makers tend to avoid taking a decision and stay with the current choice (see e.g., Samuelson and Zeckhauser (1988)). Eling and Kiesenbauer (2011) and Hellier et al. (2003) suggest the number of different insurance models and the rate of complementary insurance holders as explanatory variables to the switching behaviour of the insureds. Frank and Lamiraud (2009) discover that the large number of plans, offered by a large number of players in the Swiss health insurance market, contributes to the relatively low switching rate and large premium differences. They find evidence that policyholders who stay with the same health plan provider for longer periods are less likely to switch plans, representing a certain degree of inertia. In another study on German health insurance, Wuppermann et al. (2014) test the effect of the number of available health insurance plans and their respective premium differences on the premium sensitivity of the insureds. They also find that insureds are less likely to switch to a lower priced plan when they have more plans to choose from.
In terms of linking customer satisfaction and loyalty to their service provider, conclusions are unclear. For example, Abraham et al. (2016) report that they did not find a connection between health plan satisfaction and switching behaviour, for which high switching costs are suggested as a possible reason. In the studies by Staudt and Wagner (2018) and Mau et al. (2018), the authors analyse customer loyalty, the development of relationships and purchase in the non-life insurance market in Switzerland. They link purchase behaviour to the services and channels used. Among other factors to explain switching behaviour, Browne and Hofmann (2013) find evidence that low-risk policyholders are more likely to change health plans. In the Spanish health insurance market, Pinquet et al. (2011) find evidence that insufficient information about the available insurance plans causes the insureds to lapse.
In our research we aim to study the influence of premiums, group affiliation and service level on the switching behavior of policyholders in Swiss health insurance. Since cross-company records about individuals switching their insurer are not available, we consider the market share as response variable. We use data covering a period of 14 years, from 2002 to 2015, containing portfolio size, premiums and service level for each insurer in each of the 26 Swiss cantons. Applying linear regression models, the results suggest that the relative difference between insurer’s premium and market premium represent a significant factor to explain changes in market share. The difference between the relative annual change in the premium and the relative annual change in the market premium is another significant factor while our study does not indicate a significant impact on market share changes from service level and group affiliation. We also establish that those sensitivities vary considerably among cantons. We find that residuals in the regression are rather two-sided lognormally distributed than normally distributed, and develop a corresponding statistical procedure for this case, which may be of interest in its own right.
The rest of the paper is organised as follows: Section 2 provides an overview of the Swiss Health insurance market, Section 3 then describes the research questions and the available dataset, discusses limitations and states the model assumptions. Section 4 contains the results and Section 5 concludes. Details on the methodology for our linear model with lognormal residuals are given in the Appendix A.
2. The Swiss Health Insurance Market
Buying a basic health insurance policy is compulsory for all Swiss residents since 1996 with the introduction of the Swiss Federal law on health insurance (see Swiss Confederation (1994)). The law intended to deal with the increasing costs in the health sector while ensuring a high quality health system, promoting freedom of choice and solidarity. It determines a mandatory health insurance for all Swiss residents (Swiss Health Insurance Ordinance 832.102. (1995)) as a basic homogeneous cover with defined benefits (Swiss Health Insurance Benefits Ordinance 832.112. (1995)), imposes reserve levels to ensure the financial stability of the insurers, forces the acceptance of every person as a client without screening and ensures the flexibility to change the insurance plan without switching costs (Theurl (1999)). In terms of organization, although highly regulated, these social insurance plans are offered by private insurance companies. The law sets limits on premium discounts between plans (e.g., for deductibles chosen by policyholders) and forces the insurers to set premiums for each level of deductible in a way that the cover of the insurance expenses does not result in a planned profit. The government employs a risk adjustment scheme and transfers capital between insurers in order to balance the financial situation across insurers. In that way, insurers facing higher medical expenses due to their portfolio composition receive capital from insurers with a less risky pool of policyholders.
The governance of the health care system is done on a federal level by both the Swiss Federal Office of Public Health (SFOH) and the Federal Department of Home Affairs (FDHA), and on a cantonal level by the cantonal Departments of Public Health. The SFOH defines the mandatory health insurance benefit basket, regulates the insurers and approves their premiums annually. The FDHA defines up to three regions within a single canton for the premiums and sets the maximum differences between them (Ordinance of the Federal Department of Home Affairs on Premium Regions 832.106 (2015)). The cantons supervise the hospitals and finance part of their expenses. They also define premium reduction levels for households with lower incomes.
The 26 Swiss cantons differ considerably in terms of economic, political and demographic characteristics. Table 1 summarises some characteristics for the most populated cantons in each linguistic region with Zurich (ZH), Bern (BE) and Aargau (AG) from the German speaking region, Vaud (VD) and Geneva (GE) from the French speaking region and Ticino (TI) as the Italian speaking region as well as for the overall country (CH). For example, in 2016, the rate of population living in urban areas was 100% in Geneva and only 74.6% in Bern. The number of physicians in private practice per 100,000 people was more than twice as large in Geneva than in Bern. Differences like these lead to variations among the cantons in the market structure, premium levels, competition and switching rates.
An overview of the Swiss health insurance market is published every year by the SFOH and key financial figures for the years 1998 to 2015 are reported in Table A1 in the Appendix A. One can observe the reduction of the number of insurers, the large growth in premiums and expenditures and the operating results alternating through years with positive and negative results. In the following subsections we present the development since the introduction of the Federal health insurance law.
2.1. Market Structure
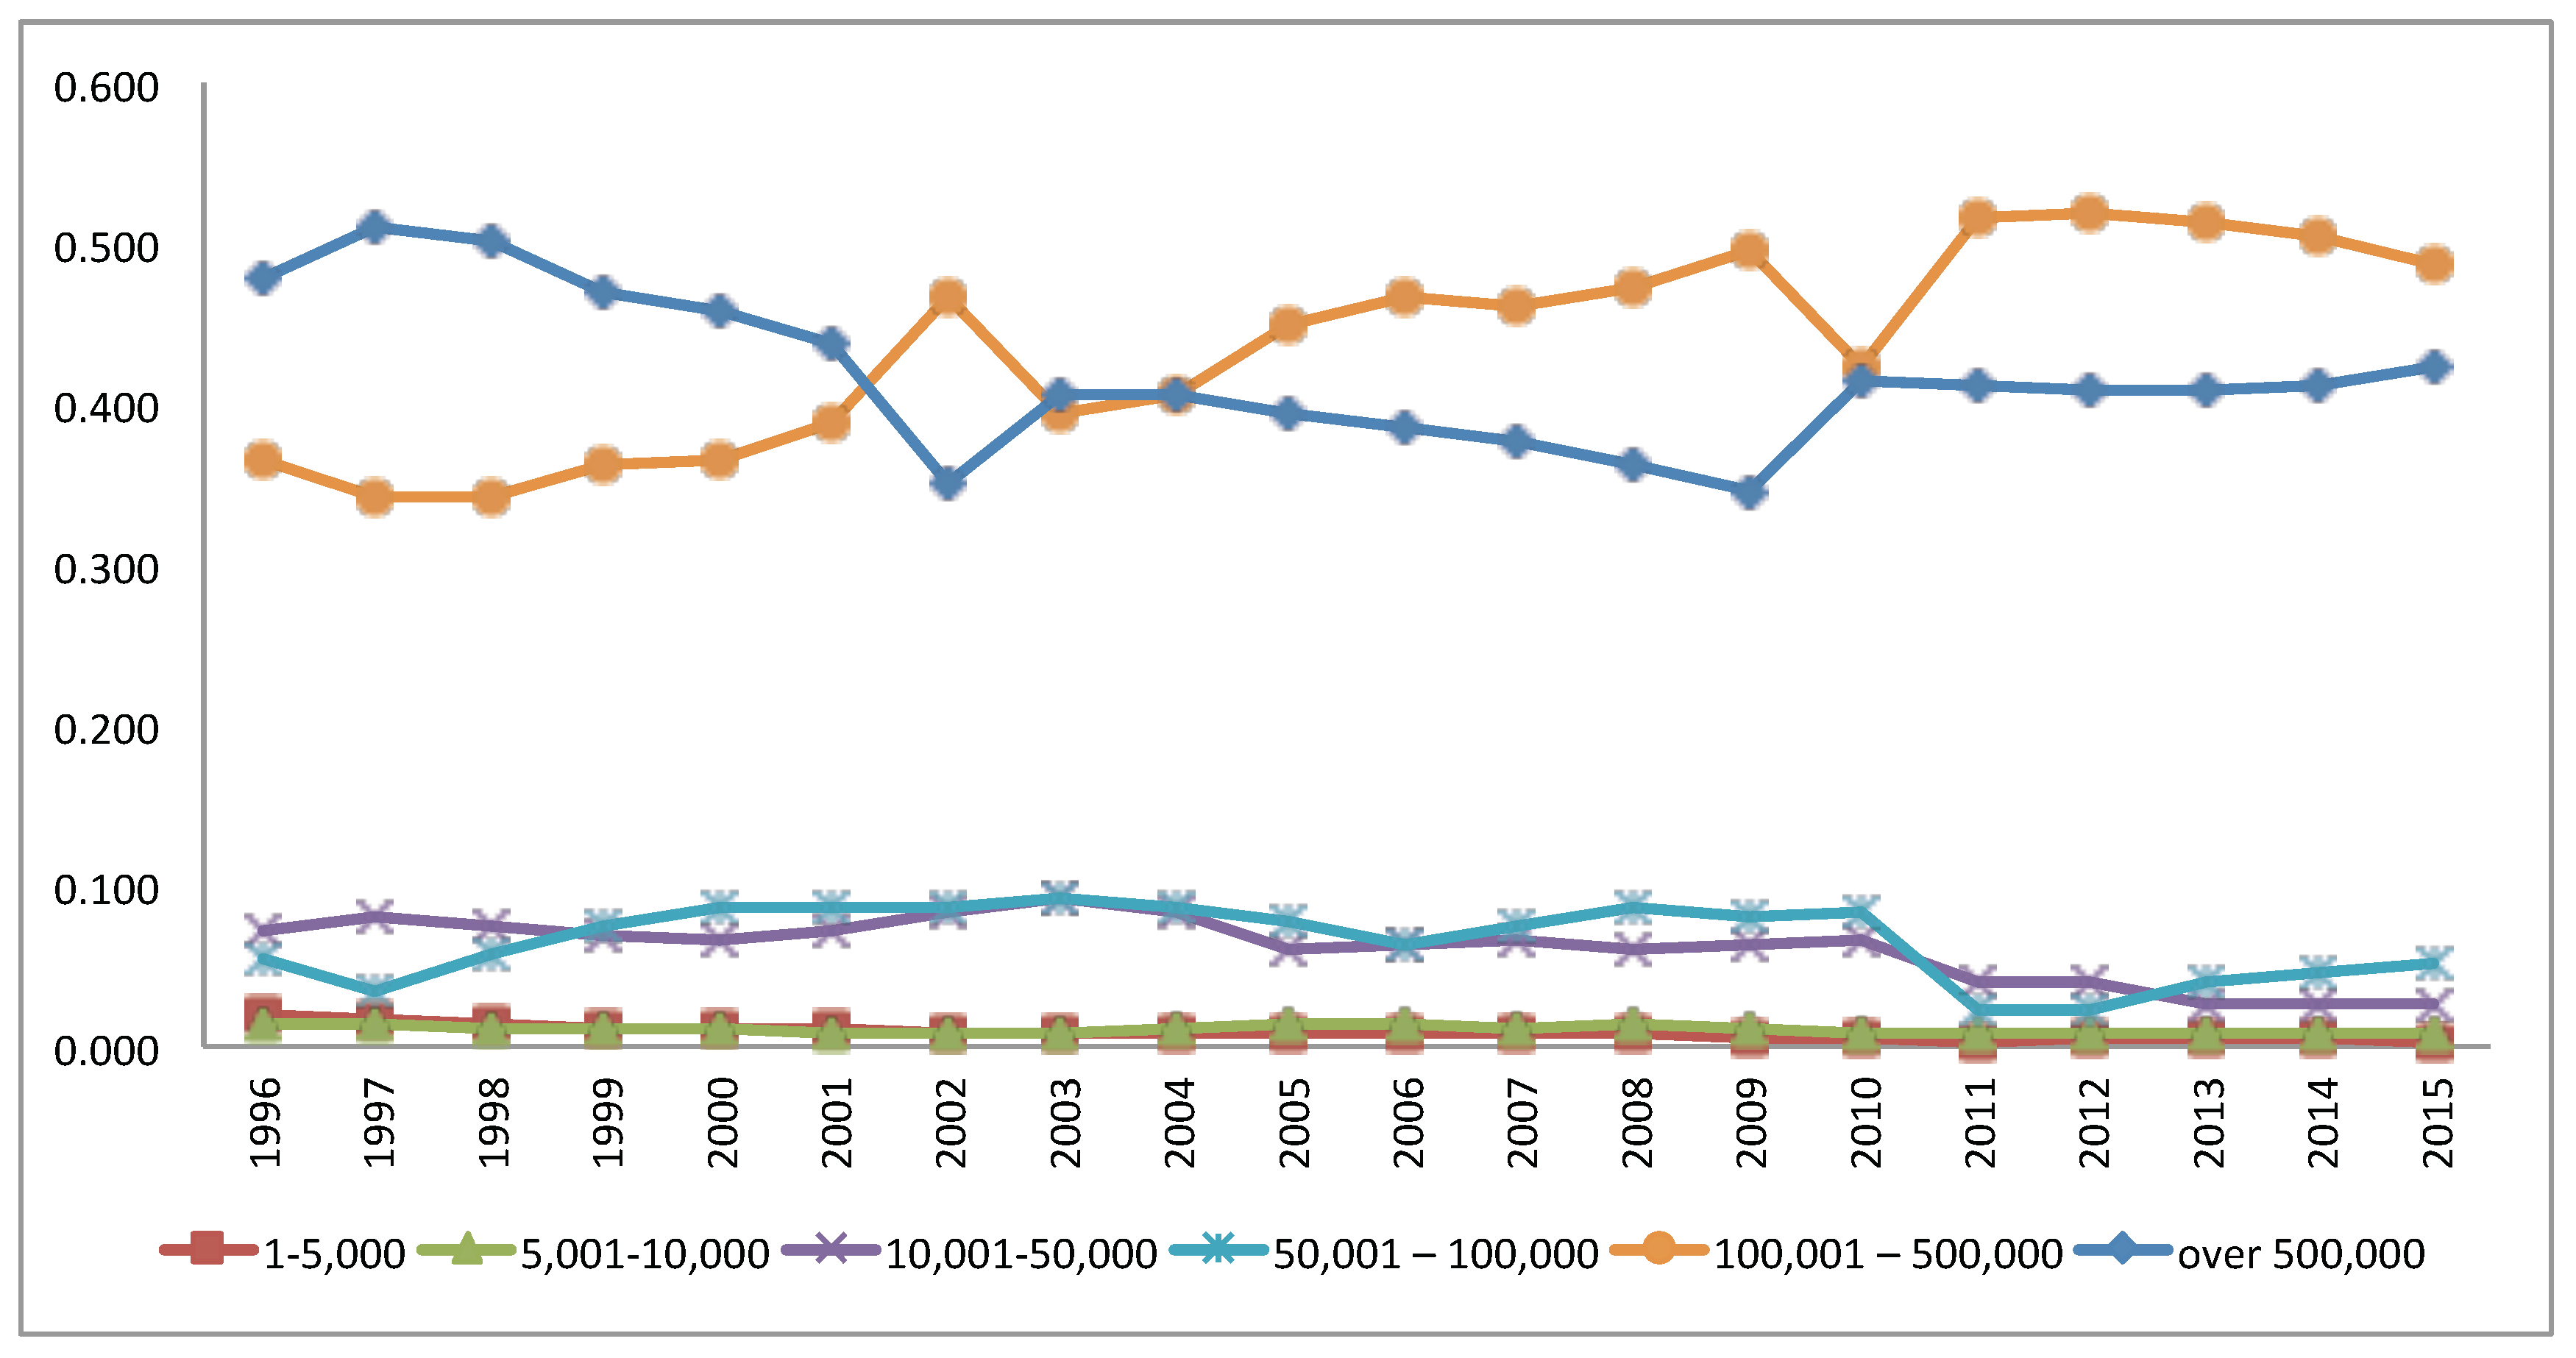
The Swiss health insurance market is heterogeneous with insurance portfolio sizes ranging from very small regional insurers with a customer base of less than 5000 up to big insurers with a customer base of over 500,000 insureds. Like other health insurance markets, the Swiss market underwent a consolidation process since the introduction of the Swiss health insurance law (Robinson (2004)). In 1996, the number of insurers offering health insurance was 145 and has reduced significantly in the last 20 years to a total of only 58 in 2015 (see Table 2) due to mergers and acquisitions of companies. The number of insurers with a customer base of up to 5000 reduced significantly from 90 in 1996 to 11 in 2015, whereas the number of insurers with a customer base greater than 100,000 has increased. Froidevaux and Kilchenmann (2016) suggest that insurers who offer low premiums receive many new affiliation demands, but as the state of health of newly insureds is not known, these insurers have to substantially increase their reserves to cover the unknown risk. They mention that this risk has put several insurers into financial difficulties in the past, among them mainly small and medium sized ones that targeted regional communities. Over the long run, some of these insurers have then been absorbed by larger competitors.
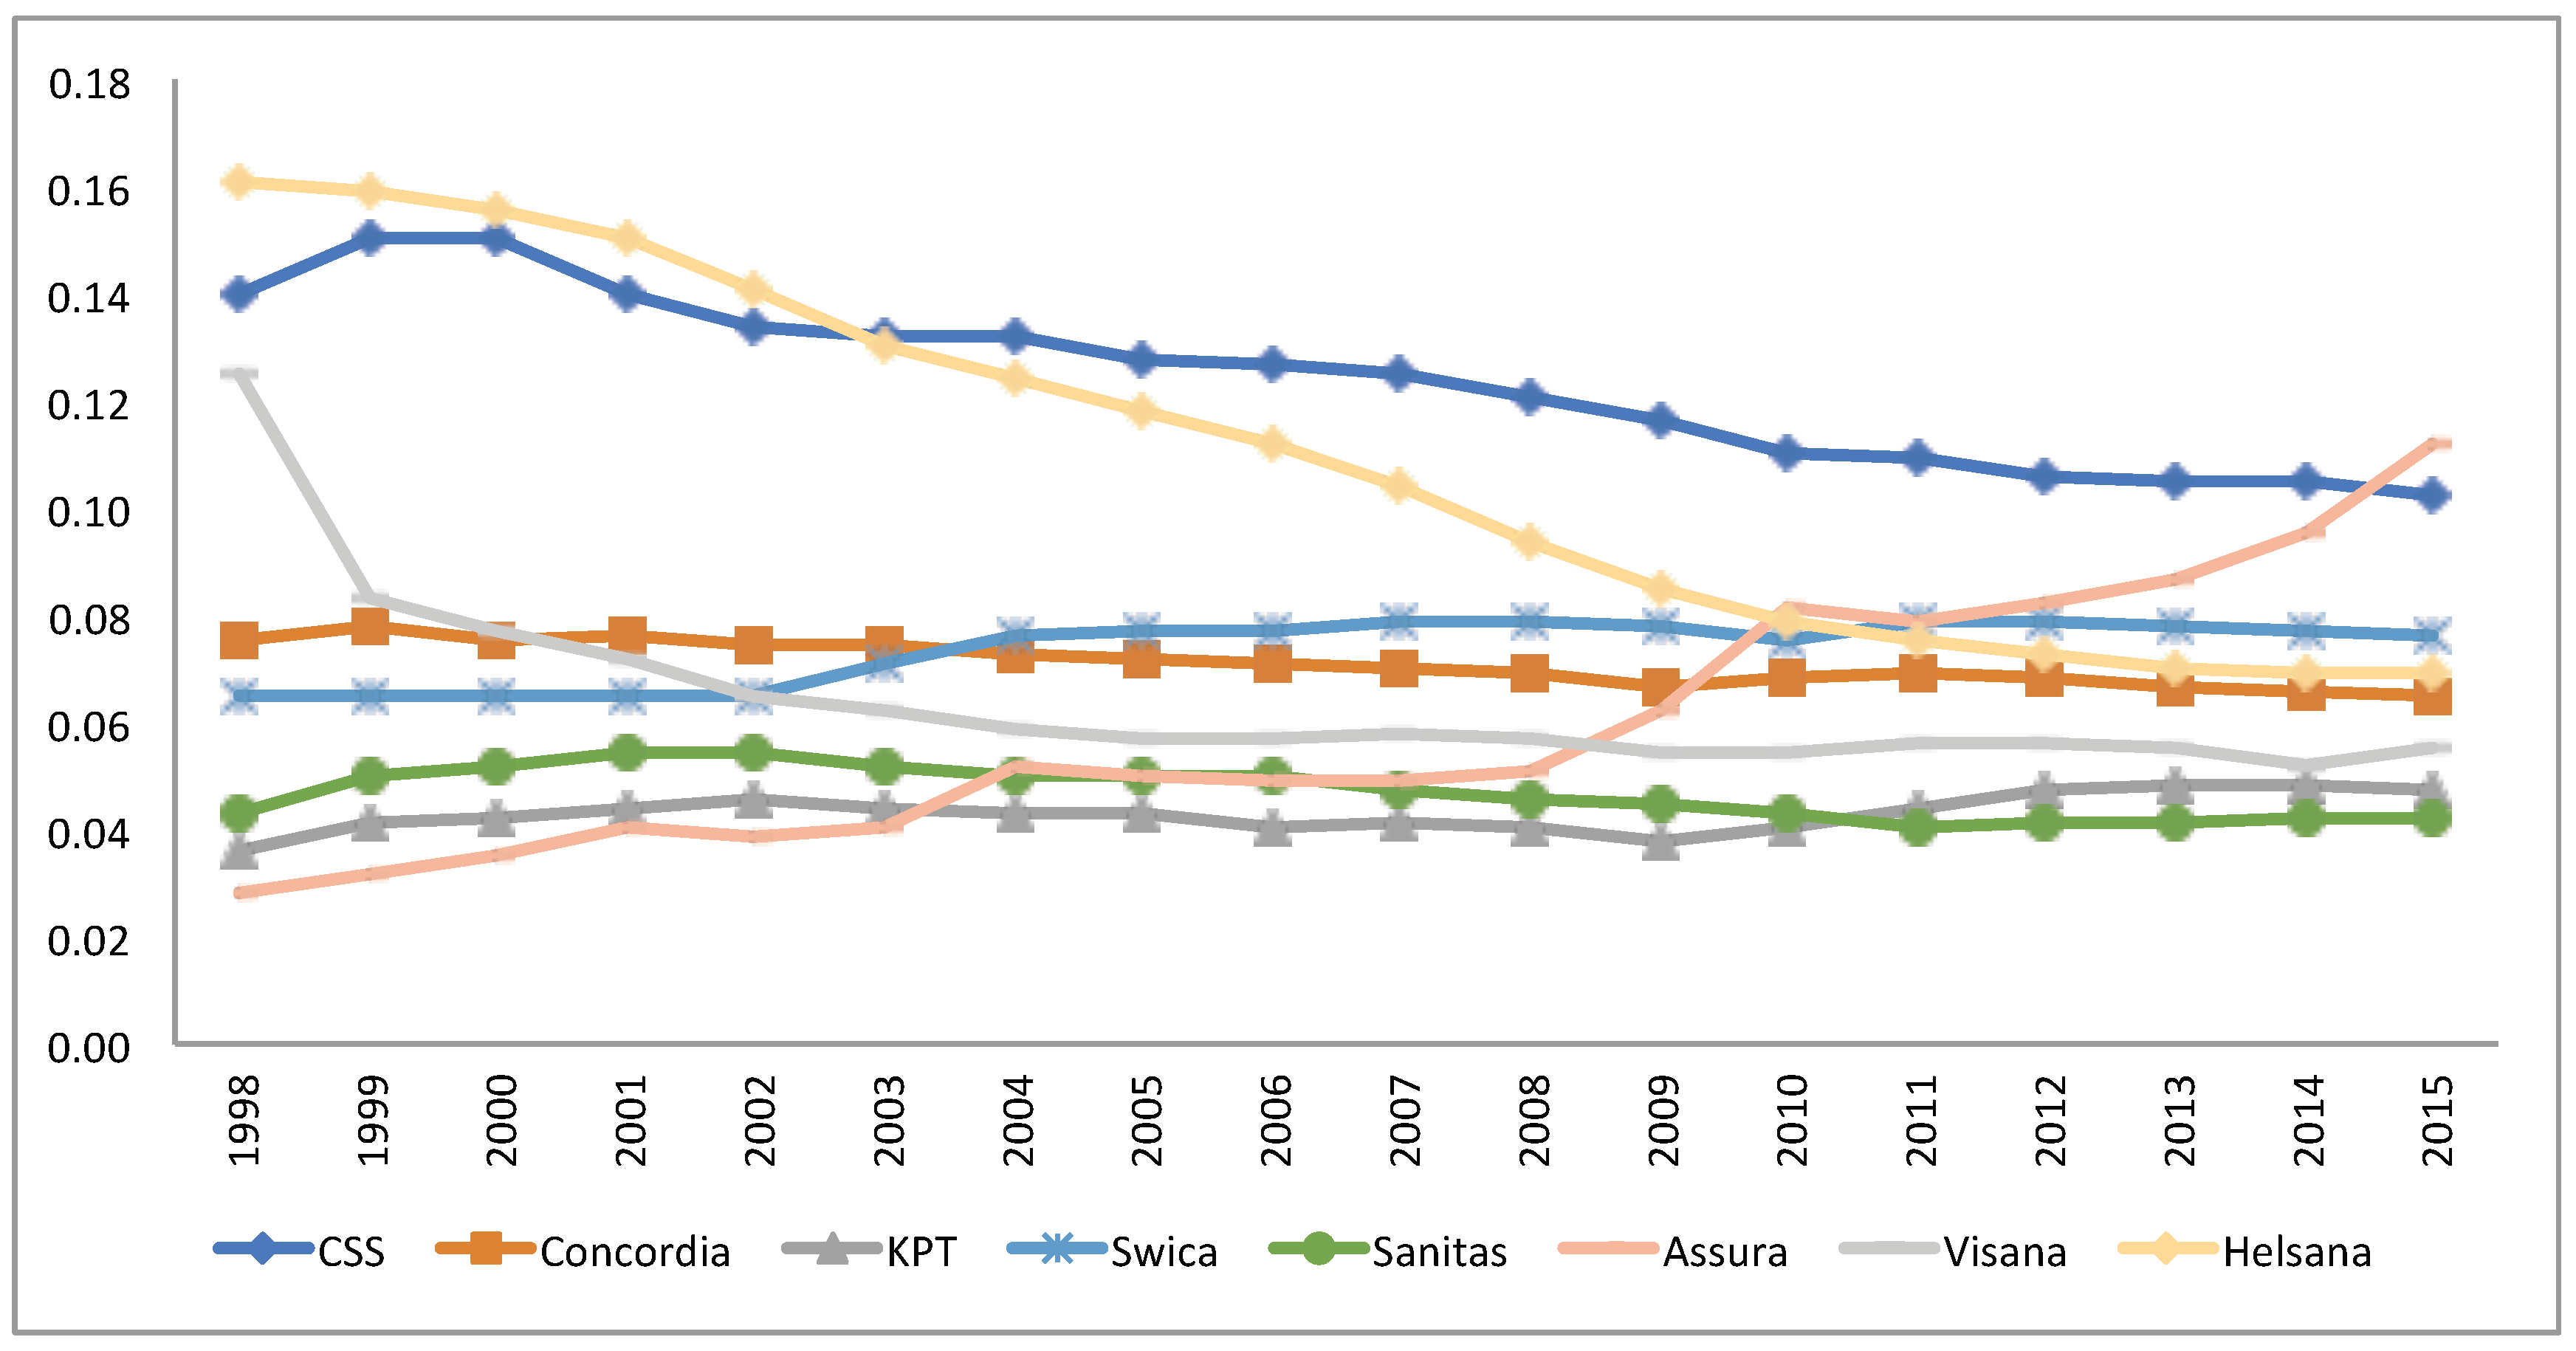
Groups of insurers often have more flexibility and are able to offer larger premium ranges for different members in the group. Additionally, a group of insurers can consolidate the business by restructuring the group. In 2015, more than of the insurers were either part of a group or related to a group by a collaboration contract, and these groups of insurers amount to of the market (Froidevaux and Kilchenmann 2016). As a result, the market share (in terms of number of insureds) of the insurers with more than 100,000 customers increased from in 1996 to in 2015 (see Figure 1). Figure 2 illustrates the development of market shares from 1998 to 2015 of the eight largest insurers as of 2015.
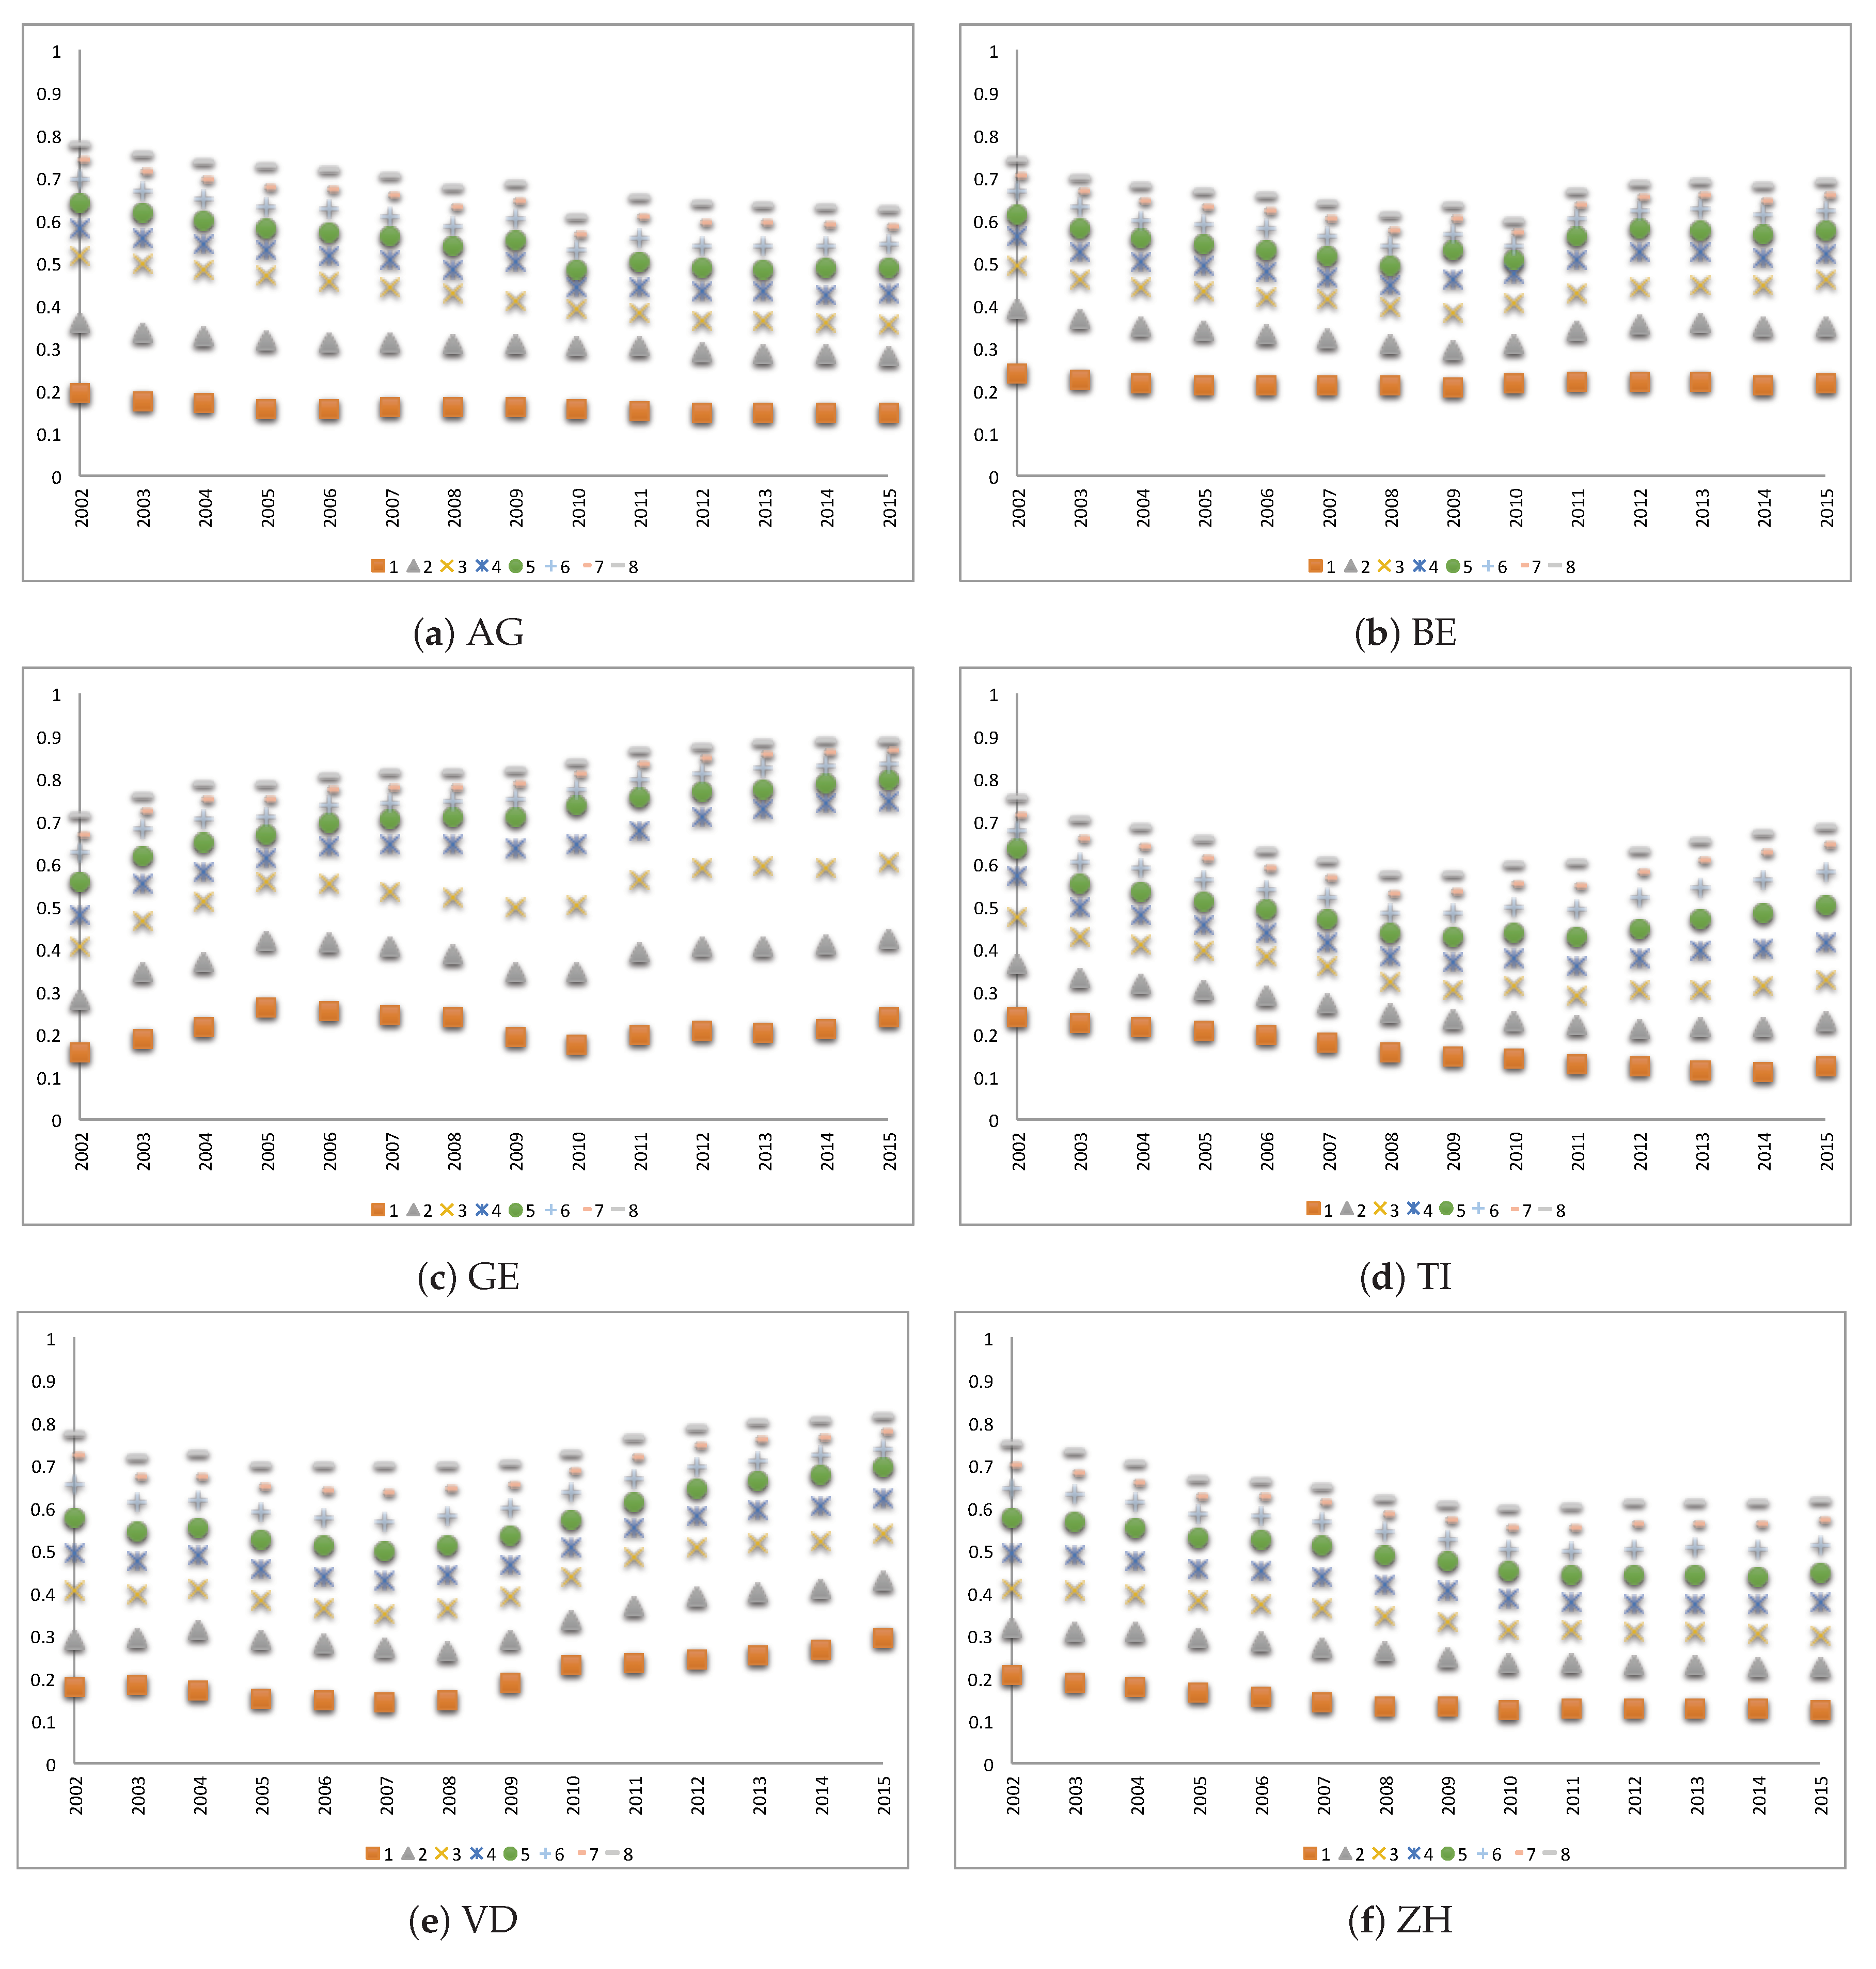
The insurers’ market shares largely differ among cantons. As an illustration, Figure 3 shows the market shares in six cantons of the eight largest insurers in the respective canton per year between 2002 and 2015 where the largest insurer in each year is noted by 1, the second largest by 2 and the eighth largest insurer by the number 8. In GE, the total market share of the eight largest insurers grew from about of the market in 2002 to in 2015. In ZH, the market share is distributed more equally between companies. In VD, during the first years, the market share was more equally distributed, but in recent years, big insurers have captured large market shares, so that the market is mainly dominated by a few bigger insurers today.
2.2. Premium Development 1998–2015
Naturally, the premium size may drive the insureds to switch their insurance plan. Since health expenditures keep growing, the insurers have to raise the premiums (see Table A1). The calculated average yearly growth (CAGR) is between 1998–2015, whereas the yearly average premium raised from CHF 1754 in 1998 to CHF 3289 in 2015. In 2008, after five years of positive operating results and a reduction by of required reserve rate (expressed as a percentage of the premium volume) by the authorities, the premium level has been reduced by (see Comparis.ch (2008)). However, in the years and 2010 the average growth in premiums was much higher than in the other years. One explanation for this increase is the negative balance between the collected premiums and the paid benefits in the years prior to the premium jump (see Table A1).
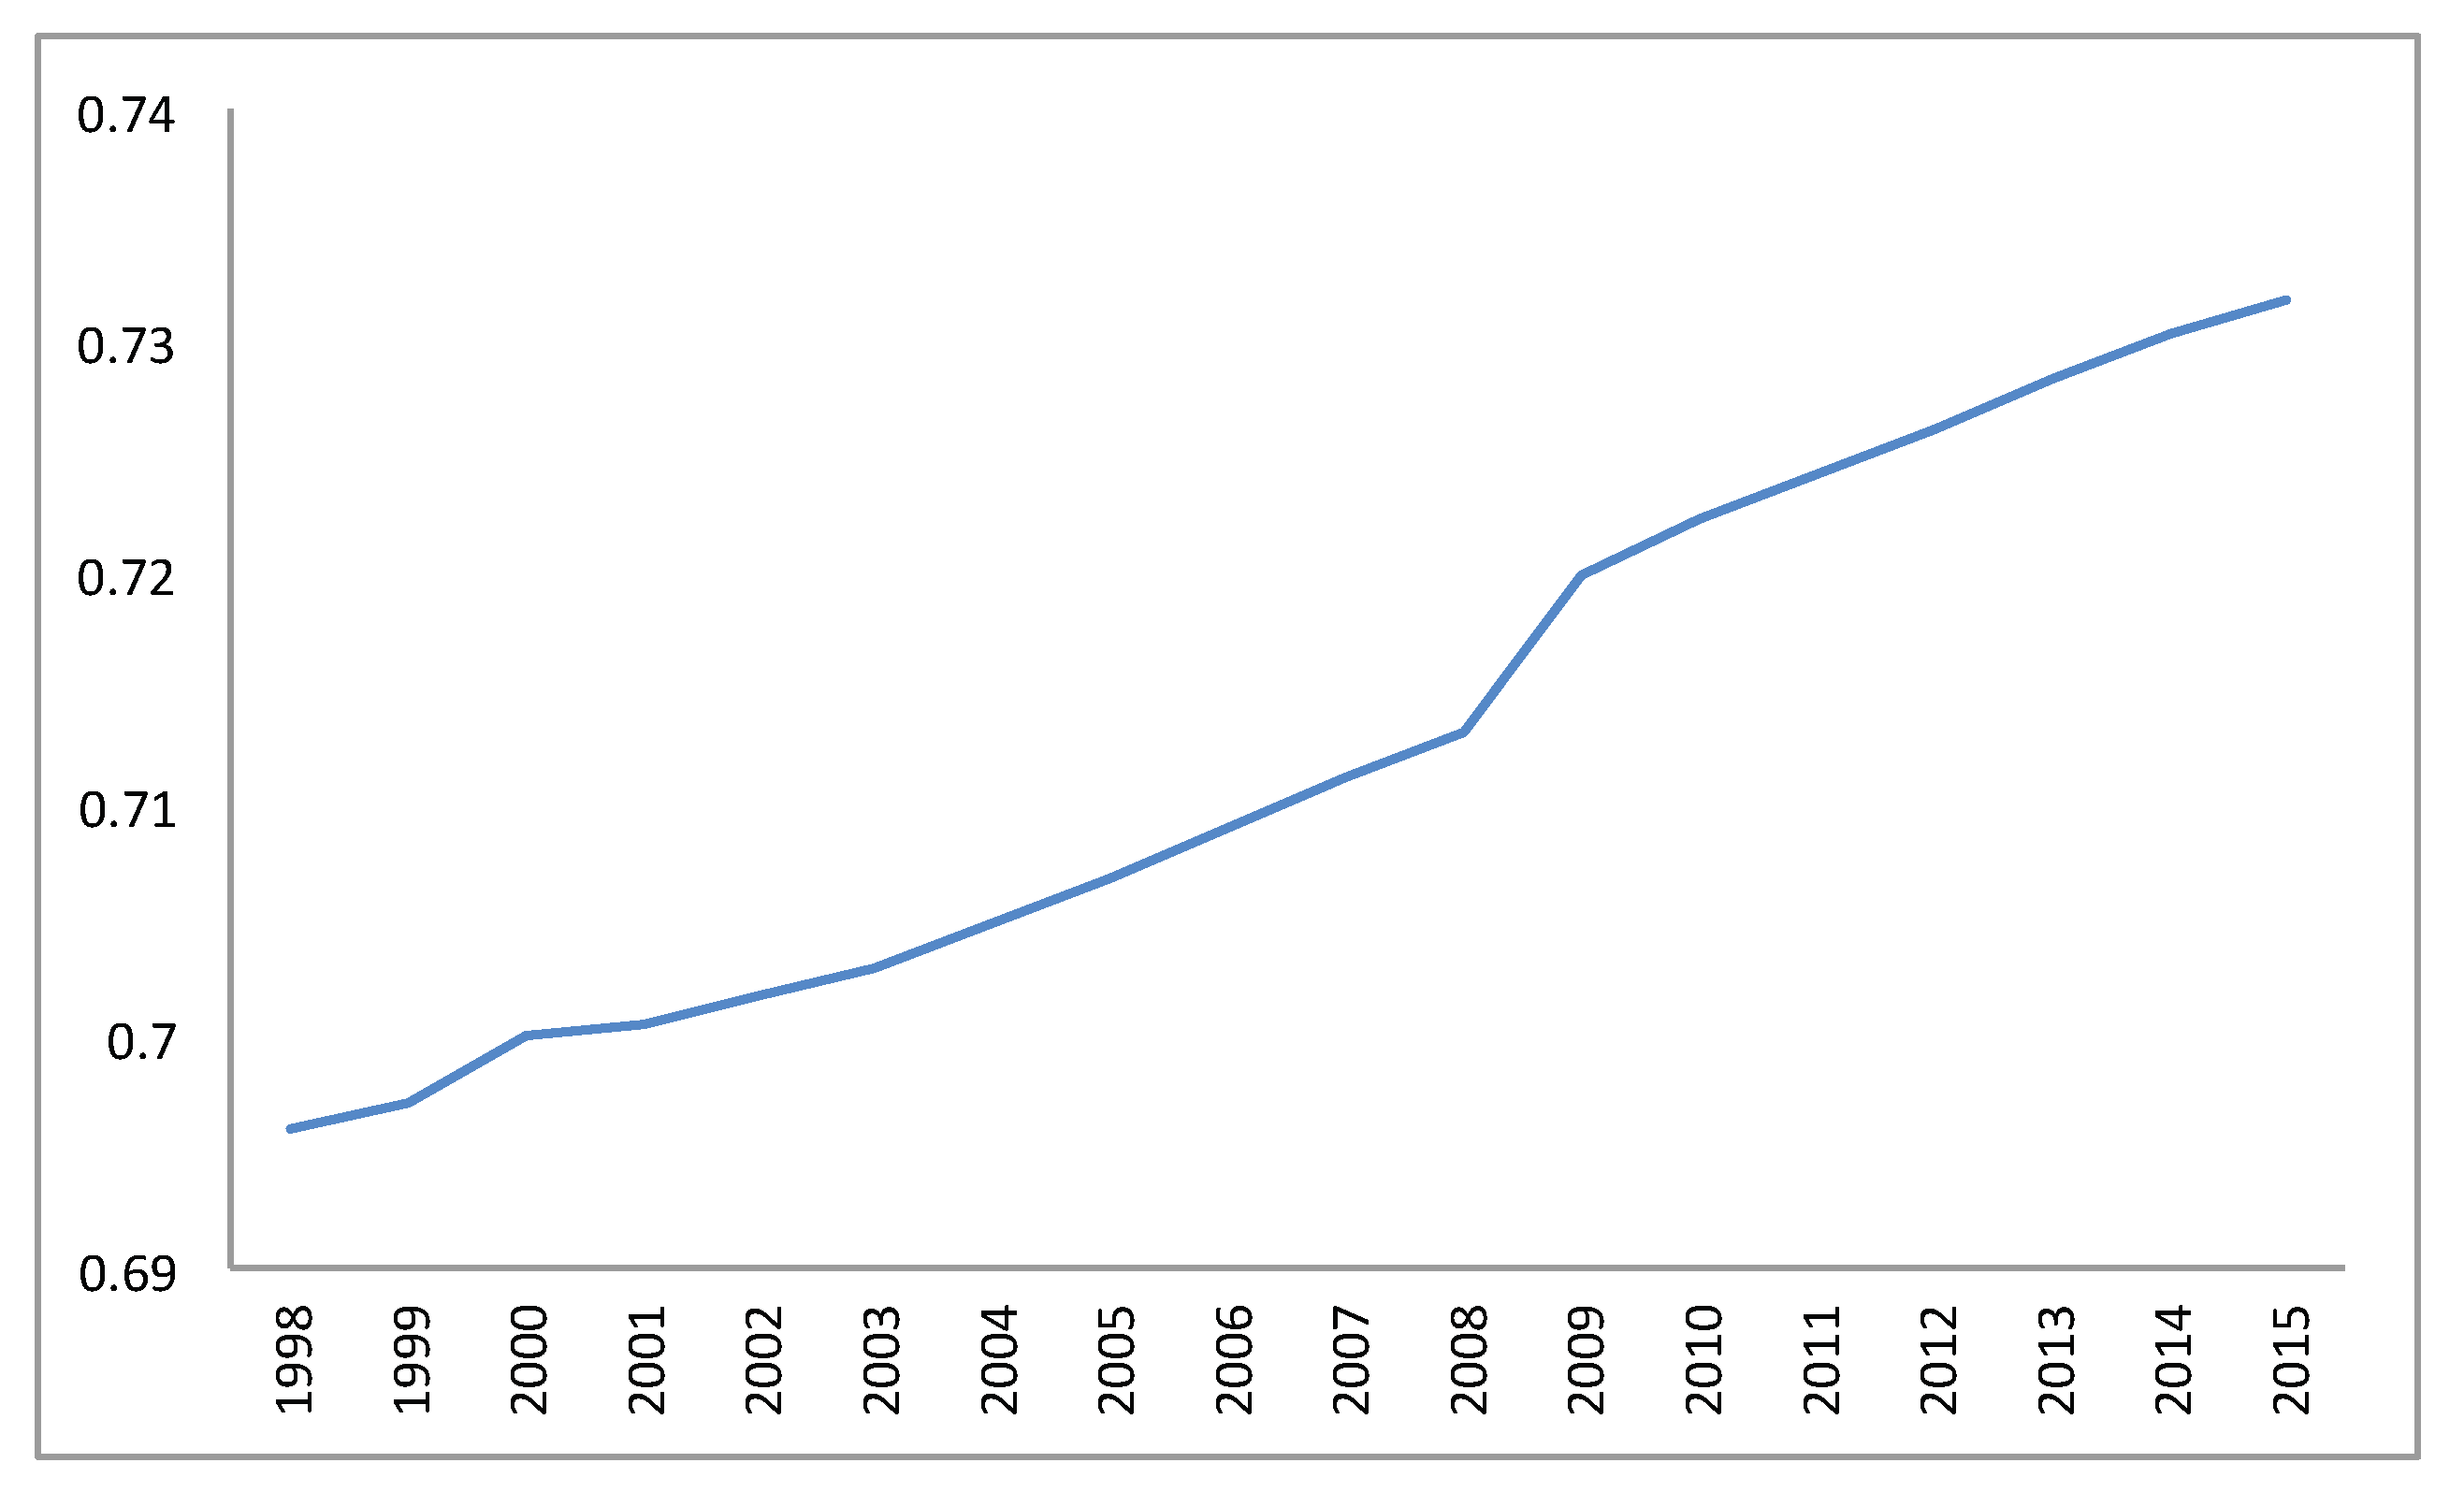
The population is aging with life expectancy increasing in Switzerland from years in 1996 to years in 2015 (World Bank (2017)) and the proportion of adults aged 26 or more in the population is growing (cf. Figure 4), causing increasing health expenses.
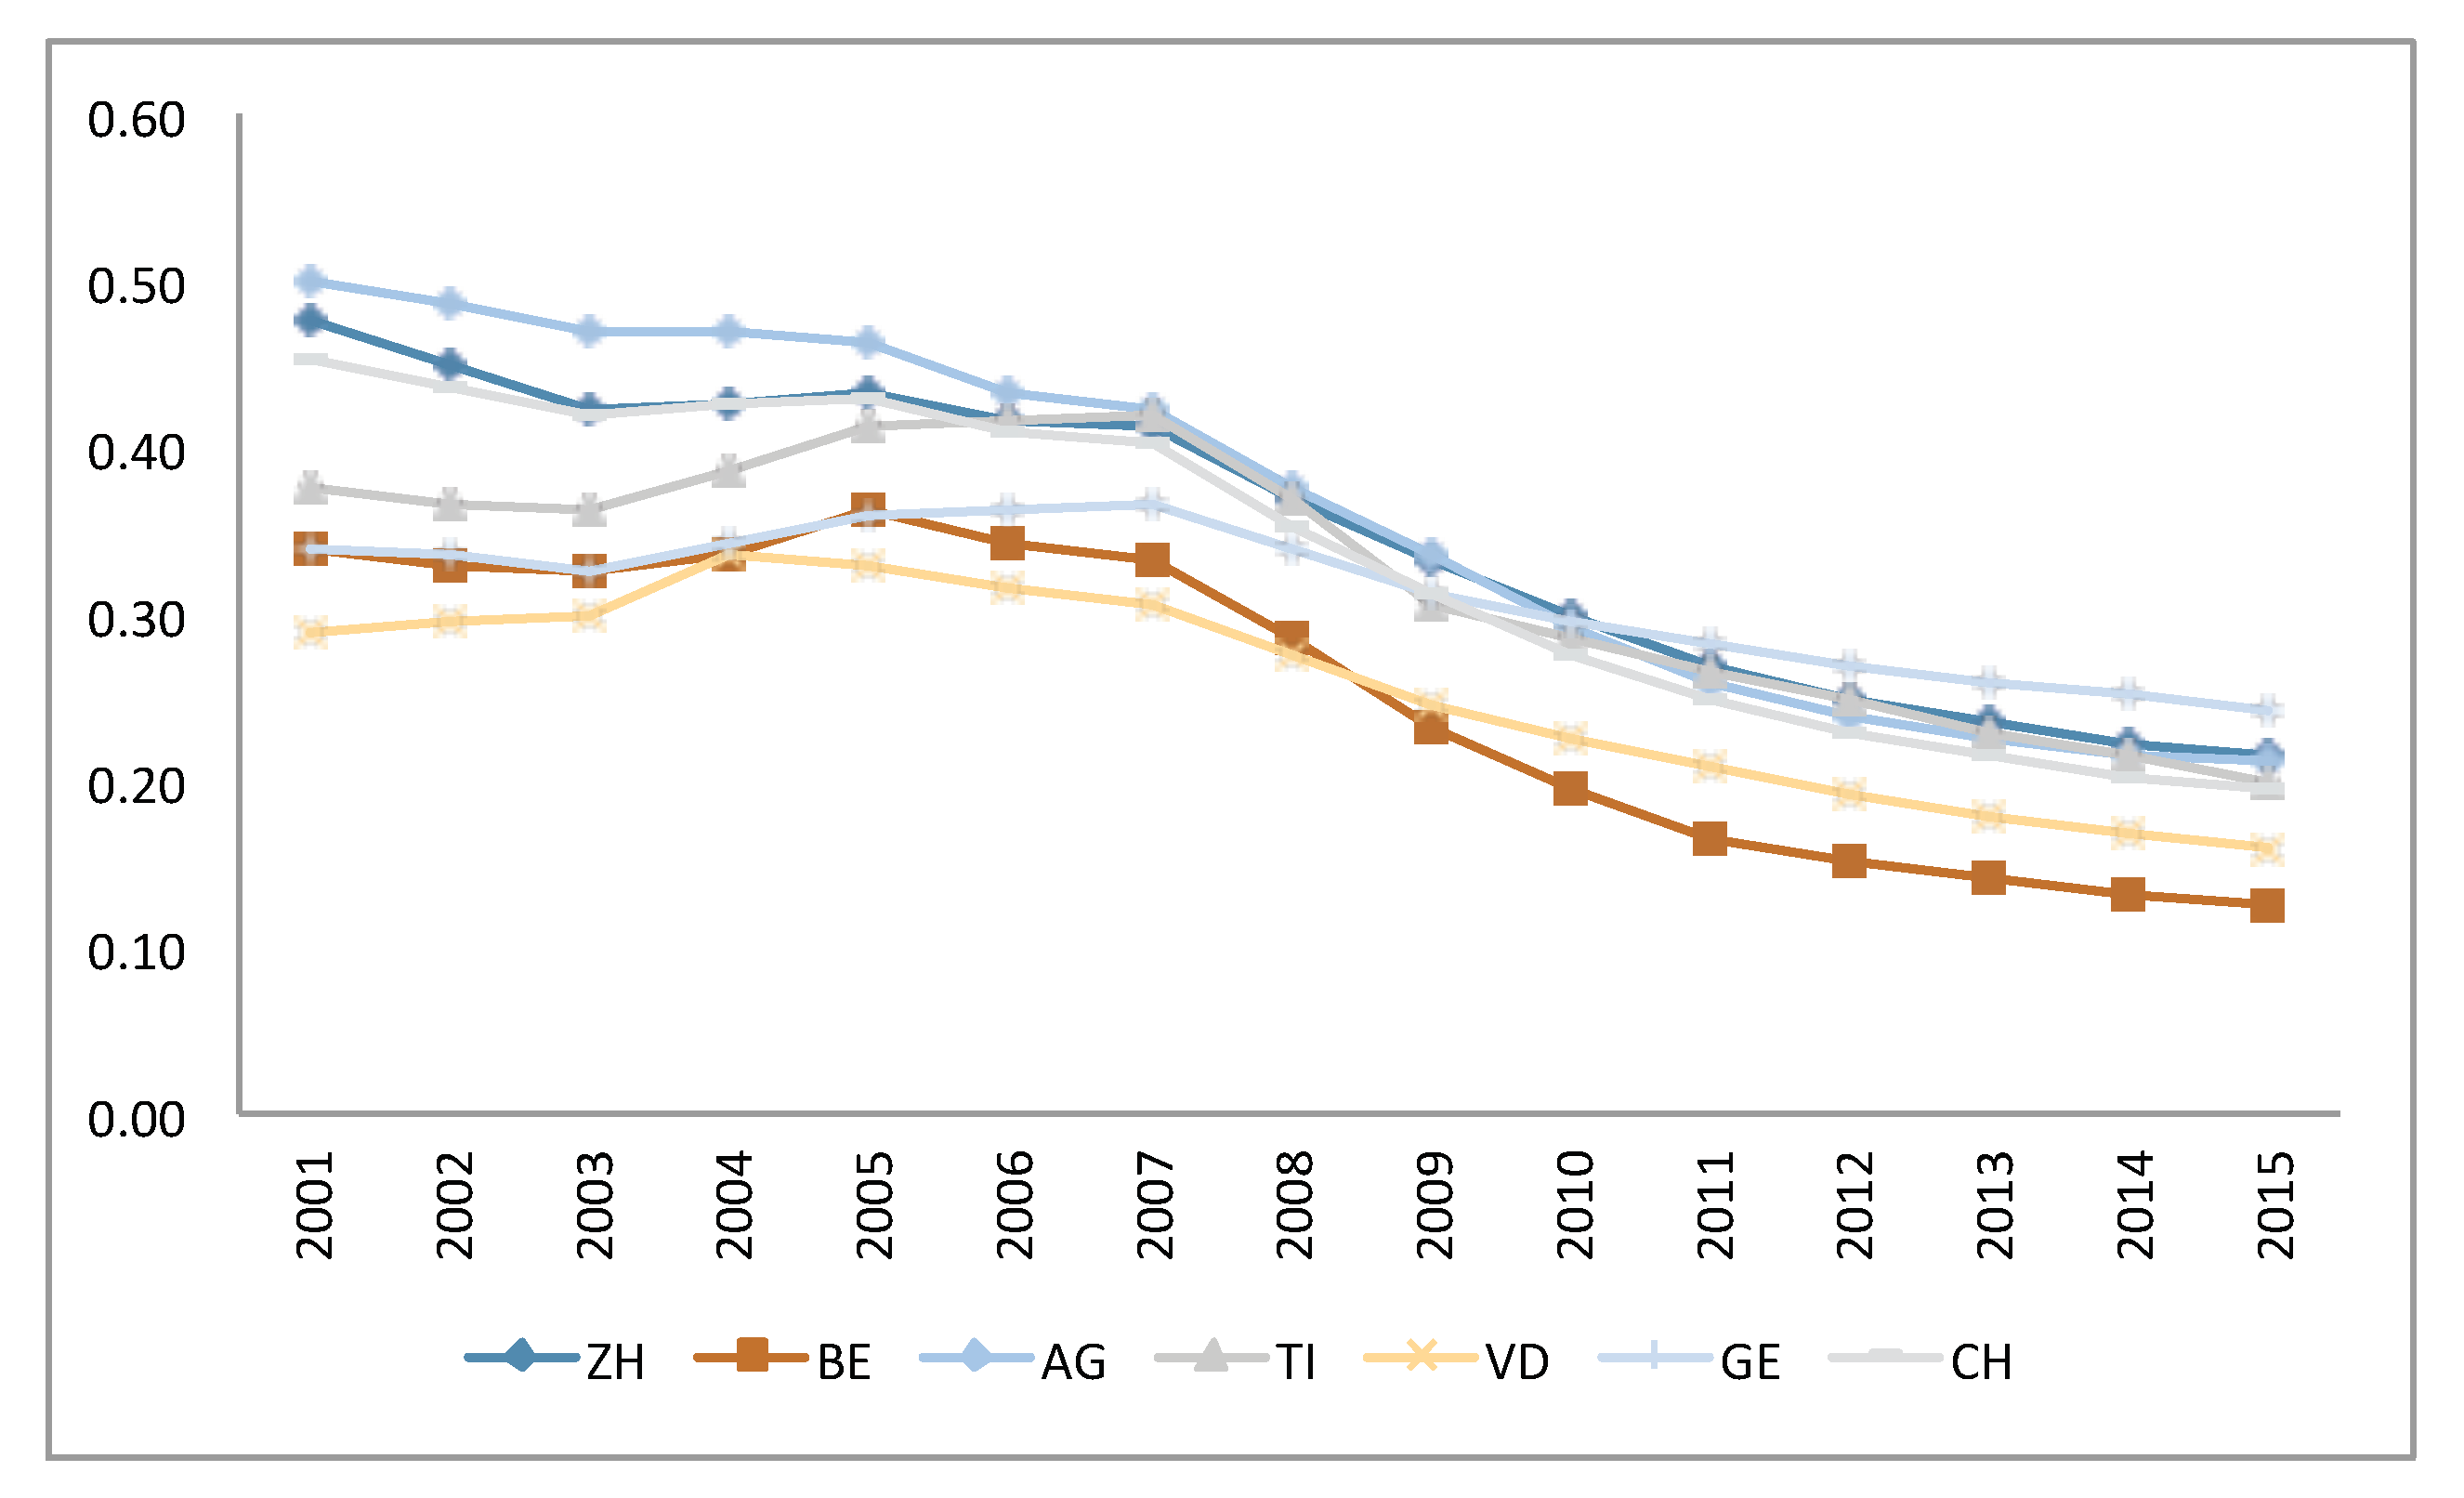
The premiums are fixed by the insurers for each premium region in each canton. In each region, all residents of the same age group (below 18 years, 18-25 years and 26 plus years) pay the same premium per insurance plan and chosen deductible at the same insurer. Regulations do not allow premium discounts in the mandatory insurance scheme. To increase the choice for insureds and in addition to the deductible levels (CHF 300, 500, 1000, 1500, 2000 and 2500 for adults), insurers offer restricted models. The two main restricted models are the Health Maintenance Organization model (HMO) in which the policyholder agrees to always first consult a specified doctor based at the HMO centre and the family doctor model in which policyholders consult first their predefined family doctor who will refer them to a specialist if needed. Other models include the “Telmed" model in which the policyholder has to call a hotline for a first consultation and will then be referred to further treatment if needed. The purpose of these models is to limit medical care within a predefined network of doctors in order to lower health expenses and to offer lower premiums. According to SFOH data, in 1998 about of the insureds in Switzerland had the standard basic insurance (with accident coverage and with the lowest possible deductible, which is CHF 300 since 2004) whereas in 2015 only were covered by this insurance model. Against a background of ever rising premiums, the reduction in this share is linked to the fact that policyholders change towards a more restrictive plan to benefit from lower premiums. The proportion of insureds choosing the standard model (including accident coverage and deductible of CHF 300) per canton is available for the years 2001 to 2015 and is presented in Figure 5.
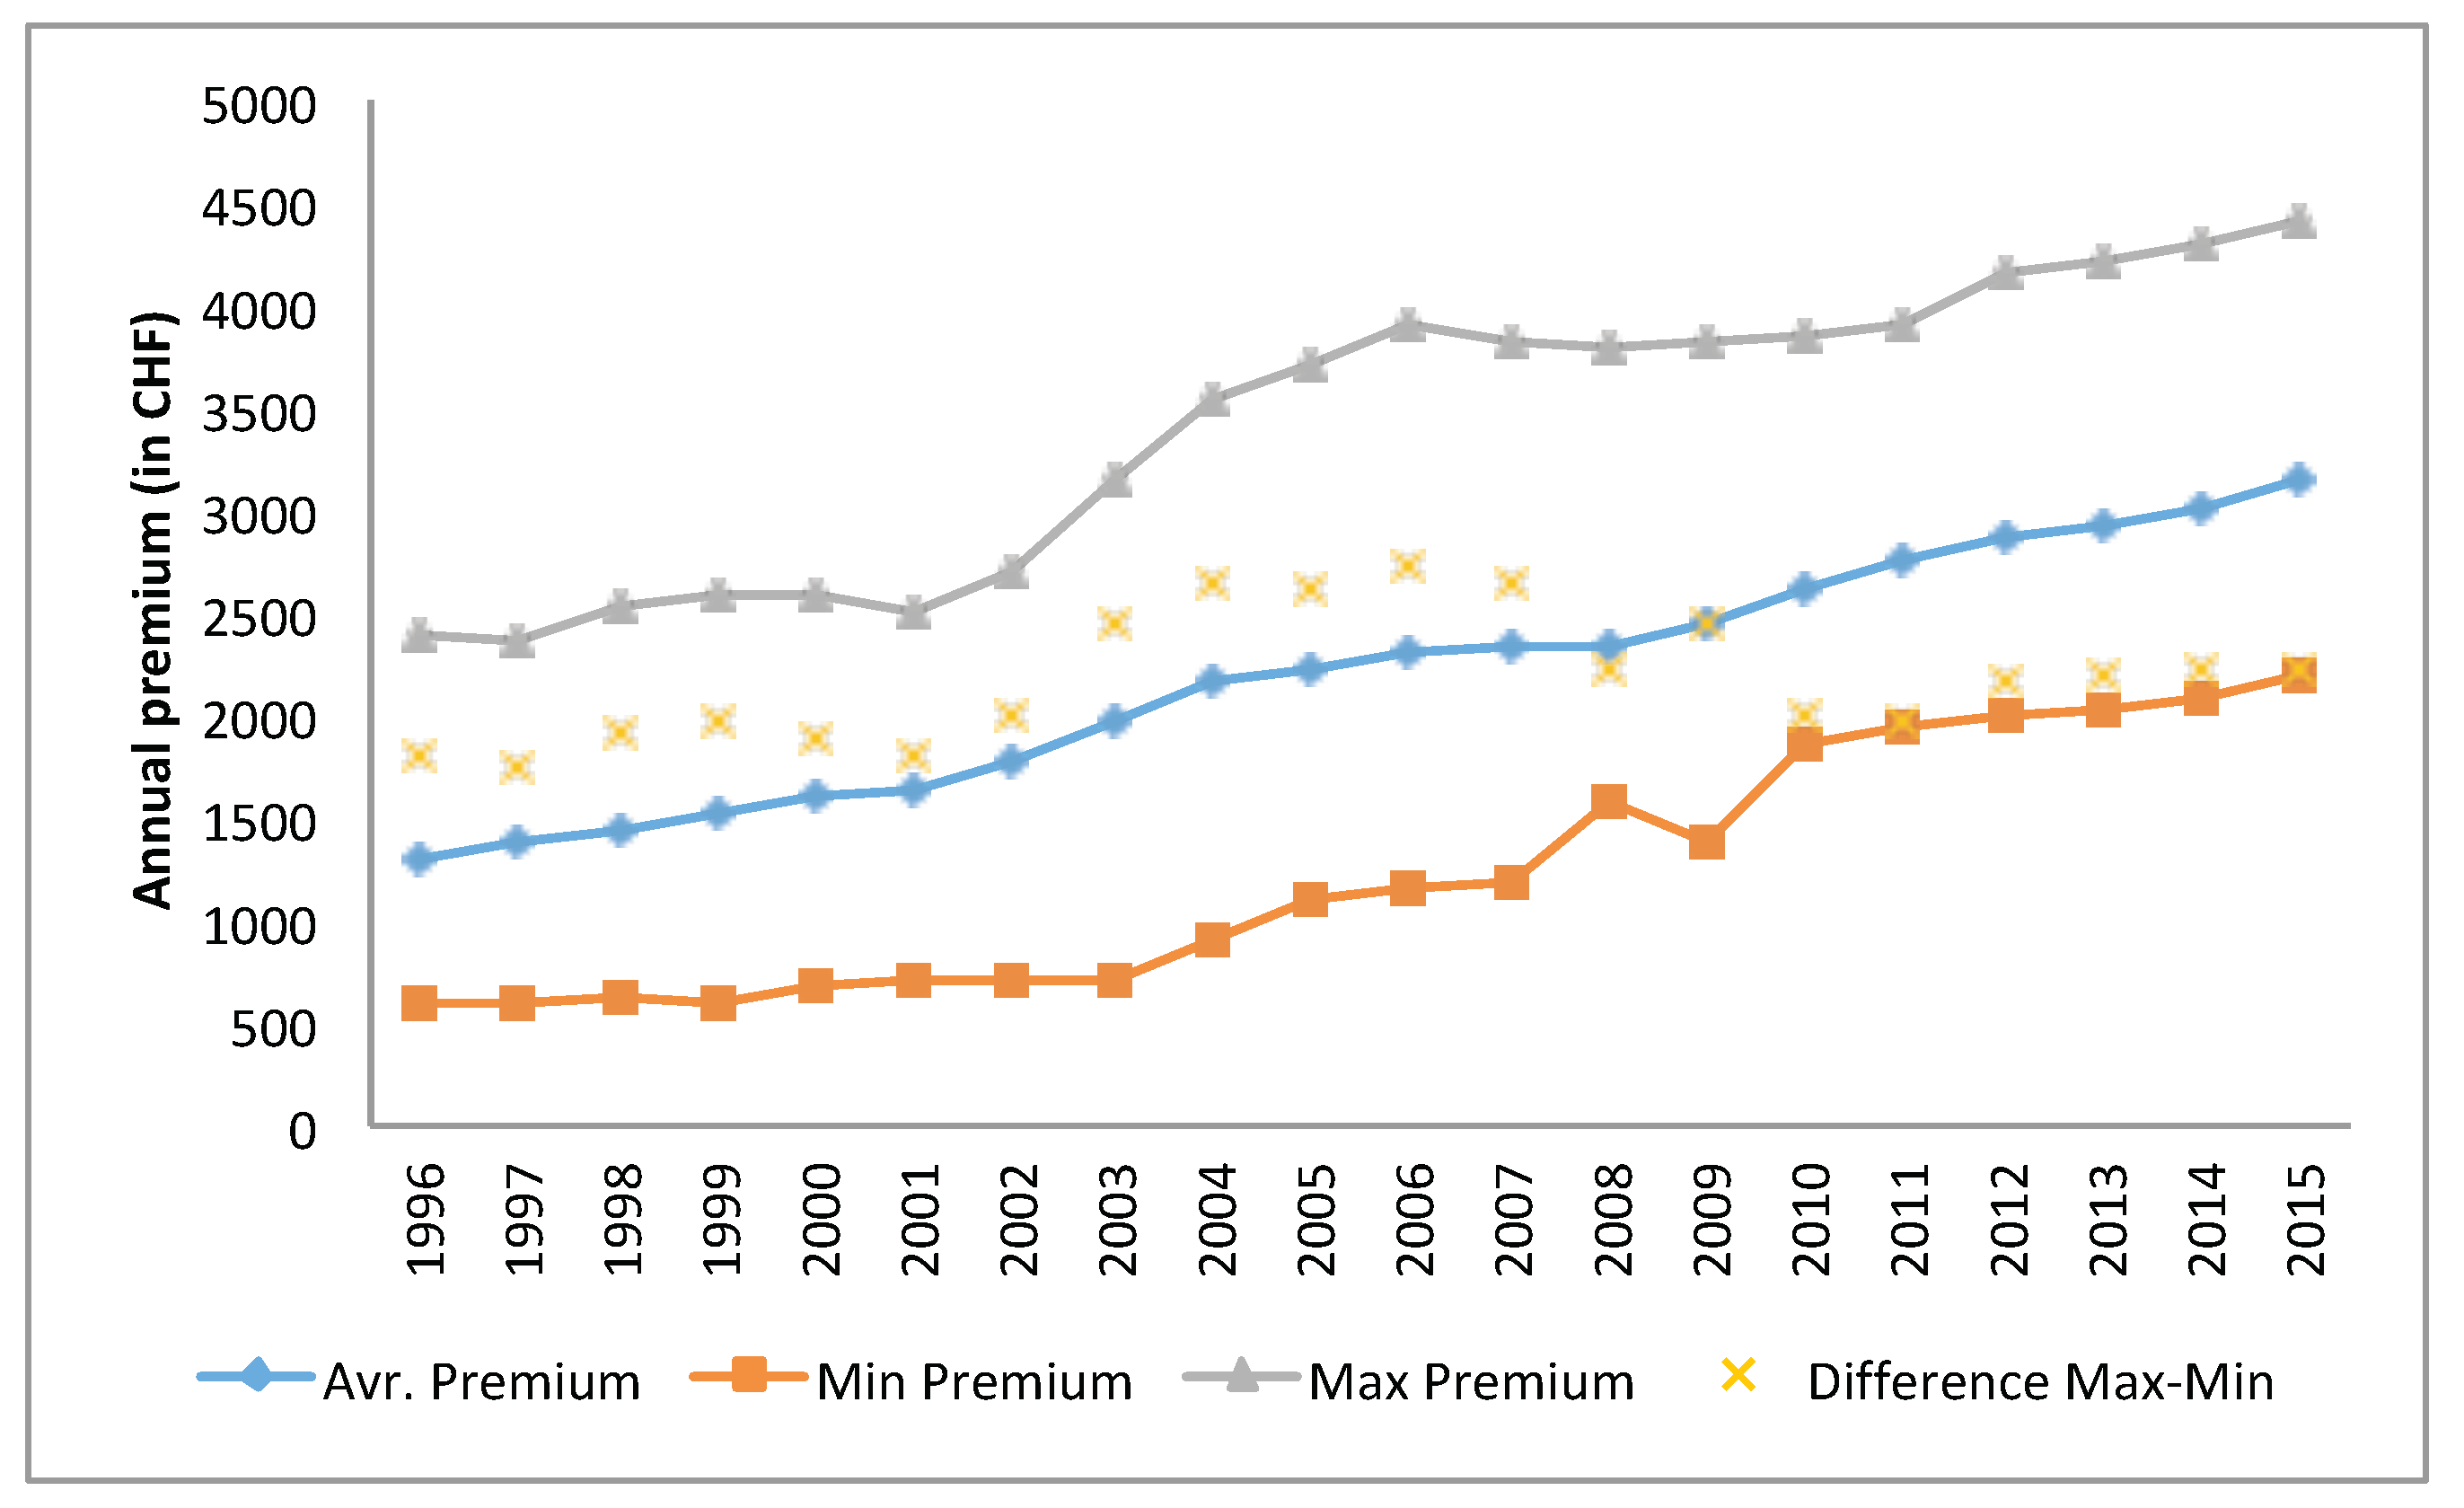
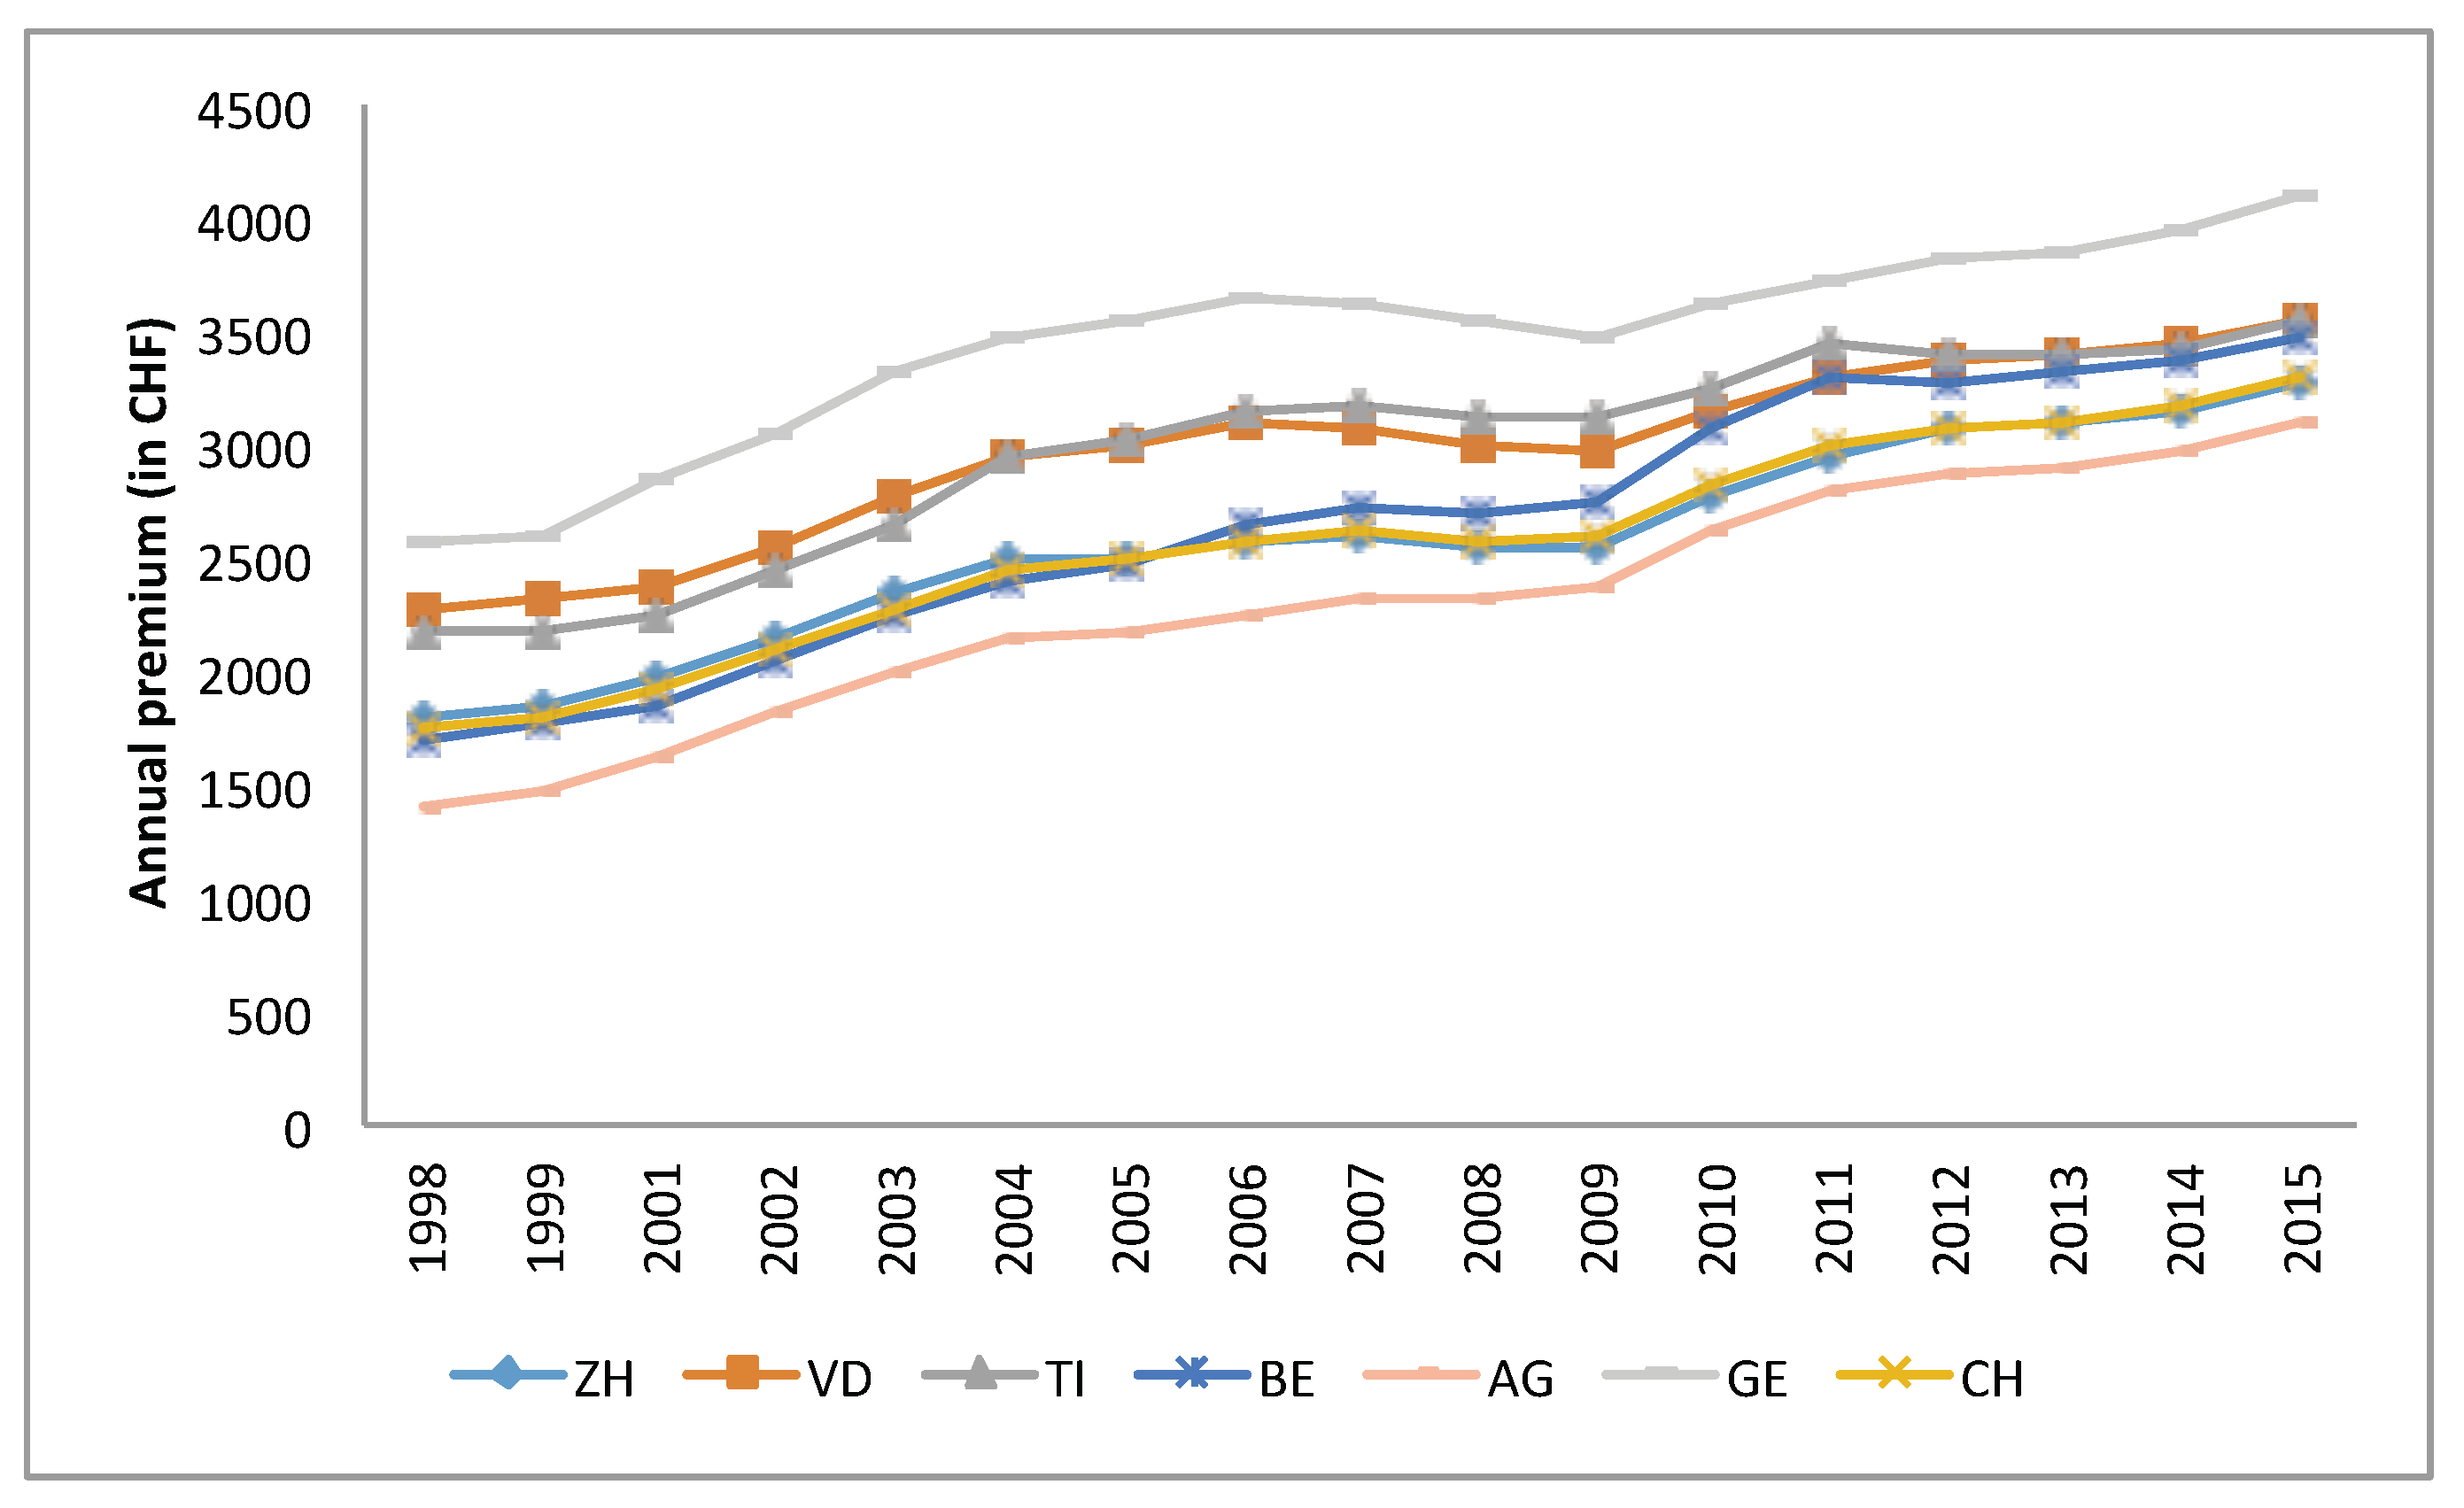
As mentioned above, insurers perform a premium differentiation by offering several levels of deductible for the three age groups and models with restrictions. Employees covered by accident insurance through their employer can buy the basic insurance without accident cover. These options result in many variations of the basic health insurance premiums (Colombo (2001)). The average premium is calculated for each insurer as the total premium income divided by the number of insured from the data published by the SFOH. Although the law aims at increasing the competition between the insurers, the difference between the highest premium and the lowest one has not changed much (Figure 6) and the maximum average premium is approximately twice as large as the lowest one. Leu et al. (2009) suggest that the premium differences among insurers are a result of poor risk adjustment schemes. Figure 7 shows the premium differences between the cantons. Leu et al. (2009) find a high positive correlation between the density of physicians and the premium level which explains to some extent the premium differences across cantons (see Table 1).
2.3. Switching Behaviour of the Policyholders
In view of the strict regulation on the insurers and a defined catalogue of benefits, one might expect a strong price competition and high switching rates of the insureds to ensure paying the lowest possible premium. This could then be followed by convergence of the prices so that the difference between the lowest and the highest premiums would shrink over the years. However, as seen in Figure 6 the premium range does not change a lot over the years and the yearly estimated switching rate of policyholders published by SFOH are between 6.5–13% (see Figure 8). Note that in case of a merger between insurers, the insureds are counted as a new entries, although they do not have actively changed. Hence, the actual switching rates are expected to be even lower. Figure 8 also suggests a relationship between the average annual premium change and the switching rate.
Each year in September, the SFOH publishes the premiums for the coming year. At that time, each insured can compare the change in premium of the own contract with the average change of all insurers. Policyholders have time until the end of November to change their provider. The results of a survey among policyholders concerning their switching behaviour (Federal Statistical Office (2007)) suggest that of the ones that changed their insurer, did so due to premium increases, with higher switching rates among those with a higher education level ( against ). The linguistic region has an effect on the switching rates as well, with a rate in the French speaking region and only a switching rate in the Italian speaking region. In 2010, the consumer website Bonus.ch (2010) did a survey among 3700 insureds, where of the customers who changed their insurer, did so in order to reduce their premium.
Ortiz (2011) investigates three data sets of Swiss health insurance plans and their prices for the period from 2004 to 2010. His findings suggest that many policyholders do not perform a sufficient price optimisation when switching the insurer, resulting in choosing insurers with relatively high premiums. Wilson and Price (2010) suggest that even in a transparent and simple market, the ability of consumers to compare correctly between different suppliers is rather limited.
The satisfaction level in the health insurance market in Switzerland is very high (79%) and insureds do not switch insurers when they are satisfied with their current one (Thomson et al. (2013)). In the above mentioned survey from 2010 by Bonus.ch (2010), of the insureds that changed their insurer declared that they did so due to a lack of satisfaction with the services.
In addition to the basic mandatory cover, insureds can buy a complementary insurance. Dormont et al. (2009) investigate the effect of existing complementary insurance on the switching behaviour. The results show some evidence that insureds who purchase a complementary insurance are more reluctant to switch the basic insurance provider. These results are supported by the survey from 2010 done by Bonus.ch (2010), in which of insureds responded that the main reason for them to stay with their current insurer is having a complementary plan.
3. Research Questions, Available Data and Model Assumptions
3.1. Research Questions and Variables
We would like to quantify the effect of selected factors on the insurer’s market share and define the dependent variable as the absolute year-to-year difference of an insurer’s market share with the one of the previous year, where i indicates the insurer, t the year and c the canton.
Premiums: Colombo (2001) conducted a study on the switching behaviour of the health insurance customers in Switzerland and his findings suggest that while service level appears as minor parameter supporting switching decisions, the premium level is the main motivation for customers to switch their health plan. Nevertheless, the results of that study show that in order to reduce their premium level, policyholders prefer to change their health insurance plan from the standard basic one to more restrictive ones (like HMO) from the same insurer. Following these findings and the surveys mentioned in Section 2.3, we want to test the significance of two different variables associated with the premiums. First, we perform a statistical test whether the annual changes in market share of insurers depend on the relative difference between the insurer’s premium and the market premium, denoted by . The first question hence is:
(Q1) Does a lower premium than the market premium come with a significant increase in the market share?
Secondly, we define as the absolute difference between the insurer’s relative annual change in the premium and the one of the market premium. We assume a positive relationship between premium increase and switching decisions:
(Q2) Is a higher relative annual increase in premium than in the market premium a significant driver of a decreasing market share?
Satisfaction: Although a satisfied customer is not necessarily a loyal customer, Berry (1995) claims that a good service level promotes the relationship with customers in service companies such as insurance. Anderson et al. (1994) find a positive effect of satisfaction and performance. We define an explanatory binary variable for the satisfaction of the policyholders . Our third research question is:
(Q3) Do insurers with better customer satisfaction levels have significantly larger market shares?
Group: Companies that are members of a group have advantages such as knowledge sharing, reduced administrative expenses from scale effects and stronger marketing. Following various research findings such as Cummins and Xie (2008), we want to test whether belonging to a group supports the insurer and allows to attract and retain more customers. We define a binary variable () representing if the insurer is part of an insurance group or not. Our fourth question is:
(Q4) Does belonging to a group result in a significant increase of the market share?
Canton: As discussed in Section 2.3, the switching behaviour of the policyholders is related to demographic parameters such as language and education level. The language spoken is strongly linked to the cantons, i.e. we are interested in the following question:
(Q5) Do the independent variables significantly affect the market share of the insurers differently through the cantons?
We summarise the variables introduced above in Table 3:
3.2. Available Data
3.2.1. Data Description
The Swiss Federal Statistical Office publishes yearly reports, including data of the health insurance system in Switzerland. The available data for the years 2002–2015 include the premiums for different insurance models offered by the insurers in the different cantons, the size of the portfolio of each insurer per canton, the percentage of insureds with the basic standard model per canton and general statistics about the insured population including age and sex. For each of the 26 cantons and each year we consider the data from insurers with market share greater than neglecting smaller insurers. We analyse a dataset containing a total of 6117 data points with an accumulated market share from held by 16 insurers in Neuchâtel (NE) in 2003 to over held by 22 insurers in Schaffhausen (SH) in 2014. The number of retained insurers per canton and per year varies from 10 in the canton Appenzell Innerrhoden (AI) in 2002 (total market share of ) to 25 insurers in BE in 2008 (total market share of ). More specifically, in GE and VD, the number of insurers with market share greater than decreased by 3 between the years 2002 to 2015 while in the German cantons, the number increased by 3. In TI, the number increased from 17 insurers in 2002 to 22 in 2008, before decreasing back to 17 in 2015.
In our work, we only consider the basic standard insurance model including accident cover and a deductible of CHF 300 for the group of adults aged 26+ years. From the data, we calculate:
- The Market Share () per insurer, year and canton as the size of an insurer’s customer base divided by the population in the canton.
- The Market Premium () for insurer i as the weighted average premium (with market shares) of all the other insurers in the market per year and canton.
- The absolute year-to-year change in market share = as the difference between the current year market share and the one of the previous year per insurer, year and canton.
- The relative difference between the insurer’s premium and the market premium () as the difference between the current year premium () and the current market premium () divided by the current market premium, i.e. = .
- The difference between the relative annual change of the insurer’s premium and the relative annual change in the market premium () per insurer, year and canton, which is defined by
Annual consumer satisfaction reports are published by (Bonus.ch 2010; Comparis.ch 2002–2015, 2008) and include a calculated grade for each of the ranked insurers based on customer satisfaction. Generally, the policyholders are satisfied with their insurers and give relatively high grades for the service level with averages ranging from to out of 6 over the years. We assigned a binary satisfaction level variable () with 0 (=low) for all non-ranked insurers and defined it as our baseline. The ranked insurers are all given a ranking grade of 1 (=high). Since the source for available satisfaction reports varies over the years and not all insurers are ranked, the reliability of these data is lower. This is why we remain with only using a two-level rating.
The group affiliation variable () is binary and is assigned using information from insurers’ websites and reports. Our baseline value is 0 for insurers that are not affiliated to a group.
Before proceeding with the analysis we would like to mention some limitations of our data:
- Information about market events such as mergers and acquisitions are not included.
- Our data includes only the total number of insureds per year per insurer per canton mixing all available insurance models so we use the market share () as an estimation of the insurers’ cantonal market share. This is relevant since for the premium level we remain with using the standard model premium for reference.
- The yearly switching rates between insurers are unknown and there is no information about the number of policyholders that change their insurance model within the same insurer.
3.2.2. Descriptive statistics
Table A2 in the Appendix A presents descriptive statistics of the variables for the entire dataset. We give the mean of the market share for each year which ranges between 5.2–6.3% and basic statistics (the mean, minimum, maximum and standard deviation) of the dependent variable , the explanatory variables and as well as and .
We suggest that some of extremal values in can be explained by specific events in the market like mergers and acquisitions of insurers, reduction in financial reserves below the required level which results in an important raise in premiums or the restructuring of an insurance group. The minimum and maximum yearly values of are in 2010 and 2011 with both years having high switching rates (see Figure 8). 2010 was a year with high increases in premiums while between 2010 to 2011 the number of insurers has reduced from 81 to 63. These events partially explain the extremal values of in 2010 and 2011.
The minimum yearly values of are between −0.182 to −0.245. Some insurers offer an attractive premium with average over all cantons and all years of −12%. Other insurers set premiums above average with an average value of of . Groups of insurers often offer different premium ranges for the basic health insurance. For example, in one group, two insurers may offer different premiums for the basic standard model with one being significantly higher than the market premium and the other one being lower than the market premium.
Reduction in financial reserves below the required level can result in an important raise in premiums in the following years. The largest observed is in 2013 when an insurer fell below the statuary reserve ratio and had to increase premiums by up to in canton Nidwald (NW) while the market premium increased by only 2%. Unexpected increases in claims or administration costs can be another reason for a significant rise of premiums. Such has happened in 2012 in canton Zug (ZG) with one insurer raising premiums by . In 2015, the minimum value of is −22% for an insurer that reduced premiums in the canton Obwalden (OW) by while the market premium increased by 6%.
Cooperation between insurers in the same group and mergers and acquisitions might be related to extremal values as well. In 2003, a ZH based insurer joined an insurers’ group and while its market share reduced in the canton by , another insurer from the group increased its portfolio size by a factor of 5 from 4900 insureds in 2002 to 24,500 in 2003. In 2009, a merger of a Luzern based insurer with another insurance company increased the market share by in the canton.
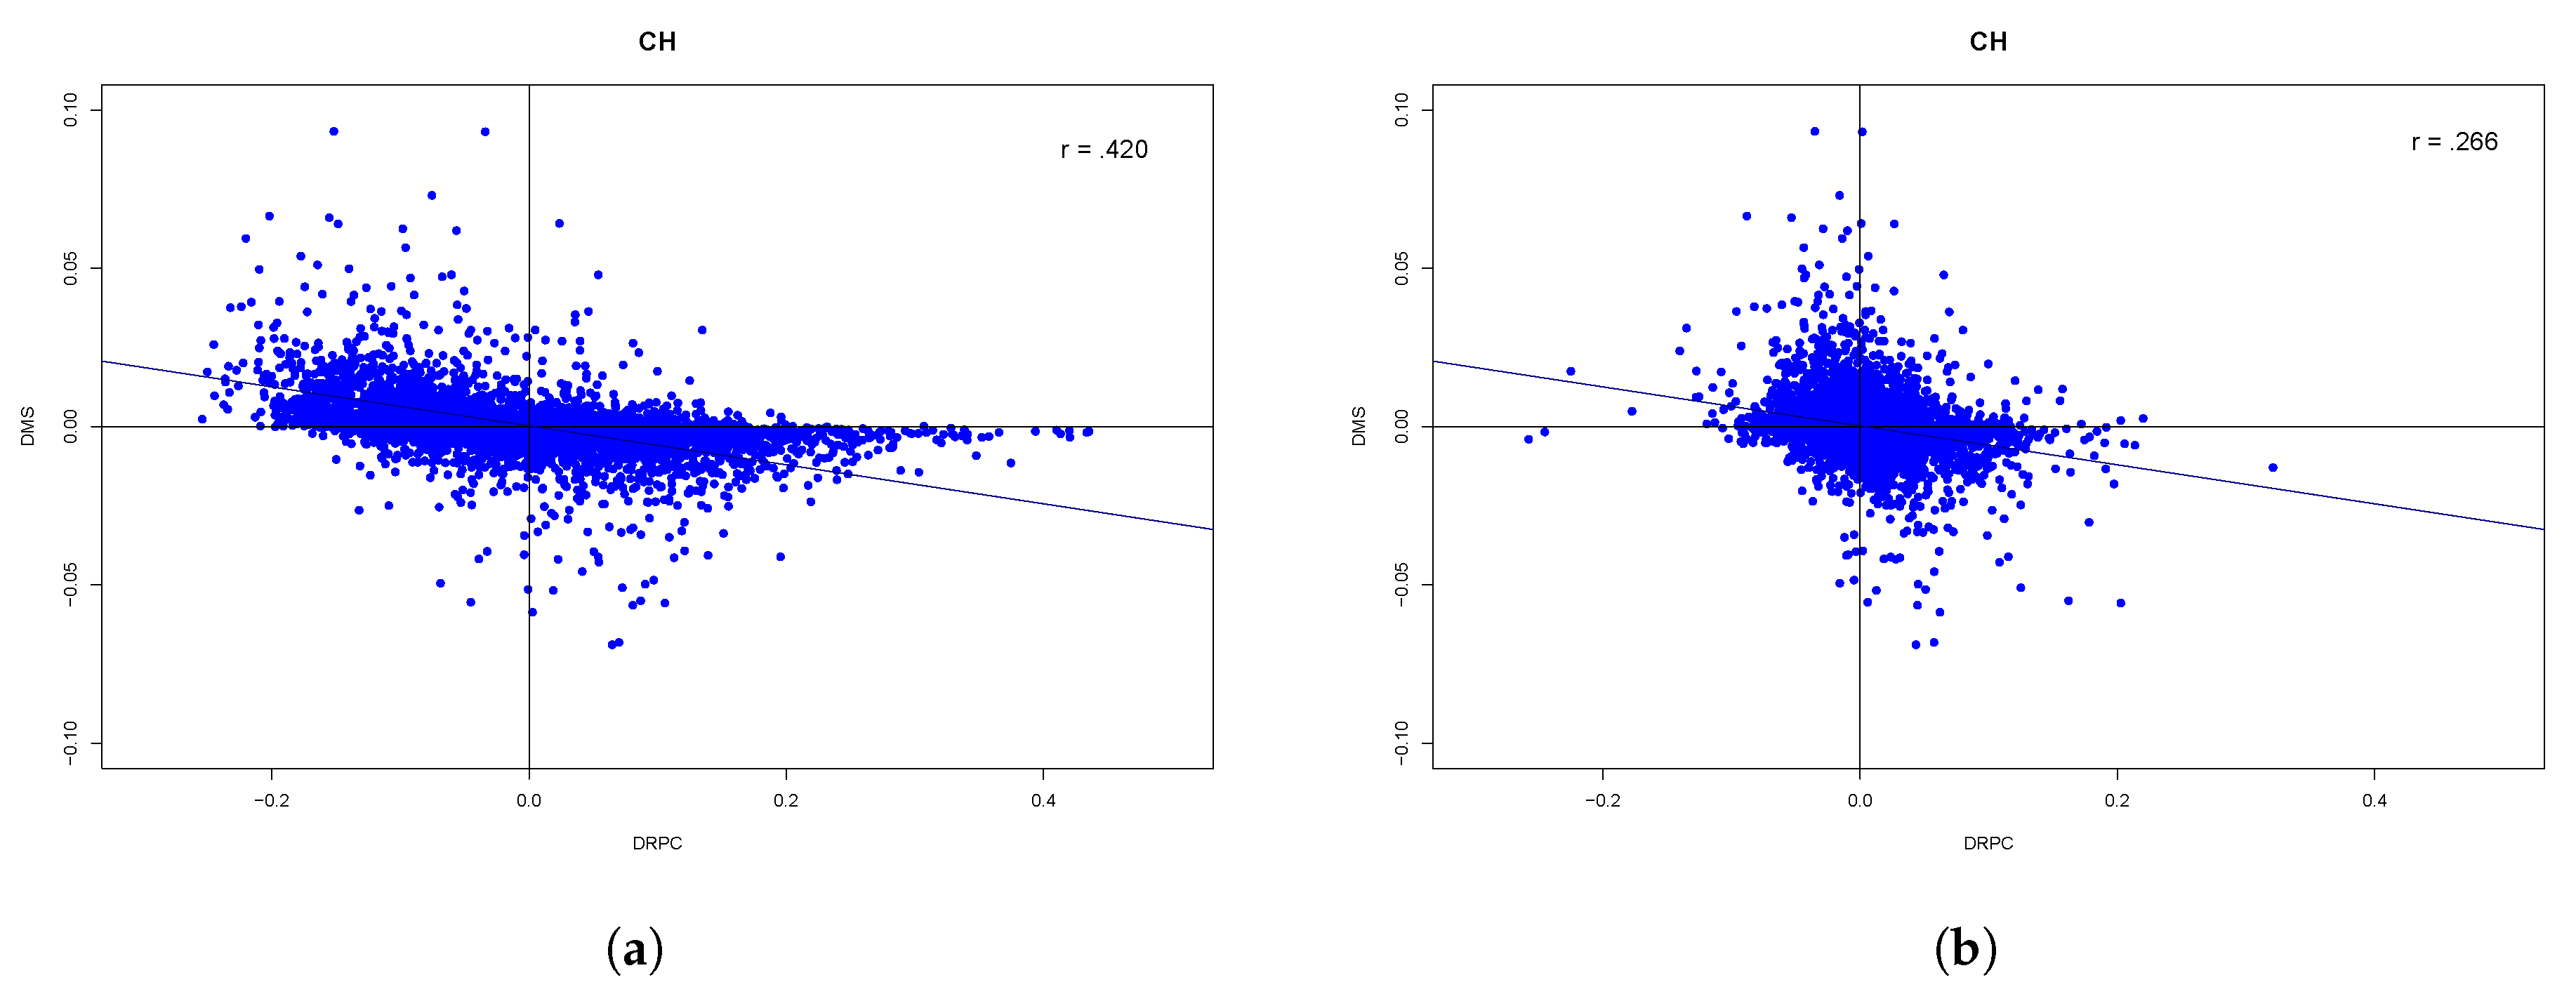
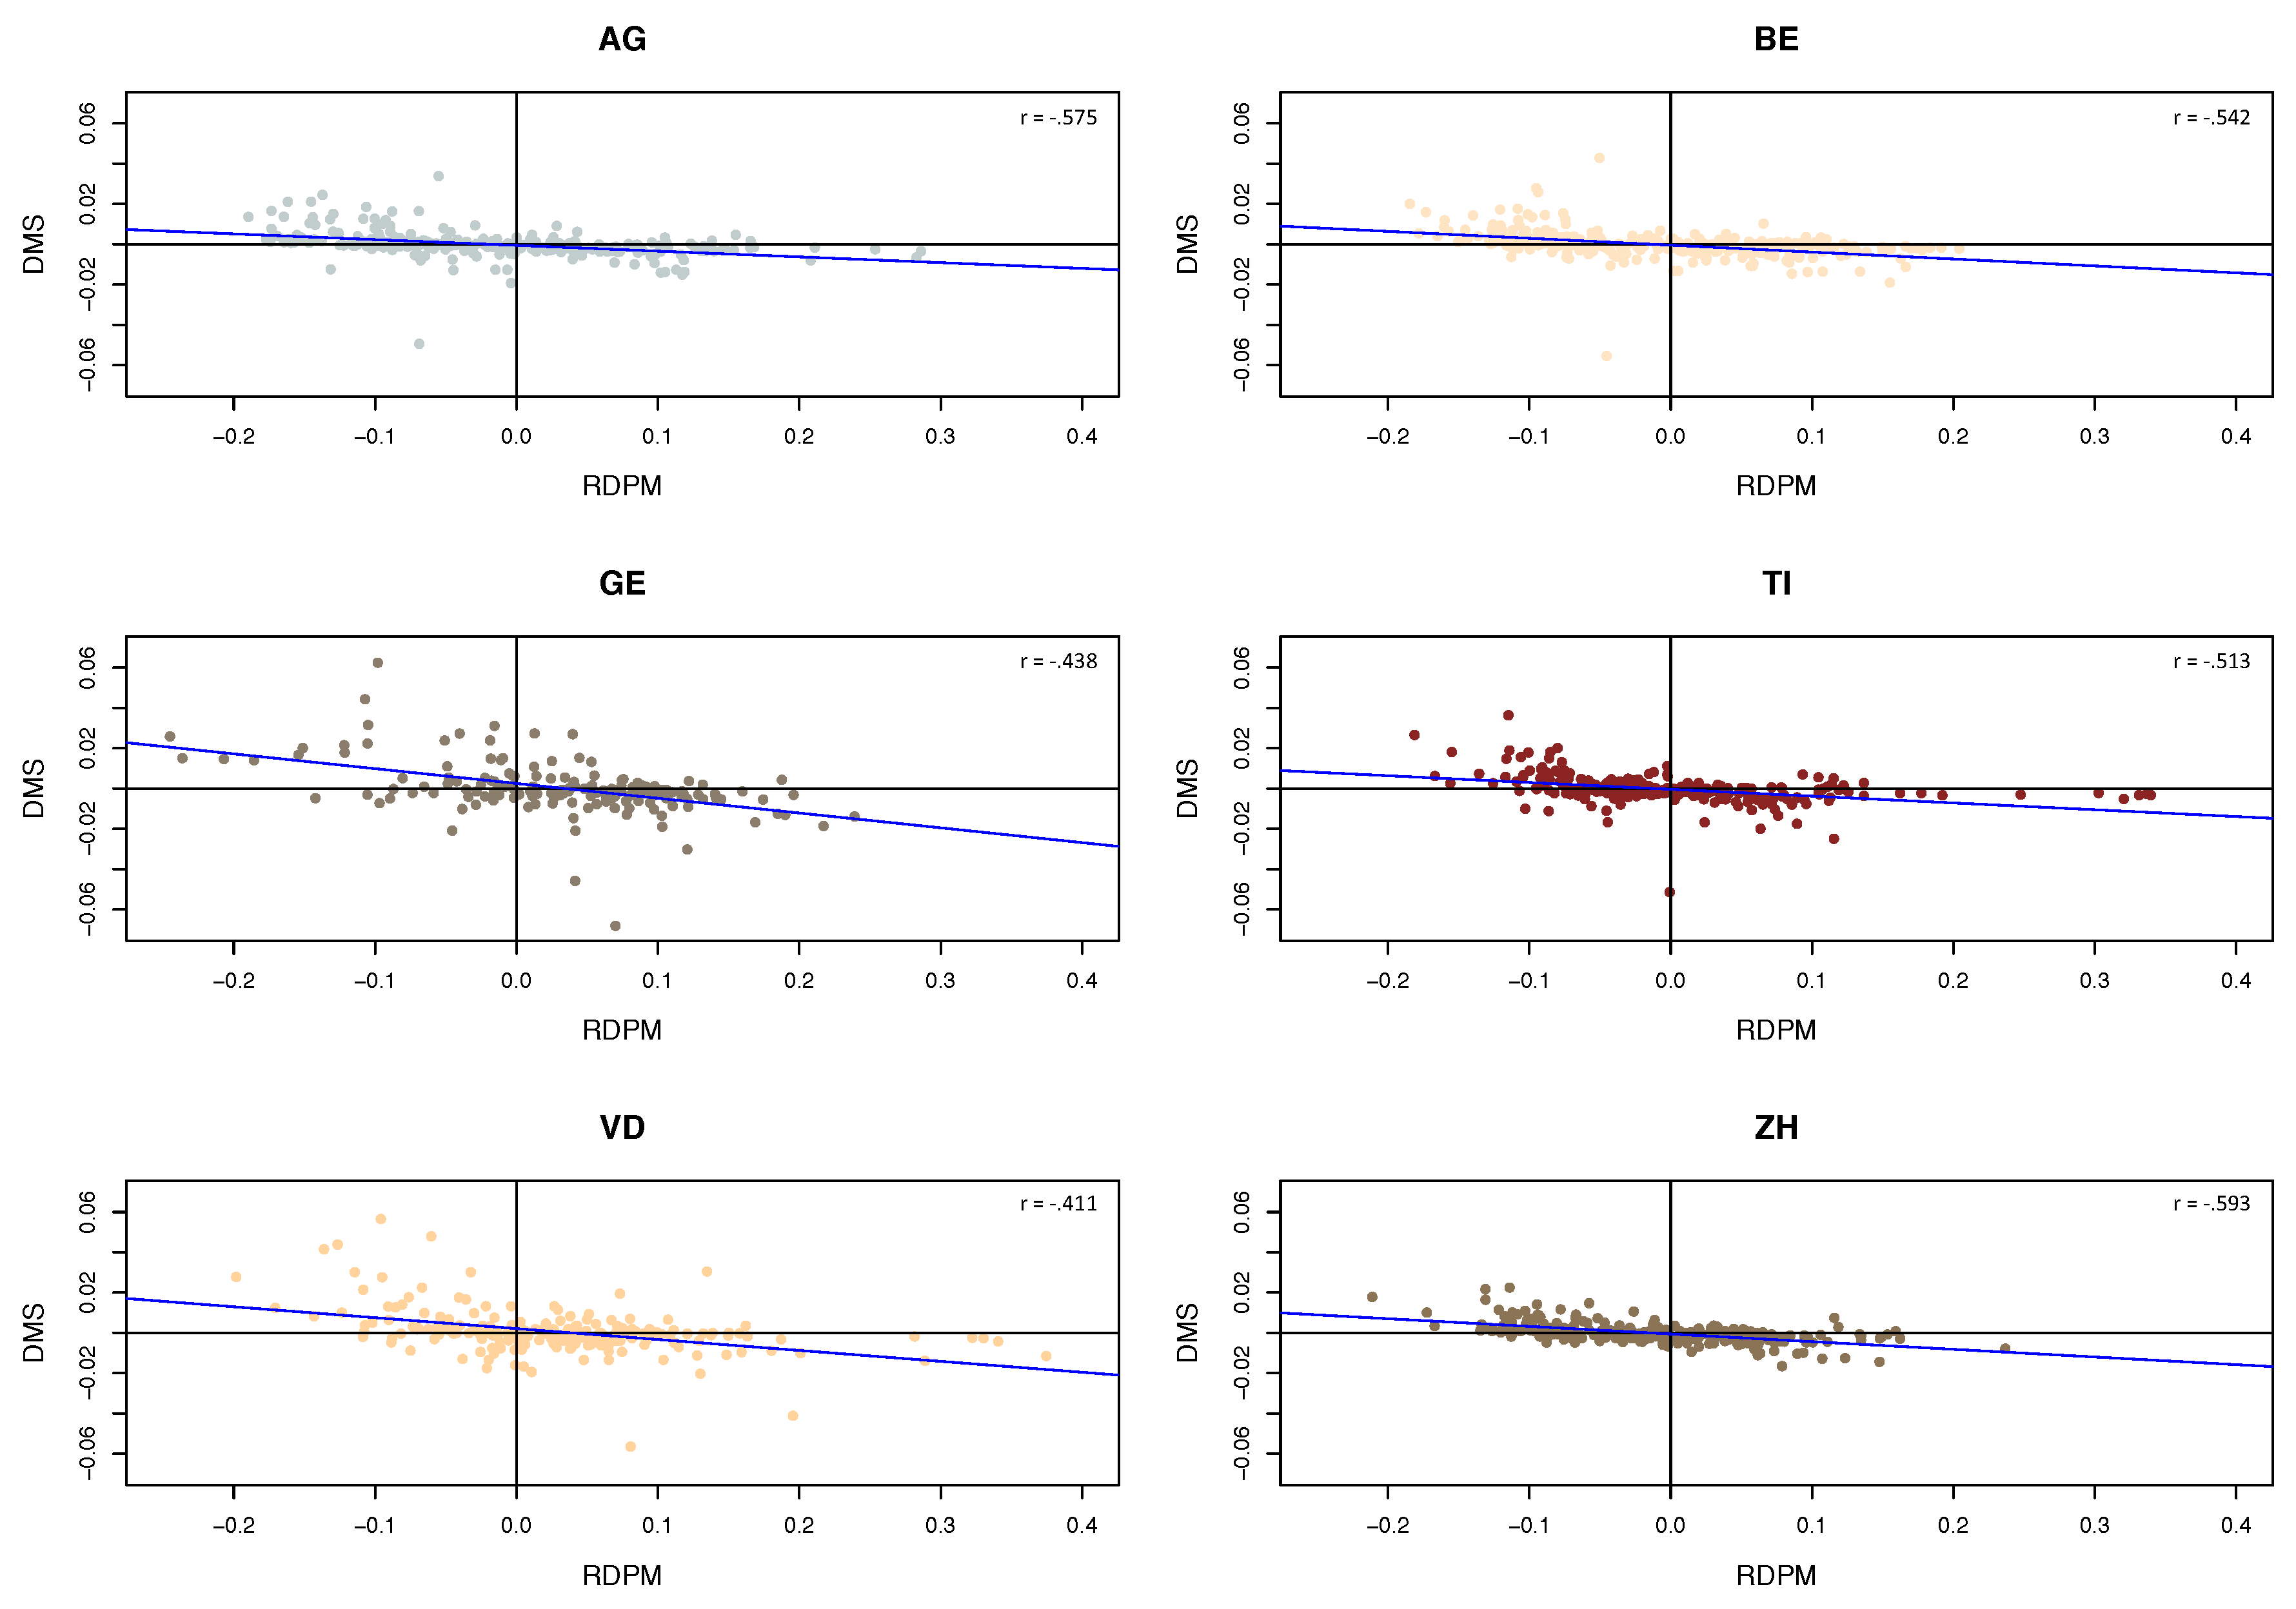
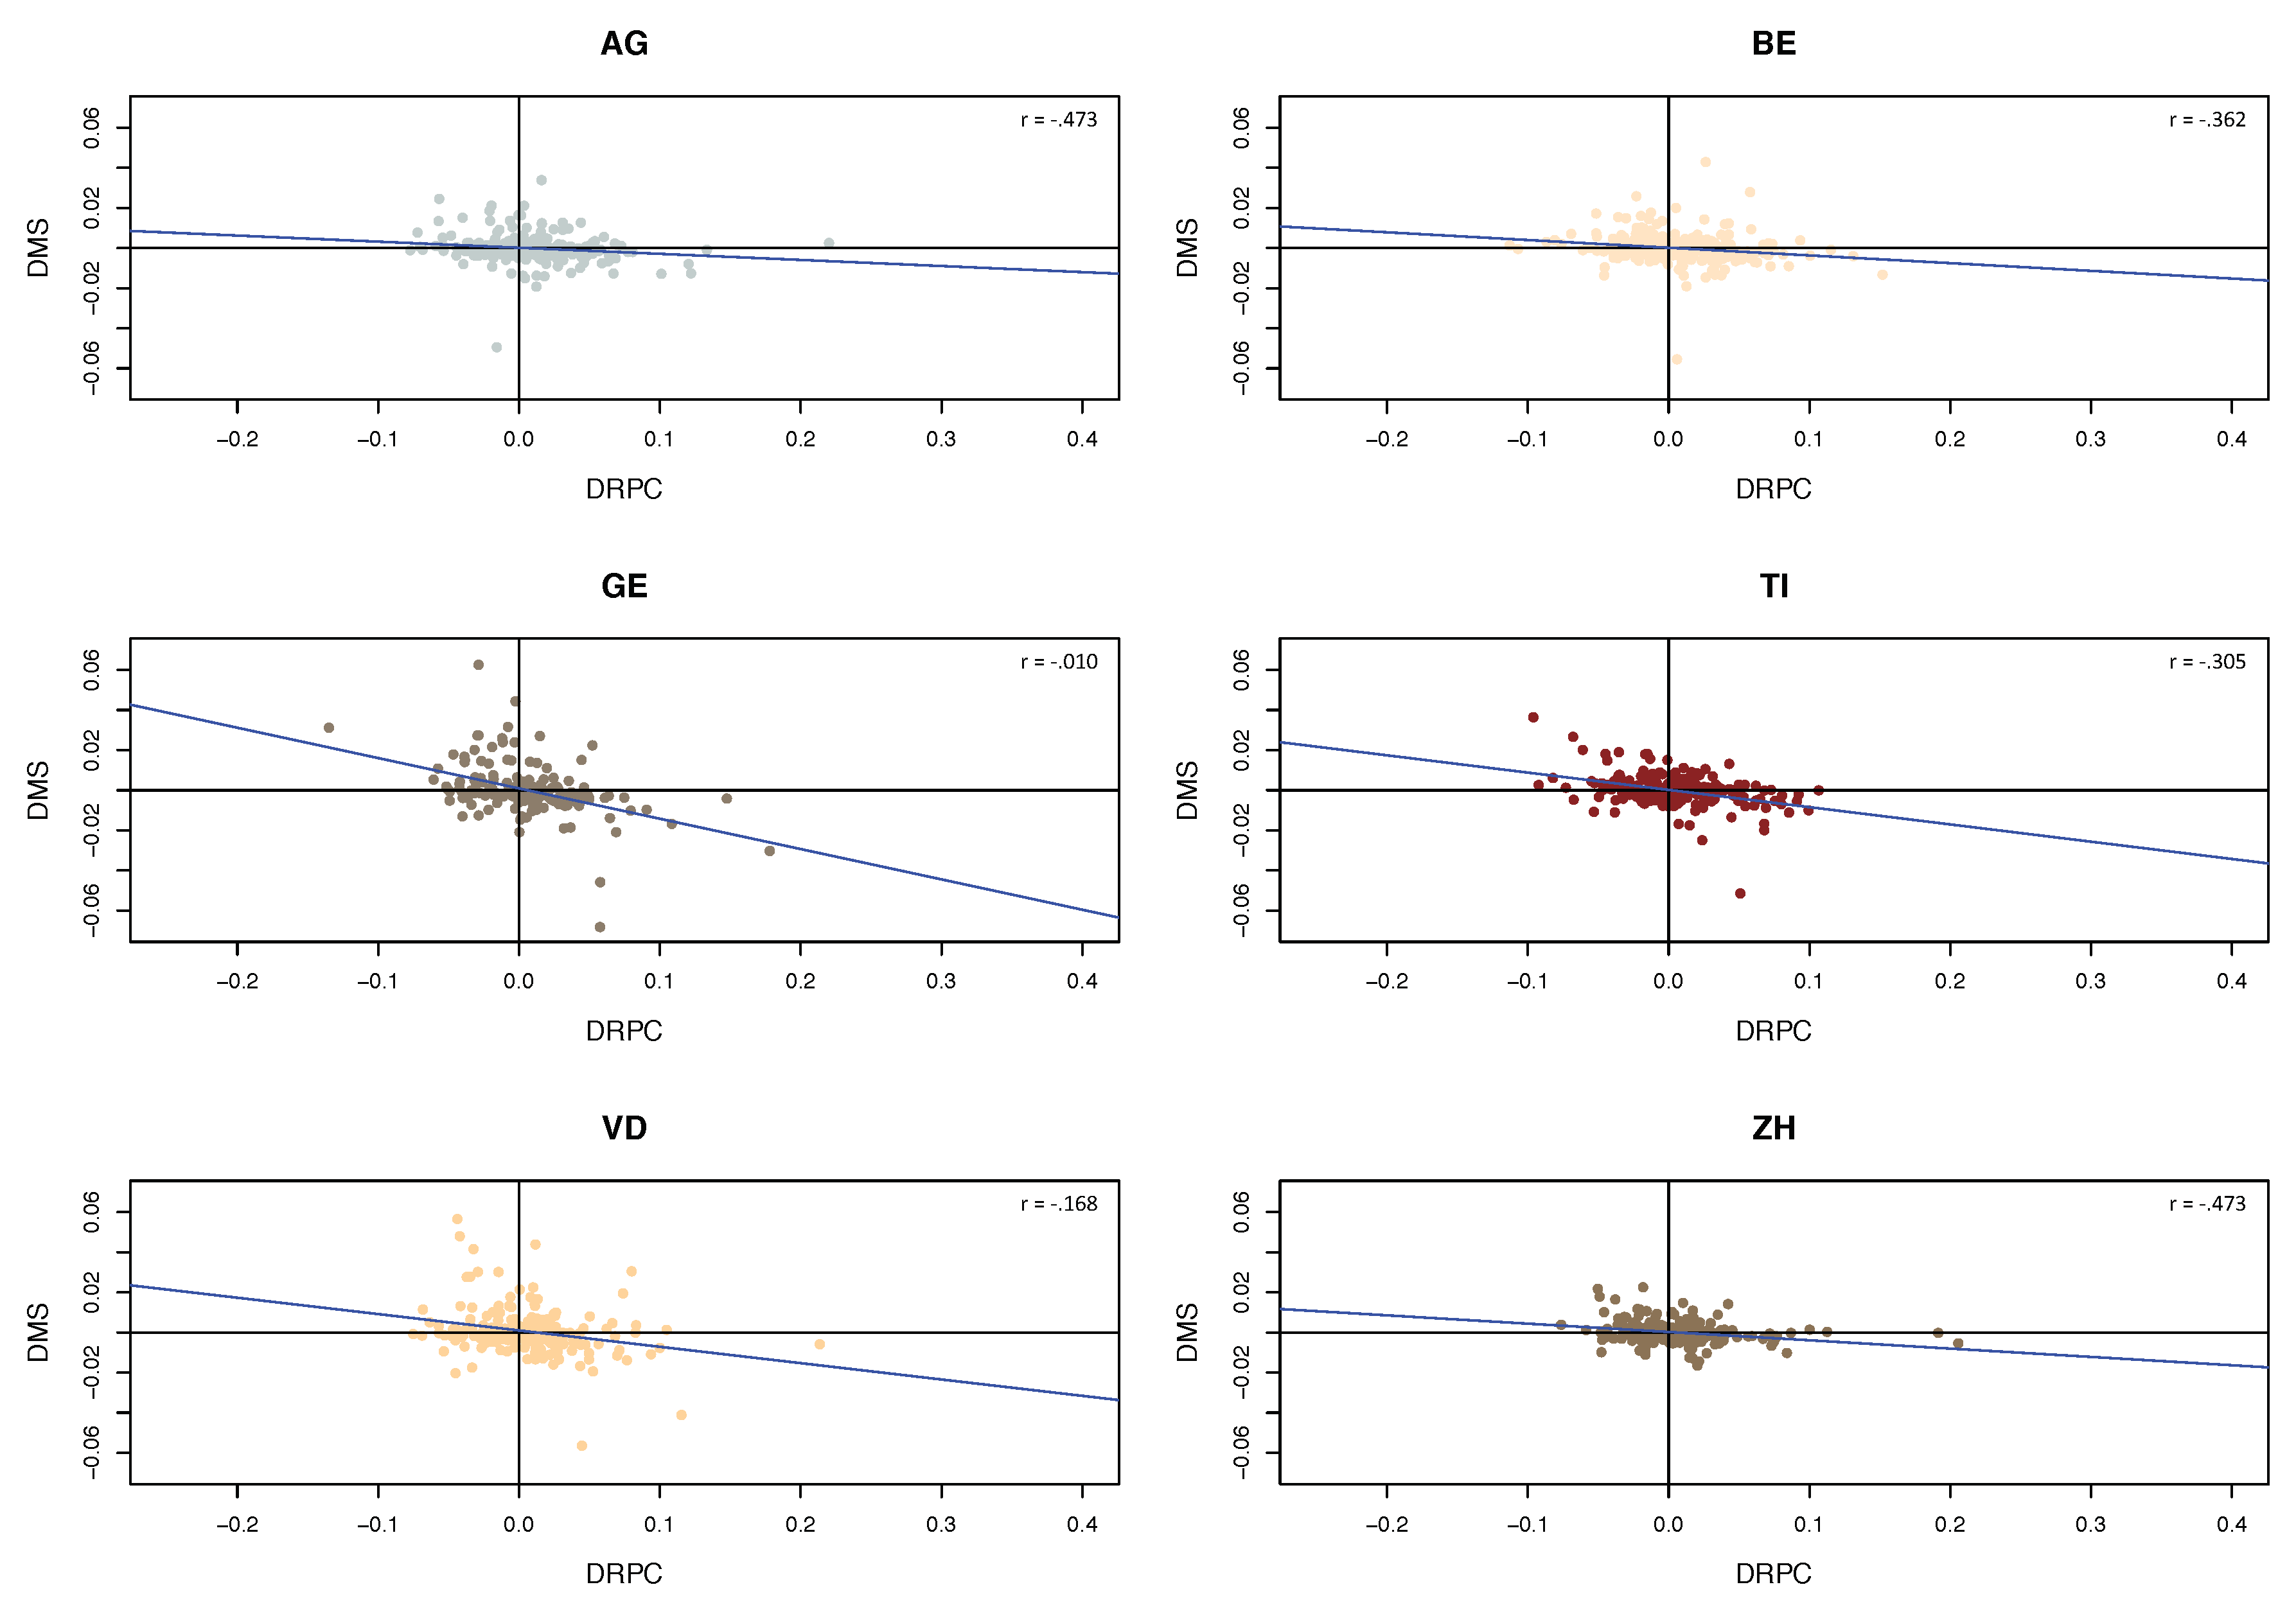
When we plot and versus for all Switzerland (Figure 9a,b), one can observe that the relationship is not linear. One possible explanation is that the plot mixes data points from all cantons and that the influence of the variables on the market shares differs in different cantons, in a superposition of different slopes. The value of the correlation coefficient between and is −0.420 and between and the value is −0.266 for the 6117 data points. Figure 10 presents the relationship between and for six selected cantons. Indeed, on the canton level the relationship turns out to be more linear, with the slopes differing across cantons. In fact, French cantons have a steeper slope than others, indicating stronger reactions by insureds in those regions. A similar picture occurs when plotting versus (Figure 11), with again more pronounced slopes for the French cantons.
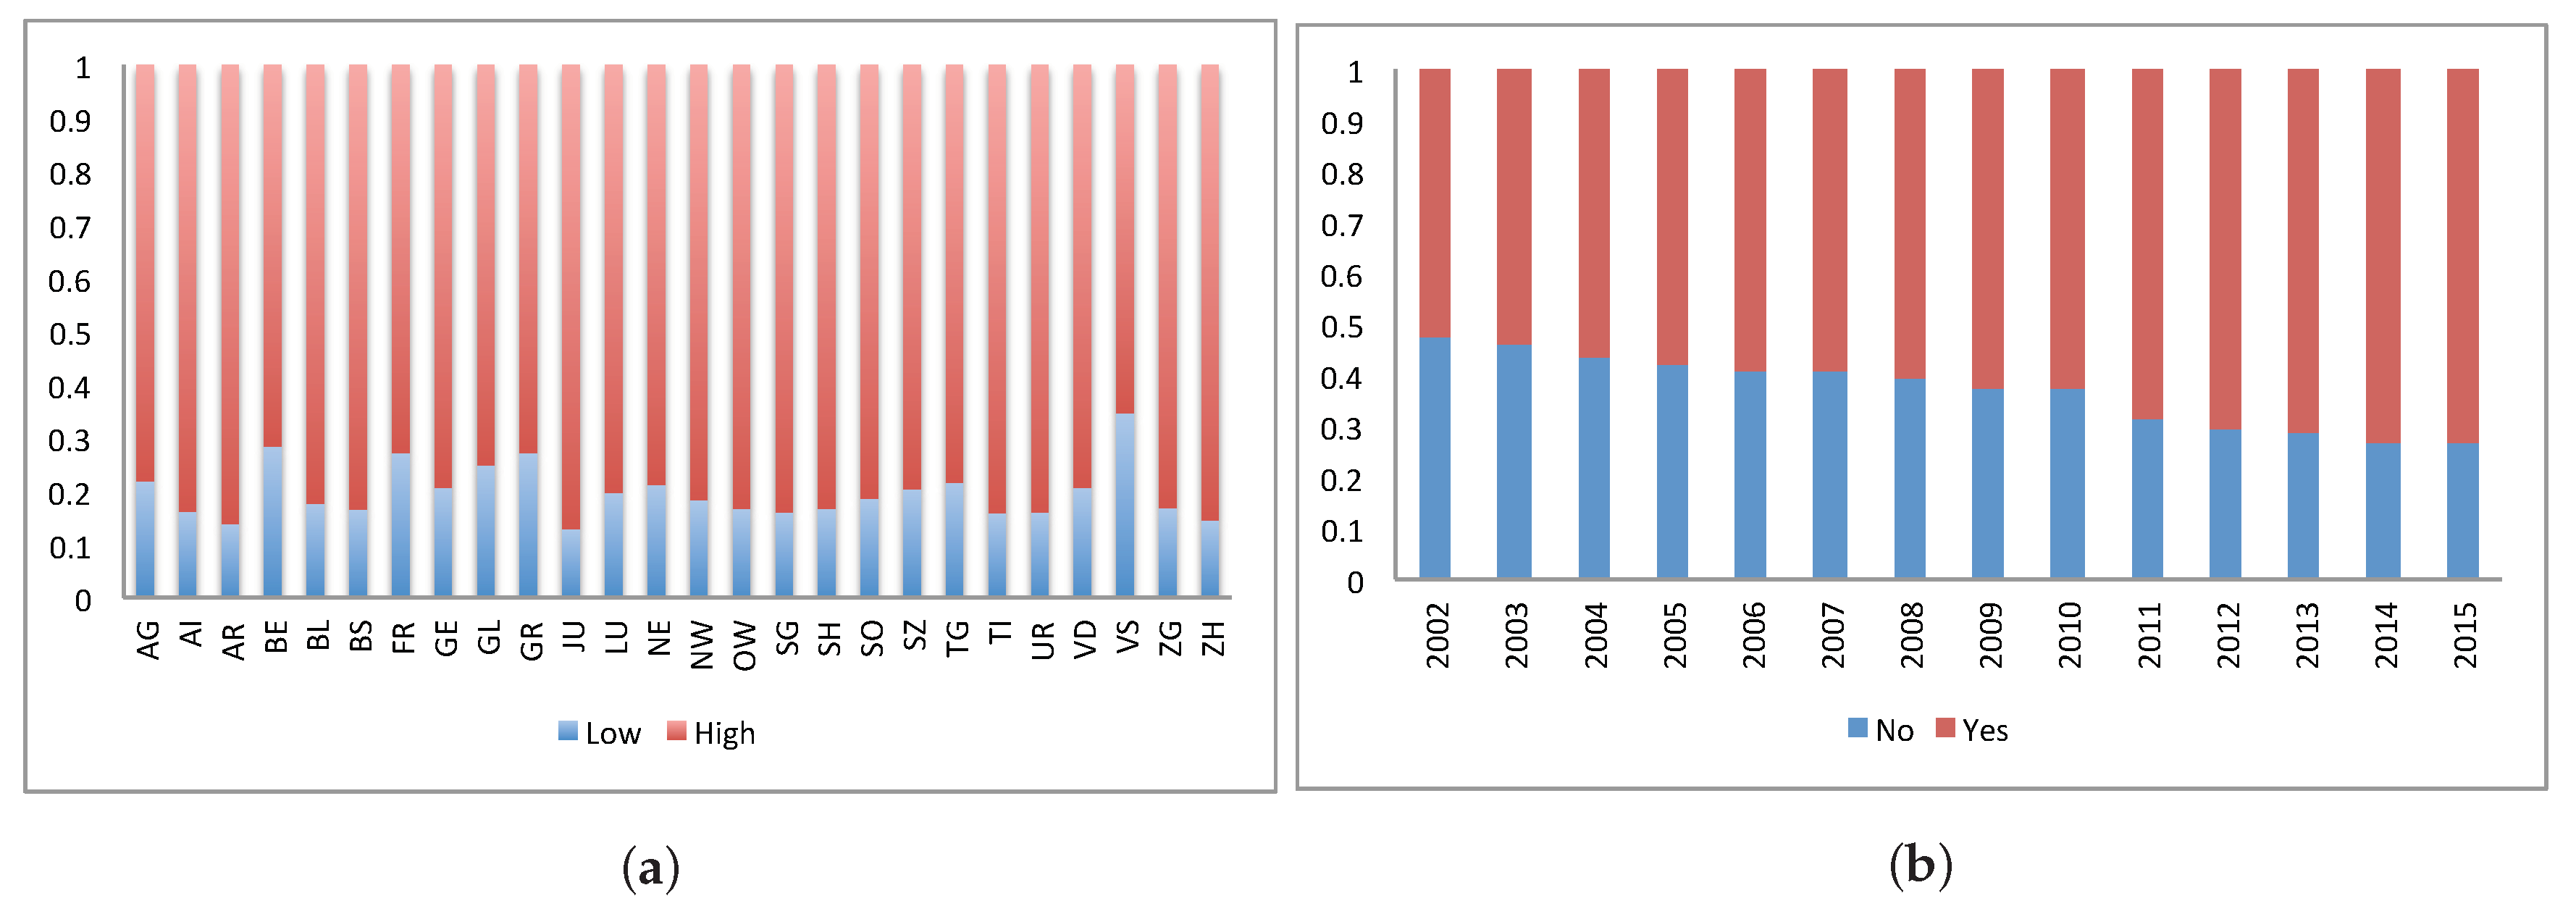
Overall the distribution of the values through all 26 cantons is shown in Figure 12a. The variation in the distribution between the cantons can been seen with ZH and TI having over data points of high ranked insurers and only of low ranked insurers. BE has more than data points of lower ranked insurers. One explanation could be that the insureds in BE are more sensitive and critical to service level. Figure 12b shows the percentage of data points of insurers with group affiliation per year from 2002 to 2015 (variable ). The percentage of insurers that are not affiliated with a group reduced during the years from in 2002 to in 2015.
3.3. Regression Models
To address the research questions () - (), we first construct a set of linear models (). As the number of data points is limited for each canton, we define () with single regressions testing the hypotheses of a linear relationship one by one, namely that the difference in market share () depends on the relative difference between the premium and the market premium (), the difference between the relative annual change in the premium and the market premium (), the service level () and the group affiliation () in a significant way. To see the influence of the cantons on the outcome (), we run the regression for the six selected cantons separately. We define () as:
where is the intercept, is the coefficient for the independent continuous variables , and the binary categorial variables and and are error terms.
Secondly, we propose a multivariable linear model () including both continuous premium-related variables:
Here is the intercept, are the coefficients for the independent continuous variables and , and are error terms.
Figure 13 shows the histogram of for the entire dataset together with a normal and a two-sided lognormal fit. Clearly the normality assumption is violated, and the two-sided lognormal assumption seems to be a much better description for the data. For a quantitative comparison in terms of AIC on the resulting residuals, we refer to Section 4. We therefore suggest to perform the linear regressions () and () with two-sided lognormally distributed residuals. The corresponding needed statistical methodology seems not be available in the statistical literature and is hence given in the Appendix A. In Section 4 we compare the results and Q-Q plots of the residuals from the regressions with normal residuals and with the two-sided lognormal residuals. We will see that for individual cantons the normality assumption is better fulfilled, however, the regression with two-sided lognormally distributed residuals turns out to fit better in these cases as well.
4. Testing the Regression Models and Results
First we test the classical regression with normally distributed residuals. The results for model () with normal residuals are presented in Table A3 in the Appendix A including the coefficients with their standard deviation and the adjusted as the criterion for goodness of fit. They show that the explanatory variables, and , are very significant in the six cantons and for Switzerland. Service level and group affiliation are not significant explanatory variables in most of the cantons.
We also conduct a linear regression analysis with normal residuals for the multivariate regression model () with and as explanatory variables in the selected cantons and for the entire dataset and we report the results in Table A4 including the variable coefficients (), the significance level with standard deviation (in brackets), the standardised coefficients (), the adjusted R and number of observations. Both explanatory variables are very significant, nevertheless a comparison of their coefficients shows that the standardised coefficients of are higher than the ones of which suggests that a change in has a higher effect on than a change in . The coefficient values vary as a function of the canton with highest values in GE and lowest in AG. The adjusted values are higher than in the set of single regressions and are between in AG and in GE and ZH.
The analysis of the residuals from the regression with the entire dataset of Switzerland (see Figure 14a) confirms that the normality assumption is not met in this case, so the validity of the results is non-satisfactory. For the individual cantons (see Figure 14b for TI as an example), the results show a better agreement to the normality assumption.
In order to enhance the credibility of the findings, we conduct the linear regression () with two-sided lognormal residual distribution (according to the procedure outlined in the Appendix A) and we report the results in Table 4 including the variable coefficients and their significance. We verify the significance levels of the explanatory variables with = 5000 (see Appendix A).
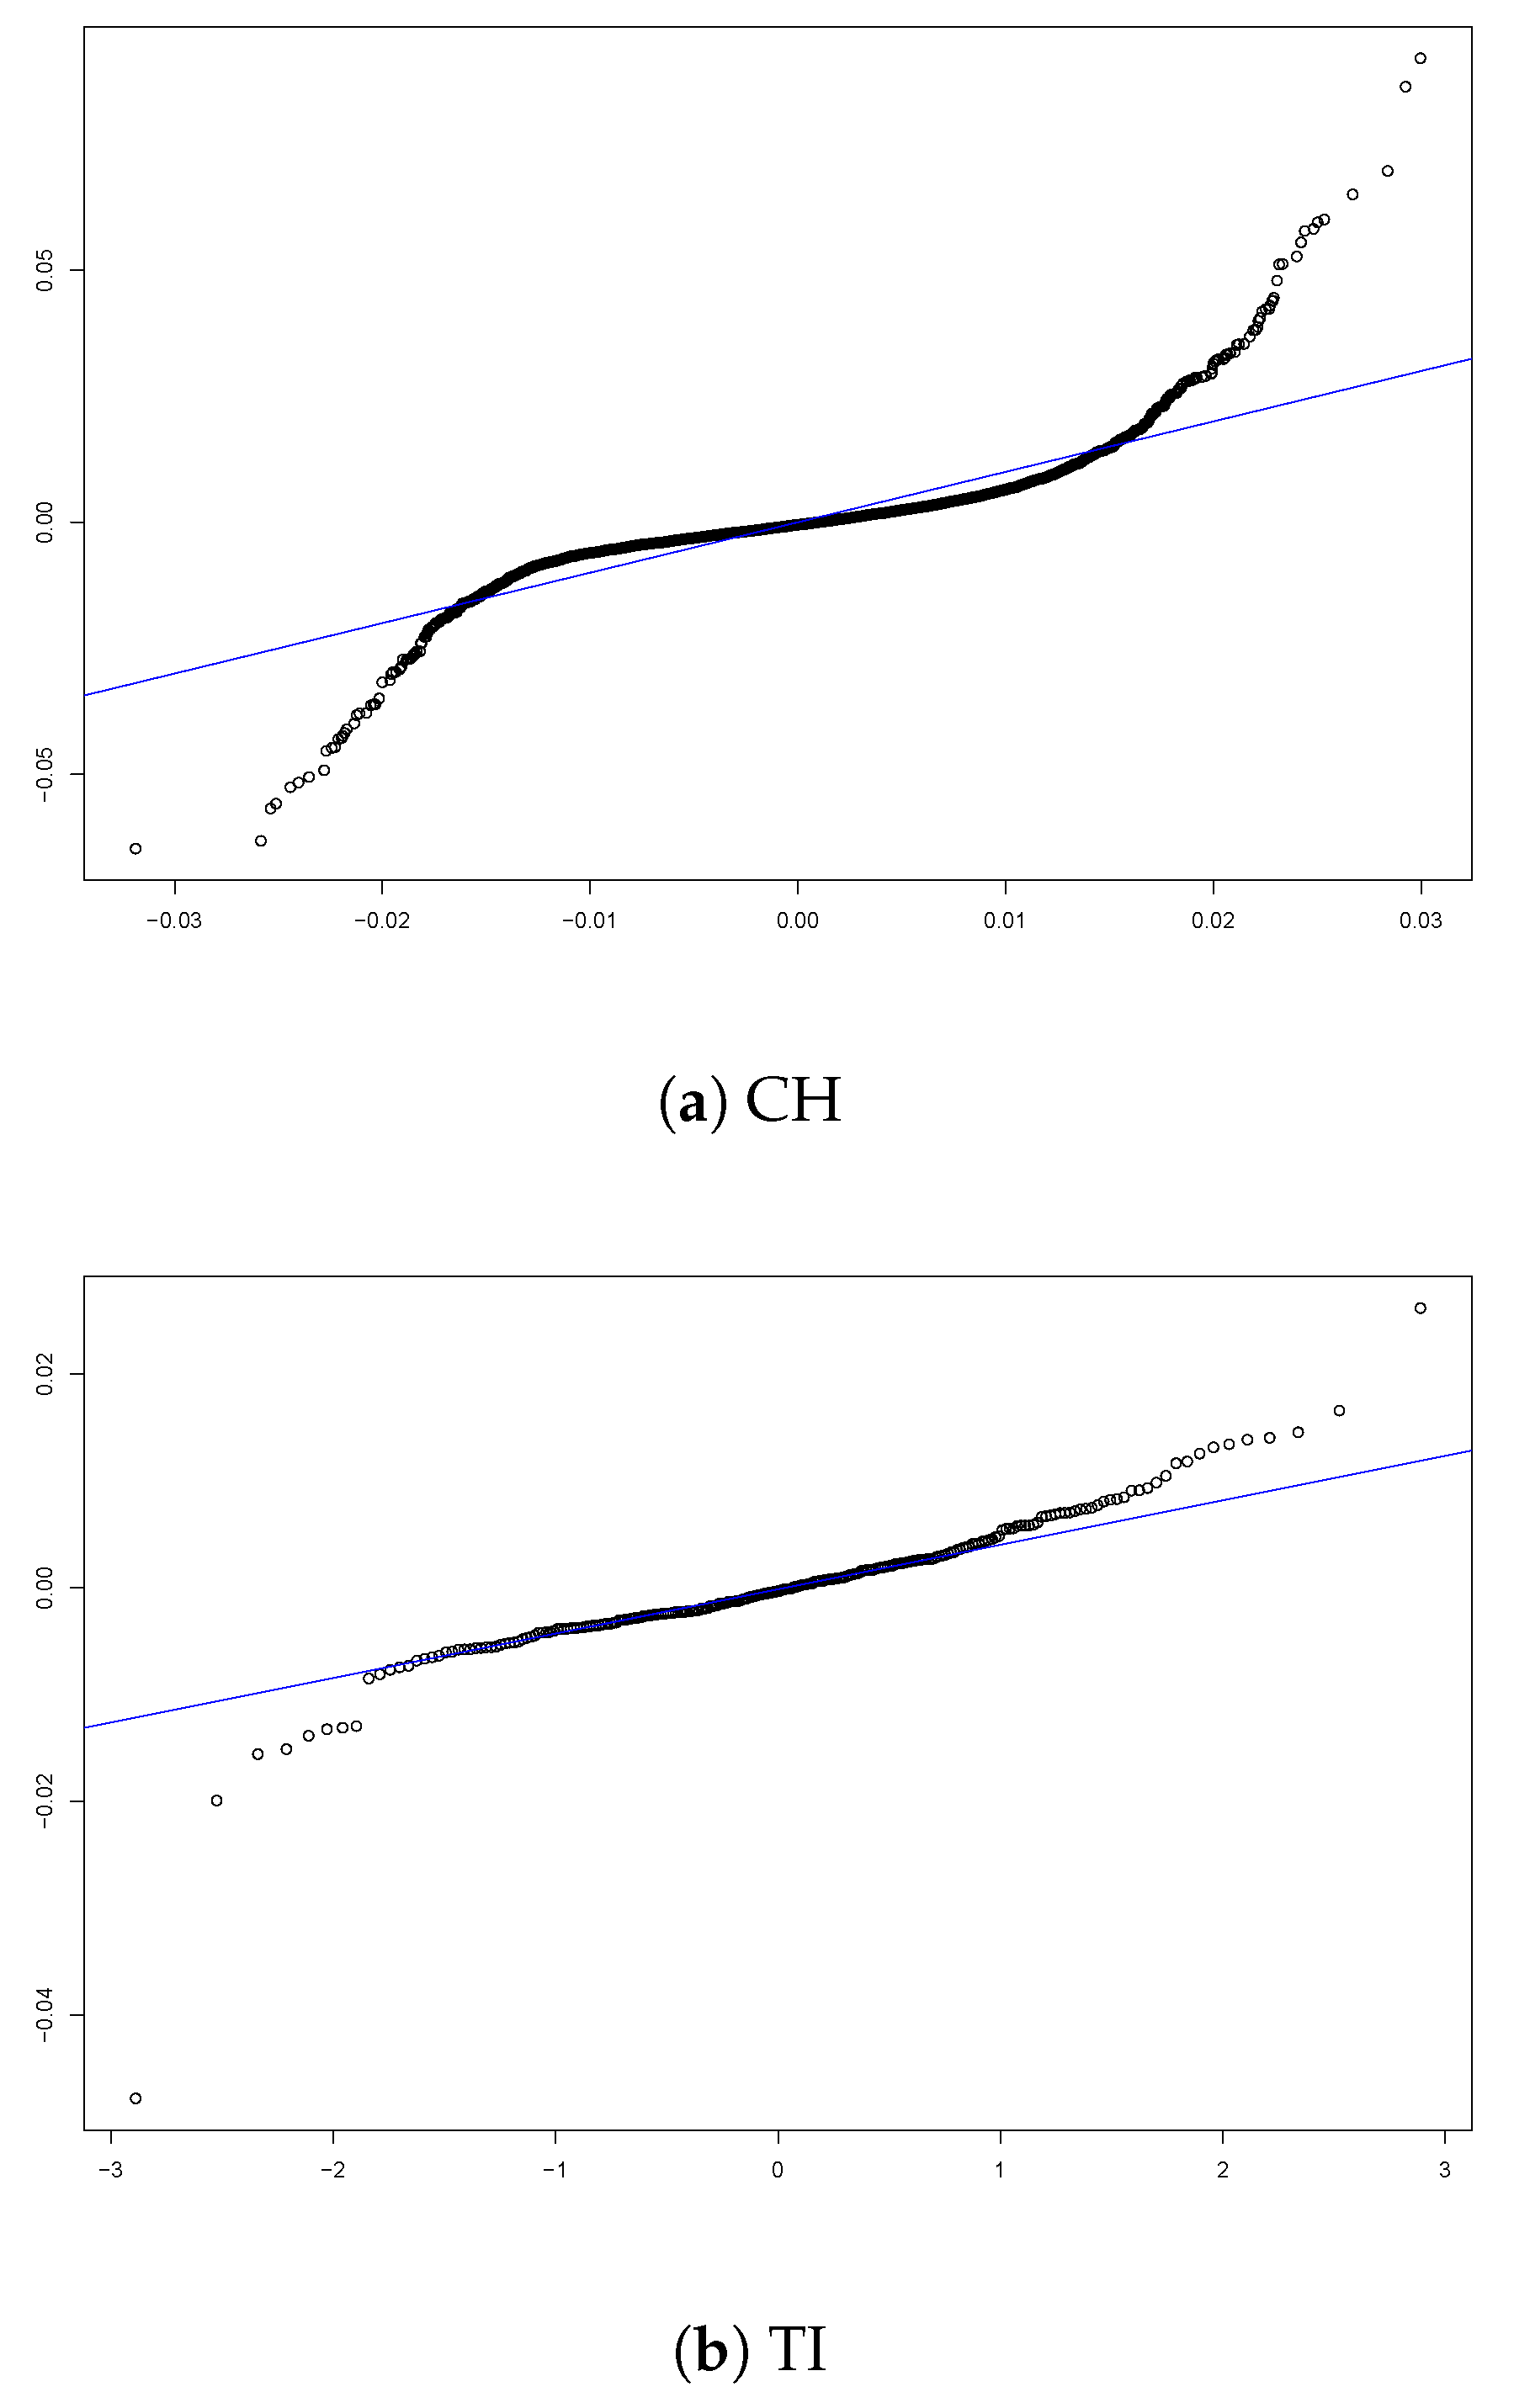
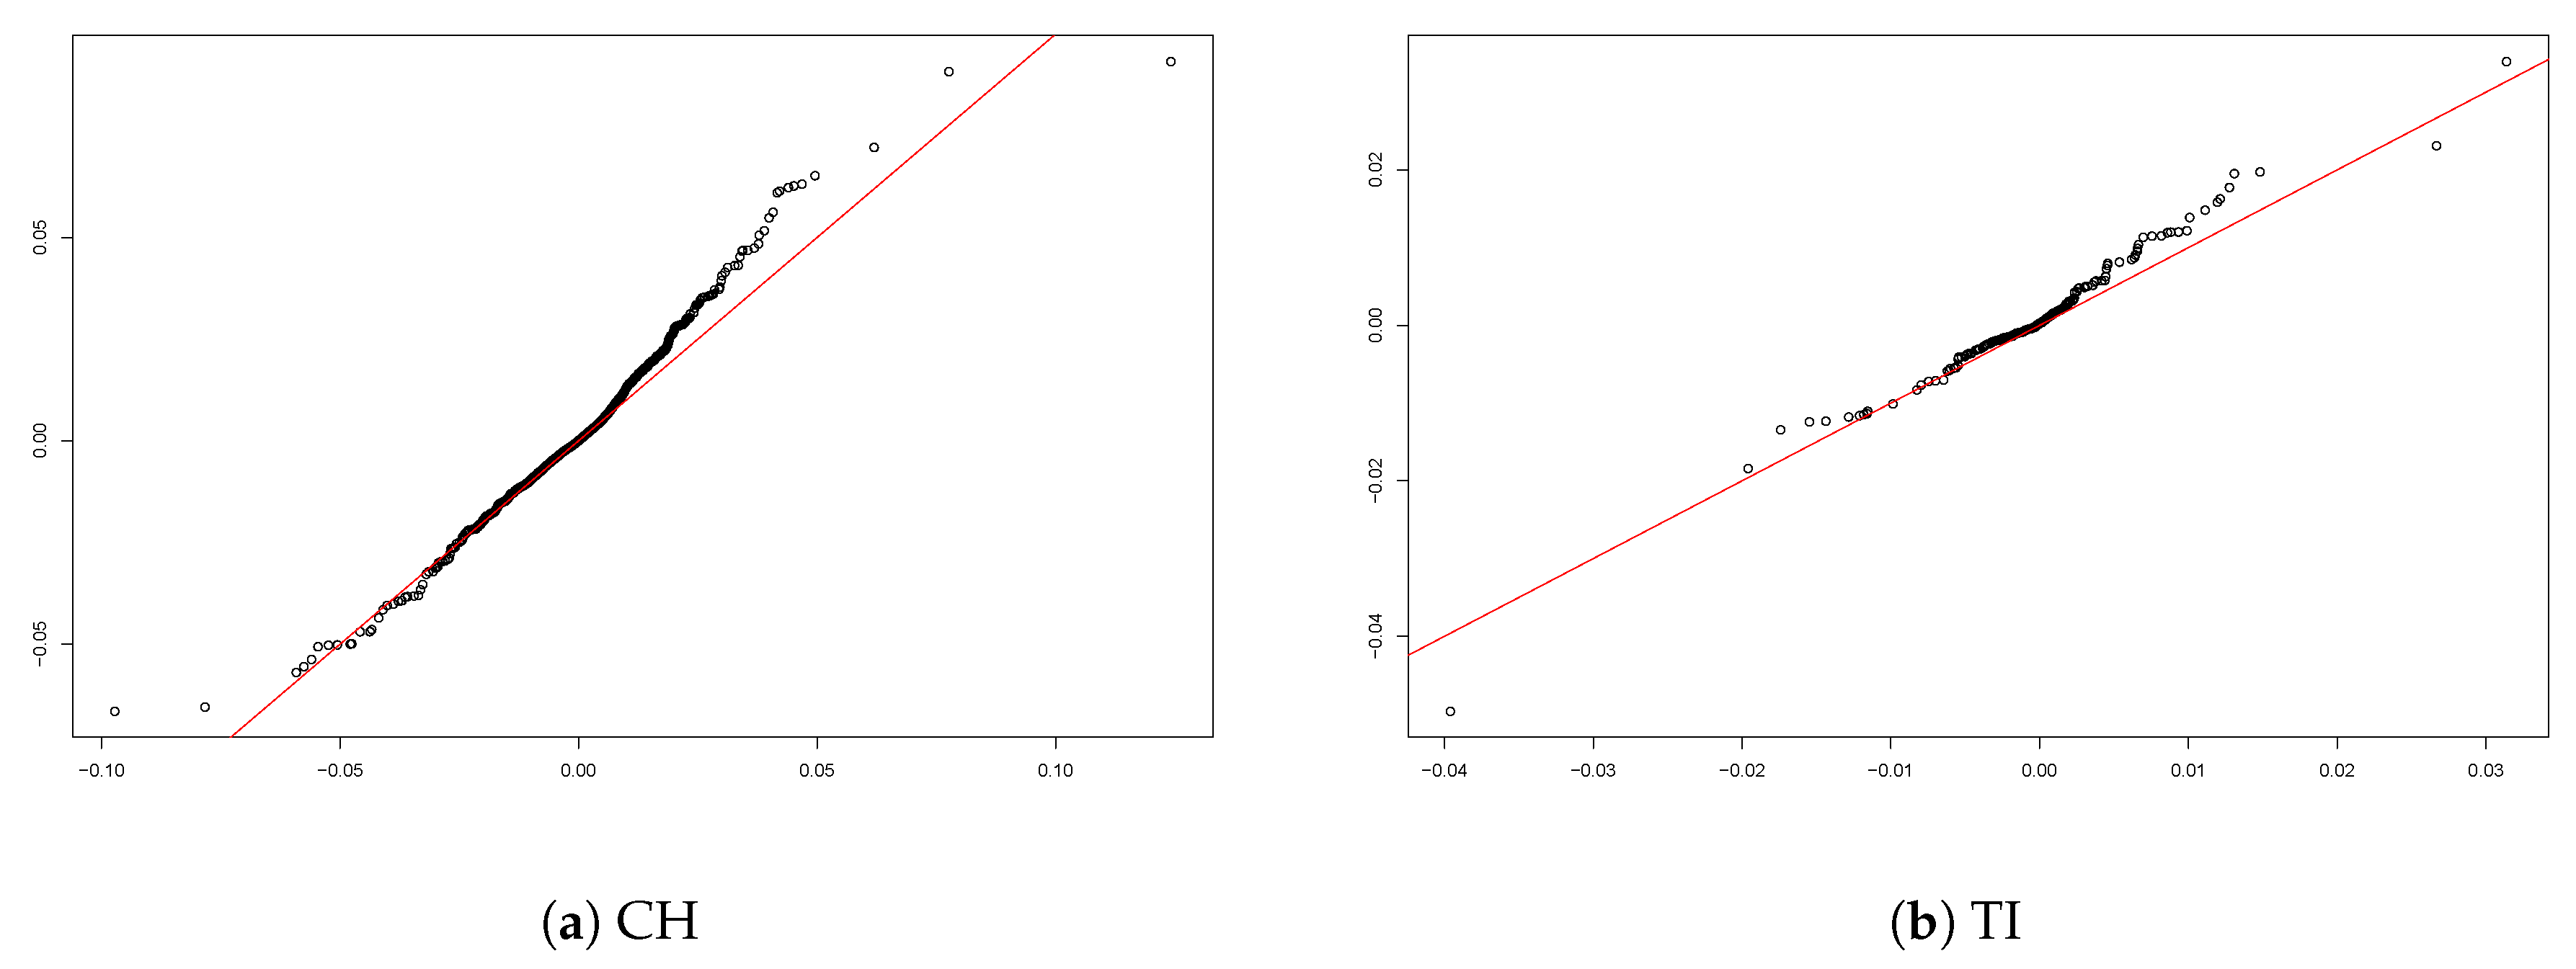
The analysis of the residuals in the case of the entire dataset of Switzerland (Figure 15a) confirms the excellent fit of the two-sided lognormal model with 47,257 compared with −42,120 under the normality assumption. Figure 15b shows the Q-Q plot of the residuals for TI (as an example for the performance on the cantonal level) and confirms a better fit than the model with normal residuals (compare with Figure 14b). The two-sided lognormal model fits the data better in the other individual cantons as well.
When considering the results from the regressions with normality assumption and two-sided lognormal assumption, we notice that:
- , the relative difference between the insurer’s and the market premium, is the most significant explanatory variable with very high significance level in all cantons and with the aggregated data for all Switzerland in both regressions. The coefficient values of are always negative which indicates the negative relation between the dependent variable and the explanatory variable . The coefficient values with normal residuals are always higher (in absolute value) than the ones with the two-sided lognormal residuals.
- , the difference between the insurer’s and market annual premium change, is a significant explanatory variable with negative coefficient values, meaning that a larger value of the difference between the relative change in annual premium and the relative change of the market premium causes a diminution in market share. However, for the model with two-sided lognormal residuals, in AG the is not a significant explanatory variable and the coefficient value is only − compared to − under the assumption of normal residuals.
- The intercept of the multivariate regression () has positive values in GE and VD and negative values in the German cantons. As the number of insurers in GE and VD reduced along the years of our study, naturally, even with zero values of the explanatory variables, the insurers’ market shares grow and vice-versa for the German cantons.
We summarise the results in the following: The relative difference between the insurer’s and the market premium is the most significant variable and the coefficients of have negative value. A lower premium than the market premium can hence be seen as a significant driver of increasing market share, cf. (Q1). Further the difference between the relative annual change in the insurer’s premium and the relative annual change in the market premium is a significant explanatory variable with negative coefficient values. Higher relative annual increase in premium than the market premium thus significantly leads to decreasing market shares, giving an affirmative answer to (Q2) for the data set under study. As for (Q3), the study on our data suggest that satisfaction level is not a significant variable in this context. Concerning (Q4), group affiliation does not seem to affect the dependent variable. Finally, as a response to (Q5), the regression results differ among the cantons which suggests that the canton is a relevant factor.
5. Concluding Remarks
The Swiss health insurance market has changed dramatically in the years since the introduction of the mandatory health insurance in 1996. The number of insurers offering health insurance plans decreased extensively from 145 insurers in 1996 to 58 in 2015 and the annual premiums increased from an average annual premium of CHF 1917 in 1996 to CHF 3286 in 2015. We analyse the effect of different variables such as premium, satisfaction level and group affiliation on the market shares of the insurers in the different cantons. We define a model with the market share as dependent variable and four explanatory variables and study their significance in data of the mandatory health insurance for the years from 2002 to 2015.
Our regression results support the intuition that the difference between the insurer’s premium and the market premium is strongly negatively correlated to the market share. Our results also suggest a significant impact of premium change from one year to another. Satisfaction level, however, can not conclusively be confirmed to be statistically relevant. One explanation can be that customers in Switzerland are in general satisfied with their insurer and the small differences in satisfaction levels do not affect the market shares much. Our findings also suggest that belonging to a group of insurers does not result in a significantly higher market share. Note that as a particular by-product of our study the numerical values of the obtained coefficients in the regression models helps to assess the sensitivity of the market on the various drivers.
If one has reasons to believe that the explanatory variables in the regression analysis are subject to a considerable amount of noise, one could also implement a non-parametric bootstrap procedure as for instance suggested in Pešta (2013), which we leave for future studies. Additional investigation of other explanatory variables such as age, education level, health status and possession of complementary insurance is suggested for future research according to the availability of such data. As the available panel dataset is growing every year with the publication of new data, it will be possible to add explanatory variables without the risk of overfitting the models.
Author Contributions
Methodology, H.A., M.B. and J.W.; Supervision, H.A. and J.W.; Writing—original draft, D.D.-A.; Writing—review & editing, H.A., M.B. and J.W.
Funding
H.A. acknowledges financial support from the Swiss National Science Foundation Project 200021_168993. J.W. acknowledges financial support from the Swiss National Science Foundation Project CRSII5_180350.
Conflicts of Interest
The authors declare no conflict of interest.
Appendix A. A Regression Model with Two-Sided Lognormal Residuals and Its Estimation
Data sometimes exhibit a linear relation between variables to a satisfactory degree, but instead of normally distributed residuals, the latter follow another distribution. For non-normally distributed residuals within the context of risk modelling see e.g., Prettenthaler et al. (2012). In the context of the application in this paper, it turns out that two-sided lognormally distributed residuals provide an excellent fit. Therefore, we develop a regression model which can be fitted to data that exhibit two-sided lognormally distributed residuals.
More specifically, let us consider a p-dimensional vector of independent variates X and a real-valued response variable Y. We propose the model
where is a p-dimensional vector of slopes and is a random variable with density
where is the standard normal cumulative distribution function. Such a density arises naturally when considering the density of the transformation , where N is a standard normal random variable, and then reflecting it at its mode, and finally centering it such that the symmetry point is the origin. Observe that a direct consequence of this construction is that it has mean zero. Another consequence is that the tails on both sides of the origin are heavy-tailed, with lognormal behaviour. We hence denote the above density as a two-sided lognormal density, with the name carrying over for the variable , the cumulative distribution function , and so on.
We are interested in the estimation of the slope parameter vector above. For the fitting of a Gaussian linear model, least squares are used, which coincides with maximum likelihood estimation. Here, we adopt the maximum likelihood approach as well, but now the geometrical interpretation of least squares is lost, due to the form of the density . Given some observed covariates , where each is a p-dimensional vector, and variates , where each is a real number, the likelihood of the model for the parameters and is given by
and the maximum likelihood estimates are
which can be computed numerically.
Appendix A.1. Testing Significance between Nested Models
Whenever two nested models, with resulting maximum likelihood estimators
are fitted, it is of importance to know the significance of the additional parameters in with respect to the more basic model. The way this is done for Gaussian errors is by regarding the simpler model as true, and under this assumption determining the distribution of the extra parameters in the more complicated model. The resulting distribution helps to assess how likely it is to see parameters of the magnitude that were estimated (or even larger), obtaining in such a way a p-value. Presently, the distribution of the extra parameters given the simpler model is complicated to obtain, so we use Monte Carlo simulation.
Furthermore, given an estimator , testing for the significance of a single entry of the vector, say, , , is equivalent to fitting a model without that entry, and comparing that simpler model with the full model. That is, regarding the -dimensional model as true, and determining the distribution of for the p-dimensional model, such that we can say how likely it is to observe a value such as , or of larger magnitude. Since this is the most common and directly interpretable way of assessing significance, we describe the Monte Carlo algorithm only for . Analogous algorithms can be deduced for , but significance intervals must then be replaced by suitable significance regions.
Algorithm 1.
- Fit the two-sided lognormal regression model () with p slope parameters to the data (). Let the resulting maximum likelihood estimator be denoted by
- Fit the two-sided lognormal regression model () with slope parameters which is formed by deleting the i-th slope parameter from the model in the previous step to the data (). Let the resulting maximum likelihood estimator be denoted by
- Simulate times from model , that is, create
- Fit p-dimensional (full) two-sided lognormal regression models to each simulated response, resulting in the replicated estimators and denote the empirical distribution function of by , .
- Define the p-value of the parameter as
Appendix A.2. Goodness of Fit
Having fitted and chosen a model, it is customary to look at the residuals , , as a goodness of fit diagnostic. Analogous to the Gaussian linear models, we look for homogeneous dispersion of the residuals, with their distribution now being two-sided lognormal rather than normal, we suggest here a QQ-plot of against theoretical standard normal quantiles, and visually expect a straight line when the fit is adequate.

Table A1.
Key figures on the Swiss health insurance market from 1998 to 2015.
| Year | Number of Insurers | Average Number of Insureds (1000) | Average Premium Per Insured (CHF) | Gross Expenses Per Insured (CHF) | Total Premium (CHF mio.) | Gross Expenses (CHF mio.) | Total Operating Result (CHF mio.) |
|---|---|---|---|---|---|---|---|
| 1998 | 118 | 7247 | 1754 | 1935 | 12,708 | 14,024 | −0.03 |
| 1999 | 109 | 7271 | 1793 | 2011 | 13,034 | 14,621 | −49.39 |
| 2000 | 101 | 7265 | 1850 | 2131 | 13,442 | 15,478 | −305.95 |
| 2001 | 99 | 7301 | 1917 | 2244 | 13,997 | 16,386 | −789.7 |
| 2002 | 93 | 7345 | 2091 | 2328 | 15,355 | 17,096 | −223.67 |
| 2003 | 93 | 7373 | 2281 | 2431 | 16,820 | 17,924 | 399.73 |
| 2004 | 92 | 7384 | 2442 | 2592 | 18,030 | 19,140 | 514.14 |
| 2005 | 85 | 7436 | 2487 | 2736 | 18,496 | 20,348 | 171.42 |
| 2006 | 87 | 7478 | 2583 | 2755 | 19,315 | 20,603 | 490.95 |
| 2007 | 87 | 7538 | 2612 | 2863 | 19,689 | 21,579 | 178.66 |
| 2008 | 86 | 7616 | 2586 | 2984 | 19,692 | 22,722 | −755.32 |
| 2009 | 81 | 7709 | 2611 | 3069 | 20,125 | 23,656 | −471.61 |
| 2010 | 81 | 7780 | 2834 | 3123 | 22,051 | 24,292 | 224.51 |
| 2011 | 63 | 7863 | 3005 | 3171 | 23,631 | 24,932 | 587.67 |
| 2012 | 61 | 7953 | 3075 | 3257 | 24,458 | 25,901 | 915.88 |
| 2013 | 60 | 8046 | 3105 | 3471 | 24,984 | 27,926 | −141.2 |
| 2014 | 60 | 8147 | 3172 | 3515 | 25,845 | 28,639 | 295.74 |
| 2015 | 58 | 8245 | 3289 | 3653 | 27,119 | 30,122 | −606.89 |
Table A2.
Basic statistics of the variables: , , , and .
| Year | 2002 | 2003 | 2004 | 2005 | 2006 | 2007 | 2008 | 2009 | 2010 | 2011 | 2012 | 2013 | 2014 | 2015 |
|---|---|---|---|---|---|---|---|---|---|---|---|---|---|---|
| Mean | 0.063 | 0.061 | 0.060 | 0.058 | 0.057 | 0.055 | 0.053 | 0.053 | 0.052 | 0.055 | 0.054 | 0.053 | 0.053 | 0.054 |
| StD | 0.072 | 0.069 | 0.068 | 0.066 | 0.065 | 0.063 | 0.061 | 0.060 | 0.059 | 0.061 | 0.060 | 0.060 | 0.059 | 0.060 |
| Min | −0.057 | −0.051 | −0.039 | −0.030 | −0.052 | −0.041 | −0.034 | −0.046 | −0.069 | −0.068 | −0.042 | −0.025 | −0.017 | −0.056 |
| Mean | −0.001 | −0.001 | 0.000 | −0.001 | 0.000 | −0.001 | 0.000 | 0.001 | −0.001 | 0.001 | 0.000 | 0.000 | 0.000 | 0.000 |
| StD | 0.010 | 0.008 | 0.009 | 0.006 | 0.007 | 0.006 | 0.009 | 0.011 | 0.013 | 0.012 | 0.007 | 0.005 | 0.005 | 0.008 |
| Max | 0.067 | 0.063 | 0.066 | 0.044 | 0.031 | 0.026 | 0.073 | 0.064 | 0.093 | 0.093 | 0.031 | 0.020 | 0.021 | 0.038 |
| Min | −0.254 | −0.226 | −0.209 | −0.182 | −0.203 | −0.196 | −0.210 | −0.220 | −0.224 | −0.216 | −0.194 | −0.207 | −0.236 | −0.250 |
| Mean | −0.011 | −0.007 | −0.003 | −0.010 | −0.009 | −0.006 | −0.011 | −0.008 | −0.004 | 0.006 | 0.003 | 0.003 | 0.001 | 0.007 |
| StD | 0.099 | 0.086 | 0.080 | 0.080 | 0.084 | 0.090 | 0.093 | 0.098 | 0.099 | 0.108 | 0.104 | 0.099 | 0.096 | 0.099 |
| Max | 0.338 | 0.348 | 0.394 | 0.352 | 0.421 | 0.434 | 0.435 | 0.420 | 0.317 | 0.375 | 0.358 | 0.365 | 0.337 | 0.410 |
| Min | −0.258 | −0.115 | −0.177 | −0.073 | −0.135 | −0.140 | −0.127 | −0.083 | −0.245 | −0.064 | −0.102 | −0.069 | −0.092 | −0.225 |
| Mean | 0.006 | 0.013 | 0.010 | −0.004 | 0.004 | 0.006 | 0.003 | 0.008 | 0.011 | 0.013 | 0.007 | 0.005 | 0.003 | 0.008 |
| StD | 0.052 | 0.050 | 0.041 | 0.031 | 0.036 | 0.031 | 0.024 | 0.032 | 0.044 | 0.044 | 0.035 | 0.031 | 0.026 | 0.033 |
| Max | 0.220 | 0.206 | 0.172 | 0.178 | 0.174 | 0.152 | 0.073 | 0.151 | 0.156 | 0.203 | 0.191 | 0.321 | 0.088 | 0.203 |
| High | 0.773 | 0.822 | 0.823 | 0.816 | 0.814 | 0.806 | 0.779 | 0.799 | 0.743 | 0.850 | 0.829 | 0.771 | 0.803 | 0.764 |
| Yes | 0.526 | 0.538 | 0.568 | 0.577 | 0.589 | 0.595 | 0.605 | 0.622 | 0.625 | 0.686 | 0.707 | 0.714 | 0.732 | 0.731 |
| Observations | 388 | 398 | 412 | 418 | 431 | 439 | 458 | 458 | 456 | 420 | 457 | 462 | 467 | 453 |
Table A3.
Single variable regression results () with normally distributed residuals.
| AG | BE | GE | TI | VD | ZH | CH | |
|---|---|---|---|---|---|---|---|
| −0.0285 *** (0.0039) | −0.0343 *** (0.0044) | −0.0734 *** (0.0101) | −0.0338 *** (0.0049) | −0.0542 *** (0.0078) | −0.0380 *** (0.0034) | −0.0381 *** (0.0011) | |
| Intercept | −0.0006 (0.0004) | −0.0005 (0.0004) | 0.0025 *** (0.0009) | −0.0004 (0.0004) | 0.0021 *** (0.0007) | −0.0006 ** (0.0003) | −0.0003 *** (0.0001) |
| Adjusted | 0.1552 | 0.1681 | 0.2220 | 0.1523 | 0.1730 | 0.3215 | 0.1759 |
| −0.0304 *** (0.0115) | −0.0384 *** (0.0118) | −0.1512 *** (0.0238) | −0.0861 *** (0.0127) | −0.0815 *** (0.0202) | −0.0414 *** (0.0090) | −0.0616 *** (0.0029) | |
| Intercept | 0.0001 (0.0004) | 0.0001 (0.0004) | 0.0009 (0.0009) | 0.0002 (0.0004) | 0.0010 (0.0007) | 0.0002 (0.0003) | 0.0002 ** (0.0001) |
| Adjusted | 0.0207 | 0.0320 | 0.1775 | 0.1478 | 0.0634 | 0.0698 | 0.0704 |
| Satisfaction Level (baseline: Low) | |||||||
| High | 0.0010 ** (0.0005) | 0.0009 ** (0.0005) | −0.0006 (0.0011) | 0.0003 (0.0006) | −0.0005 (0.0009) | 0.0004 (0.0004) | 0.0010 *** (0.0001) |
| Intercept | 0.0005 * (0.0005) | 0.0003 (0.0005) | −0.0002 (0.0011) | 0.0001 (0.0006) | 0.0003 (0.0009) | 0.0003 (0.0009) | 0.0004 *** (0.0001) |
| Adjusted R | 0.0118 | 0.0108 | −0.0039 | −0.0032 | −0.0033 | −0.0001 | 0.0080 |
| Group affiliation (baseline: No) | |||||||
| Yes | −0.0004 (0.0008) | −0.0015 * (0.0008) | 0.0001 (0.0021) | 0.0012 (0.0009) | −0.0012 (0.0016) | −0.0007 (0.0006) | −0.0014 *** (0.0002) |
| Intercept | 0.0002 (0.0007) | 0.0008 (0.0006) | 0.0001 (0.0018) | −0.0010 (0.0008) | 0.0014 (0.0013) | 0.0005 (0.0005) | 0.0007 *** (0.0002) |
| Adjusted | −0.0028 | 0.0081 | −0.0055 | 0.0025 | −0.0019 | 0.0009 | 0.0062 |
| Observations | 283 | 293 | 184 | 259 | 228 | 268 | 6117 |
Significance codes: ; ; .
Table A4.
Multivariate regression results () with normally distributed residuals.
| AG | BE | GE | TI | VD | ZH | CH | |
|---|---|---|---|---|---|---|---|
| −0.0275 *** (0.0040) | −0.0328 *** (0.0044) | −0.0652 *** (0.0093) | −0.0285 *** (0.0047) | −0.0496 *** (0.0078) | −0.0360 *** (0.0033) | −0.0348 *** (0.0011) | |
| −0.3832 | −0.3948 | −0.4224 | −0.3326 | −0.3845 | −0.5388 | −0.3831 | |
| −0.0195 *** (0.0108) | −0.0270 ** (0.0109) | −0.1293 *** (0.0214) | −0.0721 *** (0.0122) | −0.0583 *** (0.0189) | −0.0274 *** (0.0077) | −0.0448 *** (0.0027) | |
| −0.1000 | −0.1322 | −0.3650 | −0.3255 | −0.1860 | −0.1792 | −0.1932 | |
| Intercept | −0.0004 (0.0004) | −0.0003 (0.0004) | 0.0030 (0.0010) | 0.0000 (0.0004) | 0.0020 (0.0010) | −0.0004 (0.0003) | 0.0000 (0.0001) |
| Adjusted R | 0.1620 | 0.1824 | 0.3496 | 0.2519 | 0.2029 | 0.3503 | 0.2118 |
| Observations | 283 | 293 | 184 | 259 | 228 | 268 | 6117 |
The reported values show the regression coefficients with standard deviations in brackets and the standardised values with significance code. Significance codes: ; ; .
References
- Abraham, Jean M., Roger Feldman, Caroline Carlin, and Jon Christianson. 2006. The effect of quality information on consumer health plan switching: evidence from the Buyers Health Care Action Group. Journal of Health Economics 25: 762–81. [Google Scholar] [CrossRef] [PubMed]
- Anderson, Eugene W., Claes Fornell, and Donald R. Lehmann. 1994. Customer satisfaction, market and profitability: findings from Sweden. Journal of Marketing 58: 53–66. [Google Scholar] [CrossRef]
- Albrecher, Hansjörg. 2016. Asymmetric information and insurance. Cahiers de l’institute Louis Bachelier 20: 12–15. [Google Scholar]
- Albrecher, Hansjörg, and Dalit Daily-Amir. 2017. On Effects of asymmetric information on non-life insurance prices under competition. International Journal of Data Analysis Techniques and Strategies 9: 287–99. [Google Scholar] [CrossRef]
- Berry, Leonard L. 1995. Relationship marketing of services - growing interest, emerging perspectives. Journal of the Academy of Marketing Science 23: 236–45. [Google Scholar] [CrossRef]
- Boonen, Lieke H.H.M., Trea Laske-Aldershof, and Frederik T. Schut. 2015. Switching health insurers: the role of price, quality and consumer information search. The European Journal of Health Economics: Health Economics in Prevention and Care 17: 339–53. [Google Scholar] [CrossRef]
- Bonus.ch. 2010. Primes-maladie 2010: Comment les Suisses vont-ils réagir face à la hausse massive annoncée? Available online: www.bonus.ch (accessed on 1 February 2018).
- Browne, Mark, and Annette Hofmann. 2013. One-sided commitment in dynamic insurance contracts: Evidence from private health insurance in Germany. Journal of Risk and Uncertainty 46: 81–112. [Google Scholar]
- Christiansen, Marcus C., Martin Eling, Jan-Philipp Schmidt, and Lorenz Zirkelbach. 2016. Who is changing health insurance coverage? Empirical evidence on policyholder dynamics. Journal of Risk and Insurance 83: 269–300. [Google Scholar] [CrossRef]
- Colombo, Francesca. 2001. Towards More Choice in Social Protection? Individual Choice of Insurer in Basic Mandatory Health Insurance in Switzerland. OECD Labour Market and Social Policy Occasional Papers, 53. Paris: OECD Publishing. [Google Scholar]
- Comparis.ch 2002–2015. Caisses maladies: sondage sur la satisfaction des assurés. Available online: www.comparis.ch (accessed on 1 February 2018).
- Comparis.ch. 2008. Primes maladie 2008. Available online: www.comparis.ch (accessed on 1 February 2018).
- Cummins, J. David, and Xiaoying Xie. 2008. Mergers and acquisitions in the US property liability insurance industry: productivity and efficiency effects. Journal of Banking and Finance 32: 30–55. [Google Scholar] [CrossRef]
- Dormont, Brigitte, Pierre?Yves Geoffard, and Karine Lamiraud. 2009. The influence of supplementary health insurance on switching behaviour: evidence from Swiss data. Health Economics 18: 1339–56. [Google Scholar] [CrossRef]
- Dutang, Christophe, Hansjörg Albrecher, and Stéphane Loisel. 2013. Competition between non-life insurers under solvency constraints: a game-theoretic approach. European Journal of Operational Research 231: 702–11. [Google Scholar] [CrossRef]
- Eling, Martin, and Dieter Kiesenbauer. 2011. What policy features determine life insurance lapse? An analysis of the German market. Journal of Risk and Insurance 61: 616–37. [Google Scholar] [CrossRef]
- Federal Statistical Office. 2007. Enquête suisse sur la santé 2007. Tableaux standards ESS07. Berlin: FSO. [Google Scholar]
- Federal Statistical Office. 2018. Cantonal portraits 2018. FSO number 1346-1800-05. Available online: www.bfs.admin.ch (accessed on 1 February 2018).
- Frank, Richard G., and Karine Lamiraud. 2009. Choice, price competition and complexity in markets for health insurance. Journal of Economic Behavior & Organization 71: 550–62. [Google Scholar]
- Froidevaux, Aline, and Christoph Kilchenmann. 2016. Retour Statistique sur les 20 ans de la LAMal. CHSS, 3. Bern: Federal Office of Social Insurance and OFAS Publishing. [Google Scholar]
- Goldman, Dana P., Arleen A. Leibowitz, and David A. Robalino. 2004. Employee responses to health insurance premium increases. American Journal of Managed Care 10: 41–47. [Google Scholar] [PubMed]
- Groninger, Yamin, and Alexander Lacher. 2017. Fund for the Sick? Or Partner for Health? Strategic Analysis of the Swiss Health Insurance Market. Basel: Ernst & Young Ltd publication, Available online: www.ey.com (accessed on 1 February 2018).
- Hellier, Phillip K., Gus M. Geursen, Rodney A. Carr, and John Rickard A. 2003. Customer repurchase intention: A general structural equation model. European Journal of Marketing 37: 1762–800. [Google Scholar] [CrossRef]
- Leu Robert E., Frans F. H. Rutten, Werner Brouwer, Pius Matter, and Christian Rütschi. 2009. Swiss and Dutch Health Insurance Systems: Universal Coverage and Regulated Competitive Insurance Markets. Commonwealth Fund pub., No. 1220. [Google Scholar]
- Mau, Stefan, Irina Pletikosa Cvijikj, and Joël Wagner. 2018. Forecasting the next likely purchase events of insurance customers: A case study on the value of data-rich multichannel environments. International Journal of Bank Marketing 36: 1125–44. [Google Scholar] [CrossRef]
- Ordinance of the Federal Department of Home Affairs on Premium Regions 832.106. 2015. Available online: https://www.admin.ch/opc/de/classified-compilation/20152039/index.html (accessed on 1 February 2018).
- Ortiz Yves. 2011. Prices and choices in the Swiss health care insurance market. Working Papers 11.09. Gerzensee: Swiss National Bank, Study Center Gerzensee. [Google Scholar]
- Pešta, Michal. 2013. Total least squares and bootstrapping with applications in calibration. Statistics 47: 966–91. [Google Scholar] [CrossRef]
- Pinquet, Jean, Montserrat Guillén, and Mercedes Ayuso. 2011. Commitment and lapse behavior in long-term insurance: A case study. The Journal of Risk and Insurance 78: 983–1002. [Google Scholar] [CrossRef]
- Prettenthaler Franz, Hansjörg Albrecher, Judith Köberl, and Dominik Kortschak. 2012. Risk and insurability of storm damages to residential buildings in Austria. The Geneva Papers on Risk and Insurance: Issues and Practice 37: 340–64. [Google Scholar] [CrossRef]
- Robinson, James C. 2004. Consolidation and the transformation of competition in health insurance. Health Affairs 23: 11–24. [Google Scholar] [CrossRef]
- Schmeiser, Hato, Tina Störmer, and Joël Wagner. 2014. Unisex insurance pricing: consumers? perception and market implications. The Geneva Papers on Risk and Insurance: Issues and Practice 39: 322–50. [Google Scholar] [CrossRef]
- Schmitz, Hendrik, and Nicolas R. Ziebarth. 2017. Does price framing affect the consumer price sensitivity of health plan choice? Journal of Human Resources 52: 88–127. [Google Scholar] [CrossRef]
- Schut, Frederik T., Stefan Greß, and Juergen Wasem. 2003. Consumer price sensitivity and social health insurer choice in Germany and the Netherlands. International Journal of Health Care Finance and Economics 3: 117–38. [Google Scholar] [CrossRef] [PubMed]
- Samuelson, William, and Richard Zeckhauser. 1988. Status quo bias in decision making. Journal of Risk and Uncertainty 1: 7–59. [Google Scholar] [CrossRef]
- Staudt, Yves, and Joël Wagner. 2018. What customer, policy and distribution characteristics drive the development of insurance customer relationships? A case study analysis. International Journal of Bank Marketing 36: 1098–124. [Google Scholar] [CrossRef]
- Strombom, Bruce A., Thomas C. Buchmueller, and Paul J. Feldstein. 2002. Switching costs, price sensitivity and health plan choice. Journal of Health Economics 21: 89–116. [Google Scholar] [CrossRef]
- Swiss Confederation. 1994. Federal law of health insurance. Available online: www.admin.ch (accessed on 1 February 2018).
- Swiss Health Insurance Ordinance 832.102. 1995. Available online: https://www.admin.ch/opc/fr/classified-compilation/19950219/index.html (accessed on 1 February 2018).
- Swiss Health Insurance Benefits Ordinance 832.112.31. 1995. Available online: https://www.admin.ch/opc/fr/classified-compilation/19950275/index.html (accessed on 1 February 2018).
- Theurl, Engelbert. 1999. Some aspects of the reform of the health care systems in Austria, Germany and Switzerland. Health Care Analysis 7: 331–54. [Google Scholar] [CrossRef]
- Thomson Sarah, Reinhard Busse, Luca Crivelli, Wynand Van de Ven, and Carine Van de Voord. 2013. Statutory health insurance competition in Europe: A four-country comparison. Health Policy 109: 209–25. [Google Scholar] [CrossRef]
- Wilson, Chris, and Catherine Price. 2010. Do consumers switch to the best supplier? Oxford Economic Papers 62: 647–68. [Google Scholar] [CrossRef]
- World Bank. 2017. Life Expectancy at Birth, Total (Years). Washington: World Bank Publication. [Google Scholar]
- Wuppermann, Amelie C., Sebastian Bauhoff, and Markus Grabka. 2014. The Price Sensitivity of Health Plan Choice: Evidence from Retirees in the German Social Health Insurance. Papers in Economics No. 21080, Department of Economics, University of Munich, Munich, Germany. [Google Scholar]
Figure 1.
Development of the market share by insurer size.

Figure 2.
Development of the market share of the eight largest insurers.

Figure 3.
Market shares of eight largest insurers in different cantons 2002–2015.

Figure 4.
Share of the population aged 26 years or more.

Figure 5.
Share of insureds with the standard model.

Figure 6.
Premium range in Switzerland, 1998–2015.

Figure 7.
Average premium per canton, 1998–2015.

Figure 8.
Switching rates and annual premium growth from 2004 to 2015.

Figure 9.
The relationship between DMS and explanatory variables. (a) RDPMi,t,c versus DMSi,t,c; (b) DRPCi,t,c versus DMSi,t,c.
Figure 9.
The relationship between DMS and explanatory variables. (a) RDPMi,t,c versus DMSi,t,c; (b) DRPCi,t,c versus DMSi,t,c.

Figure 10.
RDPM versus DMS in selected cantons.

Figure 11.
DRPC versus DMS in selected cantons.

Figure 12.
Group distribution and satisfaction distribution. (a) Satisfaction distribution per canton; (b) Group distribution per year.
Figure 12.
Group distribution and satisfaction distribution. (a) Satisfaction distribution per canton; (b) Group distribution per year.

Figure 13.
Distribution of the dependent variable with normal (blue) and two-sided lognormal (green) fit.
Figure 13.
Distribution of the dependent variable with normal (blue) and two-sided lognormal (green) fit.

Figure 14.
QQ-plot of normally distributed residuals versus theoretical quantiles.

Figure 15.
QQ-plot of Two-sided lognormally distributed residuals versus theoretical quantiles.

Table 1.
Economic and demographic data for selected cantons and Switzerland.
| Canton | AG | BE | GE | TI | VD | ZH | CH |
|---|---|---|---|---|---|---|---|
| Residents (2016) | 663,462 | 1,026,513 | 489,524 | 354,375 | 784,822 | 1,487,969 | 8,419,550 |
| Urban population in % (2016) | 85.1 | 74.6 | 100.0 | 92.0 | 89.6 | 99.3 | 84.6 |
| Unemployment rate in % (annual average 2017) | 3.15 | 2.59 | 5.28 | 3.38 | 4.52 | 3.54 | 3.19 |
| Physicians in private practice per 100 000 people (2017) | 167 | 220 | 376 | 219 | 244 | 257 | 219 |
| Hospital beds per 1000 people (2017) | 4.5 | 4.8 | 5.2 | 5.4 | 4.8 | 4.2 | 4.5 |
| Debt of the cantons in CHF per inhabitant (2016) | 3542 | 6735 | 31,504 | 10,300 | 4382 | 5236 | 7640 |
| Social assistance rate (2016) | 2.2 | 4.2 | 5.7 | 2.8 | 4.8 | 3.2 | 3.3 |
| Higher education rate (2016) | 22.6 | 24.0 | 28.0 | 29.1 | 25.9 | 22.6 | 28.7 |
Source: Federal Statistical Office (2018).
Table 2.
Number of insurers by portfolio size (number of customers).
| Number of customers | Up to 5000 | 5001–10,000 | 10,001–50,000 | 50,001–100,000 | 100,001–500,000 | Over 500,000 | Total |
|---|---|---|---|---|---|---|---|
| 1996 | 90 | 14 | 20 | 6 | 12 | 3 | 145 |
| 1997 | 76 | 14 | 20 | 4 | 11 | 4 | 129 |
| 1998 | 64 | 13 | 21 | 6 | 10 | 4 | 118 |
| 1999 | 56 | 12 | 19 | 8 | 10 | 4 | 109 |
| 2000 | 48 | 11 | 19 | 9 | 10 | 4 | 101 |
| 2001 | 43 | 9 | 23 | 9 | 11 | 4 | 99 |
| 2002 | 33 | 10 | 25 | 9 | 13 | 3 | 93 |
| 2003 | 32 | 10 | 26 | 9 | 12 | 4 | 93 |
| 2004 | 32 | 11 | 24 | 9 | 12 | 4 | 92 |
| 2005 | 27 | 13 | 20 | 8 | 13 | 4 | 85 |
| 2006 | 28 | 14 | 20 | 7 | 14 | 4 | 87 |
| 2007 | 27 | 13 | 21 | 8 | 14 | 4 | 87 |
| 2008 | 26 | 13 | 19 | 9 | 15 | 4 | 86 |
| 2009 | 22 | 10 | 20 | 8 | 17 | 4 | 81 |
| 2010 | 19 | 10 | 22 | 9 | 16 | 5 | 81 |
| 2011 | 13 | 10 | 14 | 3 | 18 | 5 | 63 |
| 2012 | 14 | 8 | 13 | 3 | 18 | 5 | 61 |
| 2013 | 14 | 8 | 10 | 5 | 18 | 5 | 60 |
| 2014 | 14 | 8 | 10 | 5 | 18 | 5 | 60 |
| 2015 | 11 | 9 | 10 | 6 | 17 | 5 | 58 |
| 1996–2015 | −88% | −35% | −50% | 0% | 42% | 67% | −60% |
Table 3.
Description of the variables.
| Variable | Description | Type |
|---|---|---|
| Absolute year-to-year difference in market share | Number | |
| Relative difference between the insurer’s premium and the market premium | Number | |
| Difference between the insurer’s and the market’s relative annual change of the premium | Number | |
| Satisfaction level of the customers | Binary: low, high | |
| Group affiliation | Binary: yes, no |
Table 4.
Multivariate regression results with two-sided lognormal residuals.
| AG | BE | GE | TI | VD | ZH | CH | |
|---|---|---|---|---|---|---|---|
| −0.0150 *** | −0.0140 *** | −0.0412 *** | −0.0101 *** | −0.0192 *** | −0.0204 *** | −0.0164 *** | |
| −0.0033 | −0.0215 *** | −0.0925 *** | −0.0337 ** | −0.0236 ** | −0.0195 *** | −0.0175 *** | |
| Intercept | −0.0008 | −0.0006 | 0.0015 | −0.0006 | 0.0004 | −0.0006 | −0.0006 |
| Observations | 283 | 293 | 184 | 259 | 228 | 268 | 6117 |
The reported values show the regression coefficients with significance code. Significance codes: ; ; ; .
© 2019 by the authors. Licensee MDPI, Basel, Switzerland. This article is an open access article distributed under the terms and conditions of the Creative Commons Attribution (CC BY) license (http://creativecommons.org/licenses/by/4.0/).
Share and Cite
MDPI and ACS Style
Daily-Amir, D.; Albrecher, H.; Bladt, M.; Wagner, J. On Market Share Drivers in the Swiss Mandatory Health Insurance Sector. Risks 2019, 7, 114. https://doi.org/10.3390/risks7040114
AMA Style
Daily-Amir D, Albrecher H, Bladt M, Wagner J. On Market Share Drivers in the Swiss Mandatory Health Insurance Sector. Risks. 2019; 7(4):114. https://doi.org/10.3390/risks7040114
Chicago/Turabian StyleDaily-Amir, Dalit, Hansjörg Albrecher, Martin Bladt, and Joël Wagner. 2019. "On Market Share Drivers in the Swiss Mandatory Health Insurance Sector" Risks 7, no. 4: 114. https://doi.org/10.3390/risks7040114
Note that from the first issue of 2016, this journal uses article numbers instead of page numbers. See further details here.