Abstract
The COVID-19 virus has hit the economy around the world. In Poland, SMEs have the greatest problems with doing business. Border blockades and the quarantine for enterprises in virtually all industries throughout Poland greatly complicated the supply systems and the inventory management process. Up to now, SMEs have acted in group purchasing organizations to improve their competitive position. This form of activity also positively affects their financial security. Therefore, in this paper, the inventory management among this group of companies during the COVID-19 pandemic was analyzed. The purpose of the paper was to show how inventory management strategies changed during the COVID-19 pandemic in SMEs operating in industry GPOs. The analysis was carried out on a group of 88 Polish commercial enterprises operating in purchasing groups. The research period covered the years 2017–2019 and March–June 2020. The research showed a change in inventory management strategy in SMEs during the pandemic time of COVID-19. For the first four months, managers of enterprises tried to pursue a conservative policy and to accumulate stocks in the event of a shortage of supplies. This article also presents the form of security that was applied for SMEs operating in group purchasing organizations (GPOs) to avoid forced downtime caused by the COVID-19 pandemic.
1. Introduction
In March 2020, the first detected case of a person infected with the COVID-19 virus appeared in Poland. The Polish government reacted quite quickly to subsequent information about the spread of the pandemic around the world and introduced many restrictions on leaving home, work, and the movement of citizens. Shops were soon closed and air transport was limited. However, more people started getting sick, border crossings were closed, quarantine was introduced, and citizens were controlled on the streets. There were more and more problems with logistics and deliveries. There was a shortage of inventory in stores, which in the case of grocery stores often caused unnecessary panic (Gosik 2020). In the event of panic and unexpected surges in supply and demand, virtually every inventory management strategy was ineffective. However, when assessing and analyzing inventory management in various enterprises, it can be concluded that, in general, large enterprises have inventory reserves that allow them to operate smoothly in the market for a short time. In addition, they are better treated by producers because in times of crisis, when negotiating with the producer, their orders will often be processed first. SMEs are in a worse situation, where logistics and the process of supplying goods and materials are often based on their own transport. Independently operating in the market, SMEs have very limited possibilities regarding the diversification of product supplies. SMEs operating in industry group purchasing organizations, whose supply capacity and purchasing power are greater, are in a better position. During the COVID-19 pandemic, managers of these companies are trying to adjust such a system of supply, warehouse work, and security in ways that allow smooth functioning in the event of company employees being sick. At the moment, there is little research in the literature on the impact of COVID-19 on the process of managing current assets in SMEs working in GPOs, and especially on their least liquid element, which is inventory. Therefore, this article may form the basis for further research in this area. This paper shows how commercial SMEs operating in the construction industry began to function in the first months after the outbreak of the COVID-19 pandemic in Poland. This industry is one of the few industries where companies have been able to operate without interruption during this time. Of course, they have been running their businesses with severe sanitary restrictions. The analysis concerns inventories, i.e., the least liquid assets included in current assets. The construction industry is a sector where there are a lot of cases of bankruptcy in Poland. The article combines the issues of liquidity management, inventories, and the pandemic. This is to present what inventory management policy in such a difficult period will be applied by the smallest entrepreneurs operating in the industry so highly exposed to bankruptcy in Poland. So far, there has been a lack of research on the functioning of SMEs in a pandemic, especially related to inventory management. This is mainly due to the lack of access to complete financial data of SMEs operating in group purchasing organizations. The issue of inventory management during a crisis, when the continuity of supplies is threatened, seems to be very important from the point of view of the financial security of enterprises, especially those belonging to the SME group. The presented research may be a reference point for other researchers dealing with the analysis of inventory management strategies during the COVID-19 pandemic in SMEs operating in GPOs.
Currently, more and more studies on the COVID-19 pandemic and its impact on the economy of all countries appear in the literature (Lu et al. 2021; Wei and Han 2021; Sharif et al. 2020). There are also studies in which the authors indicate the strong influence of state policy on the development of the economy and the functioning of enterprises during the COVID-19 pandemic (Padhan and Prabheesh 2021; Baker et al. 2020). Without such aid, enterprises, especially the smallest ones, would have considerable difficulties in maintaining financial liquidity (Gonzales-Torres et al. 2021; Talwar et al. 2021).
In the literature, there are studies on SMEs, but mainly these studies concern the industries that have suffered the most, i.e., tourism and restaurants (Ramelli and Wagner 2020; Song et al. 2021).
However, in the case of studies based on financial data derived from the analysis of financial statements, only complete data for 2020 will allow detailed research and evaluation of various strategies in many areas used during the COVID-19 pandemic.
The aim of the authors was to present how inventories were managed in SMEs during such shocking events for entrepreneurs as the closure of practically the entire economy in Poland. This analysis may be useful for other studies on the functioning of SMEs during the pandemic time in the long term. The aim of the research was also to determine how the selected strategy of inventory management during the pandemic affects management efficiency (operating cycle) and financial liquidity in enterprises. Therefore, two models were created, one determines the effectiveness and the other one describes the development of financial liquidity during the Covid pandemic. Econometric modeling was applied for the research.
2. Review of the Literature
Group purchasing organizations (GPOs) are multi-stakeholder entities whose main purpose is to organize joint purchases (Zimon 2019) They are created basically in every industry, however, most organizations of this type operate in the medical industry (Barbera et al. 2020; Burns and Lee 2008; Marvel and Yang 2008; Sertsios 2020; Safai et al. 2017; Cowan et al. 2016; Saha et al. 2018; Essig 2000; Bentahar 2018; Bundorf 2010; Hu and Schwarz 2011). The most important benefit for commercial enterprises is the possibility of obtaining low prices for goods purchased and attractive trade credits. (Schotanus 2005; Zimon 2019; Nollet and Beaulieu 2005; Sandberg and Mena 2015; Yang et al. 2017; Yan et al. 2017; Saha et al. 2018; Essig 2000; Bentahar 2018; Bundorf 2010; Hu and Schwarz 2011). Low prices allow reducing the most important cost position for commercial enterprises, which is the value of goods sold at the purchase price (Faes et al. 2000; Karabag and Tan 2018; Ahmadi et al. 2020; Nollet et al. 2017). Many authors confirm that operating in group purchasing organizations brings a variety of benefits. Among the most important ones one can list:
- Lowering the price of services, goods, and materials purchased (Ahmadi et al. 2020; Cowan et al. 2016; Marvel and Yang 2008; Dana 2012),
- Lowering operating costs (Zimon 2019; Pacana et al. 2016; Burns and Lee 2008),
- Improving the competitive position in the market,
- Improving the financial security of SMEs running.
Today, during the COVID-19 pandemic, company managers are primarily trying to maintain financial liquidity, and profitability is relegated to the background. Working together in GPOs also has a great impact on the economic security of enterprises. However, this is only possible when there is strong cooperation between companies operating within a purchasing group. Enterprises are open to collaboration within groups as they are not in competition with each other. They run their business in a different area. The territorial barrier is one of the difficulties to entering a purchasing group. The purchasing group should not include enterprises from the same area, i.e., a city or a district since they would be in competition with each other and such units would gain nothing. In the world, multi-entity organizations gathering various purchasing groups are established and they also apply the principle of one purchasing group from one country. Maintaining this entry barrier allows companies to build a strong competitive position in the market.
There are many classifications and divisions of purchasing groups (Schotanus and Telegen 2007; Schotanus 2005; Schotanus et al. 2010; Rozemeijer 2000). However, the simplest division that is used is the one into industry and multi-industry GPOs (Zimon 2019). The best economies of scale are applied in enterprises operating in industry GPOs. In multi-industry purchasing groups, the effect of scale in the most important position, which is the purchase of the basic goods or materials, can be greatly reduced. This results from the fact that companies that operate in multi-industry purchasing groups are divided into small industry groups. This reduces the operating efficiency of the central unit’s purchasing power. The central unit simply has to carry out more orders, and service more producers. Certainly, the purchase of materials and services commonly used by all units of a given group, such as fuel, energy, and the Internet, is very beneficial for multi-industry purchasing groups. However, the scale of benefits and financial savings for these services is generally small.
Unless multi-branch GPOs include a large number of enterprises, this is usually the case because they include enterprises from many industries. In this case, the discounts obtained may be high and may significantly reduce the costs of the company’s operation.
Another element that definitely increases the value of industry purchasing groups is the organization of the supply of goods and materials. Five basic stock supply systems can be found in the literature (Zimon 2019):
- Direct delivery. This delivery system is only possible when ordering the right size of a range set by the central unit.
- Combined delivery.
- Delivery without the manufacturer. Companies buy goods from the central warehouse.
- Delivery from enterprises operating within the purchasing group.
Such a large diversification of supply is a strength of industry purchasing groups, especially in the event of financial problems or events that are now taking place. These capabilities allow the application of secure inventory management strategies. In general, the literature provides information on three classic strategies (Sarkar et al. 2020; Zimon and Dankiewicz 2020; Chauhan 2019; Shen et al. 2020; Roy et al. 2020; Sarkar et al. 2001):
- Defensive (conservative) strategy,
- Offensive strategies (aggressive),
- Moderate (intermediate) strategies.
The defensive strategy includes secure inventory management. Its main assumption is to ensure such inventory that can maintain production and sales without unjustified interruptions. Enterprises that use this type of management have high inventory levels and high financial liquidity and working capital, but low profitability (De Almeida and Eid 2014; He et al. 2017; Chauhan 2019). Generally, in the conservative inventory management units there is an excess of inventory over actual demand. There is a large reserve of stocks, the maintenance of which is very costly.
Today, during the COVID-19 pandemic in Poland, many SMEs have started to base their inventory management policy on this strategy. The advantage of such an action is certainly protection against the supply problem and the scale effect. Thanks to greater purchases, the company receives attractive prices and a trade credit, which certainly improve the company’s financial situation in the future.
The second way of inventory management is the offensive strategy. This strategy is based on minimizing and reducing inventory levels. Enterprises are trying to optimize the level of inventories to the one that allows the unit to function and meet the customers’ needs. This type of management is risky because companies have low inventory levels that need to ensure continuity of production and sales. In this type of strategy, it is very important to introduce appropriate quality management systems that will implement greater responsibility in warehouse management, especially at the lowest supply chain level. Standardized quality management systems are elements that can lead to success when choosing aggressive inventory management methods (Zimon 2015).
The aggressive strategy is very difficult to maintain and requires disciplined suppliers. In the times of the COVID-19 pandemic, companies that used it were certainly forced to stop production or sales more than once. This strategy is based on minimizing inventories, so enterprises are largely exposed to price fluctuations, and now their increase. COVID-19 caused a change in the NBP’s policy in Poland and the printing of money in the market, which was to accelerate the economy. In addition, a number of subsidies from various types of protective shields introduced by the government saved many enterprises, but also caused an increase in prices.
The moderate strategy is an intermediate strategy between the aggressive strategy and the conservative one. The moderate inventory management strategy can be divided into the moderate-conservative and aggressively-conservative strategies.
3. Methodology
The presentation of data accepted for the study and a comparison in the two periods studied before COVID-19 and during the pandemic has been done. The non-parametric Wilcoxon pair-order test was applied for the research. It is the equivalent of the Student’s t-test for related variables. It is used to check whether there is a significant difference in the variables examined before and after the introduction of a given factor, which in the conducted research is the occurrence of the virus and its limitations.
The aim of the research is to show what inventory management strategies were applied by SMEs during the pandemic. In the paper, the following hypothesis is posed: Hypothesis: During the pandemic, company managers pursued a conservative policy of stockpiling in the event of a shortage of supplies, which determined an increase in their level.
The following research questions were also asked: What inventory management strategies did SMEs use during the pandemic?
In this paper, an econometric model, which is a simplified representation of reality, has also been used. It presents the relationships that occur in economic (and not only) processes, taking into account only the most important factors. The purpose of the regression analysis is to investigate the relationship between multiple independent (explanatory) variables and the dependent (response) variable, which must be numerical in nature. In the social, natural, and economic sciences, regression analysis is widely applied as a research tool to describe and understand multidimensional phenomena.
In classical multiple regression analysis, the model is as follows:
and can answer the question of what quantities describe the phenomenon under examination in the best way.
After selection of the appropriate set of diagnostic variables, the following occurs:
- -
- Estimation of the structural parameters of the model;
- -
- Checking the quality of fitting the model to the data, usually with the coefficient of determination R2, which indicates in what percentage the model fits the data
- -
- Model verification—checking the basic assumptions regarding the distribution of model residuals: normality, symmetry, randomness, constant variance, and no autocorrelation.
The last stage is the analysis of the model and its interpretation, thus checking the significance of the contribution of individual variables to the model and, possibly, prediction of the dependent variable.
The econometric model was used to analyze the operating cycle and financial liquidity in the companies.
The research group consisted of 88 commercial SMEs operating within industry purchasing groups. These groups operate in the construction sector. The enterprises sell the goods that belong to the range related to heating and sanitary technology. There are 5 large purchasing groups of 124 SMEs in this industry in Poland. Financial reports from 88 enterprises were obtained for the research, which constitutes 85% of the whole group. The research period covered the years 2017–2019 and March and June of 2020. The research was conducted on the basis of financial statements of SMEs and financial data directly obtained from the units for the months of March and June 2020. The analysis was performed using selected financial ratios, on whose basis the inventory management policy was determined. The choice of this group of companies was conditioned by the following facts:
- Commercial companies operating in the construction industry were practically active during the COVID-19 pandemic all the time. Various restrictions appeared, but they are still operating until present
- The construction industry in Poland is such a sector where a very large number of bankruptcies are boiling
- SMEs are entities particularly vulnerable to bankruptcy
- In purchasing groups, due to the willingness to use the economies of scale, the specificity of inventory management is different compared to the units operating independently in the market
Thus, it is clear that the inventory management policy is of great importance for maintaining the financial security of SMEs. Therefore, the authors tried to assess how an unexpected event, which is the COVID-19 pandemic, changed the inventory management strategies in SMEs.
4. Results
Table 1 shows the results of the key financial indicators to determine inventory management strategies before and during the COVID-19 pandemic.

Table 1.
Basic descriptive statistics of selected indicators.
The efficiency index dropped from 142.6 days before the pandemic to 137.5 days during the course of the virus (Figure 1). The research shows that the difference in the level was statistically significant p < α (p = 0.0001). In the first period, the minimum value in the companies surveyed was at the level of 90 days and, during the course of the virus, it dropped to 58 days, and, similarly, the maximum value in the first period was 201 days and, in the second period, it decreased to 194 days. The liquidity ratio increased slightly from 2.69 ahead of the COVID-19 pandemic to 2.78 over the lifetime of the virus (Figure 2). The research shows that the difference in height was statistically significant p < α (p = 0.0000). In the first and second periods, the minimum value in the companies surveyed was at the same level—1.2 days, but the maximum increased from 9.3 days to 10 days.

Figure 1.
Operating cycle.

Figure 2.
Current financial liquidity.
The quick ratio indicator dropped in the periods analyzed from 1.15 to 1 on average (Figure 3). Both the minimum value dropped from 0.4 to 0.2 and the maximum value from 4.3 to 3.6. The index is characterized by high variability of results in the companies surveyed, as evidenced by the variability index at the level of 48%. The research showed that the changes in the index level were statistically significant p < α (p = 0.0000).

Figure 3.
Quick ratio.
On the other hand, the inventory turnover ratio increased (Figure 4.). On average, from 72.3 days to 75.2 days the study showed that the increase was also statistically significant p < α (p = 0.0000). The minimum value increased from 44 to 46 days, and the maximum value increased from 124 to 129 days. Slightly greater diversification of the inventory index took place in the first period.

Figure 4.
Inventory turnover.
Figure 5 shows two indicators before and during the pandemic: it is the share of receivables and the share of inventories. The share of receivables dropped from 64% to 41%. On the other hand, the ratio of the share of receivables increases in the periods analyzed from 49% to 0.53%. The ratio of the share of receivables in the second period is more diversified, reaching almost 22%, while the inventory ratio is stabilizing in the second research period, the volatility ratio has decreased to 14%. The respondent showed that both the differences in the share of receivables and inventories in the period analyzed were statistically significant p < α. (p = 0.0000).
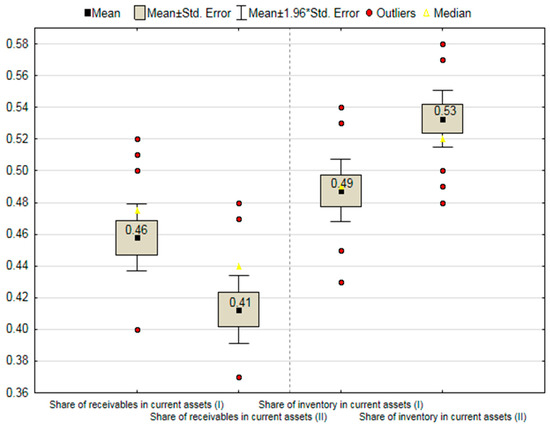
Figure 5.
The share of receivables and the share of inventories during COVID-19.
The correlation between the indicators in the first period before the COVID-19 pandemic, marked as (I), and during the pandemic (marked as II), was examined. The results are presented in Table 2. The analysis shows that both in the first and the second period there are very strong relationships between liquidity and the quick ratio. These are positive relationships, an increase in the quick ratio causes a growth in the liquidity ratio. Similarly, there is a positive relationship between inventory turnover and the efficiency ratio. The greater the inventory turnover ratio, the greater the efficiency ratio. The share of receivables is related to the share of inventories in both periods, the relationship is negative, so with an increase in the share of receivables, the share of inventories decreases.
Table 2.
Correlation Matrix.
The largest number of relationships was identified in group I between the share of inventories and other ratios: liquidity ratio, quick, inventory turnover, and the share of receivables. In group II, the inventory share ratio was related to the efficiency and share of receivables. Both relationships were negative. The bag plot shows the relationship between the share of short-term receivables and the share of inventories.
The chart (Figure 6) shows that most of the companies gather inside the bag, where the median share of inventories was just over 50% and the median share of receivables was below 50%. However, there are such companies where the share of receivables definitely prevails—almost 60% (placed on the plot in the lower right corner—marked with an asterisk), but there are more companies where the share of inventories predominates around 70% and above—the four companies marked with an asterisk in the upper left corner of the bag plot. The purpose of the model construction was to check whether the inventory share ratio and the inventory turnover ratio have a significant impact on the efficiency and liquidity in the companies surveyed. Two models were developed and verified, in which liquidity was the dependent variable in one and efficiency in the other. The estimation results are presented in Table 3.
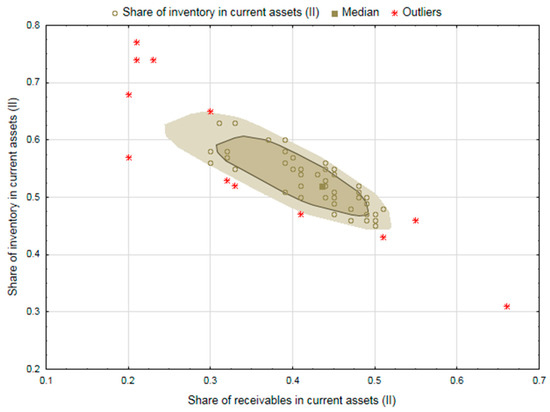
Figure 6.
Bag plot. The ratio of the share of short-term receivables and the share of inventories during the COVID-19 pandemic.
Table 3.
Estimation results.
Both models passed the process of residual verification positively, so they are correctly constructed. Model I for efficiency is as follows:
(13.9) (0.11) (22.62)
The determination coefficient was 70%, so the fit of the model to the data is high. Both the inventory turnover and the share of receivables positively affect efficiency. If the inventory turnover ratio increases by one unit (day), the efficiency will increase by 1.28 days (assuming that the other independent variables remain constant). On the other hand, if the share of receivables increases by a unit (1%), the efficiency will increase by 147.62 days (assuming that the other independent variables maintain constant values). Model II on liquidity is as follows:
(0.72) (0.14) (1.21) (0.01)
The determination coefficient was 74%, so the fit of the model to the data is high. The quick ratio, the share of inventories, and the rotation of inventories have a positive effect on liquidity. If the quick ratio increases by one unit (by one day), liquidity will increase by 1.71 days (assuming that the other independent variables remain constant). If the inventory share ratio increases by one unit (1%), liquidity will increase by 3.78 days (assuming that the other independent variables remain constant). If the inventory turnover ratio increases by one unit (day), liquidity will increase by 0.01 days (assuming that the other independent variables remain constant).
5. Discussion
SMEs operating in the market generally try to implement a policy of inventory management in such a way that their size is at the lowest possible level. On the other hand, in purchasing groups, through the use of the economies of scale, the inventory level may sometimes exceed the actual site demand since it is profitable in the long term (Bentahar 2018; Schotanus et al. 2010; Zimon and Dankiewicz 2020; Schotanus 2005; Nollet and Beaulieu 2005; Ahmadi et al. 2020). Higher orders make it possible to lower the price of the acquired assets. In the case of the purchasing groups under discussion, central units have central warehouses thanks to which enterprises do not have to order individual ranges beyond their need. If necessary, they can use various types of deliveries, e.g., from the central warehouse or deliveries from companies operating in the group. This allows one to reduce the level of stocks, and accelerates stock growth. It has a positive effect on SMEs finance. However, during the pandemic in the initial phase, i.e., in March to April, the companies decided to increase their inventory levels at all costs. It was caused by fears of interruptions in supplies, especially from Western European countries, the USA, or China.
The result is an increase in the share of inventories in current assets and a growth in financial liquidity. This was to ensure the continuity of functioning for enterprises. In addition, during that time, the collection process was accelerated. (Zimon and Dankiewicz 2020). The research also showed a significant relationship between an increase in the share of inventories in current assets and financial liquidity. Enterprises took measures during the first months of the pandemic so as not to lose the possibility of continuing their activities. There are a growing number of studies in which the authors claim that many companies would lose their liquidity and collapse without government help. In particular, those companies that operate in the tourism or service industries (Gonzales-Torres et al. 2021; Talwar et al. 2021; De Rosa et al. 2020). Thus, it seems very important to assess how to modify their inventory management strategies of SMEs.
Information from the Central Statistical Office in May 2020 clearly indicated the emergence of payment gridlocks in SMEs operating in Poland, which would certainly translate into delays in deliveries. In the case of purchasing groups, the process of securing enterprises in inventory management can be divided into two levels. The first level concerns the central unit.
- Level one. Security in the central unit. A shift system was introduced, employees in the procurement department at each important position were divided into two separate groups. They work on a rotational basis so that one group does not come into contact with the other group. The same applies to the central warehouse.
- Level two. Security in enterprises forming purchasing groups in the area of supply and warehouse management. They should be divided into the warehouse and the order department
- -
- Warehouse:
- Division of warehouse employees into two groups. Shift work.
- 24 h quarantine for goods,
- -
- Orders department:
- Division of warehouse employees into two groups. Shiftwork.
- 24 h quarantine of documents
- Ordering goods with a slight surplus is a form of insurance against closing the factory
- Cancellation of promotions and price reductions, “respecting available goods”.
For supply organization, there are two key solutions in this situation and one option that appears in the event of sudden demand:
- Standard deliveries straight from the manufacturer, the key delivery,
- Deliveries from the central warehouse, more expensive goods, accrued margin,
- Deliveries from another company operating in a purchasing group, and in the case of shortages of goods, the goodwill of another unit will enable you to order goods from it. Alternatively, in the event of closure and a mandatory quarantine of other companies, the closed company may distribute its inventory to other entities.
The analysis conducted for March–June 2020 showed some changes in the structure of current assets.
The research has shown, in the field of inventory management, that certain reserves of inventory should be provided to ensure the continuity of operations in times of crisis, such as a pandemic. In a crisis situation, enterprises can and should resign from granting discounts because, in the analyzed industry, the emerging supply interruptions caused a great demand for individual goods and materials. The construction industry was functioning and was not closed during the pandemic, so there were no problems with customers who were still operating in the market. The analysis of the inventory management strategy during the pandemic has shown that in times of crises, a conservative policy should be pursued, which will increase the level of inventories compared to the stock levels before the pandemic. The analyzes and the econometric models applied showed that, during the pandemic, the results of inventory rotation and the operating cycle defined as management efficiency improved. This is due to the improvement in the inventory turnover in days and an accelerated inflow of cash from recipients in days, which also led to an increase in the level of current financial liquidity.
The analysis was based on only four months. More answers would certainly be provided by a 12-month analysis that would probably confirm these preliminary results.
During the pandemic, company managers tried to pursue a conservative inventory policy—the hypothesis was, therefore, verified positively.
The share of inventories in the structure of current assets increased. This is due to the appearance of purchases with a larger reserve that is to protect the company against unexpected congestion. In addition, reduced turnover was observed in April, which was partly due to restrictions imposed by the government on leaving the home and moving around. Additionally, further quarantine imposed on citizens, enterprises significantly reduced and delayed purchasing. Restrictions imposed by the government resulted in an increase in the inventory turnover in days in enterprises. In the case of current financial liquidity, the results are at a similar level. A decrease in the quick liquidity ratio was recorded. This is due to an increase in inventory levels and a decrease in receivables from customers and short-term investments in the structure of current assets. The analysis clearly indicates that the inventory management strategy is changing from moderate-conservative to classic conservative.
6. Conclusions
In Poland, the first months of a pandemic are a time of stockpiling for society. In the first weeks, goods with a long shelf life disappeared from store shelves. Stores heard that some goods were missing but would soon be topped up, which only fueled the public’s purchases with some reserve. Shopping with a supply in March–June was also dictated by concerns about rising prices. Today it can be said that these fears came true, it was also strongly influenced by drought in Poland, which negatively affected food prices.
Meanwhile, market-operating SMEs behaved exactly like the retail client in March and June. The analysis carried out on a group of SMEs operating in purchasing groups showed that stocks of goods were collected in the event of suspension of supplies. Indeed, two factories in Spain and one in Italy temporarily suspended supplies in March of certain materials to the enterprises analyzed. However, they accounted for a small share of total sales. Accumulation of inventories, mobility restrictions, suspension of certain construction works resulted in an increase in inventory levels, current financial liquidity, and a quick ratio drop.
The research has shown that if the inventory share ratio increases by one unit (1%), the liquidity will increase by 3.78 (assuming that the other independent variables remain constant). Thus, it can be seen that the inventory management policy during the COVID-19 pandemic has a significant impact on financial security during the crisis.
Unfortunately, the stock rotation time in days was also extended. These results would certainly be even higher were it not for the central warehouse of purchasing groups where the reserves of goods were accumulated. The use of the central warehouse and the use of this delivery system is an excellent and very quick option to supplement the missing goods. Deliveries from another company operating in the purchasing group constitute a second option for quick and easy filling of deficiencies. Occasionally, such situations also occurred in May and June 2020. Until now, none of the companies analyzed have been closed. However, four months is too short a time to draw strong conclusions.
It seems that the summer period will cause companies to deviate from the conservative strategy, which was basically based on fear and the unknown. However, at the end of 2020, inventory management strategies that are even more conservative are expected. This may be influenced by the policies of the largest central banks in the world, which “reprint” money to stimulate the economy. These activities, plus various types of programs supporting SMEs, e.g., protective shields introduced by the government increase prices in the market. Perhaps a policy of increasing inventory levels can pay off in the long run. Precisely because of the possibility of strong price increases at the end of 2020.
Author Contributions
Conceptualization, G.Z.; V.B.; B.S., and B.G.; methodology, K.C.-L.; G.Z.; formal analysis, K.C.-L.; G.Z.; investigation, G.Z.; B.S.; resources, G.Z.; writing—original draft preparation, G.Z.; V.B.; B.S.; K.C.-L., and B.G.; writing—review and editing, G.Z.; V.B.; B.S., and B.G.; visualization, K.C.-L. All authors have read and agreed to the published version of the manuscript.
Funding
This research received no external funding.
Institutional Review Board Statement
Not applicable.
Informed Consent Statement
Not applicable.
Data Availability Statement
Data sharing is not applicable to this article.
Conflicts of Interest
The authors declare no conflict of interest.
References
- Ahmadi, Abbas, Mehdi Heydari, Mir Shaman Pishvaee, and Ebrahim Teimoury. 2020. Strategic decisions to join group purchasing organizations. Computers & Industrial Engineering 149: 106869. [Google Scholar]
- Baker, Scott R., Nicholas Bloom, Steven J. Davis, Kyle J. Kost, Marco C. Sammon, and Tasaneeya Viratyosin. 2020. The Unprecedented Stock Market Impact of COVID-19. June 2020. NBER Working paper, 26945. [Google Scholar]
- Barbera, Filippo, Josegne Dagnes, and Roberto Di Monaco. 2020. Participation for what? Organizational roles, quality conventions and purchasing behaviors in solidarity purchasing groups. Journal of Rural Studies 73: 243–51. [Google Scholar] [CrossRef]
- Bentahar, Omar. 2018. Key success factors for implementing purchasing groups in the healthcare sector. Supply Chain Forum: An International Journal 19: 90–100. [Google Scholar] [CrossRef]
- Bundorf, M. Kate. 2010. The Effects of Offering Health Plan Choice Within Employment-Based Purchasing Groups. Journal of Risk and Insurance 77: 105–27. [Google Scholar] [CrossRef]
- Burns, Lawton, and J. Andreew Lee. 2008. Hospital purchasing alliances: Utilization, services and performance. Health Care Management Review 33: 203–15. [Google Scholar] [CrossRef]
- Chauhan, Gaurav S. 2019. Are working capital decisions truly short-term in nature? Journal of Business Research 99: 238–53. [Google Scholar] [CrossRef]
- Cowan, Anne E., Sarrah J. Clark, Jennifer L. Gordon, Karin Bok, and Angela K. Shen. 2016. Vaccine purchasing groups in the United States: An overview of their policies and practices. Vaccine 34: 5060–65. [Google Scholar] [CrossRef]
- Dana, James D. 2012. Buyer groups as strategic commitments. Games and Economic Behavior 74: 470–85. [Google Scholar] [CrossRef]
- De Almeida, Juliani Riberio, and William Eid, Jr. 2014. Access to finance, working capital management and company value:Evidences from Brazilian companies listed on BM&FBOVESPA. Journal of Business Research 67: 924–34. [Google Scholar]
- De Rosa, Marizio, Bibiana Lanzilotta, Ivone Perazzo, and Andrea Vigorito. 2020. Las políticas económicas y sociales frente a la expansión de la pandemia de COVID-19: Aportes para el debate. Aportes y análisis en tiempos de coronavirus. Kidlington: Serie de Comunicación—Instituto de Economía. [Google Scholar]
- Essig, Michael. 2000. Purchasing consortia as symbiotic relationships: Developing the concept of “consortium sourcing”. European Journal of Purchasing & Susssspply Management 6: 13–22. [Google Scholar]
- Faes, Wouter, Paul Matthyssens, and Koen Vandenbempt. 2000. The pursuit of global purchasing synergy. Industrial Marketing Management 29: 539–53. [Google Scholar] [CrossRef]
- Gonzales-Torres, Thais, Jose Rodríguez-Sánchez, and Eva Pelechano-Barahona. 2021. Managing relationships in the Tourism Supply Chain to overcome epidemic outbreaks: The case of COVID-19 and the hospitality industry in Spain. International Journal of Hospitality Management 92: 102733. [Google Scholar] [CrossRef] [PubMed]
- Gosik, Blanka. 2020. The Influence of the COVID-19 Pandemics on Consumerist Behaviours in Poland. In Knowledge on Economics and Management Conference Proceedings. Olomouc: Knowlegle on Economics, pp. 25–31. [Google Scholar]
- He, Wei, Tarun K. Mukherjee, and H. Kent Baker. 2017. The effect of the split share structure reform on working capital management of Chinese companies. Global Finance Journal 33: 27–37. [Google Scholar] [CrossRef]
- Hu, Qiaohai, and Leroy Schwarz. 2011. Controversial Role of GPOs in Healthcare-Product Supply Chains. Production and Operations Management Society 20: 1–15. [Google Scholar] [CrossRef]
- Karabag, Oktay, and Baris Tan. 2018. Analysis of a group purchasing organization under demand and price uncertainty. Flexible Services Manufacturing Journal 30: 844–83. [Google Scholar] [CrossRef]
- Lu, Yi, Ying Wu, Junlin Peng, and Li Lu. 2021. Perceived impact of the Covid-19 crisis on SMEs in different industry sectors: Evidence from Sichuan, China. International Journal of Disaster Risk Reduction 55: 102085. [Google Scholar] [CrossRef]
- Marvel, Howard P., and Huanxing Yang. 2008. Group purchasing, nonlinear tariffs, and oligopoly. International Journal of Industrial Organization 26: 1090–105. [Google Scholar] [CrossRef]
- Nollet, Jean, and Martin Beaulieu. 2005. Should an organization join a purchasing group? Supply Chain Management 10: 11–17. [Google Scholar] [CrossRef]
- Nollet, Jean, Martin Beaulieu, and Nathalie Fabbe-Costes. 2017. The impact of performance measurement on purchasing group dynamics: The Canadian experience. J. Purch. Supply Manag. 23: 17–27. [Google Scholar] [CrossRef]
- Pacana, Andrzej, Monika Pasternak-Malicka, Marcin Zawada, and Anna Radon-Cholewa. 2016. Decision support in the production of packaging films by cost-quality analysis. Przemysl Chemiczny 95: 1042–44. [Google Scholar]
- Padhan, Rakesh, and K. P. Prabheesh. 2021. The economics of COVID-19 pandemic: A survey. Economic Analysis and Policy 70: 220–37. [Google Scholar] [CrossRef]
- Ramelli, Stefano, and Alexander F. Wagner. 2020. Feverish Stock Price Reactions to Covid-19. The Review of Corporate Finance Studies 9: 622–55. [Google Scholar] [CrossRef]
- Roy, Vivek, Tobias Schoenherr, and Parkshit Charan. 2020. Toward an organizational understanding of the transformation needed for sustainable supply chain management: The concepts of force-field and differential efforts. Journal of Purchasing and Supply Management 26: 100612. [Google Scholar]
- Rozemeijer, Frank. 2000. How to manage corporate purchasing synergy in a decentralised company? Towardsdesign rules for managing and organising purchasing synergy in decentralised companies. European Journalof Purchasing & Supply Management 6: 5–12. [Google Scholar]
- Safaei, Abdul Sattar, Farnaz Heidarpoor, and Mohammad Mahdi Paydar. 2017. A novel mathematical model for group purchasing in healthcare. Operations Research for Health Care 15: 82–90. [Google Scholar] [CrossRef]
- Saha, Rajib Lohan, Abraham Seidmann, and Vera Tilson. 2018. The impact of custom contracting and the infomediary role of healthcare GPOs. Production and Operations Management 28: 650–67. [Google Scholar] [CrossRef]
- Sandberg, Erik, and Carlos Mena. 2015. Exploring strategic strengths and weakness of retail purchasing groups. The International Review of Retail, Distribution and Consumer Research 25: 276–97. [Google Scholar] [CrossRef]
- Sarkar, M. B., Ray Echambadi, S. Tamer Cavusgil, and Preet S. Aulakh. 2001. The influence of complementarity, compatibility, and relationship capital on alliance performance. Journal of the Academy of Marketing Science 29: 358–73. [Google Scholar] [CrossRef]
- Sarkar, M., B. Muhammad Omair, and Nia Kim. 2020. A cooperative advertising collaboration policy in supply chain management under uncertain conditions. Applied Soft Computing Journal 88: 105948. [Google Scholar] [CrossRef]
- Schotanus, Fredo. 2005. Cooperative purchasing within the United Nations. Paper presented at the IPSERA Conference, Archamps, France, March 20–23; pp. 961–73. [Google Scholar]
- Schotanus, Fredo, and Jan Telegen. 2007. Developing a typology of organisational forms of cooperative purchasing. Journal of Purchasing and Supply Management 1: 53–68. [Google Scholar] [CrossRef]
- Schotanus, Fredo, Jan Telgen, and Luitzen de Boer. 2010. Critical success factors for managing purchasing groups. Journal of Purchasing & Supply Management 16: 51–60. [Google Scholar]
- Sertsios, Giorgio. 2020. Corporate finance, industrial organization, and organizational economics. Journal of Corporate Finance 64: 101680. [Google Scholar] [CrossRef]
- Sharif, Arshian, Chaker Aloui, and Larisa Yarovaya. 2020. Covid-19 pandemic, oil prices, stock market and policy uncertainty nexus in the us economy: Fresh evidence from the wavelet- based approach. International Review of Financial Analysis 70: 1–9. [Google Scholar] [CrossRef]
- Shen, Bin, Stefan Minner, Hau-Ling Chan, and Alessandro Brun. 2020. Logistics and supply chain management in the luxury industry. Transportation Research Part E 143: 102095. [Google Scholar] [CrossRef]
- Song, Hyoung Ju, Jihwan Yeon, and Seoki Lee. 2021. Impact of the COVID-19 pandemic: Evidence from the U.S. restaurant industry. International Journal of Hospitality Management 92: 102702. [Google Scholar] [CrossRef] [PubMed]
- Talwar, Manish, Shalini Talwar, Puneet Kaur, Naliniprava Tripathy, and Amandeep Dhir. 2021. Has financial attitude impacted the trading activity of retail investors during the COVID-19 pandemic? Journal of Retailing and Consumer Services 58: 102341. [Google Scholar] [CrossRef]
- Wei, Xiaoyun, and Liyan Han. 2021. The impact of COVID-19 pandemic on transmission of monetary policy to financial markets. International Review of Financial Analysis 74: 101705. [Google Scholar] [CrossRef]
- Yan, Yingchen, Ruiquing Zhao, and Yanfei Lan. 2017. Asymmetric retailers with different moving sequences: Group buying vs. individual purchasing. European Journal of Operational Research 261: 903–17. [Google Scholar] [CrossRef]
- Yang, Yu-Chen, Hsing Kenneth Cheng, Chao Ding, and Shengli Li. 2017. To join or not to join group purchasing organisation: A vendor’s decision. European Journal of Operational Research 258: 581–89. [Google Scholar]
- Zimon, Dominik. 2015. Impact of the implementation of quality management system on operating cost for small and medium-sized business organizations affiliated to a purchasing group. International Journal for Quality Research 9: 551–64. [Google Scholar]
- Zimon, Grzegorz. 2019. The impact of quality management on inventories in commercial enterprises operating within group purchasing organizations. Problems and Perspectives in Management 17: 362–69. [Google Scholar] [CrossRef]
- Zimon, Grzegorz, and Robert Dankiewicz. 2020. Trade Credit Management Strategies in SMEs and the COVID-19 Pandemic—A Case of Poland. Sustainability 12: 6114. [Google Scholar] [CrossRef]


Publisher’s Note: MDPI stays neutral with regard to jurisdictional claims in published maps and institutional affiliations. |
© 2021 by the authors. Licensee MDPI, Basel, Switzerland. This article is an open access article distributed under the terms and conditions of the Creative Commons Attribution (CC BY) license (https://creativecommons.org/licenses/by/4.0/).