Article

How Using Dedicated Software Can Improve RECIST Readings

by
Amandine René
1,*,†,
Sophie Aufort
2,†,
Salim Si Mohamed
2,†,
Jean Pierre Daures
3,†,
Stéphane Chemouny
4,†,
Christophe Bonnel
4,† and
Benoit Gallix
5,†
1
University of Montpellier I & II/Intrasense SA, Montpellier 34000, France
2
Medical Imaging Service, Clinique du Parc, Castelnau-Le-Lez 34170, France
3
University of Montpellier I, Epidemiology Biostatistics and Public Health, IURC, Montpellier 34000, France
4
Intrasense, SA, 1231 Avenue du Mondial 98, Montpellier 34000, France
5
Department of Radiology, McGill University, Montréal, QC, Canada
*
Author to whom correspondence should be addressed.
These authors contributed equally to this work.
Informatics 2014, 1(2), 160-173; https://doi.org/10.3390/informatics1020160
Submission received: 31 March 2014 / Revised: 22 August 2014 / Accepted: 1 September 2014 / Published: 8 September 2014
(This article belongs to the Special Issue Biomedical Imaging and Visualization)

Abstract

:
Decision support tools exist for oncologic follow up. Their main interest is to help physicians improve their oncologic readings but this theoretical benefit has to be quantified by concrete evidence. The purpose of the study was to evaluate and quantify the impact of using dedicated software on RECIST readings. A comparison was made between RECIST readings without dedicated application vs. readings using dedicated software (Myrian® XL-Onco, Intrasense, France) with specific functionalities such as 3D elastic target matching and automated calculation of tumoral response. A retrospective database of 40 patients who underwent a CT scan follow up was used (thoracic/abdominal lesions). The reading panel was composed of two radiologists. Reading times, intra/inter-operator reproducibility of measurements and RECIST response misclassifications were evaluated. On average, reading time was reduced by 49.7% using dedicated software. A more important saving was observed for lung lesions evaluations (63.4% vs. 36.1% for hepatic targets). Inter and intra-operator reproducibility of measurements was excellent for both reading methods. Using dedicated software prevented misclassifications on 10 readings out of 120 (eight due to calculation errors). The use of dedicated oncology software optimises RECIST evaluation by decreasing reading times significantly and avoiding response misclassifications due to manual calculation errors or approximations.

Graphical Abstract

1. Introduction

RECIST (Response Evaluation Criteria for Solid Tumor) Criteria are the most commonly used to evaluate tumoral response in clinical research and daily routine [1]. However, their implementation is complex, in particular in daily routine. Some limitations such as the slow learning curve or the need to recover anteriorities decrease their adoption rate and efficiency [2,3].
Imaging software applications dedicated to oncologic follow ups are now available. Their main interest is the automation of tasks qualified as “repetitive” and for which the radiologic added value is almost inexistent. Thus, physicians can focus on tasks for which their expertise is indispensable. Theoretically, these dedicated applications should allow physicians to optimise readings dedicated to oncologic follow up [4].
Evaluating and quantifying the added value of using dedicated technologies for medical imaging is an explored topic in particular for CAD (Computer Aided Detection) algorithms. Moreover, these evaluations are usually focused on unique technology isolated from its integration in a global application [5]. A software application is a combination of technologies which can be evaluated separately but whose real impact can only be evaluated and quantified in combination in a real clinical context (in particular, evaluating their positive and negative interactions). Thus, evaluating the impact of a dedicated application is a more unusual topic. Recently, work has been carried out evaluating the efficiency and consistency of a semi-automated lesion management system but focusing on the use of a semi-automated segmentation algorithm to determine RECIST measurements [6].
The aim of this study was to evaluate the real impact of using software dedicated to oncologic follow ups on:
-
Reading times,
-
Accuracy of calculated responses (calculation errors),
-
Reliability of calculated responses (inter and intra-operator reproducibility).
We tried to answer this question comparing RECIST Response calculation using (a) a standard viewer vs. calculation using (b) a dedicated application to oncologic follow ups on the same panel of patients.

2. Materials and Methodological Section

2.1. Materials

2.1.1. Study Population

Fourty patients who underwent a CT-scan follow up (2 CT per follow up: baseline, second episode) have been retrospectively selected. On one half of the patients (20), hepatic targets were evaluated and on the other half, lung targets were evaluated (20) (Figure 1 and Figure 2). These targets were eligible for a RECIST follow up (longest axial diameter ≥10 mm). Localisations of primitive cancers responsible for these metastatic lesions were varied.
Figure 1. Hepatic Targets: Patient presenting hepatic targets.
Informatics 01 00160 g001
Figure 2. Lung targets: Patient presenting a lung lesion.
Informatics 01 00160 g002
Concerning the hepatic lesions follow up, portal phase acquisitions were realised.
Depending on the primitive cancer and the therapeutic strategy set up by the oncologist, time between baseline and second episode varied (mean: 3 months, ±2 months).
Dicom images were anonymized on site, before the beginning of the study, to avoid patient identification.
Dicom images came from several medical imaging units.

2.1.2. Computer Material

Medical Images Acquisition

CT scans were acquired on different machines from different manufacturers. The images slice thicknesses varied from 0.5 to 8 mm.

Images Post Treatment

  • Readings were exclusively performed with the same software application with or without specific options:
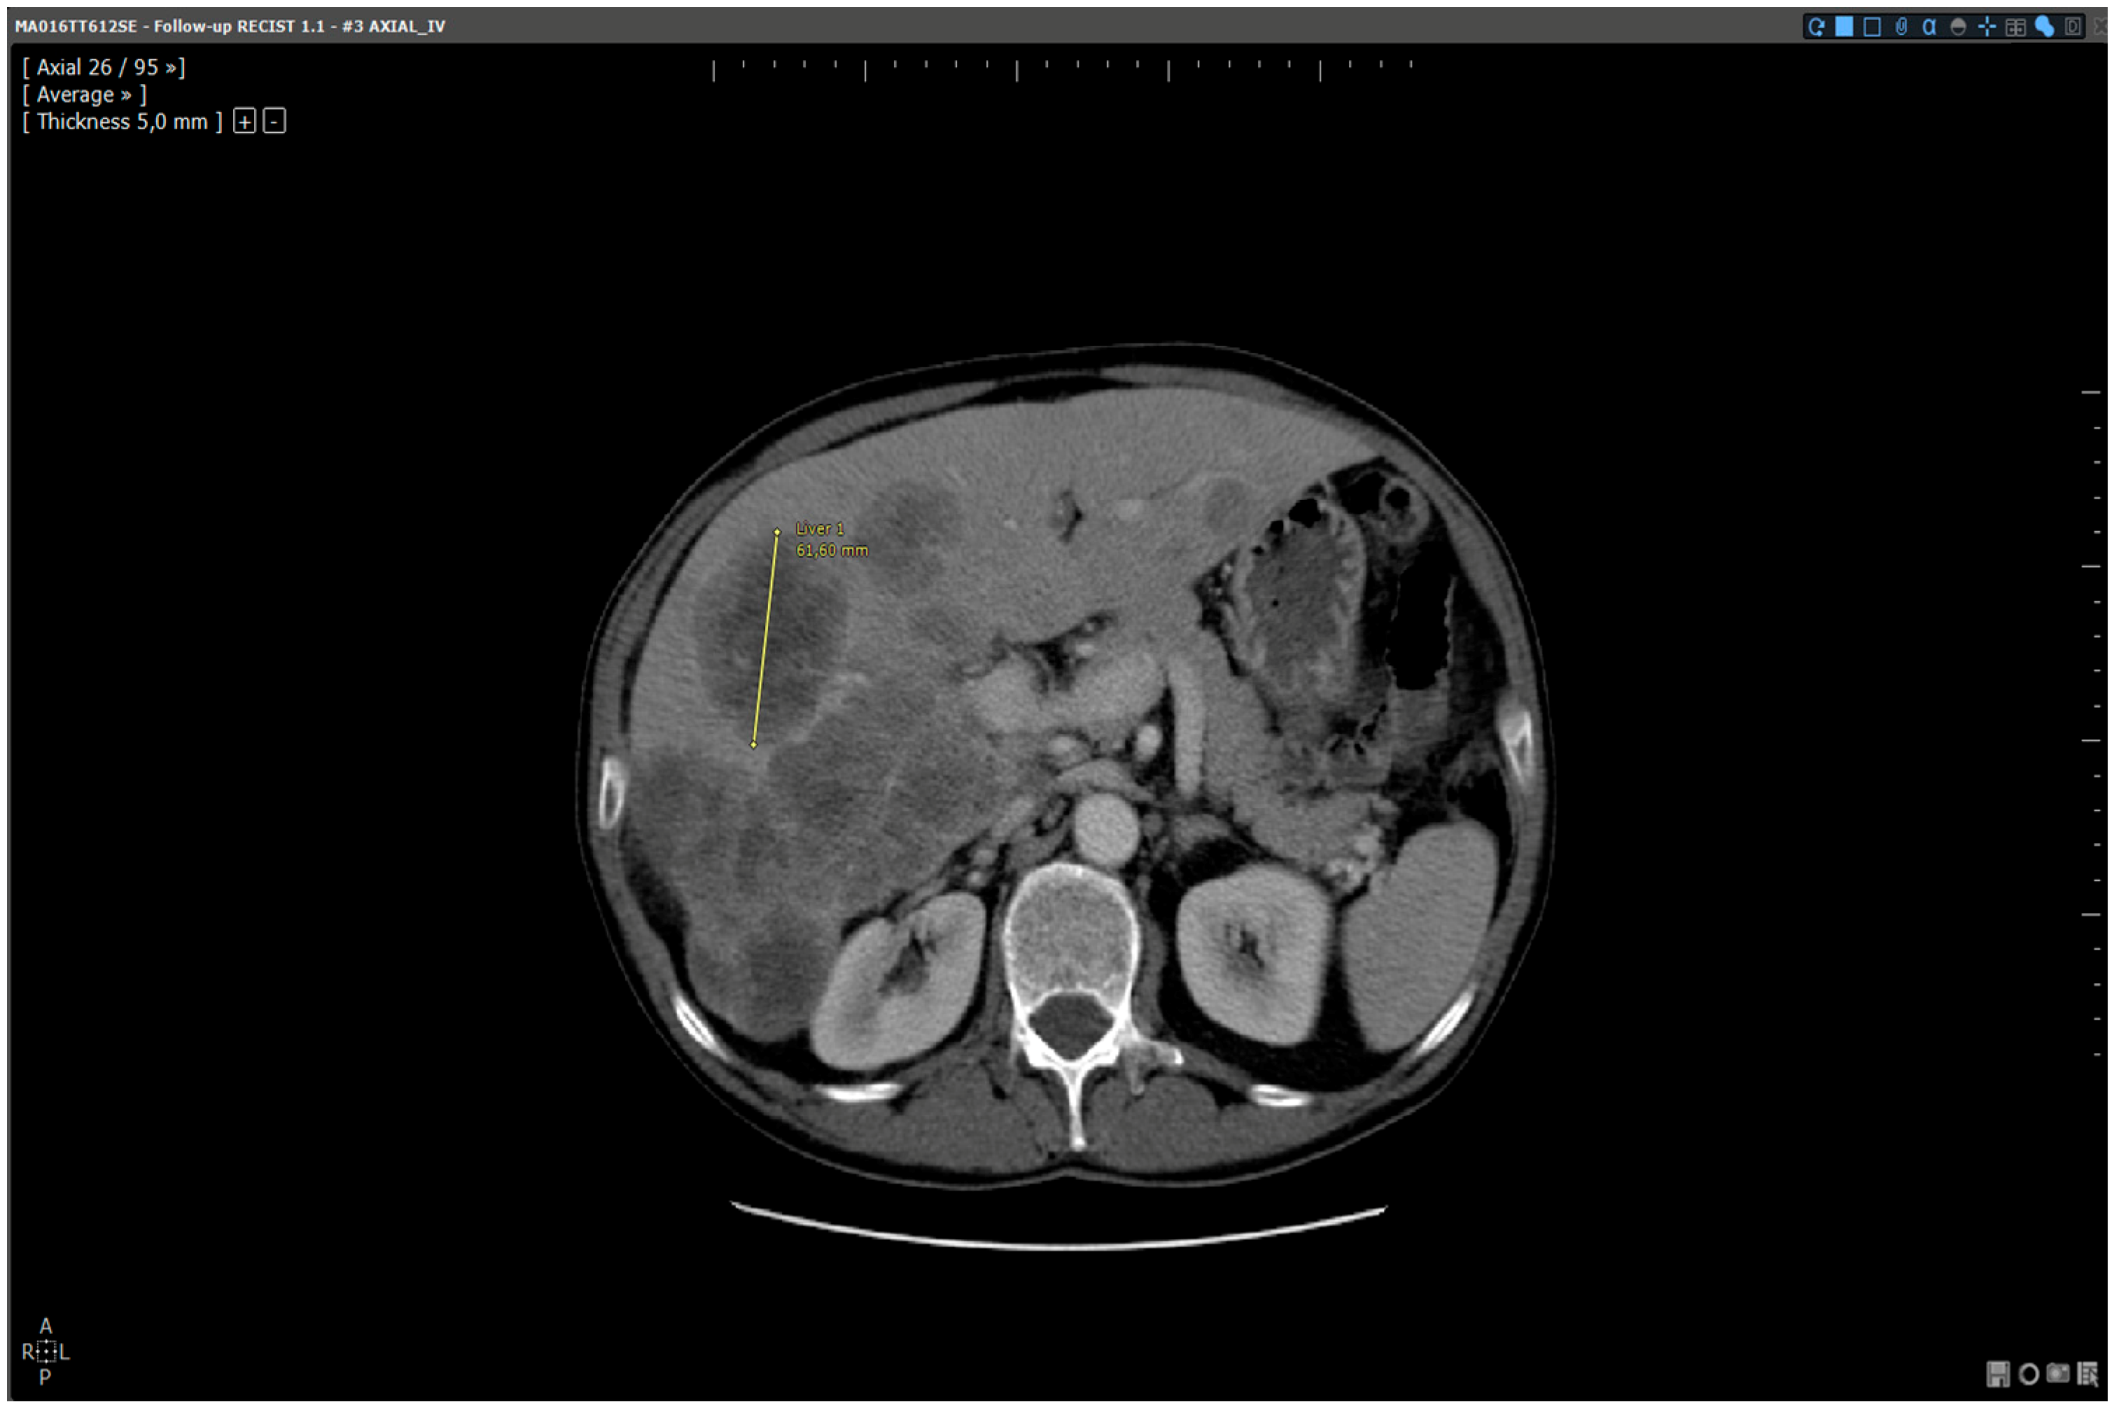
  • Standard reading: Manual determination of RECIST response using a standard viewer (Myrian®, Intrasense, France) without specific options dedicated to oncologic follow ups. This reading is called “manual reading” in the rest of the article.
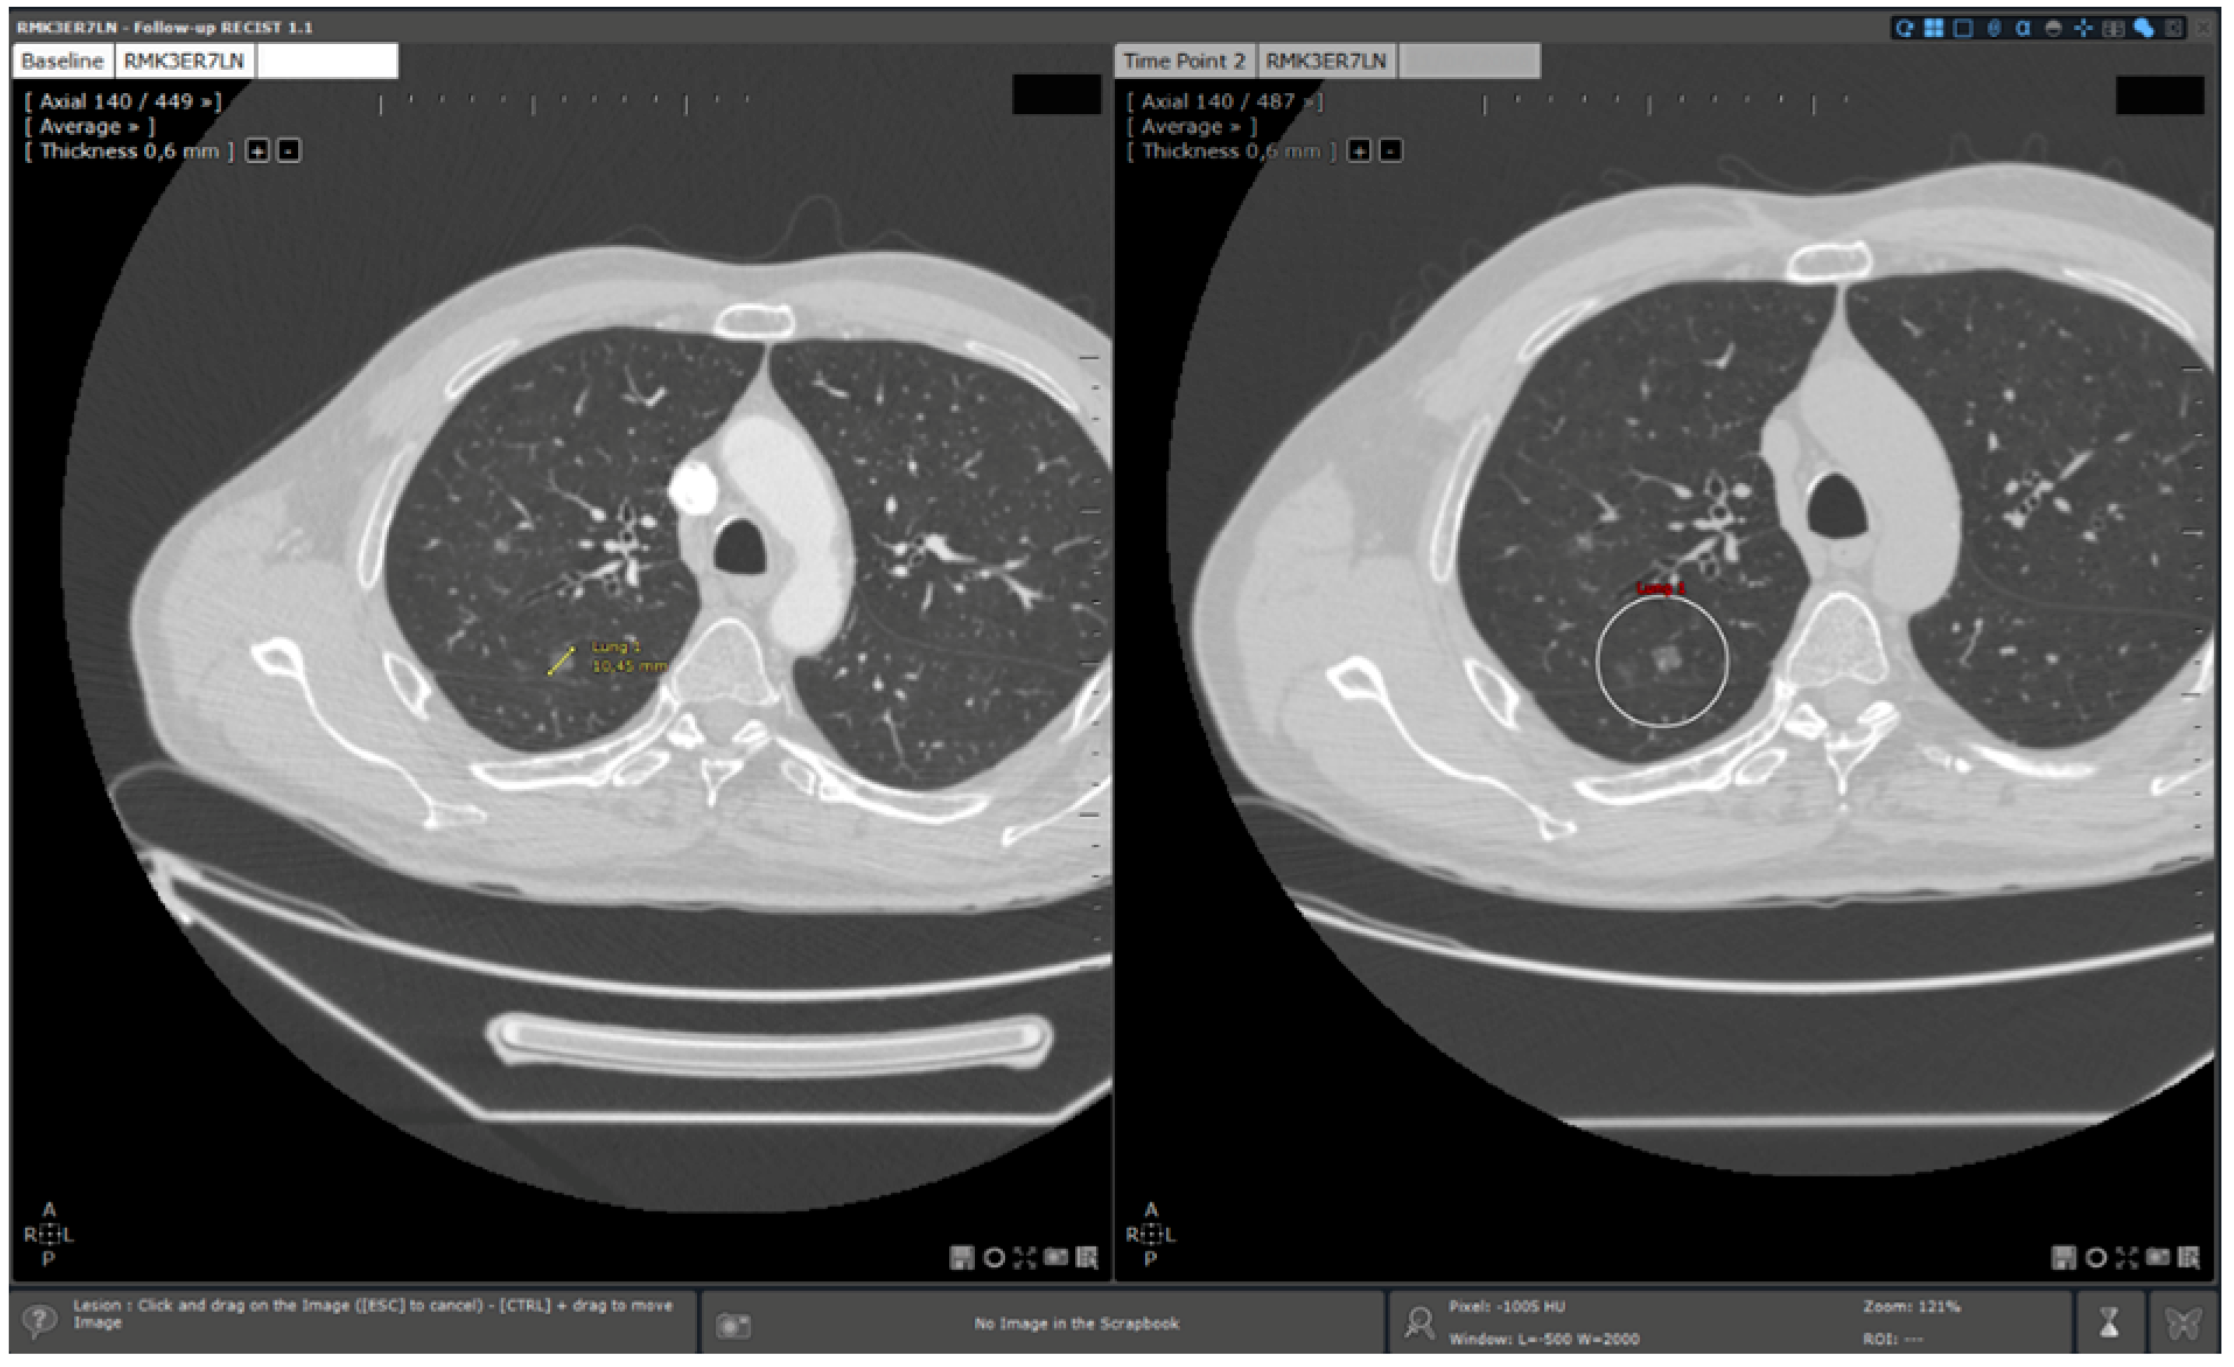
  • Reading with dedicated software: Determination of RECIST response with the dedicated application for oncologic follow ups, Myrian® XL-Onco, with specific functionalities:
    -
    Automated calculation of elements required for RECIST response determination (sum of diameters, percentage of tumour evolution, RECIST response (CR, PD, PR, and SD)),
    -
    3D target matching technology to facilitate lesion localisation in the follow up study.
This reading is called “automated reading” in the rest of the article.

2.2. Method

2.2.1. Evaluation Criteria

Main Evaluation Criterion: Quantification of Saving in Reading Times Using Automated Reading

Savings in reading times have been assessed comparing reading times for a same patient using both manual and automated reading methods. Reading time variation is expressed as a percentage of manual reading time:
S a v i n g   i n   r e a d i n g   t i m e   f o r   a   p a t i e n t :   Δ n % = T m T a T m
M e a n   s a v i n g   i n   r e a d i n g   t i m e s :   Δ m % = n 1 Δ n % n
  • n%: Saving in reading time in % for a patient.
  • Tm: Manual reading time for a patient (in seconds).
  • Ta: Automated reading time for the same patient (in seconds).
  • m%: Mean saving in reading times for the whole database.
  • n: Sample size.

Secondary Evaluation Criteria

  • Inter and intra-operators reproducibility: For each reading method, it was evaluated comparing for the same patient, the real sums of measured diameters obtained during two distinct reading sessions.
  • Manual calculation errors: Manual calculations only occurred during manual readings (without dedicated application). Errors were counted when a difference was detected between the RECIST response (CR, PD, SD, PR) recorded by a radiologist and the theoretical RECIST response based on the diameters measured.

2.2.2. Methodology of Analysis

Baseline Study Reading

Before the beginning of the study, baseline studies were analysed (selection of two targets and measurements) by a radiologist who was not involved in the reading panel. This analysis was identically performed (same targets and measurements) according to each method (Figure 3 and Figure 4).
Figure 3. Baseline analysis: manual reading method. Patient MA06TT612SE: Baseline analysed without dedicated software. Target selected and measured on slice 26: 61.6 mm.
Informatics 01 00160 g003
Figure 4. Analysis of the same baseline: automated reading method. Patient MA06TT612SE: Baseline analysed with dedicated software. Target selected and measured on slice 26:61.6 mm.
Informatics 01 00160 g004
The figures above illustrate that readings on baselines were identically performed according to both reading methods so as to provide the same baseline to each radiologist independently of the reading methods.

Reading Protocol

The reading panel was made up of two radiologists with two distinct degrees of experience:
-
Radiologist 1: senior radiologist: 10 years of experience
-
Radiologist 2: junior radiologist: 3 years of experience
Radiologist 1 analysed the whole database. Radiologist 2 analysed half of the database. Each patient was analysed by each radiologist according to the manual reading method two times and according to the automated method two times. The four readings were performed with an interval of one month. Fourteen reading sessions were performed within a period of 5 months (April–September 2013). Readings were not randomly performed, but the one month delay between each reading was imposed to prevent any residual memory.
A unique and short training session (10 min) was provided to both radiologists before the beginning of the study. The training topic was about using Myrian® software with and without dedicated functionalities in an oncologic follow up context.
The chart below (Table 1) describes follow up reading protocol steps according to manual and automated reading methods. Automation of some of these steps by dedicated software during automated readings is also specified.
Table 1. Reading protocol and steps automation.
Manual Reading Standard ViewerAutomated Reading Dedicated Software
Step 1Follow up study openingManualManual
Step 2Baseline study openingManualAutomated
Step 3Target localisation on baseline studyManualAutomated
Step 4Target localisation on follow up studyManualAutomated
Step 5Target measurements on follow up studyManualManual
Step 6Calculation of sums and percentage necessary to tumoral response evaluation (baseline/follow up)ManualAutomated
Step 7RECIST response determinationManualAutomated
Table 1 describes the steps of follow up reading and their automation by dedicated software. This illustrates the interaction human-software during readings:
-
For manual reading: all the steps are manually performed by the reader
-
For automated reading: follow up opening and target measurements are the only steps manually performed by the reader.
As illustrated in this chart, evaluators only assessed the follow up studies since baselines had already been evaluated by an independent expert reader who selected and measured the lesions.

Data Reporting

Data necessary for the analysis was reported by a clinical research associate during the readings:
  • Reading time evaluation: timekeeping from follow up study opening to follow up study closing and RECIST response determination (from step 1 to step 7, see Table 1),
  • Intra and inter-operator reproducibility evaluation: target measurements values on follow up study,
  • Calculation error quantification:
    -
    Results of diameter sums calculated by the radiologist on baseline and follow up studies,
    -
    Results of tumoral evolution percentage calculated by the radiologist,
    -
    RECIST score (CR, PD, SD and PR).

2.2.3. Statistical Evaluation

Data normality was checked using Kolmogorov Smirnov test. Comparisons made on quantitative data were performed using the non-parametric test of Wilcoxon. Reproducibility was evaluated using the Intra-Class Concordance coefficient. The significance threshold chosen for statistical evaluations was p < 0.05.

3. Results

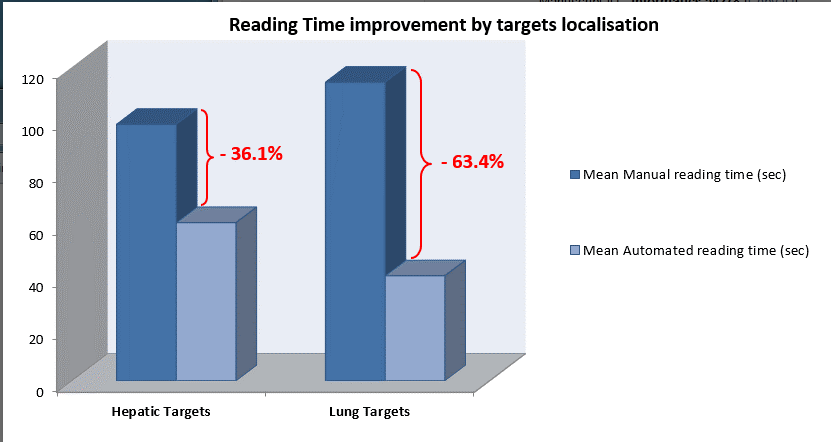
3.1. Saving in Reading Times

On average, the reading time was reduced by 49.7% using dedicated software. Mean reading times were 106.3 s for manual readings and 50.2 s for automated readings (p < 0.001).
For the hepatic lesions follow up, reading time was reduced by 36.1% (mean lesion size: 45.5 mm). For lung targets, reading time was reduced by 63.4% (mean lesion size: 18.7 mm) (Figure 5).
Figure 5. Reading time reduction using dedicated software stratified by target localisation: Hepatic targets follow up: mean saving in reading time 36.1%. Lung targets follow up: mean saving in reading time 63.4%.
Informatics 01 00160 g005
Reading times for the senior radiologist were not shorter than those for the junior radiologist regardless of the reading method:
-
Mean Manual Reading times: senior radiologist: 107.2 s (±29.4)/junior radiologist: 104.6 (±34.4).
-
Mean Automated Reading times: senior radiologist: 55.2 s (±24.6)/junior radiologist: 40.3 (±10.7).

3.2. Inter and Intra-Operator Reproducibility

Intra-operator reproducibility (ICC) of measurements was:
-
For manual readings: 0.97 [0.96–0.98]
-
For automated readings: 0.98 [0.96–0.99]
Intra-operator reproducibility was not affected by the operator’s degree of experience:
-
Radiologist 1: 0.97 [0.94–0.98] for manual reading/0.97 [0.95–0.99] for automated reading
-
Radiologist 2: 0.94 [0.87–0.98] for manual reading/0.93 [0.84–0.97] for automated reading.
Inter-operator reproducibility was 0.97 [0.94–0.98] for manual reading and 0.96 [0.93–0.98] for automated reading.

3.3. Calculation Errors

Misclassifications of RECIST scores were observed on 10 readings out of 120. Eight of these misclassifications were due to calculation errors and two were due to the usage of a rounding-off method by radiologists during the calculation process in order to save time.

4. Discussion

In our study, we demonstrated that using dedicated software significantly optimises RECIST readings decreasing reading times and avoiding RECIST calculation errors.
The saving in reading time could be easily explained by software automation of most of the steps of RECIST response evaluation. The automation of calculation was one of the major functionalities allowing time saving. Indeed, it prevented radiologists from reporting measurements and manually calculating all the data necessary for RECIST determination. Additionally, the 3D elastic target matching functionality allowed the automated saving and displaying of targets on the baseline and their automated localisation on the time point. This participated in the saving in reading time. Indeed, during manual readings, radiologists had to open the baseline study and localise the measured targets. Then, they had to navigate in the time point so as to re-localise the lesions in the time point study.
We observed a more important saving in reading time for lung lesion follow ups than for hepatic lesion ones. This could be explained by a more important involvement of 3D elastic target matching for this localisation (Figure 6). Indeed, the lung screening surface is more important than the hepatic surface because of its intrinsic structure: longer than the liver and symmetric. Additionally, lung lesions were smaller than hepatic lesions (mean size for hepatic lesions: 45.5 mm/mean size for lung lesions: 18.7 mm). This implicated a longer reading time to localise and measure lung lesions without specific functionalities. 3D elastic target matching allowed a faster lesion localisation by displaying on the follow study the slice on which the lesions should be probably located. This reduced screening time significantly.
Figure 6. 3D elastic target matching for lung lesion. A lung target previously measured in the baseline is automatically re- located. Additionally, the slice of the time point study on which the target is the most probably located is displayed to the user.
Informatics 01 00160 g006
Misclassifications of RECIST scores (CR, PD, PR, SD) were due to manual calculation errors or to approximations performed by radiologists in order to save time. Calculation errors not impacting the RECIST score were observed but not taken into account. The occurrence of all these errors should not be underestimated. This study was not organized in real reading conditions. In daily routine, radiologists have to perform several tasks in a short period of time. This can significantly increase error occurrence (risk multiplied by 11 in Williams’ Study [7,8]). Regarding roundings, RECIST 1.1 [1] guidelines do not provide rules for the measurements’ accuracy degree. The minimal size for target lesions is expressed in millimetres. This could imply that measurements have to be expressed in millimetres. In addition, in RECIST 1.0 guidelines [9], a snapshot illustrates measurements on ultrasound. The measurement is made on the image with a 10−1 mm degree of accuracy (93.5 mm). However, in the key of the figure, the measurement is marked in millimetres and the value seems to have been truncated (93 mm). During the reference readings of our study, roundings were expressed in millimetres and we observed that they could impact RECIST score for values closed to thresholds. The clinical significance of this impact can be discussed. However, the real issue is that measurement tools available in standard workstations for RECIST evaluation, usually display a 10−1 mm degree of accuracy. As the significance of such an accuracy can be discussed, the use of roundings is highly probable for RECIST evaluation in current practice. However, their application is not current in clinical routine. Without clear recommendations, roundings can be randomly and/or incorrectly applied depending on the reader. This can impact RECIST evaluation accuracy and raises the need for clear guidelines for RECIST measurements. If measurements have to be performed in millimetres, this has to be mentioned. If measurements tools display measurements in 10−1 mm of accuracy and roundings have to be performed, clear rules have to be defined in order to improve RECIST standardisation. In this context, dedicated software has the advantage to automate calculations including roundings if necessary. This can positively impact RECIST standardisation avoiding risky reader intervention in the calculation process. Finally, an ultimate type of RECIST score abnormality has been observed during the study but not qualified and quantified as calculation errors: roundings due to radiologist’s interpretation. This last category represents voluntary roundings performed by physicians in order to change RECIST scores. As for measurements, there are no official recommendations regarding the accuracy for evolution percentages. In clinical routine, it seems to be frequent that physicians round off evolution percentages whose values are close to cut off limits so as to change the RECIST score. As an example, a patient presents a regression of 29.7% which implicates a Stable Disease response, but frequently, the percentage will be rounded off to 30% so as to classify the response into Partial Response. It has to be noted that the rounding can be mathematically incorrect (29.4% rounded off to 30%) but performed in order to fit the clinical reality. In the table above, all observed abnormalities of evolution percentages and RECIST scores are represented linked to their consequences in daily routine and clinical research (Figure 7).
Situations leading to unexpected evolution percentage value:
-
Calculation errors
-
Roundings by approximation: rounding off performed by physicians during calculation process in order to save time
-
Roundings by interpretation: rounding off voluntary performed by physicians in order to modify RECIST score
Note 1: TBR: Tumor Board Review.
Note 2: RECIST Score: CR, SD, PR and PD.
Thus, we observe that all abnormalities in calculations have consequences independent of their origin and of their impact on RECIST score.
These consequences are different:
-
Direct impact on patient: when abnormalities are not detected and induce a modification of RECIST response. This can imply a modification of the therapeutic strategy.
-
Indirect impact on patient: when abnormalities are not detected but do not directly impact RECIST response. Indeed, conservation of these errors during follow up can potentially impact RECIST response if the concerned exam is baseline or NADIR.
-
Direct impact on trial results: when trial statistics can be impacted by the abnormality.
-
Correction: waste of time for physicians when error is detected and has to be corrected.
It has to be noted that all these impacts are theoretical. Indeed, oncologic evaluation is not only based on imaging information. In daily routine more specifically, RECIST evaluation is considered as a guideline and has to be completed with clinical evaluation and biology. These additional sources of data can moderate the presented impacts of RECIST misclassifications in daily routine.
Figure 7. Abnormalities of RECIST score and their consequences.
Informatics 01 00160 g007
Occurrence of any type of error is completely avoided by dedicated software automation of calculations and RECIST classifications.
Regarding roundings voluntarily performed by physicians in order to change RECIST response, the application allows them to modify RECIST score if not applicable to clinical reality. This modification is recorded and archived in an audit trail system. This process reflects the real wish of physicians to change RECIST response.
A short training session (10 min) was provided to each radiologist. The training was about manual reading without dedicated software and automated reading using dedicated software. It has to be mentioned that the senior radiologist had already used the application as a standard viewer but not the application dedicated to follow up. However, reading times of the senior radiologist were not shorter than the junior radiologist ones. Both radiologists never used the dedicated application to oncologic follow ups before the training. However, reading time savings were obtained from the first readings using dedicated software. These two elements are in favour of a fast learning curve of the application and its usability. These two characteristics are needed to guarantee the integration of software application into daily routine. Indeed, the lack of ergonomics of some medical software applications impairs physicians’ workflow instead of improving it (slow learning curve, difficult to use, etc.). This can lead to a non-usage or a misuse of the application which can potentially present a dramatic impact on the patient [10].
Thus, this study allowed us to show several advantages using dedicated software for oncologic follow ups. However, we evaluated the benefit on only a sub sample of oncologic workflow. Impact of functionalities such as automated retrieving of relevant series from archiving system has not been evaluated. Additionally, the impact of functionalities explored during this study has probably been underestimated. The choice was made to evaluate only two anatomical sites (lung or liver) in order to quantify the contribution of 3D elastic target matching specifically in these organs of interest. Indeed, the follow-up of more than two lesions from different localisations and the integration of non-targets would have allowed us to better appreciate the impact of 3D elastic target matching functionality on oncologic workflow. It has to be noted that baseline studies contained measurement annotations for target lesions which allowed physicians to easily locate targets. In daily practice, it seems to be frequent that the only information provided to physicians to identify targets previously selected are simple text descriptions of their size and localisation on reports. The availability of key images remains unusual. This may result in an underestimation of manual reading times in real life with no dedicated application.
Finally, we did not show any impact of the application on inter and intra-operator reproducibility of measurements. The usage of real sums instead of calculated sums by physicians was chosen so as to not impact reproducibility results with calculation errors. Thus, evaluated reproducibility concerned 2D measurements. Calculation errors were evaluated independently. We observed an excellent reproducibility of 2D measurements. This result is in contradiction with some literature data [11]. This can possibly be explained by some elements such as the baseline pre-analysis or the small number of targets to follow. The decision to pre-analyse baselines has been taken because of the absence of dedicated functionalities allowing an optimisation of this step. During our study, RECIST response reproducibility only depended on 2D manual measurements. We did not evaluate other steps of response determination such as target selection which is known to be a critical issue of RECIST determination. Finally, it seems to be clear that the impact of dedicated applications on RECIST determination reproducibility does not stem from improvement in the measurement process. Thus, we can discuss the interest of using algorithms for automated or semi-automated segmentations of targets available in some applications dedicated to oncology. It is clear that design efforts have to be focused on developing tools influencing the real issues of RECIST determination such as target selection.

5. Conclusions

We can conclude that using dedicated applications significantly optimises RECIST readings decreasing reading times and avoiding calculation errors. This optimisation is clearly due to the automation of most of the steps of RECIST readings. However, the work has to be completed. Indeed we evaluated the impact of the application on only a sub sample of oncologic workflow. Other investigations have to be performed to better understand and quantify the impact of using such tools on daily routine, clinical research and most of all on quality of patient care in oncology. In addition the reproducibility of RECIST score measurements is excellent regardless of reader experience which confirms that dedicated applications are needed tools to standardise and simplify the usage of RECIST criteria.

Acknowledgments

Special thanks to Jacques Feldmar for reviewing and discussing about the manuscript and to Helen Green for English review and corrections. Many thanks to Nathalie Rincheval for statistical analysis.

Author Contributions

Amandine RENE: literature research, study design, clinical study, statistical analysis, data interpretation, manuscript editing, manuscript review. Sophie Aufort: study design, clinical study, data interpretation, manuscript review. Salim Si Mohamed: clinical study, manuscript review. Jean Pierre Daures: study design, statistical analysis, data interpretation, manuscript review. Stéphane Chemouny: study design, data interpretation, manuscript review. Christophe Bonnel: literature research, study design, data interpretation, manuscript review. Benoit Gallix: study design, data interpretation, manuscript review.

Conflicts of Interest

Author: Amandine Rene: PhD Industrial Student under the tutelage of University Montpellier I & II and Intrasense, SA, France for the industrial laboratory.
Co-Authors: Stéphane Chemouny/Christophe Bonnel: Intrasense, SA, France: Scientific Director/Medical director.

References

  1. Eisenhauer, E.A.; Therasse, P. New response evaluation criteria in solid tumours: Revised RECIST guideline (Version 1.1). Eur. J. Cancer 2009, 45, 228–247. [Google Scholar] [CrossRef] [PubMed]
  2. Suzuki, C.; Torkzad, M.R. Interobserver and intraobserver variability in the response evaluation of cancer therapy according to RECIST and WHO-criteria. Acta Oncol. 2010, 49, 509–514. [Google Scholar] [CrossRef]
  3. Thiesse, P.; Ollivier, L. Response rate accuracy in oncology trials: Reasons for interobserver variability. Groupe Français d’Immunothérapie of the Fédération Nationale des Centres de Lutte Contre le Cancer. J. Clin. Oncol. 1997, 15, 3507–3514. [Google Scholar] [PubMed]
  4. Levy, M.A.; Rubin, D.L. Tool support to enable evaluation of the clinical response to treatment. AMIA Ann. Symp. Proc. 2008, 2008, 399–403. [Google Scholar]
  5. Goo, J.M. A computer-aided diagnosis for evaluating lung nodules on chest CT: The current status and perspective. Korean J. Radiol. 2011, 12, 145–155. [Google Scholar] [CrossRef] [PubMed]
  6. Folio, L.R.; Sandouk, A. Consistency and Efficiency of CT Analysis of Metastatic Disease: Semi-automated Lesion Management Application Within a PACS. Am. J. Roentgenol. 2013, 201, 618–625. [Google Scholar] [CrossRef]
  7. Williams, J.C. A data-based method for assessing and reducing human error to improve operational performance. In Proceedings of the Conference Record for 1988 IEEE Fourth Conference on Human Factors and Power Plants, Monterey, CA, USA, 5–9 June 1988; pp. 436–450.
  8. Reason, J. Understanding adverse events: Human factors. Qual. Health Care 1995, 4, 80–89. [Google Scholar] [CrossRef] [PubMed]
  9. Therasse, P.; Arbuck, S. G. New guidelines to evaluate the response to treatment in solid tumors. J. Natl. Cancer Inst. 2000, 92, 205–216. [Google Scholar] [CrossRef] [PubMed]
  10. Chaudet, H.; Anceaux, F. Facteurs humains et ergonomie en informatique médicale. In Informatique médicale, e-Santé; Springer: Paris, France, 2013; pp. 495–520. [Google Scholar]
  11. Hopper, K.D.; Kasales, C.J. Analysis of interobserver and intraobserver variability in CT tumor measurements. Am. J. Roentgenol. 1996, 167, 851–854. [Google Scholar] [CrossRef]

