
Risk-Based Approach for Selecting Company Key Performance Indicator in an Example of Financial Services


1
Research Department, SIA StarBridge, LV-1050 Riga, Latvia
2
Regional Economy and Economic Policy, Baltic International Academy, LV-1019 Riga, Latvia
*
Author to whom correspondence should be addressed.
Informatics 2023, 10(2), 54; https://doi.org/10.3390/informatics10020054
Submission received: 17 March 2023
/
Revised: 16 May 2023
/
Accepted: 29 May 2023
/
Published: 19 June 2023
Abstract
:Risk management is a highly important issue for Fintech companies; moreover, it is very specific and puts forward the serious requirements toward the top management of any financial institution. This study was devoted to specifying the risk factors affecting the finance and capital adequacy of financial institutions. The authors considered the different types of risks in combination, whereas other scholars usually analyze risks in isolation; however, the authors believe that it is necessary to consider their mutual impact. The risks were estimated using the PLS-SEM method in Smart PLS-4 software. The quality of the obtained model is very high according to all indicators. Five hypotheses related to finance and five hypotheses related to capital adequacy were considered. The impact of AML, cyber, and governance risks on capital adequacy was confirmed; the effect of governance and operational risks on finance was also confirmed. Other risks have no impact on finance and capital adequacy. It is interesting that risks associated with staff have no impact on finance and capital adequacy. The findings of this study can be easily applied by any financial institution for risk analysis. Moreover, this study can serve toward a better collaboration of scholars investigating the Fintech activities and practitioners working in this sphere. The authors present a novel approach for enhancing key performance indicators (KPIs) for Fintech companies, proposing utilizing metrics that are derived from the company’s specific risks, thereby introducing an innovative method for selecting KPIs based on the inherent risks associated with the Fintech’s business model. This model aligns the KPIs with the unique risk profile of the company, fostering a fresh perspective on performance measurement within the Fintech industry.
1. Introduction
The fifth wave of innovations led to the digitalization of company operations and, consequently, the entire economy. The challenges of business process management have yet to be extensively researched, although the digitalization of the economy is frequently discussed in scientific literature [1,2,3,4,5,6]. According to Verhoef [7], the analysis of the discussed digital formation must take a multidisciplinary approach because it is only seen from the perspective of management and finance, or as a transformational issue.
All economic actions that rely on digital resources or are significantly improved by their use, including digital technologies, digital infrastructure, digital services, and data, are included in the digital economy. All producers and consumers—including the government—who use these digital tools for commerce are subject to this [8]. At the G20 meeting in 2020, this definition was provided as a component of the OBSE report. The report’s authors specifically mentioned financial and insurance services as examples of services that are entirely available online.
The exchange of cryptographic assets is a type of utility that can be considered in addition to financial services as digital. The exchange of cryptocurrencies can be categorized as an entirely digital service, even though it is not a financial service according to EEA laws [9].
In areas such as accounting, marketing, entrepreneurship, and production, the digital transformation of the economy has unveiled new challenges for managing participating companies [10,11,12,13,14].
The state of the enterprise or its processes can be objectively measured at any time if we consider a particular case of digital transformation, where all aspects of the business have undergone such a transformation and the entire business cycle is in the digital space [15,16,17]. This is because all indicators of such an enterprise at any given time are digitized and accessible. Key revenue indicators (KPIs) for the business include those [18,19]. KPIs offer unbiased metrics for an organization over a predetermined time frame. However, even though the management implications of digital transformation are being actively researched, the key indicators still need to be put forth, where they could be used to immediately identify (on the spot) the specific business states from the perspective of management and aid in immediate decision making [18,19].
The current key financial indicators (KPIs) are criticized as unsuitable for the economy’s digital transformation. This lack of availability is demonstrated by the fact that these metrics need to accurately depict the state of the business and offer the required level of process transparency for effective strategic and tactical management [19].
In the past, businesses have used key financial indicators to look back at their past performance in order to predict the future performance or maintain control over regulatory indicators [20,21,22,23,24]. The authors believe that in order for these KPIs to be in line with the realities of the digital transformation of the economy, it is necessary to increase their use in predicting how the situation will develop in order to create trigger actions based on them that will correct the current situation and, if necessary, prompt the correction of the measures themselves and the tasks that the enterprise uses.
According to Horváth and Szabó [25], digitalization is the automation of procedures using information technology. Digitalization, which can be understood as using digital technologies and data (digitized and natively digital) to generate revenue, improve businesses, and replace/transform business processes (not just digitize them), necessitates new ways of speaking and collaborating in the workplace [10]. Therefore, the role of information technology as a manufacturing process rather than as an auxiliary tool is expanding [13,26,27,28]. Scholars are confident that there are problematic issues with KPIs determination [6,13,28,29]. The authors contend that if information technology is referred to as a production process, transparent metrics are required to assess its efficacy and to identify, similarly to financial indicators, the actions that should be taken to remedy the present situation.
The authors point out that a methodology is needed to identify a list of necessary and sufficient KPIs for each specific business or process due to the multiplicity and frequent uniqueness of processes in each particular business or its portion.
The authors used a multidisciplinary approach to identify how the managerial, financial, and technological aspects of exclusively providing services in the digital space affect the risks of the company and how these risks can be mitigated by immediately identifying KPIs that measure these risks and choosing a course of action based on the values of the chosen KPIs. They used the example of the cryptocurrency exchange business to illustrate their point.
There also investigated how these risks can be mitigated by immediately identifying KPIs that measure these risks and by defining a course of action based on the values of the chosen KPIs.
The research’s objective was to examine the risk factors that affect the choice of key performance indicators. This study is the first step in developing the methodology of choosing key performance indicators for each unique company using a risk-based approach.
The practical value of this research is in developing the methodology of the key performance indicators selection for the particular business by analyzing the key risk indicators of that business. The authors present a novel strategy used to enhance key performance indicators (KPIs) for Fintech companies, proposing using metrics derived from the company’s specific risks, thus introducing an innovative method for selecting KPIs based on the inherent risks associated with the business model of Fintech. This model aligns the KPIs with the company’s unique risk profile, providing a novel perspective on performance measurement in the Fintech industry.
Another novelty of this article is in considering the risks not as separate issues but in combination, which allows for seeing not only the interrelation between different groups of risks but also estimating their mutual impact on company performance. The usual case of considering these risks is not in combination but separately.
This research has a particular scientific value since it shows the relationship between key performance and risk indicators. It develops the methodology of this specific relationship definition for any company using digital approaches.
The practical value of the research is significantly higher: stakeholders such as banks, financial institutions, crypto-currency exchangers, and other institutions can use the results of this study to understand the issue of the general acceptance of information technologies through the key performance indicators selection; it allows them to select company financial indicators based on the specificity of their business, which may use electronic automatic management systems.
2. Materials and Methods
Business continuity planning has become crucial in the digital economy because operations must always be conducted online [30]. Key risk indicators (KRIs) also assist in determining the likelihood of unfavorable situations that could impact a company’s business continuity [31]. By using key risk indicators, an organization can keep track of changes in risk and receive timely information about systemic and one-time events that may be connected to crisis situations that directly or indirectly impact an enterprise’s ability to carry out its operations.
KRIs, therefore, characterize and identify risks that have a significant manifestation in the business or deficiencies in control systems. They can be used alone or in conjunction with other fixed events associated with certain risks of the enterprise, such as balance sheet losses, audit results, and registration of customer complaints and suggestions.
Using fixed KRIs is not feasible due to the constant shift in risk events. Regularly reviewing these KRIs is necessary to safeguard the company from operational, reputational, and other risks. When the company has a thorough knowledge of the risks, it can accurately identify and choose the right risk indicators and consistently track performance using key performance indicators (KPIs) and other technologies that facilitate this process.
Therefore, the authors believe that, in order to choose process-grounded key performance indicators, it is necessary to analyze the enterprise’s risks, identify key risk indicators, and then choose key performance indicators describing the processes that lower risks in the identified areas. The risk indicators are closely connected with key performance indicators. Control and management of KPIs is required to decrease the company’s risks.
The authors attributed the companies’ risks to the following groups:
- Governance Risks—The risk that the company’s rules, processes, and mechanisms, important for oversighting and decision making, function improperly. Governance risks relate to the directors’ decisions regarding board leadership, composition, and structure. Governance risks are associated with the resourcefulness and robustness of the company’s procedures for compliance with the relevant framework of laws, including the quality of reporting lines [23].
- Human Resources Risks—The risks that human resources pose on the company’s operations [34].
- Health and Safety Risks—The risk of the company being exposed to a health and safety hazard that may result in harm, injury, death, or illness of an employee in a specific workplace [35].
- Financial Risks—The risk a company may face that results in the possibility of losing money on an investment or business project [36].
- Cyber Risks—This risk includes hardware and software failures, spam, viruses, malicious attacks, and other ICT matters [37].
- Capital Adequacy Risks—Risks arising from the firm’s capital position, the adequacy of capital to support the level of current and anticipated business activities, and the access to further capital [38].
- Environmental/External Risks—Risks arising from economic events that are out of the control of the corporate structure [39].
- Law and Regulation Risks—The risk that the firm suffers financial, reputational, or litigation damage through failure to monitor, control, and eliminate or substantially reduce regulatory compliance risk [40].
- Strategic Risks—The risk of loss arising from adverse business decisions that are poorly aligned to strategic goals, failed execution of policies and processes designed to meet those goals, and inability to respond to macroeconomic and industry dynamics. Strategic risks are also those risks associated with operating in a specific industry [41].
- Financial Crime Risks—The risks that arise from the failure to prevent financial crime, money laundering, and market abuse [42].
2.1. Risk, Threats and Vulnerabilities
The effectiveness of the risk-based strategy depends on an accurate understanding of the risk to which the Fintech company is exposed. In this case, the risk is viewed as an inherent risk, or the risk one must take before adopting and implementing any processes, policies, controls, or other steps to lessen it. Before preparing for the interviews with the representatives of companies operating on the financial markets for risk assessment, the authors analyzed how risk might occur, keeping in mind two risk elements: vulnerabilities, or weaknesses that could be exploited for risk purposes, and threats, or outside forces that try to take advantage of company vulnerabilities [31,32,37,43,44].
The effect of the threat or vulnerability and the likelihood of the threat or vulnerability are the two factors that are used in the calculations for both threats and vulnerabilities. Whereas the likelihood of threats or vulnerabilities occurring during the reporting period is based on objective data, the effect of threats is determined by the expert assessment of risk managers.
Impact describes the kind and extent of damage that would result from exposing one or more vulnerabilities. Any risks that the authors outlined above could result in this harm. The combinations of likelihood and impact determine the inherent risk for the entity/person/process, etc. The authors proposed classifying list of threats and vulnerabilities, elaborated by the authors, according to effect and probability of the threat and vulnerability revealed within the aforementioned risks; the classified risks can be further utilized in questionnaires for financial institutions.
The risk analysis begins by determining the possible improper issues in the entity functioning. These drawbacks need to be compared to a probability metric that gauges the possibility that the event will occur.
2.2. Methods
Preliminary research was conducted to identify the components and indicators of the model. For this purpose, the authors interviewed 5 distinct financial and Fintech companies in the European Union. The authors employed risk element-specific questionnaires for these interviews.
The criteria for these companies’ selection are the following:
- The respondent is a company registered in the European Union;
- The company is regulated or supervised by the financial company supervisor;
- The company has a risk management department or risk professionals;
- The company is involved in the payment business;
- Each risk event represents a threat or series of threats that exposes a company’s current vulnerabilities. The proper values of the vulnerabilities must be used to evaluate the threat impact or likelihood of the risk event.
The semi-structured interviews were conducted in 2017 and 2022. The model’s elements and indicators were collected during this time period, where 5 companies were interviewed.
The following criteria were prepared by the authors within the Table 1 for assessing the impacts of the threats and vulnerabilities by the participating companies:
The authors presented Table 2 with the following criteria to respondents to gauge the probability of threats and vulnerabilities:
2.2.1. Risk Calculation
In accordance with [45], the risk was calculated as follows:
where:
- IR—inherent risk;
- Im—the impact of the risk;
- L—the likelihood of the risk.
The probability and effect of the inherent risk were calculated by the authors as the average of the likelihood and impact of each threat and vulnerability combination that made up the risk. The final threat and vulnerability were calculated as the average of all factors involved in the computation, including threats, vulnerabilities, impacts, and likelihoods if the same risk generates multiple threats and vulnerabilities (Source: the formula developed by the authors).
where:
- Im—the impact of the risk;
- Tii—threat impact per each of the threats within the risk group;
- Vi—vulnerabilities impact;
- m—number of vulnerabilities per risk group;
- n—number of threats per risk group.
- L—the likelihood of the risk;
- Tli—threat likelihood per each of the threats within the risk group;
- Vl—vulnerabilities likelihood;
- m—number of vulnerabilities per risk group;
- n—number of threats per risk group.
The impact and likelihood was calculated based on the following classification (Table 3):
Inherent risk value interpretation—numeric ranges are as follows: very low (VL) is from 0 to 5, low (L) is from 5.01–10, medium (M) is from 10.01 to 15, high (H) is from 15.01 to 20, and very high (VH) is from 20.01 to 25.
For the simultaneous analysis of several statistical relationships, the researchers primarily used two methods for structural equation modeling (SEM): partial least squares structural equation modeling (PLS-SEM) and covariance-based structural equation modeling (CB- SEM) [46,47,48]. The PLS-SEM methodology was selected since this methodology is more effective for the small data samples, which are used for exploratory and confirmatory types of research, and does not put forward the requirements for data normal distribution. [49,50].
A practical causal-predictive analysis can be performed using PLS-SEM, which also explains the variance in the independent constructs [47,48]. PLS-SEM enables forecasting the behavior of an unusual entity by combining a regression-based path analysis and analysis of the most crucial components [51]. This method can also define mediating and moderating effects and illustrate direct and indirect relationships [52]. Most researchers working in cutting-edge fields favor this approach [46].
The PLS-SEM technique takes into account both an inner and an outer model. The outer model takes into account the relationships between the latent variables and their reported indicators, whereas the inner model takes into account the relationships between independent and dependent latent variables. Latent variables, also known as constructs, are variables that cannot be evaluated directly.
The same ground was applied to key performance indicators as it was to financial and capital adequacy risks. As a result, other risk groups determine the model assumptions that might impact them. Given that the risk groups mentioned above reflect both internal and external processes, the authors decided that internal processes should be represented by the risk groups chosen for the modeling:
- Governance risk;
- ICT risk;
- Operational risk;
- Financial crime risk;
- Human resources risk.
The first group of hypotheses (H1–H5) related to financial risk:
H1.
Governance Risk has a direct impact on company KPI.
H2.
ICT Risk has a direct impact on company KPI.
H3.
Operational Risk has a direct impact on company KPI.
H4.
Financial Crime Risk has a direct impact on company KPI.
H5.
Human Resource Risk has a direct impact on company KPI.
The second group of hypotheses (H6–H10) related to capital adequacy risk:
H6.
Governance Risk has a direct impact on company KPI.
H7.
ICT Risk directly impacts company KPI.
H8.
Operational Risk directly impacts company KPI.
H9.
Financial Crime Risk directly impacts company KPI.
H10.
Human Resource Risk has a direct impact on company KPI.
2.2.2. Model Estimation Using the SmartPLS Software
Three steps made up the PLS-SEM analysis in SmartPLS:
- The validity of the outer paradigm or construct was assessed. The research included looking into the indicator loadings for the theoretically determined constructs and evaluating the model’s validity and dependability. Additionally, it was established how many iterations would be necessary for SmartPLS to finish the evaluation.
- The inner model (structural model) assessed how the categories related to one another. The coefficient of determination (R2), standardized path coefficients (B), and impact size (f2) were used to accomplish this.
- A broad evaluation of the model (overall model evaluation) was conducted to determine how well the model fits the data. This can be accomplished in SmartPLS by applying the SRM exact fit parameters.
The authors used the following values, mentioned in the Table 4, for model evaluation in the software SmartPLS:
Poor dependability is indicated by values less than 0.5, and loading with a CR of less than 0.5 should be removed from the dataset. However, in this research, each loading had a design confidence greater than 0.5; therefore, they were all incorporated into the model loadings.
3. Results
3.1. Preliminary Research
The authors created a list of common threats and vulnerabilities in the payments sector. The aforementioned lists were created in collaboration with the risk experts of the chosen businesses. There are clear differences between the respondents engaged in the section on capital adequacy:
- Banks (credit institutions) pay the government for funds that serve as guarantees for the customer deposits that they take. The government will use these funds to reimburse the customer funds in case of the bank’s bankruptcy. As a result, the only factor affecting capital adequacy is the liquidity of bank funds [69].
The capital adequacy goal is the same for all kinds of businesses, despite variations in the nature of the risk and its control methods. The authors contend that, because all business types use the same capital adequacy risk assessment criteria, it can be assumed that the tasks involved in risk management are comparable.
According to the respondents, all other criteria (risk groups) apply to all businesses, making it possible to evaluate corporate risks using the same lists of threats and vulnerabilities, impact, and likelihood criteria.
Threats and vulnerabilities were evaluated according to their capacity to address all risk groups in the preliminary definition of the threats and vulnerabilities. Table A1 of Appendix A contains the final list of threats, whereas Table A2 of Appendix A contains the final list of vulnerabilities.
The respondents who participated in the interviews filled out the likelihood and impact values of threats and vulnerabilities. The interviews’ threat impact estimations were recorded in Table A3 of Appendix A, and the threat likelihood was recorded in Table A4 of Appendix A. The interviews’ vulnerabilities impact estimations were recorded in Table A5 of Appendix A, and the threat likelihood was recorded in Table A6 of Appendix A.
According to the methodology, the authors determined the risk associated with each threat faced by each respondent, after which they computed the average number for each risk group and respondent. Table A7 in Appendix A serves as a record of the ultimate results table. These results were used as a data source for the PLS-SEM analysis in SmartPLS.
3.2. Outer Model Evaluation—Construct Validity
The relationships shown by the collection of hypotheses served as the foundation for the model created with the SmartPLS software. Since such a boundary value is acceptable for exploratory research, SmartPLS 4.0’s application of PLS-SEM led to the selection of indicators of latent variables with loadings > 0.60 as the first step (see Table 4). Since all of the latent variable values were greater than 0.60, they were all considered in the model.
All loading weights for each variable were greater than 0.6, so they were all considered.
The values of the construct validity metrics for the outer model, which are composite reliability (CR) and average variance extracted (AVE), were all within the necessary bounds (see Table 4), and are listed in Table 5. A high dependability and internal consistency values were shown for each construct. The composite reliability was >0.984, and the average variance extracted was >0.942, indicating that the considered variables accurately represented the latent constructs intended for measurement.
The discriminant validity assessment, which identifies the differences between the constructs within the model, is considered necessary for outer model estimation. The Fornell–Larcker criterion and the heterotrait–monotrait ratio of correlations are two commonly used techniques to assess the discriminating validity in PLS SEM (HTMT).
The Fornell–Larcker criterion is the most common measure for assessing the discriminant validity in PLS-SEM. In some situations, the Fornell–Larcker criterion is considered weaker, more prone to error, and ineffective [75,76]. A more stringent standard is the heterotrait–monotrait ratio of correlations (HTMT) approach [62]. Hair et al. [76] suggested using HTMT [63] rather than the Fornell–Larcker technique due to its exaggerations when detecting discriminant validity. However, it is also advised to consider the model’s setting and the researcher’s level of conservatism when evaluating the discriminant validity [77].
Cross-loads demonstrated that each indicator had the highest loads in the construct initially intended to measure, and that the results fully satisfied the Fornell–Larcker criterion (see Table 6). All hidden variables fulfilled the HTMT requirement (see Table 7). There is no risk of any kind that will demonstrate an absence of discriminant validity.
The cross-loading indicators show the perfect discriminate validity of the factors.
An indicator of the degree of multicollinearity in regression analysis is the variance inflation factor (VIF). In a multiple regression model, multicollinearity occurs when there is a correlation between several independent factors. Examining the variance inflation factor (VIF) values (see Table 8), which should not be greater than 3.3, allows for an examination of multicollinearity [65,66,67]. For this model, the highest variance inflation factor (VIF) was 2.665. As a result, multicollinearity is apparently not an issue.
3.3. Evaluation of the Inner Model (Structural Model). Verifying the Hypotheses
The inner model uses the coefficient of determination (R2), standardized path coefficients (β), and impact size (f2) to characterize the relationships between the constructs. Fewer than the permitted 10 iterations—7—were completed before the study was terminated [47,63].
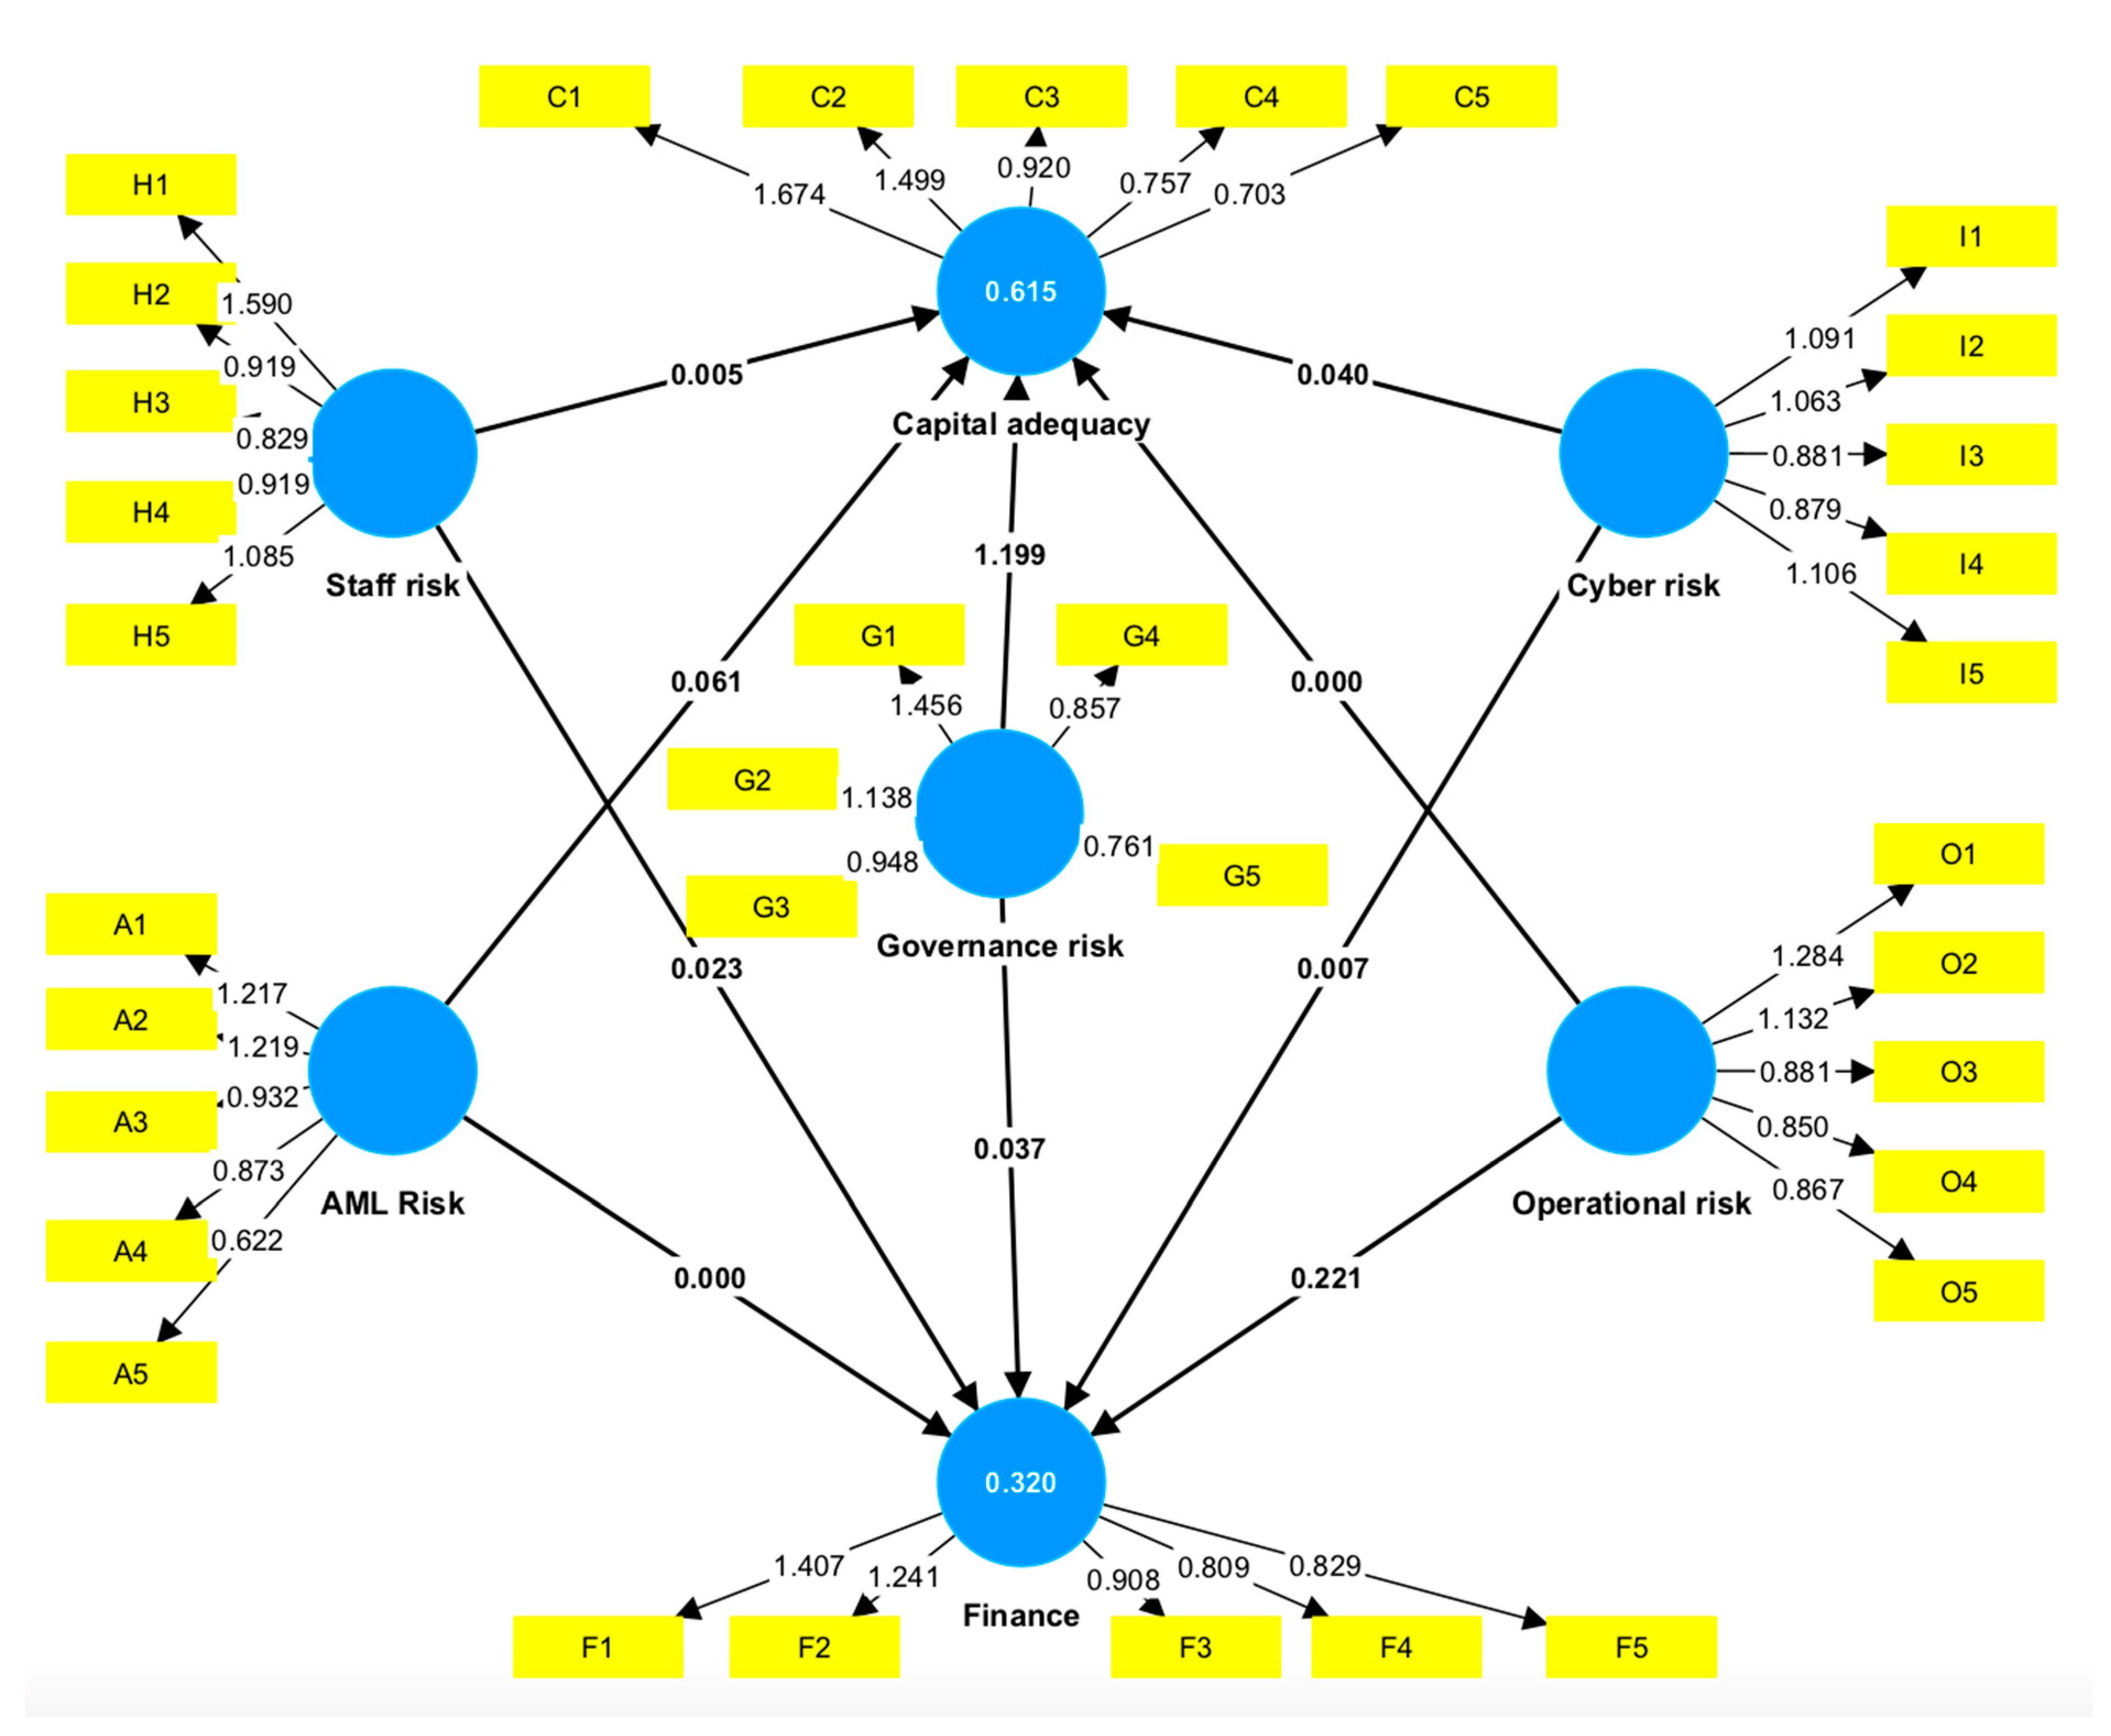
As stated, we first looked into the model using the relationships specified in the model’s framework (see Figure 1).
In the present study, the R2 values for the constructs “Capital Adequacy Risk” and “Financial Risk” as the target variables of the model were of the greatest interest. The latent variables of the model explained that about 61.5% of the other types of risks affect the capital adequacy risk, and 32.0% of the other types of risk affect the financial risk (see Table 9). This is a relatively high level of R2, indicating that the research determined the key factors that can influence the financial and capital adequacy for Fintech companies and, most likely, in businesses of comparable size and infrastructure.
Only five of ten hypotheses regarding the precise relationship between risks and other factors were confirmed (see Table 10). At the same time, it was found that governance risk has the biggest overall impact on capital sufficiency risk (β = 0.742 ± 0.722), and that cyber risk has the smallest overall impact (β = 0.119 ± 0.802).
3.4. Overall Model Assessment
Without a comprehensive model evaluation, a PLS-SEM study cannot be finished. Unfortunately, this estimate did not perform excellently; the result of the standardized root means squared residual (SRMR) was 0.089, whereas the necessary value is 0.080. This difference is not terrible though, so it is still worth taking into account the findings of this research.
Given these details, we can conclude that the task has been completed and the exploration has been successfully conducted, with a clear grasp of its limitations and future research directions. Therefore, given the relationship between various types of risks and financial and capital adequacy risks, we will explore some opportunities in the discussion section.
4. Discussion
The research results show that human resources risks (staff risk) do not correlate with the financial and capital adequacy risk. Assessing and addressing the possible risks associated with having a workforce is known as human resources risks. These risks are linked to employee behavior and how the company recruits, retains, and manages employees and other kinds of workers. Despite the numerous articles where scholars define the importance of labor force management for the management of the company, this research shows that, based on the evaluations of five Fintech companies working in different fields and countries and further model evaluation, risk related to labor force—inadequate management or absence—does not have a direct effect on the financial results of the company.
Another result of the research is related to governance risk. The governance risk shows a strong correlation with the capital adequacy risk. This result emphasizes that despite the high digitalization of the Fintech business, the major influence on the company’s financial results is as a result of the company governance. In other words, it is not the effectiveness of the IT systems of the company but the effectiveness of the governance provided by the company’s managerial board that plays a major role.
The authors of this research show that KPIs have an obvious relationship with KRIs. Scholars distinguish KPIs and KRIs. KRIs are used to identify the possible risks, whereas KPIs evaluate the company performance. Even now, many businesses use these terms interchangeably. KPIs are frequently made to provide a broad overview of organizational success. Thus, even though these metrics might not be able to provide sufficient early warning signals of a developing risk, they are crucial for trend analysis and performance monitoring. KRIs emphasize just the opposite.
Research Limitations
Data from five distinct types of Fintech companies were used in the study. In terms of size, the degree of digitalization, and customer service strategies, we believe that other types of Fintech companies will have similar influencing risks with respect to the financial and capital adequacy risks. However, they were not considered by the authors, which can be seen as a limitation of this study.
The group of factors selected to establish the model construct also poses a restriction. Although the authors made an effort to take into account all potential indicators, it is still possible to broaden the set of indicators used, add additional variables, or use a different technique for data analysis.
Additionally, survey errors, particularly coverage and sampling errors, are a component of sampling studies. There will almost certainly be a difference between the sample and the general community. The findings of a single sample research cannot be regarded as representative if a large-scale randomized study has not been carried out. In such circumstances, numerous sample studies carried out by various authors can yield representative results.
It should be emphasized that the types of risks involved in this study limited the way in which the model could be interpreted. The authors decided that internal processes should be represented by the internal risk groups chosen for the modeling because the risk groups mentioned above reflect both internal and external processes. This decision can be seen as a limitation of this research because internal processes should be represented by internal risk groups.
5. Conclusions
The authors analyzed the key risk indicators of the business and the correlations between the company’s risk indicators with the purpose of developing the methodology for the key performance indicators selection. By choosing suitable KPIs based on observations of the business events specified by the risk parametrizations, the digitalization of the financial services industry, or Fintech, puts forward the requirements for digitalizing the company’s management processes.
The model’s elements and indicators were identified through the preliminary research. The authors interviewed five financial and Fintech companies in the European Union for this reason. Together with the risk specialists of these companies, a final risk elements list was created and grouped within the questionnaires. The risk components evaluations, based on the above-mentioned questionnaires, were used as a data source for the model. Taking into account the sensitivity of the data regarding their risks, the interviewees consented to participate under the condition of anonymity.
The authors agree that a larger sample size would contribute to the robustness of the results. A larger sample would help to capture a broader range of perspectives and experiences, thereby increasing the reliability and generalizability of the findings. This could involve expanding the number of financial and Fintech companies interviewed or including a more diverse set of participants, such as regulators, industry experts, or academics.
However, the purpose of the research was to evaluate the novel concept of selecting KPIs based on the five distinct categories of Fintech business models represented by risk indicators. The goal was to gain rich insights from a smaller number of participants rather than aiming for statistical representativeness. This approach allows for a detailed exploration of the risk factors and their impact on finance and capital adequacy in specific contexts. It would be beneficial for future studies to consider both qualitative and quantitative approaches. This would provide a more comprehensive analysis by combining in-depth interviews with a larger survey or data analysis, ensuring a balanced and well-rounded investigation.
Within this research, the model was constructed based on the risk types, representing the internal processes of the company. The authors considered the following groups of risks: governance risk, ICT risk, operational risk, financial crime risk, and human resources risk, and their impact on finance and capital adequacy. The model verified the correlation of the risk, representing internal processes toward the financial risk and capital adequacy risk. The authors assume that financial and capital adequacy risks are connected to the financial KPIs of the company. The study was carried out using PLS-SEM in SmartPLS 4.0 software.
The research shows that all the risks considered in the model, except for staff risk, correlate with the financial and/or capital adequacy risk. Approximately 61.5% of the other categories of risks that affect capital adequacy risk and 32.0% of the other types of risks that affect financial risk were explained by latent variables in the obtained model. The primary factors influencing the different risk types that impact financial and capital adequacy risk were identified in this study. These data could be used to create manual or automated KPI selection and evaluation models for Fintech firms or other businesses with comparable degrees of digitalization.
Despite the lack of a definitive correlation between staff risk and financial or capital adequacy risk, since the related hypothesis was rejected, this element significantly influenced the creation of the model. Events pertaining to these categories of risks must be excluded from the final model construction and calculation.
As a result, this research identified the crucial elements influencing the growth of KPIs based on financial and capital adequacy risk.
Stakeholders in this procedure include all divisions of Fintech companies. The outcomes can be used as a foundation for initiatives that seek to automate performance results. The purpose of this study was to demonstrate that the unified methodology for Fintech’s risks brings additional benefits, apart from the risk management efficacy itself: the ability to select KPIs based on the unique business model of Fintech. The authors devised an innovative approach to selecting comprehensive KPIs, covering all aspects of the exact Fintech business model.
All divisions of Fintech companies are stakeholders in this procedure. The obtained results can be used as a foundation for initiatives oriented toward automating the performance results analysis.
Author Contributions
Conceptualization, O.C.; methodology, Y.P. and O.C.; software, D.C.; validation, O.C., Y.P. and D.C.; formal analysis, O.C.; investigation, O.C.; data curation, Y.P.; writing—original draft preparation, O.C.; writing—review and editing, Y.P.; visualization, D.C.; supervision, Y.P. All authors have read and agreed to the published version of the manuscript.
Funding
This research received no external funding.
Institutional Review Board Statement
Not applicable.
Informed Consent Statement
Not applicable.
Data Availability Statement
Data is contained within the Appendix A.
Conflicts of Interest
The authors declare no conflict of interest.
Appendix A

Table A1.
The list of threats.
| Threat Group | Threat | Governance Risks | Operational Risks | Human Resources Risks | Financial Risks | ICT Risks | Capital Adequacy Risks | Financial Crime Risks |
|---|---|---|---|---|---|---|---|---|
| 1 Ecosystem pollution | Air pollution | X | X | |||||
| 2 Ecosystem pollution | Environmental accidents | X | X | |||||
| 3 Extreme weather events | Earthquake | X | X | |||||
| 4 Extreme weather events | Flooding | X | X | |||||
| 5 Extreme weather events | Hurricane | X | X | |||||
| 6 Extreme weather events | Lightning | X | X | |||||
| 7 Extreme weather events | Heat waves | X | X | |||||
| 8 Extreme weather events | Fire | X | X | |||||
| 9 Ecosystem pollution | Water scarcity—Lack or insufficient supply of water | X | X | |||||
| 10 Market risk | Public policy change—Pollution control regulations | X | ||||||
| 11 Market risk | Shifting sentiment—Changes in consumer preference for certain products | X | ||||||
| 12 Remote work | Pandemic | X | X | X | X | X | ||
| 13 Company culture | Harassment | X | ||||||
| 14 Company culture | Discrimination | X | ||||||
| 15 Company culture | Eavesdropping | X | X | |||||
| 16 Humane resource | Illegal import/export of software | X | X | X | ||||
| 17 Humane resource | Illegal use of software | X | X | X | ||||
| 18 Humane resource | Maintenance error | X | X | X | ||||
| 19 Humane resource | Misuse of resources | X | X | X | ||||
| 20 Humane resource | Operational support staff error | X | X | X | X | |||
| 21 Humane resource | Staff shortage | X | X | X | X | |||
| 22 Humane resource | Staff mistakes | X | X | X | X | X | X | |
| 23 Manipulated data | Malware | X | X | X | ||||
| 24 Supply | Use of software in an unauthorized way | X | ||||||
| 25 Manipulated data | Communications infiltration | X | ||||||
| 26 Manipulated data | Misrouting or rerouting of messages | X | X | X | ||||
| 27 Manipulated data | Unauthorized use of software | X | ||||||
| 28 Manipulated data | Unauthorized use of storage media | X | ||||||
| 29 Manipulated data | Willful damage | X | X | X | X | X | ||
| 30 Remote work | Masquerading of user identity | X | X | |||||
| 31 Remote work | Network access by unauthorized persons | X | X | |||||
| 32 Remote work | Repudiation (e.g., of services, transactions, sending/receiving messages) | X | X | |||||
| 33 Remote work | Use of software by unauthorized users | X | ||||||
| 34 Communication | Damage to communication lines/cables | X | X | X | ||||
| 35 Communication | Failure of communications services | X | X | |||||
| 36 Communication | Failure of network components | X | ||||||
| 37 Communication | Traffic overloading | X | ||||||
| 38 Communication | Transmission errors | X | ||||||
| 39 Communication | Use of network facilities in an unauthorized way | X | ||||||
| 40 Hardware | Air conditioning failure | X | X | X | X | |||
| 41 Hardware | Bomb attack | X | X | X | ||||
| 42 Hardware | Deterioration of storage media | X | X | X | ||||
| 43 Hardware | Hardware failure | X | ||||||
| 44 Hardware | Industrial action | X | ||||||
| 45 Hardware | Theft | X | X | X | X | X | X | |
| 46 Supply | Failure of power supply | X | ||||||
| 47 Supply | Power fluctuation | X | ||||||
| 48 Supply | Software failure | X | X | X | X | X | X | X |
| 49 Customer-related threats—Customer | Client works in high-risk sector | X | ||||||
| 50 Customer-related threats—Customer | UBO of the company works in high-risk sector | X | ||||||
| 51 Customer-related threats—Customer | Representative of the private individual works in high-risk sector | X | ||||||
| 52 Customer-related threats—Customer | Client family member of politically exposed person | X | ||||||
| 53 Customer-related threats—Customer | UBO family member of politically exposed person | X | ||||||
| 54 Customer-related threats—Customer | Client representative family member of politically exposed person | X | ||||||
| 55 Customer-related threats—Customer | Client representative associated to politically exposed person | X | ||||||
| 56 Customer-related threats—Customer | Client associated to politically exposed person | X | ||||||
| 57 Customer-related threats—Customer | Client representative politically exposed person | X | ||||||
| 58 Customer-related threats—Customer | Client foreign politically exposed person | X | ||||||
| 59 Customer-related threats—Customer | UBO foreign politically exposed person | X | ||||||
| 60 Customer-related threats—Customer | Client representative foreign politically exposed person | X | ||||||
| 61 Customer-related threats—Customer | Client domestical politically exposed person (PEP) | X | ||||||
| 62 Customer-related threats—Customer | UBO domestical politically exposed person (PEP) | X | ||||||
| 63 Customer-related threats—Customer | Client representative domestical politically exposed person (PEP) | X | ||||||
| 64 Customer-related threats—Customer | Company incorporation type | X | ||||||
| 65 Customer-related threats—Customer | Concealment of beneficial ownership | X | ||||||
| 66 Customer-related threats—Customer | Shell company | X | ||||||
| 67 Customer-related threats—Customer | Shell bank | X | ||||||
| 68 Customer-related threats—Transactions | High turnover | X | ||||||
| 69 Customer-related threats—Customer | Reliable bad adverse media | X | ||||||
| 70 Customer-related threats—Customer | Non-reliable bad adverse media | X | ||||||
| 71 Customer-related threats—Customer | Received request to freeze customer’s UBO (FIAU, MFSA, police, court, etc.) | X | X | X | X | |||
| 72 Customer-related threats—Customer | Received request to freeze customer’s UBO (FIAU, MFSA, police, court, etc.) | X | X | X | X | |||
| 73 Customer-related threats—Transactions | Received request to monitor customer’s transaction (FIAU); | X | X | X | X | |||
| 74 Customer-related threats—Transactions | Information request (FIAU, MFSA, police, court) | X | X | |||||
| 75 Customer-related threats—Transactions | STR/STA submitted regarding the customer or their UBO; | X | X | |||||
| 76 Customer-related threats—Transactions | STR/STA submitted regarding the customer’s UBO; | X | X | |||||
| 77 Customer-related threats—Customer | Customer in the terrorist list | X | X | X | X | |||
| 78 Customer-related threats—Customer | Customer UBO in the terrorist list | X | X | X | X | |||
| 79 Customer-related threats—Customer | Customer representative in the terrorist list | X | X | X | X | |||
| 80 Customer-related threats—Customer | Sanctions on the customer | X | X | X | ||||
| 81 Customer-related threats—Customer | Sanctions on the customer shareholders or UBOs | X | X | X | ||||
| 82 Customer-related threats—Customer | Sanctions on the customer representative | X | X | X | ||||
| 83 Customer-related threats—Customer | Identity fraud | X | X | X | ||||
| 84 Customer-related threats—Customer | Non-identified parties account usage | X | ||||||
| 85 Customer-related threats—Customer | False/incorrect personal data | X | ||||||
| 86 Customer-related threats—Customer | False/incorrect personal data of UBO, or authorized/representative persons. | X | ||||||
| 87 Customer-related threats—Customer | False/incorrect personal data of customer representative | X | ||||||
| 88 Customer-related threats—Customer | Customer issue bearer shares | X | ||||||
| 89 Customer-related threats—Customer | Complex ownership structure and opaque business structures (e.g., non-transparent, with several layers) | X | ||||||
| 90 Customer-related threats—Transactions | Tax evasion | X | ||||||
| 91 Customer-related threats—Transactions | Local criminal groups | X | ||||||
| 92 Customer-related threats—Transactions | Drug trafficking | X | ||||||
| 93 Customer-related threats—Transactions | Fraud and misappropriation | X | ||||||
| 94 Customer-related threats—Transactions | Corruption and bribery | X | ||||||
| 95 Customer-related threats—Transactions | Smuggling | X | ||||||
| 96 Customer-related threats—Transactions | Theft and receipt of stolen goods | X | ||||||
| 97 Customer-related threats—Transactions | Armed robbery | X | ||||||
| 98 Customer-related threats—Transactions | Living on the earnings of prostitution | X | ||||||
| 99 Customer-related threats—Transactions | Usury | X | ||||||
| 100 Customer-related threats—Transactions | Illegal gambling and violations of the Gaming Act | X | ||||||
| 101 Customer-related threats—Transactions | Human trafficking | X | ||||||
| 102 Customer-related threats—Transactions | Arms trafficking | X | ||||||
| 103 Customer-related threats—Transactions | Smuggling of persons | X | ||||||
| 104 Customer-related threats—Transactions | Unlicensed financial services | X | ||||||
| 105 Customer-related threats—Transactions | Terrorism and terrorist financing—Raising funds from criminal activities | X | ||||||
| 106 Customer-related threats—Transactions | Terrorism and terrorist financing—Raising funds from legal activity | X | ||||||
| 107 Customer-related threats—Transactions | Sexual exploitation, including sexual exploitation of children | X | ||||||
| 108 Customer-related threats—Transactions | Counterfeiting currency | X | ||||||
| 109 Customer-related threats—Transactions | Environmental crime (illegal fishing, logging, dumping, mining, constrictions) | X | ||||||
| 110 Customer-related threats—Transactions | Murder, grievous bodily injury | X | ||||||
| 111 Customer-related threats—Transactions | Counterfeiting and piracy of products | X | ||||||
| 112 Customer-related threats—Transactions | Kidnapping, illegal restraint, and hostage taking | X | ||||||
| 113 Customer-related threats—Transactions | Extortion | X | ||||||
| 114 Customer-related threats—Transactions | Forgery | X | ||||||
| 115 Customer-related threats—Transactions | Piracy (i.e., maritime) | X | ||||||
| 116 Customer-related threats—Transactions | Insider trading and market manipulation | X | ||||||
| 117 Customer-related threats—Transactions | Unauthorized (unlicensed) commercial activity | X | ||||||
| 118 Customer-related threats—Product | Product risk—SEPA payments | X | X | |||||
| 119 Customer-related threats—Product | Product risk—SWIFT payments | X | X | |||||
| 120 Customer-related threats—Product | Product risk—money send | X | X | |||||
| 121 Customer-related threats—Product | Product risk—payment cards | X | X | |||||
| 122 Customer-related threats—Product | Product risk—card purchases | X | X | |||||
| 123 Customer-related threats—Product | Product risk—card cash withdrawal | X | X | |||||
| 124 Customer-related threats—Product | Product risk—card credit voucher | X | X | |||||
| 125 Customer-related threats—Product | Product risk—cor. accounts payments | X | X | |||||
| 126 Customer-related threats—Product | Product risk—cash operations | X | X | |||||
| 127 Customer-related threats—Product | Product risk—transaction to cryptocurrency | X | X | |||||
| 128 Customer-related threats—Product | Product risk—transaction to gambling | X | X | |||||
| 129 Customer-related threats—Product | Product risk—transaction received from sanctioned country | X | X | X | ||||
| 130 Customer-related threats—Product | Product risk—transaction sent to sanctioned country | X | X | X | ||||
| 131 Customer-related threats—Product | Product risk—transaction sent/received to/from sanctioned entity. | X | X | X | X | |||
| 132 Customer-related threats—Product | Product risk—transactions sent to high-risk country (high AML, terrorism, criminal, corruption/bribery level) | X | X | X | ||||
| 133 Customer-related threats—Product | Product risk—transactions received from high-risk country (high AML, terrorism, criminal, corruption/bribery level) | X | X | X | ||||
| 134 Customer-related threats—Product | Product risk—transaction counteragent is included in terrorist list | X | X | X | X | |||
| 135 Customer-related threats—Geographic | Customer’s geographical location is in country with comprehensive sanctions | X | X | X | ||||
| 136 Customer-related threats—Geographic | UBO of the customer geographical location is in country with comprehensive sanctions | X | X | X | ||||
| 137 Customer-related threats—Geographic | Customer representative geographical location is in country with comprehensive sanctions | X | X | X | ||||
| 138 Customer-related threats—Geographic | Customer’s geographical location or their financial connections is in high-risk country (high AML, terrorism, criminal, corruption/bribery level) | X | X | X | ||||
| 139 Customer-related threats—Geographic | UBO of the customer’s geographical location or their financial connections is in high-risk country (high AML, terrorism, criminal, corruption/bribery level) | X | X | X | ||||
| 140 Customer-related threats—Geographic | Customer’s representative geographical location or their financial connections is in high-risk country (high AML, terrorism, criminal, corruption/bribery level) | X | X | X | ||||
| 141 Customer-related threats—Geographic | Geographical location of institution, branches | X | X | X | ||||
| 142 Customer-related threats—Customer | Face-to-face identification | X | X | |||||
| 143 Customer-related threats—Customer | Identification by distributor | X | X | |||||
| 144 Customer-related threats—Customer | Non-face-to-face identification | X | X | |||||
| 145 Customer-related threats—Transactions | Transaction initiated in the shop | X | ||||||
| 146 Customer-related threats—Transactions | Transaction initiated remotely | X | ||||||
| 147 Customer-related threats—Transactions | Transaction initiated by PISP | X | ||||||
| 148 Credit risk | Unallowed overdrafts | X | X | X | X | |||
| 149 Credit risk | Unallowed overdrafts with reserves | X | X | X | X | |||
| 150 Market risk | Recession | X | X | |||||
| 151 Market risk | Political turmoil | X | X | |||||
| 152 Market risk | Changes in interest rates | X | X | |||||
| 153 Market risk | Terrorist/pirates attacks | X | X | X | ||||
| 154 Market risk | War | X | X | X | X | X | X | X |
| 155 Market risk | Strikes | X | X | X | X | |||
| 156 Unsystematic risk | Regulators fines | X | X | X | X | X | ||
| 157 Unsystematic risk | Product supply suspension | X | X | X | X | X | ||
| 158 Unsystematic risk | Law cases | X | X | X | X | X | X | |
| 159 Market risk | Product price change on the market/product not competitive | X | X | X | X | |||
| 160 Compliance | Product area of use violence | X | X | X | X | |||
| 161 Compliance | Product licensor regulation violation | X | X | X | X | |||
| 162 Compliance | Current product does not correspond to new regulators norms | X | X | X | X | X | ||
| 163 Compliance | Payment systems regulation violence | X | X | X | X | |||
| 164 Compliance | Partner due diligence absence | X | X | X | X | X | ||
| 165 Compliance | Sign agreement with the out-source without prior approval from regulator | X | X | X | X | |||
| 166 Compliance | Use of cloud solutions, rendered services not in accordance with EBA regulation | X | X | X | X | |||
| 167 Compliance | Do not support PISP, AISP | X | X | X | X | X | ||
| 168 Compliance | Do not apply SCA in accordance with norms | X | X | X | X | X | ||
| 169 Compliance | Financial institution operates below the minimum regulatory capital ratios or with negative own funds | X | X | X | X | |||
| 170 Compliance | Correspondent bank deducts funds without approval from customer funds segregation account | X | X | X | ||||
| 171 Compliance | The customer “Right to Be Forgotten” was not realized | X | X | X | X | X | X | |
| 172 Compliance | The customers data were shared with GDPR violation | X | X | X | X | X | X | |
| 173 Compliance | Breach of payment card data | X | X | X | X | X | ||
| 174 Compliance | Disclosure of protected health information | X | X | X | X | X | X | |
| 175 Compliance | Not appointed or trained data protection officer | X | X | X | X | X | X | |
| 176 Compliance | Not easy to identify and/or no data upon customer request available | X | X | X | ||||
| 177 Compliance | The business continuity plan not tested | X | X | X | ||||
| 178 Compliance | The ICT risk not assessed and/or reported | X | X | |||||
| 179 Compliance | Governance risk not assessed and/or reported | X | ||||||
| 180 Compliance | Operational risk not assessed and/or reported | X | X | |||||
| 181 Compliance | Human resource risk not assessed and/or reported | X | X | |||||
| 182 Compliance | Health and safety risk not assessed and/or reported | X | ||||||
| 183 Compliance | Financial risk not assessed and/or reported | X | X | |||||
| 184 Compliance | Capital adequacy risk not assessed and/or reported | X | X | |||||
| 185 Compliance | Environmental/external risk not assessed and/or reported | X | ||||||
| 186 Compliance | Law/compliance risk not assessed and/or reported | X | ||||||
| 187 Compliance | Strategic risk not assessed and/or reported | X | ||||||
| 188 Compliance | Financial crime risk not assessed and/or reported | X | X | |||||
| 189 Compliance | The compliance officer was not assigned | X | X | |||||
| 190 Compliance | The MLRO was not assigned | X | X | X | ||||
| 191 Compliance | The risk officer was not assigned | X | X | |||||
| 192 Compliance | The internal auditor was not assigned | X | X | X | X | X | X | X |
| 193 Compliance | Board director shortage | X | X | X | X | X | ||
| 194 Compliance | Board directors not approved by regulators | X | X | X | X | X | ||
| 195 Compliance | Senior management not approved by regulators (if applicable) | X | X | X | X | X | ||
| 196 Compliance | Unresolved/unassessed conflict of interests | X | X | X | X | X | X | X |
| 197 Change risk | Implementation of the new distribution channels without POG approval | X | X | X | X | X | X | X |
| 198 Change risk | Implementing new requirements to customers without POG approval | X | X | X | X | X | X | |
| 199 Change risk | Implementing new product/service or their changes without POG approval | X | X | X | X | X | X | |
| 200 Change risk | Implementing new/variation of tariffs before prior customer approval | X | X | X | X | |||
| 201 Change risk | Implementing new/variation of tariffs without POG approval | X | X | X | X | |||
| 202 Change risk | Elimination of the product/services before prior customer’s approval | X | X | X | X | X | ||
| 203 Change risk | Elimination of the product/services without POG approval | X | X | X | X | X | ||
| 204 Change risk | Country/audience change without POG approval | X | X | X | X | X | X | |
| 205 Change risk | Country/audience elimination before prior customer’s notification | X | X | X | X | X | X | |
| 206 Change risk | No execution of the regulatory changes in the requested time period | X | X | X | X | X | X | |
| 207 Reputational risk | Poor customer support service | X | X | |||||
| 208 Reputational risk | Lack of secure e/m banking platform | X | X | X | X | X | ||
| 209 Reputational risk | Fraud and corruption related to the financial institution | X | X | X | X | X | ||
| 210 Reputational risk | Unreasonable account block or product unavailability | X | X | X | X | |||
| 211 Reputational risk | Unclear/incorrect information to the customers (tariffs, extracts) | X | X | X | ||||
| 212 Reputational risk | Hosting country reputation | |||||||
| 213 Reputational risk | Negative review on social media | X | X | |||||
| 214 Reputational risk | Unreasonably long customer onboard | X | X | X | X | X | X | |
| 215 Reputational risk | Unreasonably long customer request processing | X | X | X | X | X | ||
| 216 Reputational risk | Low shareholders trust | X | ||||||
| 217 Reputational risk | Product functioning errors | X | X | X | X | X |
Source: generated by the authors.
Table A2.
The list of vulnerabilities.
| Vulnerability | Governance Risks | Operational Risks | Human Resources Risks | Financial Risks | ICT Risks | Capital Adequacy Risks | Financial Crime Risks |
|---|---|---|---|---|---|---|---|
| Absence of clear and comprehensive governance policy | X | ||||||
| Lack of information exchange between departments | X | X | X | ||||
| Lack of strategy plan or its actualization | X | ||||||
| Lack of record keeping of the board decision | X | ||||||
| Lack of board decision notification to the staff | X | X | |||||
| Lack/improper policies/procedures describing internal processes | X | X | X | X | X | X | X |
| Lack of the procedure/policies/reports approval procedure by the board | X | ||||||
| Lack of financial reporting | X | X | X | X | X | ||
| Lack of job descriptions | X | X | X | X | X | ||
| Absence of the critical skills management procedure | X | X | X | ||||
| Critical skills shortage | X | X | X | X | |||
| Lack of/insufficient staff training | X | X | X | X | |||
| Lack of the product oversign and governance/change control | X | X | |||||
| Failure to adhere to the company’s policies or procedures | X | X | X | X | X | X | X |
| Failure to enforce policies | X | X | X | X | X | X | X |
| Failure to stack to the distributors/out-source company approval procedure | X | X | |||||
| Lack of an exit strategy for co-operation with distributors/out-source companies | X | X | |||||
| Failure to protect prices with the distributor/out-source company | X | X | X | ||||
| Failure of distributor/out-source company/supplier to supply service | X | X | X | X | |||
| Lack of a business continuity plan or its insufficiency | X | X | X | X | X | ||
| Failure to diversify | X | X | X | X | X | X | X |
| Unsupervised work by suppliers or cleaning staff | X | X | |||||
| Lack of security awareness | X | X | X | ||||
| Poorly documented software | X | X | |||||
| Lack of monitoring mechanisms | X | X | X | X | X | X | |
| Inadequate or careless use of physical access control to buildings, rooms, and offices | X | X | |||||
| Lack of physical protection for the building, doors, and windows | X | ||||||
| Location in an area susceptible to flood and fire | X | X | |||||
| Unprotected storage | X | X | X | X | |||
| Insufficient maintenance/faulty installation of storage media | X | ||||||
| Lack of periodic equipment replacement schemes | X | ||||||
| Susceptibility to humidity, dust, and soiling | X | X | |||||
| Susceptibility to temperature variations | X | X | |||||
| Susceptibility to voltage variations | X | ||||||
| Unprotected communication lines | X | ||||||
| Poor joint cabling | X | ||||||
| Lack of identification and authentication mechanisms | X | X | X | ||||
| Unprotected sensitive traffic | X | X | X | X | X | ||
| Inadequate network management | X | ||||||
| Lack of care at disposal | X | X | |||||
| Complicated user interface | X | X | |||||
| Lack of audit trail | X | X | X | X | X | ||
| No or insufficient product/software/process testing | X | X | X | X | |||
| Poor password management | X | ||||||
| Unclear or incomplete specification for developers | X | X | X | X | X | ||
| Uncontrolled downloading and using software | X | X | |||||
| Well-known gap in the software/process still in covering | X | X | X | X | X | ||
| Wrong allocation of access rights | X | X | X | X | |||
| Insufficient or irregular water supply | X | X | |||||
| Inappropriate CDD/EDD procedure | X | X | |||||
| Inappropriate cash management | X | X | X | X | X | ||
| Failure to identify risk-related events | X | X | X | X | X | X | X |
| Failure to identify beneficiary/customer | X | X | X | ||||
| Failure to report to supervising organizations | X | X | X | X | X | X | X |
| Failure to respond/communicate with the regulators | X | X | X | X | X | X | X |
| Lack of incident-reporting mechanism | X | X | X | X | X | X | X |
| Lack of staff stress relief possibilities and trainings | X | ||||||
| Bad ergonomics of the work place | |||||||
| Bad or absent noise control | |||||||
| Poor housekeeping | X | ||||||
| Missing or insufficient lighting | |||||||
| Missing or expired or not verified extinguishers/fire-extinguishing mechanisms | X | ||||||
| Correspondent bank stability risk | X | X | X | ||||
| Failure to define product prices in accordance with the market | X | ||||||
| Failure to manage assets volatility risk | X | ||||||
| Lack of liquidity | X | X | X | ||||
| Staff fraud | X | X | |||||
| Staff mistakes | X | X | X | X | |||
| Incorrect accounting/business model application | X | X | X | ||||
| Internal processes incompliant with current legal norms and regulations | X | X | X | X | X | X | X |
| Lack of or improper customer funds segregation/capital rate calculation mechanism | X | X | |||||
| Failure of the management to review and evaluate capital adequacy/customer funds segregation assessments and strategies | X | X | X | X | |||
| Failure to define and control segregated funds access from the side of the correspondent bank | X | X | X | X | |||
| Poorly described and managed suppliers’ invoices payments procedure | X | X | X | ||||
| Lack of or improper overdraft management procedure | X | X | X | ||||
| Lack of or improper company liabilities management procedure | X | X | X | ||||
| Lack of or improper data privacy procedure | X | X | X | X | X | ||
| Lack of a data protection officer or role | X | X | X | X | X | X |
Source: generated by the authors.
Table A3.
The list of threats impacts per respondent.
| Governance Risks | Operational Risks | Human Resources Risks | Financial Risks | ICT Risks | Capital Adequacy Risks | Financial Crime Risks | Governance Risks | Operational Risks | Human Resources Risks | Financial Risks | ICT Risks | Capital Adequacy Risks | Financial Crime Risks | Governance Risks | Operational Risks | Human Resources Risks | Financial Risks | ICT Risks | Capital Adequacy Risks | Financial Crime Risks | Governance Risks | Operational Risks | Human Resources Risks | Financial Risks | ICT Risks | Capital Adequacy Risks | Financial Crime Risks | Governance Risks | Operational Risks | Human Resources Risks | Financial Risks | ICT Risks | Capital Adequacy Risks | Financial Crime Risks | |
|---|---|---|---|---|---|---|---|---|---|---|---|---|---|---|---|---|---|---|---|---|---|---|---|---|---|---|---|---|---|---|---|---|---|---|---|
| Respondent 1 | Respondent 2 | Respondent 3 | Respondent 4 | Respondent 5 | |||||||||||||||||||||||||||||||
| 1 | 0 | 0 | 0 | 3 | 4 | 0 | 0 | 0 | 0 | 0 | 2 | 3 | 0 | 0 | 0 | 0 | 0 | 2 | 2 | 0 | 0 | 0 | 0 | 0 | 2 | 2 | 0 | 0 | 0 | 0 | 0 | 3 | 4 | 0 | 0 |
| 2 | 0 | 0 | 0 | 3 | 4 | 0 | 0 | 0 | 0 | 0 | 2 | 3 | 0 | 0 | 0 | 0 | 0 | 2 | 2 | 0 | 0 | 0 | 0 | 0 | 2 | 2 | 0 | 0 | 0 | 0 | 0 | 3 | 4 | 0 | 0 |
| 3 | 0 | 0 | 0 | 4 | 4 | 0 | 0 | 0 | 0 | 0 | 4 | 4 | 0 | 0 | 0 | 0 | 0 | 4 | 4 | 0 | 0 | 0 | 0 | 0 | 2 | 2 | 0 | 0 | 0 | 0 | 0 | 4 | 4 | 0 | 0 |
| 4 | 0 | 0 | 0 | 4 | 4 | 0 | 0 | 0 | 0 | 0 | 4 | 4 | 0 | 0 | 0 | 0 | 0 | 2 | 2 | 0 | 0 | 0 | 0 | 0 | 3 | 3 | 0 | 0 | 0 | 0 | 0 | 4 | 4 | 0 | 0 |
| 5 | 0 | 0 | 0 | 3 | 4 | 0 | 0 | 0 | 0 | 0 | 3 | 4 | 0 | 0 | 0 | 0 | 0 | 3 | 2 | 0 | 0 | 0 | 0 | 0 | 3 | 3 | 0 | 0 | 0 | 0 | 0 | 3 | 4 | 0 | 0 |
| 6 | 0 | 0 | 0 | 2 | 4 | 0 | 0 | 0 | 0 | 0 | 2 | 4 | 0 | 0 | 0 | 0 | 0 | 2 | 3 | 0 | 0 | 0 | 0 | 0 | 2 | 3 | 0 | 0 | 0 | 0 | 0 | 2 | 4 | 0 | 0 |
| 7 | 0 | 0 | 0 | 4 | 3 | 0 | 0 | 0 | 0 | 0 | 4 | 3 | 0 | 0 | 0 | 0 | 0 | 4 | 3 | 0 | 0 | 0 | 0 | 0 | 2 | 2 | 0 | 0 | 0 | 0 | 0 | 4 | 3 | 0 | 0 |
| 8 | 0 | 0 | 0 | 5 | 5 | 0 | 0 | 0 | 0 | 0 | 5 | 5 | 0 | 0 | 0 | 0 | 0 | 5 | 5 | 0 | 0 | 0 | 0 | 0 | 5 | 5 | 0 | 0 | 0 | 0 | 0 | 5 | 5 | 0 | 0 |
| 9 | 0 | 0 | 0 | 3 | 3 | 0 | 0 | 0 | 0 | 0 | 3 | 3 | 0 | 0 | 0 | 0 | 0 | 3 | 3 | 0 | 0 | 0 | 0 | 0 | 2 | 2 | 0 | 0 | 0 | 0 | 0 | 3 | 3 | 0 | 0 |
| 10 | 0 | 0 | 0 | 2 | 0 | 0 | 0 | 0 | 0 | 0 | 2 | 0 | 0 | 0 | 0 | 0 | 0 | 2 | 0 | 0 | 0 | 0 | 0 | 0 | 2 | 0 | 0 | 0 | 0 | 0 | 0 | 2 | 0 | 0 | 0 |
| 11 | 0 | 0 | 0 | 3 | 0 | 0 | 0 | 0 | 0 | 0 | 3 | 0 | 0 | 0 | 0 | 0 | 0 | 3 | 0 | 0 | 0 | 0 | 0 | 0 | 3 | 0 | 0 | 0 | 0 | 0 | 0 | 3 | 0 | 0 | 0 |
| 12 | 4 | 3 | 4 | 3 | 4 | 0 | 0 | 5 | 4 | 4 | 3 | 4 | 0 | 0 | 4 | 4 | 4 | 3 | 4 | 0 | 0 | 4 | 4 | 4 | 3 | 4 | 0 | 0 | 4 | 3 | 4 | 3 | 4 | 0 | 0 |
| 13 | 0 | 0 | 5 | 0 | 0 | 0 | 0 | 0 | 0 | 4 | 0 | 0 | 0 | 0 | 0 | 0 | 4 | 0 | 0 | 0 | 0 | 0 | 0 | 3 | 0 | 0 | 0 | 0 | 0 | 0 | 5 | 0 | 0 | 0 | 0 |
| 14 | 0 | 0 | 5 | 0 | 0 | 0 | 0 | 0 | 0 | 4 | 0 | 0 | 0 | 0 | 0 | 0 | 4 | 0 | 0 | 0 | 0 | 0 | 0 | 4 | 0 | 0 | 0 | 0 | 0 | 0 | 5 | 0 | 0 | 0 | 0 |
| 15 | 0 | 0 | 3 | 0 | 4 | 0 | 0 | 0 | 0 | 2 | 0 | 3 | 0 | 0 | 0 | 0 | 2 | 0 | 2 | 0 | 0 | 0 | 0 | 3 | 0 | 2 | 0 | 0 | 0 | 0 | 3 | 0 | 4 | 0 | 0 |
| 16 | 0 | 0 | 1 | 3 | 4 | 0 | 0 | 0 | 0 | 1 | 3 | 4 | 0 | 0 | 0 | 0 | 1 | 2 | 4 | 0 | 0 | 0 | 0 | 2 | 2 | 4 | 0 | 0 | 0 | 0 | 1 | 3 | 4 | 0 | 0 |
| 17 | 0 | 0 | 4 | 3 | 4 | 0 | 0 | 0 | 0 | 4 | 3 | 4 | 0 | 0 | 0 | 0 | 4 | 3 | 4 | 0 | 0 | 0 | 0 | 3 | 3 | 4 | 0 | 0 | 0 | 0 | 4 | 3 | 4 | 0 | 0 |
| 18 | 0 | 4 | 1 | 0 | 4 | 0 | 0 | 0 | 4 | 1 | 0 | 4 | 0 | 0 | 0 | 3 | 1 | 0 | 4 | 0 | 0 | 0 | 4 | 2 | 0 | 4 | 0 | 0 | 0 | 4 | 1 | 0 | 4 | 0 | 0 |
| 19 | 0 | 3 | 1 | 0 | 5 | 0 | 0 | 0 | 2 | 1 | 0 | 3 | 0 | 0 | 0 | 2 | 1 | 0 | 3 | 0 | 0 | 0 | 3 | 3 | 0 | 3 | 0 | 0 | 0 | 3 | 1 | 0 | 5 | 0 | 0 |
| 20 | 0 | 5 | 2 | 5 | 4 | 0 | 0 | 0 | 5 | 2 | 5 | 4 | 0 | 0 | 0 | 4 | 2 | 4 | 4 | 0 | 0 | 0 | 4 | 3 | 4 | 4 | 0 | 0 | 0 | 5 | 2 | 5 | 4 | 0 | 0 |
| 21 | 0 | 4 | 4 | 3 | 4 | 0 | 0 | 0 | 3 | 4 | 3 | 4 | 0 | 0 | 0 | 3 | 3 | 3 | 3 | 0 | 0 | 0 | 4 | 3 | 4 | 3 | 0 | 0 | 0 | 4 | 4 | 3 | 4 | 0 | 0 |
| 22 | 0 | 5 | 4 | 5 | 3 | 5 | 4 | 0 | 5 | 4 | 5 | 3 | 5 | 4 | 0 | 4 | 3 | 4 | 3 | 4 | 3 | 0 | 4 | 3 | 4 | 3 | 4 | 3 | 0 | 5 | 4 | 5 | 3 | 5 | 4 |
| 23 | 0 | 3 | 0 | 3 | 4 | 0 | 0 | 0 | 3 | 0 | 3 | 4 | 0 | 0 | 0 | 3 | 0 | 3 | 4 | 0 | 0 | 0 | 4 | 0 | 4 | 4 | 0 | 0 | 0 | 3 | 0 | 3 | 4 | 0 | 0 |
| 24 | 0 | 0 | 0 | 0 | 4 | 0 | 0 | 0 | 0 | 0 | 0 | 4 | 0 | 0 | 0 | 0 | 0 | 0 | 3 | 0 | 0 | 0 | 0 | 0 | 0 | 4 | 0 | 0 | 0 | 0 | 0 | 0 | 4 | 0 | 0 |
| 25 | 0 | 0 | 0 | 0 | 5 | 0 | 0 | 0 | 0 | 0 | 0 | 4 | 0 | 0 | 0 | 0 | 0 | 0 | 4 | 0 | 0 | 0 | 0 | 0 | 0 | 4 | 0 | 0 | 0 | 0 | 0 | 0 | 5 | 0 | 0 |
| 26 | 0 | 3 | 0 | 0 | 4 | 0 | 4 | 0 | 2 | 0 | 0 | 3 | 0 | 3 | 0 | 2 | 0 | 0 | 3 | 0 | 3 | 0 | 3 | 0 | 0 | 3 | 0 | 3 | 0 | 3 | 0 | 0 | 4 | 0 | 4 |
| 27 | 0 | 0 | 0 | 0 | 4 | 0 | 0 | 0 | 0 | 0 | 0 | 4 | 0 | 0 | 0 | 0 | 0 | 0 | 4 | 0 | 0 | 0 | 0 | 0 | 0 | 4 | 0 | 0 | 0 | 0 | 0 | 0 | 4 | 0 | 0 |
| 28 | 0 | 0 | 0 | 0 | 3 | 0 | 0 | 0 | 0 | 0 | 0 | 3 | 0 | 0 | 0 | 0 | 0 | 0 | 3 | 0 | 0 | 0 | 0 | 0 | 0 | 3 | 0 | 0 | 0 | 0 | 0 | 0 | 3 | 0 | 0 |
| 29 | 0 | 5 | 0 | 4 | 4 | 4 | 4 | 0 | 4 | 0 | 4 | 4 | 4 | 4 | 0 | 4 | 0 | 4 | 4 | 4 | 4 | 0 | 4 | 0 | 4 | 4 | 4 | 4 | 0 | 5 | 0 | 4 | 4 | 4 | 4 |
| 30 | 0 | 1 | 0 | 0 | 4 | 0 | 0 | 0 | 1 | 0 | 0 | 4 | 0 | 0 | 0 | 1 | 0 | 0 | 3 | 0 | 0 | 0 | 2 | 0 | 0 | 3 | 0 | 0 | 0 | 1 | 0 | 0 | 4 | 0 | 0 |
| 31 | 0 | 5 | 0 | 0 | 5 | 0 | 0 | 0 | 4 | 0 | 0 | 4 | 0 | 0 | 0 | 4 | 0 | 0 | 4 | 0 | 0 | 0 | 4 | 0 | 0 | 4 | 0 | 0 | 0 | 5 | 0 | 0 | 5 | 0 | 0 |
| 32 | 0 | 4 | 0 | 0 | 4 | 0 | 0 | 0 | 4 | 0 | 0 | 4 | 0 | 0 | 0 | 4 | 0 | 0 | 4 | 0 | 0 | 0 | 4 | 0 | 0 | 4 | 0 | 0 | 0 | 4 | 0 | 0 | 4 | 0 | 0 |
| 33 | 0 | 0 | 0 | 0 | 4 | 0 | 0 | 0 | 0 | 0 | 0 | 4 | 0 | 0 | 0 | 0 | 0 | 0 | 4 | 0 | 0 | 0 | 0 | 0 | 0 | 4 | 0 | 0 | 0 | 0 | 0 | 0 | 4 | 0 | 0 |
| 34 | 0 | 3 | 0 | 3 | 4 | 0 | 0 | 0 | 3 | 0 | 3 | 4 | 0 | 0 | 0 | 3 | 0 | 3 | 4 | 0 | 0 | 0 | 3 | 0 | 3 | 4 | 0 | 0 | 0 | 3 | 0 | 3 | 4 | 0 | 0 |
| 35 | 0 | 4 | 0 | 0 | 4 | 0 | 0 | 0 | 5 | 0 | 0 | 4 | 0 | 0 | 0 | 5 | 0 | 0 | 4 | 0 | 0 | 0 | 5 | 0 | 0 | 4 | 0 | 0 | 0 | 4 | 0 | 0 | 4 | 0 | 0 |
| 36 | 0 | 0 | 0 | 0 | 4 | 0 | 0 | 0 | 0 | 0 | 0 | 4 | 0 | 0 | 0 | 0 | 0 | 0 | 4 | 0 | 0 | 0 | 0 | 0 | 0 | 4 | 0 | 0 | 0 | 0 | 0 | 0 | 4 | 0 | 0 |
| 37 | 0 | 0 | 0 | 0 | 4 | 0 | 0 | 0 | 0 | 0 | 0 | 4 | 0 | 0 | 0 | 0 | 0 | 0 | 4 | 0 | 0 | 0 | 0 | 0 | 0 | 4 | 0 | 0 | 0 | 0 | 0 | 0 | 4 | 0 | 0 |
| 38 | 0 | 0 | 0 | 0 | 3 | 0 | 0 | 0 | 0 | 0 | 0 | 3 | 0 | 0 | 0 | 0 | 0 | 0 | 4 | 0 | 0 | 0 | 0 | 0 | 0 | 4 | 0 | 0 | 0 | 0 | 0 | 0 | 3 | 0 | 0 |
| 39 | 0 | 0 | 0 | 0 | 4 | 0 | 0 | 0 | 0 | 0 | 0 | 4 | 0 | 0 | 0 | 0 | 0 | 0 | 3 | 0 | 0 | 0 | 0 | 0 | 0 | 3 | 0 | 0 | 0 | 0 | 0 | 0 | 4 | 0 | 0 |
| 40 | 0 | 3 | 0 | 4 | 5 | 3 | 0 | 0 | 3 | 0 | 4 | 4 | 3 | 0 | 0 | 3 | 0 | 2 | 4 | 2 | 0 | 0 | 2 | 0 | 2 | 3 | 2 | 0 | 0 | 3 | 0 | 4 | 5 | 3 | 0 |
| 41 | 0 | 0 | 0 | 5 | 5 | 5 | 0 | 0 | 0 | 0 | 5 | 5 | 5 | 0 | 0 | 0 | 0 | 5 | 5 | 5 | 0 | 0 | 0 | 0 | 5 | 5 | 5 | 0 | 0 | 0 | 0 | 5 | 5 | 5 | 0 |
| 42 | 0 | 0 | 0 | 5 | 5 | 5 | 0 | 0 | 0 | 0 | 5 | 5 | 5 | 0 | 0 | 0 | 0 | 4 | 4 | 4 | 0 | 0 | 0 | 0 | 4 | 4 | 4 | 0 | 0 | 0 | 0 | 5 | 5 | 5 | 0 |
| 43 | 0 | 0 | 0 | 0 | 4 | 0 | 0 | 0 | 0 | 0 | 0 | 4 | 0 | 0 | 0 | 0 | 0 | 0 | 4 | 0 | 0 | 0 | 0 | 0 | 0 | 4 | 0 | 0 | 0 | 0 | 0 | 0 | 4 | 0 | 0 |
| 44 | 0 | 0 | 0 | 0 | 4 | 0 | 0 | 0 | 0 | 0 | 0 | 4 | 0 | 0 | 0 | 0 | 0 | 0 | 4 | 0 | 0 | 0 | 0 | 0 | 0 | 4 | 0 | 0 | 0 | 0 | 0 | 0 | 4 | 0 | 0 |
| 45 | 2 | 4 | 1 | 4 | 4 | 4 | 0 | 3 | 3 | 1 | 4 | 4 | 4 | 0 | 2 | 3 | 1 | 3 | 4 | 3 | 0 | 2 | 3 | 1 | 3 | 4 | 3 | 0 | 2 | 4 | 1 | 4 | 4 | 4 | 0 |
| 46 | 0 | 0 | 0 | 0 | 4 | 0 | 0 | 0 | 0 | 0 | 0 | 4 | 0 | 0 | 0 | 0 | 0 | 0 | 3 | 0 | 0 | 0 | 0 | 0 | 0 | 3 | 0 | 0 | 0 | 0 | 0 | 0 | 4 | 0 | 0 |
| 47 | 0 | 0 | 0 | 0 | 4 | 0 | 0 | 0 | 0 | 0 | 0 | 4 | 0 | 0 | 0 | 0 | 0 | 0 | 3 | 0 | 0 | 0 | 0 | 0 | 0 | 3 | 0 | 0 | 0 | 0 | 0 | 0 | 4 | 0 | 0 |
| 48 | 2 | 5 | 1 | 5 | 5 | 5 | 5 | 2 | 5 | 1 | 5 | 5 | 5 | 5 | 2 | 5 | 1 | 3 | 5 | 3 | 5 | 2 | 5 | 1 | 3 | 5 | 3 | 5 | 2 | 5 | 1 | 5 | 5 | 5 | 5 |
| 49 | 0 | 0 | 0 | 0 | 0 | 0 | 2 | 0 | 0 | 0 | 0 | 0 | 0 | 3 | 0 | 0 | 0 | 0 | 0 | 0 | 3 | 0 | 0 | 0 | 0 | 0 | 0 | 3 | 0 | 0 | 0 | 0 | 0 | 0 | 2 |
| 50 | 0 | 0 | 0 | 0 | 0 | 0 | 2 | 0 | 0 | 0 | 0 | 0 | 0 | 3 | 0 | 0 | 0 | 0 | 0 | 0 | 3 | 0 | 0 | 0 | 0 | 0 | 0 | 3 | 0 | 0 | 0 | 0 | 0 | 0 | 2 |
| 51 | 0 | 0 | 0 | 0 | 0 | 0 | 2 | 0 | 0 | 0 | 0 | 0 | 0 | 2 | 0 | 0 | 0 | 0 | 0 | 0 | 2 | 0 | 0 | 0 | 0 | 0 | 0 | 2 | 0 | 0 | 0 | 0 | 0 | 0 | 2 |
| 52 | 0 | 0 | 0 | 0 | 0 | 0 | 2 | 0 | 0 | 0 | 0 | 0 | 0 | 4 | 0 | 0 | 0 | 0 | 0 | 0 | 4 | 0 | 0 | 0 | 0 | 0 | 0 | 4 | 0 | 0 | 0 | 0 | 0 | 0 | 2 |
| 53 | 0 | 0 | 0 | 0 | 0 | 0 | 4 | 0 | 0 | 0 | 0 | 0 | 0 | 4 | 0 | 0 | 0 | 0 | 0 | 0 | 4 | 0 | 0 | 0 | 0 | 0 | 0 | 4 | 0 | 0 | 0 | 0 | 0 | 0 | 4 |
| 54 | 0 | 0 | 0 | 0 | 0 | 0 | 4 | 0 | 0 | 0 | 0 | 0 | 0 | 4 | 0 | 0 | 0 | 0 | 0 | 0 | 4 | 0 | 0 | 0 | 0 | 0 | 0 | 4 | 0 | 0 | 0 | 0 | 0 | 0 | 4 |
| 55 | 0 | 0 | 0 | 0 | 0 | 0 | 4 | 0 | 0 | 0 | 0 | 0 | 0 | 4 | 0 | 0 | 0 | 0 | 0 | 0 | 4 | 0 | 0 | 0 | 0 | 0 | 0 | 4 | 0 | 0 | 0 | 0 | 0 | 0 | 4 |
| 56 | 0 | 0 | 0 | 0 | 0 | 0 | 4 | 0 | 0 | 0 | 0 | 0 | 0 | 4 | 0 | 0 | 0 | 0 | 0 | 0 | 4 | 0 | 0 | 0 | 0 | 0 | 0 | 4 | 0 | 0 | 0 | 0 | 0 | 0 | 4 |
| 57 | 0 | 0 | 0 | 0 | 0 | 0 | 4 | 0 | 0 | 0 | 0 | 0 | 0 | 4 | 0 | 0 | 0 | 0 | 0 | 0 | 4 | 0 | 0 | 0 | 0 | 0 | 0 | 4 | 0 | 0 | 0 | 0 | 0 | 0 | 4 |
| 58 | 0 | 0 | 0 | 0 | 0 | 0 | 4 | 0 | 0 | 0 | 0 | 0 | 0 | 4 | 0 | 0 | 0 | 0 | 0 | 0 | 4 | 0 | 0 | 0 | 0 | 0 | 0 | 4 | 0 | 0 | 0 | 0 | 0 | 0 | 4 |
| 59 | 0 | 0 | 0 | 0 | 0 | 0 | 4 | 0 | 0 | 0 | 0 | 0 | 0 | 4 | 0 | 0 | 0 | 0 | 0 | 0 | 4 | 0 | 0 | 0 | 0 | 0 | 0 | 4 | 0 | 0 | 0 | 0 | 0 | 0 | 4 |
| 60 | 0 | 0 | 0 | 0 | 0 | 0 | 4 | 0 | 0 | 0 | 0 | 0 | 0 | 4 | 0 | 0 | 0 | 0 | 0 | 0 | 4 | 0 | 0 | 0 | 0 | 0 | 0 | 4 | 0 | 0 | 0 | 0 | 0 | 0 | 4 |
| 61 | 0 | 0 | 0 | 0 | 0 | 0 | 4 | 0 | 0 | 0 | 0 | 0 | 0 | 4 | 0 | 0 | 0 | 0 | 0 | 0 | 4 | 0 | 0 | 0 | 0 | 0 | 0 | 4 | 0 | 0 | 0 | 0 | 0 | 0 | 4 |
| 62 | 0 | 0 | 0 | 0 | 0 | 0 | 4 | 0 | 0 | 0 | 0 | 0 | 0 | 4 | 0 | 0 | 0 | 0 | 0 | 0 | 4 | 0 | 0 | 0 | 0 | 0 | 0 | 4 | 0 | 0 | 0 | 0 | 0 | 0 | 4 |
| 63 | 0 | 0 | 0 | 0 | 0 | 0 | 4 | 0 | 0 | 0 | 0 | 0 | 0 | 4 | 0 | 0 | 0 | 0 | 0 | 0 | 4 | 0 | 0 | 0 | 0 | 0 | 0 | 4 | 0 | 0 | 0 | 0 | 0 | 0 | 4 |
| 64 | 0 | 0 | 0 | 0 | 0 | 0 | 3 | 0 | 0 | 0 | 0 | 0 | 0 | 3 | 0 | 0 | 0 | 0 | 0 | 0 | 3 | 0 | 0 | 0 | 0 | 0 | 0 | 3 | 0 | 0 | 0 | 0 | 0 | 0 | 3 |
| 65 | 0 | 0 | 0 | 0 | 0 | 0 | 4 | 0 | 0 | 0 | 0 | 0 | 0 | 4 | 0 | 0 | 0 | 0 | 0 | 0 | 4 | 0 | 0 | 0 | 0 | 0 | 0 | 4 | 0 | 0 | 0 | 0 | 0 | 0 | 4 |
| 66 | 0 | 0 | 0 | 0 | 0 | 0 | 1 | 0 | 0 | 0 | 0 | 0 | 0 | 1 | 0 | 0 | 0 | 0 | 0 | 0 | 1 | 0 | 0 | 0 | 0 | 0 | 0 | 1 | 0 | 0 | 0 | 0 | 0 | 0 | 1 |
| 67 | 0 | 0 | 0 | 0 | 0 | 0 | 4 | 0 | 0 | 0 | 0 | 0 | 0 | 4 | 0 | 0 | 0 | 0 | 0 | 0 | 4 | 0 | 0 | 0 | 0 | 0 | 0 | 4 | 0 | 0 | 0 | 0 | 0 | 0 | 4 |
| 68 | 0 | 0 | 0 | 0 | 0 | 0 | 4 | 0 | 0 | 0 | 0 | 0 | 0 | 4 | 0 | 0 | 0 | 0 | 0 | 0 | 4 | 0 | 0 | 0 | 0 | 0 | 0 | 4 | 0 | 0 | 0 | 0 | 0 | 0 | 4 |
| 69 | 0 | 0 | 0 | 0 | 0 | 0 | 3 | 0 | 0 | 0 | 0 | 0 | 0 | 3 | 0 | 0 | 0 | 0 | 0 | 0 | 3 | 0 | 0 | 0 | 0 | 0 | 0 | 3 | 0 | 0 | 0 | 0 | 0 | 0 | 3 |
| 70 | 0 | 0 | 0 | 0 | 0 | 0 | 2 | 0 | 0 | 0 | 0 | 0 | 0 | 3 | 0 | 0 | 0 | 0 | 0 | 0 | 3 | 0 | 0 | 0 | 0 | 0 | 0 | 3 | 0 | 0 | 0 | 0 | 0 | 0 | 2 |
| 71 | 2 | 0 | 0 | 3 | 0 | 3 | 5 | 3 | 0 | 0 | 4 | 0 | 4 | 5 | 3 | 0 | 0 | 3 | 0 | 3 | 5 | 3 | 0 | 0 | 3 | 0 | 3 | 5 | 2 | 0 | 0 | 3 | 0 | 3 | 5 |
| 72 | 2 | 0 | 0 | 3 | 0 | 3 | 5 | 3 | 0 | 0 | 4 | 0 | 4 | 5 | 3 | 0 | 0 | 3 | 0 | 3 | 5 | 3 | 0 | 0 | 3 | 0 | 3 | 5 | 2 | 0 | 0 | 3 | 0 | 3 | 5 |
| 73 | 2 | 0 | 0 | 3 | 0 | 3 | 4 | 3 | 0 | 0 | 4 | 0 | 4 | 4 | 3 | 0 | 0 | 3 | 0 | 3 | 4 | 3 | 0 | 0 | 3 | 0 | 3 | 4 | 2 | 0 | 0 | 3 | 0 | 3 | 4 |
| 74 | 2 | 0 | 0 | 0 | 0 | 0 | 4 | 2 | 0 | 0 | 0 | 0 | 0 | 4 | 2 | 0 | 0 | 0 | 0 | 0 | 4 | 2 | 0 | 0 | 0 | 0 | 0 | 4 | 2 | 0 | 0 | 0 | 0 | 0 | 4 |
| 75 | 2 | 0 | 0 | 0 | 0 | 0 | 5 | 3 | 0 | 0 | 0 | 0 | 0 | 5 | 3 | 0 | 0 | 0 | 0 | 0 | 5 | 3 | 0 | 0 | 0 | 0 | 0 | 5 | 2 | 0 | 0 | 0 | 0 | 0 | 5 |
| 76 | 2 | 0 | 0 | 0 | 0 | 0 | 5 | 3 | 0 | 0 | 0 | 0 | 0 | 5 | 3 | 0 | 0 | 0 | 0 | 0 | 5 | 3 | 0 | 0 | 0 | 0 | 0 | 5 | 2 | 0 | 0 | 0 | 0 | 0 | 5 |
| 77 | 2 | 0 | 0 | 3 | 0 | 3 | 5 | 4 | 0 | 0 | 3 | 0 | 3 | 5 | 2 | 0 | 0 | 3 | 0 | 3 | 5 | 2 | 0 | 0 | 3 | 0 | 3 | 5 | 2 | 0 | 0 | 3 | 0 | 3 | 5 |
| 78 | 2 | 0 | 0 | 3 | 0 | 3 | 5 | 4 | 0 | 0 | 3 | 0 | 3 | 5 | 2 | 0 | 0 | 3 | 0 | 3 | 5 | 2 | 0 | 0 | 3 | 0 | 3 | 5 | 2 | 0 | 0 | 3 | 0 | 3 | 5 |
| 79 | 2 | 0 | 0 | 3 | 0 | 3 | 5 | 4 | 0 | 0 | 3 | 0 | 3 | 5 | 2 | 0 | 0 | 3 | 0 | 3 | 5 | 2 | 0 | 0 | 3 | 0 | 3 | 5 | 2 | 0 | 0 | 3 | 0 | 3 | 5 |
| 80 | 0 | 0 | 0 | 3 | 0 | 3 | 5 | 0 | 0 | 0 | 3 | 0 | 3 | 5 | 0 | 0 | 0 | 2 | 0 | 2 | 5 | 0 | 0 | 0 | 2 | 0 | 2 | 5 | 0 | 0 | 0 | 3 | 0 | 3 | 5 |
| 81 | 0 | 0 | 0 | 3 | 0 | 3 | 5 | 0 | 0 | 0 | 3 | 0 | 3 | 5 | 0 | 0 | 0 | 3 | 0 | 3 | 5 | 0 | 0 | 0 | 3 | 0 | 3 | 5 | 0 | 0 | 0 | 3 | 0 | 3 | 5 |
| 82 | 0 | 0 | 0 | 3 | 0 | 3 | 5 | 0 | 0 | 0 | 3 | 0 | 3 | 5 | 0 | 0 | 0 | 3 | 0 | 3 | 5 | 0 | 0 | 0 | 3 | 0 | 3 | 5 | 0 | 0 | 0 | 3 | 0 | 3 | 5 |
| 83 | 0 | 0 | 0 | 2 | 0 | 2 | 3 | 0 | 0 | 0 | 2 | 0 | 2 | 4 | 0 | 0 | 0 | 2 | 0 | 2 | 4 | 0 | 0 | 0 | 2 | 0 | 2 | 4 | 0 | 0 | 0 | 2 | 0 | 2 | 3 |
| 84 | 0 | 0 | 0 | 0 | 0 | 0 | 3 | 0 | 0 | 0 | 0 | 0 | 0 | 2 | 0 | 0 | 0 | 0 | 0 | 0 | 2 | 0 | 0 | 0 | 0 | 0 | 0 | 2 | 0 | 0 | 0 | 0 | 0 | 0 | 3 |
| 85 | 0 | 0 | 0 | 0 | 0 | 0 | 3 | 0 | 0 | 0 | 0 | 0 | 0 | 3 | 0 | 0 | 0 | 0 | 0 | 0 | 3 | 0 | 0 | 0 | 0 | 0 | 0 | 3 | 0 | 0 | 0 | 0 | 0 | 0 | 3 |
| 86 | 0 | 0 | 0 | 0 | 0 | 0 | 3 | 0 | 0 | 0 | 0 | 0 | 0 | 3 | 0 | 0 | 0 | 0 | 0 | 0 | 3 | 0 | 0 | 0 | 0 | 0 | 0 | 3 | 0 | 0 | 0 | 0 | 0 | 0 | 3 |
| 87 | 0 | 0 | 0 | 0 | 0 | 0 | 3 | 0 | 0 | 0 | 0 | 0 | 0 | 3 | 0 | 0 | 0 | 0 | 0 | 0 | 3 | 0 | 0 | 0 | 0 | 0 | 0 | 3 | 0 | 0 | 0 | 0 | 0 | 0 | 3 |
| 88 | 0 | 0 | 0 | 0 | 0 | 0 | 4 | 0 | 0 | 0 | 0 | 0 | 0 | 4 | 0 | 0 | 0 | 0 | 0 | 0 | 4 | 0 | 0 | 0 | 0 | 0 | 0 | 4 | 0 | 0 | 0 | 0 | 0 | 0 | 4 |
| 89 | 0 | 0 | 0 | 0 | 0 | 0 | 3 | 0 | 0 | 0 | 0 | 0 | 0 | 3 | 0 | 0 | 0 | 0 | 0 | 0 | 3 | 0 | 0 | 0 | 0 | 0 | 0 | 3 | 0 | 0 | 0 | 0 | 0 | 0 | 3 |
| 90 | 0 | 0 | 0 | 0 | 0 | 0 | 5 | 0 | 0 | 0 | 0 | 0 | 0 | 5 | 0 | 0 | 0 | 0 | 0 | 0 | 5 | 0 | 0 | 0 | 0 | 0 | 0 | 5 | 0 | 0 | 0 | 0 | 0 | 0 | 5 |
| 91 | 0 | 0 | 0 | 0 | 0 | 0 | 5 | 0 | 0 | 0 | 0 | 0 | 0 | 5 | 0 | 0 | 0 | 0 | 0 | 0 | 5 | 0 | 0 | 0 | 0 | 0 | 0 | 5 | 0 | 0 | 0 | 0 | 0 | 0 | 5 |
| 92 | 0 | 0 | 0 | 0 | 0 | 0 | 4 | 0 | 0 | 0 | 0 | 0 | 0 | 4 | 0 | 0 | 0 | 0 | 0 | 0 | 4 | 0 | 0 | 0 | 0 | 0 | 0 | 4 | 0 | 0 | 0 | 0 | 0 | 0 | 4 |
| 93 | 0 | 0 | 0 | 0 | 0 | 0 | 4 | 0 | 0 | 0 | 0 | 0 | 0 | 4 | 0 | 0 | 0 | 0 | 0 | 0 | 4 | 0 | 0 | 0 | 0 | 0 | 0 | 4 | 0 | 0 | 0 | 0 | 0 | 0 | 4 |
| 94 | 0 | 0 | 0 | 0 | 0 | 0 | 4 | 0 | 0 | 0 | 0 | 0 | 0 | 4 | 0 | 0 | 0 | 0 | 0 | 0 | 4 | 0 | 0 | 0 | 0 | 0 | 0 | 4 | 0 | 0 | 0 | 0 | 0 | 0 | 4 |
| 95 | 0 | 0 | 0 | 0 | 0 | 0 | 4 | 0 | 0 | 0 | 0 | 0 | 0 | 4 | 0 | 0 | 0 | 0 | 0 | 0 | 4 | 0 | 0 | 0 | 0 | 0 | 0 | 4 | 0 | 0 | 0 | 0 | 0 | 0 | 4 |
| 96 | 0 | 0 | 0 | 0 | 0 | 0 | 4 | 0 | 0 | 0 | 0 | 0 | 0 | 4 | 0 | 0 | 0 | 0 | 0 | 0 | 4 | 0 | 0 | 0 | 0 | 0 | 0 | 4 | 0 | 0 | 0 | 0 | 0 | 0 | 4 |
| 97 | 0 | 0 | 0 | 0 | 0 | 0 | 4 | 0 | 0 | 0 | 0 | 0 | 0 | 4 | 0 | 0 | 0 | 0 | 0 | 0 | 4 | 0 | 0 | 0 | 0 | 0 | 0 | 4 | 0 | 0 | 0 | 0 | 0 | 0 | 4 |
| 98 | 0 | 0 | 0 | 0 | 0 | 0 | 4 | 0 | 0 | 0 | 0 | 0 | 0 | 4 | 0 | 0 | 0 | 0 | 0 | 0 | 4 | 0 | 0 | 0 | 0 | 0 | 0 | 4 | 0 | 0 | 0 | 0 | 0 | 0 | 4 |
| 99 | 0 | 0 | 0 | 0 | 0 | 0 | 4 | 0 | 0 | 0 | 0 | 0 | 0 | 4 | 0 | 0 | 0 | 0 | 0 | 0 | 4 | 0 | 0 | 0 | 0 | 0 | 0 | 4 | 0 | 0 | 0 | 0 | 0 | 0 | 4 |
| 100 | 0 | 0 | 0 | 0 | 0 | 0 | 4 | 0 | 0 | 0 | 0 | 0 | 0 | 4 | 0 | 0 | 0 | 0 | 0 | 0 | 4 | 0 | 0 | 0 | 0 | 0 | 0 | 4 | 0 | 0 | 0 | 0 | 0 | 0 | 4 |
| 101 | 0 | 0 | 0 | 0 | 0 | 0 | 4 | 0 | 0 | 0 | 0 | 0 | 0 | 4 | 0 | 0 | 0 | 0 | 0 | 0 | 4 | 0 | 0 | 0 | 0 | 0 | 0 | 4 | 0 | 0 | 0 | 0 | 0 | 0 | 4 |
| 102 | 0 | 0 | 0 | 0 | 0 | 0 | 4 | 0 | 0 | 0 | 0 | 0 | 0 | 4 | 0 | 0 | 0 | 0 | 0 | 0 | 4 | 0 | 0 | 0 | 0 | 0 | 0 | 4 | 0 | 0 | 0 | 0 | 0 | 0 | 4 |
| 103 | 0 | 0 | 0 | 0 | 0 | 0 | 4 | 0 | 0 | 0 | 0 | 0 | 0 | 4 | 0 | 0 | 0 | 0 | 0 | 0 | 4 | 0 | 0 | 0 | 0 | 0 | 0 | 4 | 0 | 0 | 0 | 0 | 0 | 0 | 4 |
| 104 | 0 | 0 | 0 | 0 | 0 | 0 | 3 | 0 | 0 | 0 | 0 | 0 | 0 | 3 | 0 | 0 | 0 | 0 | 0 | 0 | 3 | 0 | 0 | 0 | 0 | 0 | 0 | 3 | 0 | 0 | 0 | 0 | 0 | 0 | 3 |
| 105 | 0 | 0 | 0 | 0 | 0 | 0 | 5 | 0 | 0 | 0 | 0 | 0 | 0 | 5 | 0 | 0 | 0 | 0 | 0 | 0 | 5 | 0 | 0 | 0 | 0 | 0 | 0 | 5 | 0 | 0 | 0 | 0 | 0 | 0 | 5 |
| 106 | 0 | 0 | 0 | 0 | 0 | 0 | 5 | 0 | 0 | 0 | 0 | 0 | 0 | 5 | 0 | 0 | 0 | 0 | 0 | 0 | 5 | 0 | 0 | 0 | 0 | 0 | 0 | 5 | 0 | 0 | 0 | 0 | 0 | 0 | 5 |
| 107 | 0 | 0 | 0 | 0 | 0 | 0 | 3 | 0 | 0 | 0 | 0 | 0 | 0 | 3 | 0 | 0 | 0 | 0 | 0 | 0 | 3 | 0 | 0 | 0 | 0 | 0 | 0 | 3 | 0 | 0 | 0 | 0 | 0 | 0 | 3 |
| 108 | 0 | 0 | 0 | 0 | 0 | 0 | 3 | 0 | 0 | 0 | 0 | 0 | 0 | 3 | 0 | 0 | 0 | 0 | 0 | 0 | 3 | 0 | 0 | 0 | 0 | 0 | 0 | 3 | 0 | 0 | 0 | 0 | 0 | 0 | 3 |
| 109 | 0 | 0 | 0 | 0 | 0 | 0 | 2 | 0 | 0 | 0 | 0 | 0 | 0 | 2 | 0 | 0 | 0 | 0 | 0 | 0 | 2 | 0 | 0 | 0 | 0 | 0 | 0 | 2 | 0 | 0 | 0 | 0 | 0 | 0 | 2 |
| 110 | 0 | 0 | 0 | 0 | 0 | 0 | 2 | 0 | 0 | 0 | 0 | 0 | 0 | 2 | 0 | 0 | 0 | 0 | 0 | 0 | 2 | 0 | 0 | 0 | 0 | 0 | 0 | 2 | 0 | 0 | 0 | 0 | 0 | 0 | 2 |
| 111 | 0 | 0 | 0 | 0 | 0 | 0 | 3 | 0 | 0 | 0 | 0 | 0 | 0 | 3 | 0 | 0 | 0 | 0 | 0 | 0 | 3 | 0 | 0 | 0 | 0 | 0 | 0 | 3 | 0 | 0 | 0 | 0 | 0 | 0 | 3 |
| 112 | 0 | 0 | 0 | 0 | 0 | 0 | 2 | 0 | 0 | 0 | 0 | 0 | 0 | 2 | 0 | 0 | 0 | 0 | 0 | 0 | 2 | 0 | 0 | 0 | 0 | 0 | 0 | 2 | 0 | 0 | 0 | 0 | 0 | 0 | 2 |
| 113 | 0 | 0 | 0 | 0 | 0 | 0 | 2 | 0 | 0 | 0 | 0 | 0 | 0 | 2 | 0 | 0 | 0 | 0 | 0 | 0 | 2 | 0 | 0 | 0 | 0 | 0 | 0 | 2 | 0 | 0 | 0 | 0 | 0 | 0 | 2 |
| 114 | 0 | 0 | 0 | 0 | 0 | 0 | 2 | 0 | 0 | 0 | 0 | 0 | 0 | 2 | 0 | 0 | 0 | 0 | 0 | 0 | 2 | 0 | 0 | 0 | 0 | 0 | 0 | 2 | 0 | 0 | 0 | 0 | 0 | 0 | 2 |
| 115 | 0 | 0 | 0 | 0 | 0 | 0 | 2 | 0 | 0 | 0 | 0 | 0 | 0 | 1 | 0 | 0 | 0 | 0 | 0 | 0 | 1 | 0 | 0 | 0 | 0 | 0 | 0 | 1 | 0 | 0 | 0 | 0 | 0 | 0 | 2 |
| 116 | 0 | 0 | 0 | 0 | 0 | 0 | 2 | 0 | 0 | 0 | 0 | 0 | 0 | 1 | 0 | 0 | 0 | 0 | 0 | 0 | 1 | 0 | 0 | 0 | 0 | 0 | 0 | 1 | 0 | 0 | 0 | 0 | 0 | 0 | 2 |
| 117 | 0 | 0 | 0 | 0 | 0 | 0 | 3 | 0 | 0 | 0 | 0 | 0 | 0 | 3 | 0 | 0 | 0 | 0 | 0 | 0 | 3 | 0 | 0 | 0 | 0 | 0 | 0 | 3 | 0 | 0 | 0 | 0 | 0 | 0 | 3 |
| 118 | 0 | 3 | 0 | 0 | 0 | 0 | 3 | 0 | 4 | 0 | 0 | 0 | 0 | 4 | 0 | 4 | 0 | 0 | 0 | 0 | 4 | 0 | 4 | 0 | 0 | 0 | 0 | 4 | 0 | 3 | 0 | 0 | 0 | 0 | 3 |
| 119 | 0 | 3 | 0 | 0 | 0 | 0 | 3 | 0 | 4 | 0 | 0 | 0 | 0 | 4 | 0 | 2 | 0 | 0 | 0 | 0 | 2 | 0 | 3 | 0 | 0 | 0 | 0 | 3 | 0 | 3 | 0 | 0 | 0 | 0 | 3 |
| 120 | 0 | 4 | 0 | 0 | 0 | 0 | 4 | 0 | 4 | 0 | 0 | 0 | 0 | 5 | 0 | 1 | 0 | 0 | 0 | 0 | 1 | 0 | 1 | 0 | 0 | 0 | 0 | 1 | 0 | 4 | 0 | 0 | 0 | 0 | 4 |
| 121 | 0 | 4 | 0 | 0 | 0 | 0 | 4 | 0 | 4 | 0 | 0 | 0 | 0 | 4 | 0 | 1 | 0 | 0 | 0 | 0 | 1 | 0 | 1 | 0 | 0 | 0 | 0 | 1 | 0 | 4 | 0 | 0 | 0 | 0 | 4 |
| 122 | 0 | 4 | 0 | 0 | 0 | 0 | 4 | 0 | 4 | 0 | 0 | 0 | 0 | 3 | 0 | 1 | 0 | 0 | 0 | 0 | 1 | 0 | 1 | 0 | 0 | 0 | 0 | 1 | 0 | 4 | 0 | 0 | 0 | 0 | 4 |
| 123 | 0 | 5 | 0 | 0 | 0 | 0 | 5 | 0 | 4 | 0 | 0 | 0 | 0 | 5 | 0 | 1 | 0 | 0 | 0 | 0 | 1 | 0 | 1 | 0 | 0 | 0 | 0 | 1 | 0 | 5 | 0 | 0 | 0 | 0 | 5 |
| 124 | 0 | 3 | 0 | 0 | 0 | 0 | 3 | 0 | 3 | 0 | 0 | 0 | 0 | 3 | 0 | 1 | 0 | 0 | 0 | 0 | 1 | 0 | 1 | 0 | 0 | 0 | 0 | 1 | 0 | 3 | 0 | 0 | 0 | 0 | 3 |
| 125 | 0 | 4 | 0 | 0 | 0 | 0 | 4 | 0 | 4 | 0 | 0 | 0 | 0 | 4 | 0 | 4 | 0 | 0 | 0 | 0 | 4 | 0 | 4 | 0 | 0 | 0 | 0 | 4 | 0 | 4 | 0 | 0 | 0 | 0 | 4 |
| 126 | 0 | 5 | 0 | 0 | 0 | 0 | 5 | 0 | 5 | 0 | 0 | 0 | 0 | 5 | 0 | 1 | 0 | 0 | 0 | 0 | 1 | 0 | 1 | 0 | 0 | 0 | 0 | 1 | 0 | 5 | 0 | 0 | 0 | 0 | 5 |
| 127 | 0 | 3 | 0 | 0 | 0 | 0 | 3 | 0 | 4 | 0 | 0 | 0 | 0 | 4 | 0 | 4 | 0 | 0 | 0 | 0 | 4 | 0 | 4 | 0 | 0 | 0 | 0 | 4 | 0 | 3 | 0 | 0 | 0 | 0 | 3 |
| 128 | 0 | 3 | 0 | 0 | 0 | 0 | 3 | 0 | 5 | 0 | 0 | 0 | 0 | 5 | 0 | 5 | 0 | 0 | 0 | 0 | 5 | 0 | 5 | 0 | 0 | 0 | 0 | 5 | 0 | 3 | 0 | 0 | 0 | 0 | 3 |
| 129 | 0 | 5 | 0 | 5 | 0 | 0 | 5 | 0 | 5 | 0 | 5 | 0 | 0 | 5 | 0 | 5 | 0 | 5 | 0 | 0 | 5 | 0 | 5 | 0 | 5 | 0 | 0 | 5 | 0 | 5 | 0 | 5 | 0 | 0 | 5 |
| 130 | 0 | 5 | 0 | 5 | 0 | 0 | 5 | 0 | 5 | 0 | 5 | 0 | 0 | 5 | 0 | 5 | 0 | 5 | 0 | 0 | 5 | 0 | 5 | 0 | 5 | 0 | 0 | 5 | 0 | 5 | 0 | 5 | 0 | 0 | 5 |
| 131 | 0 | 5 | 0 | 3 | 0 | 3 | 5 | 0 | 5 | 0 | 3 | 0 | 3 | 5 | 0 | 5 | 0 | 3 | 0 | 3 | 5 | 0 | 5 | 0 | 3 | 0 | 3 | 5 | 0 | 5 | 0 | 3 | 0 | 3 | 5 |
| 132 | 0 | 5 | 0 | 3 | 0 | 3 | 5 | 0 | 5 | 0 | 3 | 0 | 3 | 5 | 0 | 5 | 0 | 3 | 0 | 3 | 5 | 0 | 5 | 0 | 3 | 0 | 3 | 5 | 0 | 5 | 0 | 3 | 0 | 3 | 5 |
| 133 | 0 | 5 | 0 | 3 | 0 | 3 | 5 | 0 | 5 | 0 | 3 | 0 | 3 | 5 | 0 | 5 | 0 | 3 | 0 | 3 | 5 | 0 | 5 | 0 | 3 | 0 | 3 | 5 | 0 | 5 | 0 | 3 | 0 | 3 | 5 |
| 134 | 0 | 5 | 0 | 3 | 0 | 3 | 5 | 0 | 5 | 0 | 3 | 0 | 3 | 5 | 0 | 5 | 0 | 3 | 0 | 3 | 5 | 0 | 5 | 0 | 3 | 0 | 3 | 5 | 0 | 5 | 0 | 3 | 0 | 3 | 5 |
| 135 | 0 | 4 | 0 | 4 | 0 | 0 | 5 | 0 | 4 | 0 | 4 | 0 | 0 | 5 | 0 | 4 | 0 | 4 | 0 | 0 | 4 | 0 | 4 | 0 | 4 | 0 | 0 | 4 | 0 | 4 | 0 | 4 | 0 | 0 | 5 |
| 136 | 0 | 4 | 0 | 4 | 0 | 0 | 5 | 0 | 4 | 0 | 4 | 0 | 0 | 5 | 0 | 4 | 0 | 4 | 0 | 0 | 4 | 0 | 4 | 0 | 4 | 0 | 0 | 4 | 0 | 4 | 0 | 4 | 0 | 0 | 5 |
| 137 | 0 | 4 | 0 | 4 | 0 | 0 | 5 | 0 | 4 | 0 | 4 | 0 | 0 | 5 | 0 | 4 | 0 | 4 | 0 | 0 | 4 | 0 | 4 | 0 | 4 | 0 | 0 | 4 | 0 | 4 | 0 | 4 | 0 | 0 | 5 |
| 138 | 0 | 4 | 0 | 4 | 0 | 0 | 4 | 0 | 4 | 0 | 4 | 0 | 0 | 4 | 0 | 4 | 0 | 4 | 0 | 0 | 4 | 0 | 4 | 0 | 4 | 0 | 0 | 4 | 0 | 4 | 0 | 4 | 0 | 0 | 4 |
| 139 | 0 | 4 | 0 | 4 | 0 | 0 | 4 | 0 | 4 | 0 | 4 | 0 | 0 | 4 | 0 | 4 | 0 | 4 | 0 | 0 | 4 | 0 | 4 | 0 | 4 | 0 | 0 | 4 | 0 | 4 | 0 | 4 | 0 | 0 | 4 |
| 140 | 0 | 4 | 0 | 4 | 0 | 0 | 4 | 0 | 4 | 0 | 4 | 0 | 0 | 4 | 0 | 4 | 0 | 4 | 0 | 0 | 4 | 0 | 4 | 0 | 4 | 0 | 0 | 4 | 0 | 4 | 0 | 4 | 0 | 0 | 4 |
| 141 | 0 | 3 | 0 | 1 | 0 | 0 | 3 | 0 | 3 | 0 | 1 | 0 | 0 | 3 | 0 | 3 | 0 | 1 | 0 | 0 | 3 | 0 | 3 | 0 | 1 | 0 | 0 | 3 | 0 | 3 | 0 | 1 | 0 | 0 | 3 |
| 142 | 0 | 4 | 0 | 0 | 0 | 0 | 2 | 0 | 4 | 0 | 0 | 0 | 0 | 3 | 0 | 4 | 0 | 0 | 0 | 0 | 3 | 0 | 4 | 0 | 0 | 0 | 0 | 3 | 0 | 4 | 0 | 0 | 0 | 0 | 2 |
| 143 | 0 | 5 | 0 | 0 | 0 | 0 | 4 | 0 | 5 | 0 | 0 | 0 | 0 | 4 | 0 | 5 | 0 | 0 | 0 | 0 | 4 | 0 | 5 | 0 | 0 | 0 | 0 | 4 | 0 | 5 | 0 | 0 | 0 | 0 | 4 |
| 144 | 0 | 5 | 0 | 0 | 0 | 0 | 4 | 0 | 5 | 0 | 0 | 0 | 0 | 4 | 0 | 5 | 0 | 0 | 0 | 0 | 4 | 0 | 5 | 0 | 0 | 0 | 0 | 4 | 0 | 5 | 0 | 0 | 0 | 0 | 4 |
| 145 | 0 | 0 | 0 | 0 | 0 | 0 | 2 | 0 | 0 | 0 | 0 | 0 | 0 | 2 | 0 | 0 | 0 | 0 | 0 | 0 | 1 | 0 | 0 | 0 | 0 | 0 | 0 | 1 | 0 | 0 | 0 | 0 | 0 | 0 | 2 |
| 146 | 0 | 0 | 0 | 0 | 0 | 0 | 3 | 0 | 0 | 0 | 0 | 0 | 0 | 3 | 0 | 0 | 0 | 0 | 0 | 0 | 3 | 0 | 0 | 0 | 0 | 0 | 0 | 3 | 0 | 0 | 0 | 0 | 0 | 0 | 3 |
| 147 | 0 | 0 | 0 | 0 | 0 | 0 | 4 | 0 | 0 | 0 | 0 | 0 | 0 | 4 | 0 | 0 | 0 | 0 | 0 | 0 | 1 | 0 | 0 | 0 | 0 | 0 | 0 | 1 | 0 | 0 | 0 | 0 | 0 | 0 | 4 |
| 148 | 4 | 4 | 0 | 4 | 0 | 4 | 0 | 3 | 3 | 0 | 3 | 0 | 3 | 0 | 1 | 1 | 0 | 1 | 0 | 1 | 0 | 1 | 1 | 0 | 1 | 0 | 1 | 0 | 4 | 4 | 0 | 4 | 0 | 4 | 0 |
| 149 | 4 | 4 | 0 | 4 | 0 | 4 | 0 | 3 | 3 | 0 | 4 | 0 | 4 | 0 | 1 | 1 | 0 | 1 | 0 | 1 | 0 | 1 | 1 | 0 | 1 | 0 | 1 | 0 | 4 | 4 | 0 | 4 | 0 | 4 | 0 |
| 150 | 0 | 1 | 0 | 4 | 0 | 0 | 0 | 0 | 3 | 0 | 3 | 0 | 0 | 0 | 0 | 2 | 0 | 2 | 0 | 0 | 0 | 0 | 2 | 0 | 2 | 0 | 0 | 0 | 0 | 1 | 0 | 4 | 0 | 0 | 0 |
| 151 | 0 | 1 | 0 | 4 | 0 | 0 | 0 | 0 | 1 | 0 | 3 | 0 | 0 | 0 | 0 | 1 | 0 | 3 | 0 | 0 | 0 | 0 | 1 | 0 | 3 | 0 | 0 | 0 | 0 | 1 | 0 | 4 | 0 | 0 | 0 |
| 152 | 0 | 1 | 0 | 3 | 0 | 0 | 0 | 0 | 3 | 0 | 4 | 0 | 0 | 0 | 0 | 2 | 0 | 2 | 0 | 0 | 0 | 0 | 2 | 0 | 2 | 0 | 0 | 0 | 0 | 1 | 0 | 3 | 0 | 0 | 0 |
| 153 | 0 | 5 | 0 | 5 | 0 | 0 | 4 | 0 | 4 | 0 | 4 | 0 | 0 | 4 | 0 | 2 | 0 | 2 | 0 | 0 | 3 | 0 | 2 | 0 | 2 | 0 | 0 | 3 | 0 | 5 | 0 | 5 | 0 | 0 | 4 |
| 154 | 5 | 4 | 5 | 5 | 5 | 5 | 4 | 5 | 4 | 5 | 5 | 5 | 5 | 4 | 5 | 4 | 5 | 5 | 5 | 5 | 4 | 5 | 4 | 5 | 5 | 5 | 5 | 4 | 5 | 4 | 5 | 5 | 5 | 5 | 4 |
| 155 | 0 | 4 | 5 | 3 | 0 | 3 | 0 | 0 | 1 | 1 | 1 | 0 | 1 | 0 | 0 | 1 | 1 | 1 | 0 | 1 | 0 | 0 | 1 | 1 | 1 | 0 | 1 | 0 | 0 | 4 | 5 | 3 | 0 | 3 | 0 |
| 156 | 5 | 5 | 0 | 5 | 0 | 5 | 5 | 5 | 5 | 0 | 5 | 0 | 5 | 5 | 5 | 5 | 0 | 5 | 0 | 5 | 5 | 5 | 5 | 0 | 5 | 0 | 5 | 5 | 5 | 5 | 0 | 5 | 0 | 5 | 5 |
| 157 | 3 | 5 | 0 | 3 | 0 | 3 | 4 | 3 | 4 | 0 | 3 | 0 | 3 | 4 | 4 | 5 | 0 | 4 | 0 | 4 | 4 | 4 | 5 | 0 | 4 | 0 | 4 | 4 | 3 | 5 | 0 | 3 | 0 | 3 | 4 |
| 158 | 3 | 4 | 3 | 5 | 0 | 5 | 4 | 3 | 3 | 3 | 5 | 0 | 5 | 4 | 3 | 3 | 3 | 5 | 0 | 5 | 4 | 3 | 3 | 3 | 5 | 0 | 5 | 4 | 3 | 4 | 3 | 5 | 0 | 5 | 4 |
| 159 | 4 | 2 | 0 | 4 | 0 | 4 | 0 | 3 | 2 | 0 | 4 | 0 | 4 | 0 | 3 | 2 | 0 | 4 | 0 | 4 | 0 | 3 | 2 | 0 | 4 | 0 | 4 | 0 | 4 | 2 | 0 | 4 | 0 | 4 | 0 |
| 160 | 5 | 4 | 0 | 5 | 0 | 5 | 0 | 2 | 2 | 0 | 3 | 0 | 3 | 0 | 3 | 3 | 0 | 3 | 0 | 3 | 0 | 3 | 3 | 0 | 3 | 0 | 3 | 0 | 5 | 4 | 0 | 5 | 0 | 5 | 0 |
| 161 | 5 | 4 | 0 | 5 | 0 | 5 | 0 | 3 | 3 | 0 | 4 | 0 | 4 | 0 | 3 | 3 | 0 | 4 | 0 | 4 | 0 | 3 | 3 | 0 | 4 | 0 | 4 | 0 | 5 | 4 | 0 | 5 | 0 | 5 | 0 |
| 162 | 3 | 3 | 0 | 5 | 0 | 5 | 4 | 3 | 4 | 0 | 5 | 0 | 5 | 4 | 3 | 4 | 0 | 5 | 0 | 5 | 4 | 3 | 4 | 0 | 5 | 0 | 5 | 4 | 3 | 3 | 0 | 5 | 0 | 5 | 4 |
| 163 | 3 | 4 | 0 | 4 | 0 | 4 | 0 | 3 | 4 | 0 | 4 | 0 | 4 | 0 | 3 | 4 | 0 | 4 | 0 | 4 | 0 | 3 | 4 | 0 | 4 | 0 | 4 | 0 | 3 | 4 | 0 | 4 | 0 | 4 | 0 |
| 164 | 4 | 2 | 0 | 3 | 0 | 3 | 4 | 3 | 2 | 0 | 3 | 0 | 3 | 4 | 3 | 2 | 0 | 3 | 0 | 3 | 4 | 3 | 2 | 0 | 3 | 0 | 3 | 4 | 4 | 2 | 0 | 3 | 0 | 3 | 4 |
| 165 | 4 | 2 | 0 | 3 | 0 | 3 | 0 | 4 | 2 | 0 | 3 | 0 | 3 | 0 | 4 | 2 | 0 | 3 | 0 | 3 | 0 | 4 | 2 | 0 | 3 | 0 | 3 | 0 | 4 | 2 | 0 | 3 | 0 | 3 | 0 |
| 166 | 0 | 2 | 0 | 3 | 5 | 3 | 0 | 0 | 2 | 0 | 3 | 5 | 3 | 0 | 0 | 3 | 0 | 3 | 5 | 3 | 0 | 0 | 3 | 0 | 3 | 5 | 3 | 0 | 0 | 2 | 0 | 3 | 5 | 3 | 0 |
| 167 | 3 | 2 | 0 | 4 | 4 | 4 | 0 | 4 | 3 | 0 | 4 | 4 | 4 | 0 | 1 | 1 | 0 | 1 | 1 | 1 | 0 | 1 | 1 | 0 | 1 | 1 | 1 | 0 | 3 | 2 | 0 | 4 | 4 | 4 | 0 |
| 168 | 3 | 2 | 0 | 4 | 4 | 4 | 0 | 4 | 3 | 0 | 4 | 4 | 4 | 0 | 2 | 2 | 0 | 2 | 2 | 2 | 0 | 2 | 2 | 0 | 2 | 2 | 2 | 0 | 3 | 2 | 0 | 4 | 4 | 4 | 0 |
| 169 | 5 | 3 | 0 | 5 | 0 | 5 | 0 | 4 | 3 | 0 | 5 | 0 | 5 | 0 | 2 | 2 | 0 | 2 | 0 | 2 | 0 | 2 | 2 | 0 | 2 | 0 | 2 | 0 | 5 | 3 | 0 | 5 | 0 | 5 | 0 |
| 170 | 0 | 5 | 0 | 3 | 0 | 3 | 0 | 0 | 1 | 0 | 3 | 0 | 3 | 0 | 0 | 1 | 0 | 1 | 0 | 1 | 0 | 0 | 1 | 0 | 1 | 0 | 1 | 0 | 0 | 5 | 0 | 3 | 0 | 3 | 0 |
| 171 | 4 | 2 | 4 | 4 | 3 | 4 | 0 | 3 | 1 | 4 | 4 | 3 | 4 | 0 | 3 | 1 | 4 | 4 | 3 | 4 | 0 | 3 | 1 | 4 | 4 | 3 | 4 | 0 | 4 | 2 | 4 | 4 | 3 | 4 | 0 |
| 172 | 4 | 2 | 4 | 4 | 4 | 4 | 0 | 3 | 2 | 4 | 4 | 4 | 4 | 0 | 3 | 2 | 4 | 4 | 4 | 4 | 0 | 3 | 2 | 4 | 4 | 4 | 4 | 0 | 4 | 2 | 4 | 4 | 4 | 4 | 0 |
| 173 | 4 | 4 | 0 | 4 | 4 | 4 | 0 | 4 | 4 | 0 | 4 | 4 | 4 | 0 | 1 | 1 | 0 | 1 | 1 | 1 | 0 | 1 | 1 | 0 | 1 | 1 | 1 | 0 | 4 | 4 | 0 | 4 | 4 | 4 | 0 |
| 174 | 3 | 3 | 5 | 4 | 0 | 4 | 3 | 2 | 2 | 3 | 4 | 0 | 4 | 3 | 2 | 2 | 3 | 4 | 0 | 4 | 3 | 2 | 2 | 3 | 4 | 0 | 4 | 3 | 3 | 3 | 5 | 4 | 0 | 4 | 3 |
| 175 | 4 | 2 | 1 | 3 | 5 | 3 | 0 | 4 | 2 | 1 | 3 | 5 | 3 | 0 | 4 | 2 | 1 | 3 | 5 | 3 | 0 | 4 | 2 | 1 | 3 | 5 | 3 | 0 | 4 | 2 | 1 | 3 | 5 | 3 | 0 |
| 176 | 0 | 4 | 0 | 0 | 4 | 0 | 4 | 0 | 4 | 0 | 0 | 4 | 0 | 4 | 0 | 4 | 0 | 0 | 4 | 0 | 4 | 0 | 4 | 0 | 0 | 4 | 0 | 4 | 0 | 4 | 0 | 0 | 4 | 0 | 4 |
| 177 | 4 | 2 | 0 | 0 | 3 | 0 | 0 | 3 | 1 | 0 | 0 | 3 | 0 | 0 | 3 | 1 | 0 | 0 | 3 | 0 | 0 | 3 | 1 | 0 | 0 | 3 | 0 | 0 | 4 | 2 | 0 | 0 | 3 | 0 | 0 |
| 178 | 4 | 0 | 0 | 0 | 5 | 0 | 0 | 4 | 0 | 0 | 0 | 5 | 0 | 0 | 4 | 0 | 0 | 0 | 5 | 0 | 0 | 4 | 0 | 0 | 0 | 5 | 0 | 0 | 4 | 0 | 0 | 0 | 5 | 0 | 0 |
| 179 | 3 | 0 | 0 | 0 | 0 | 0 | 0 | 3 | 0 | 0 | 0 | 0 | 0 | 0 | 3 | 0 | 0 | 0 | 0 | 0 | 0 | 3 | 0 | 0 | 0 | 0 | 0 | 0 | 3 | 0 | 0 | 0 | 0 | 0 | 0 |
| 180 | 3 | 3 | 0 | 0 | 0 | 0 | 0 | 3 | 4 | 0 | 0 | 0 | 0 | 0 | 3 | 4 | 0 | 0 | 0 | 0 | 0 | 3 | 4 | 0 | 0 | 0 | 0 | 0 | 3 | 3 | 0 | 0 | 0 | 0 | 0 |
| 181 | 3 | 0 | 3 | 0 | 0 | 0 | 0 | 3 | 0 | 3 | 0 | 0 | 0 | 0 | 3 | 0 | 3 | 0 | 0 | 0 | 0 | 3 | 0 | 3 | 0 | 0 | 0 | 0 | 3 | 0 | 3 | 0 | 0 | 0 | 0 |
| 182 | 3 | 0 | 0 | 0 | 0 | 0 | 0 | 3 | 0 | 0 | 0 | 0 | 0 | 0 | 3 | 0 | 0 | 0 | 0 | 0 | 0 | 3 | 0 | 0 | 0 | 0 | 0 | 0 | 3 | 0 | 0 | 0 | 0 | 0 | 0 |
| 183 | 3 | 0 | 0 | 3 | 0 | 0 | 0 | 3 | 0 | 0 | 4 | 0 | 0 | 0 | 3 | 0 | 0 | 4 | 0 | 0 | 0 | 3 | 0 | 0 | 4 | 0 | 0 | 0 | 3 | 0 | 0 | 3 | 0 | 0 | 0 |
| 184 | 3 | 0 | 0 | 0 | 0 | 3 | 0 | 3 | 0 | 0 | 0 | 0 | 4 | 0 | 3 | 0 | 0 | 0 | 0 | 4 | 0 | 3 | 0 | 0 | 0 | 0 | 4 | 0 | 3 | 0 | 0 | 0 | 0 | 3 | 0 |
| 185 | 3 | 0 | 0 | 0 | 0 | 0 | 0 | 3 | 0 | 0 | 0 | 0 | 0 | 0 | 3 | 0 | 0 | 0 | 0 | 0 | 0 | 3 | 0 | 0 | 0 | 0 | 0 | 0 | 3 | 0 | 0 | 0 | 0 | 0 | 0 |
| 186 | 3 | 0 | 0 | 0 | 0 | 0 | 0 | 3 | 0 | 0 | 0 | 0 | 0 | 0 | 3 | 0 | 0 | 0 | 0 | 0 | 0 | 3 | 0 | 0 | 0 | 0 | 0 | 0 | 3 | 0 | 0 | 0 | 0 | 0 | 0 |
| 187 | 3 | 0 | 0 | 0 | 0 | 0 | 0 | 3 | 0 | 0 | 0 | 0 | 0 | 0 | 3 | 0 | 0 | 0 | 0 | 0 | 0 | 3 | 0 | 0 | 0 | 0 | 0 | 0 | 3 | 0 | 0 | 0 | 0 | 0 | 0 |
| 188 | 4 | 0 | 0 | 0 | 0 | 0 | 4 | 4 | 0 | 0 | 0 | 0 | 0 | 4 | 4 | 0 | 0 | 0 | 0 | 0 | 4 | 4 | 0 | 0 | 0 | 0 | 0 | 4 | 4 | 0 | 0 | 0 | 0 | 0 | 4 |
| 189 | 4 | 0 | 4 | 0 | 0 | 0 | 0 | 4 | 0 | 4 | 0 | 0 | 0 | 0 | 4 | 0 | 4 | 0 | 0 | 0 | 0 | 4 | 0 | 4 | 0 | 0 | 0 | 0 | 4 | 0 | 4 | 0 | 0 | 0 | 0 |
| 190 | 5 | 0 | 4 | 0 | 0 | 0 | 5 | 5 | 0 | 4 | 0 | 0 | 0 | 5 | 5 | 0 | 4 | 0 | 0 | 0 | 5 | 5 | 0 | 4 | 0 | 0 | 0 | 5 | 5 | 0 | 4 | 0 | 0 | 0 | 5 |
| 191 | 4 | 0 | 4 | 0 | 0 | 0 | 0 | 3 | 0 | 4 | 0 | 0 | 0 | 0 | 3 | 0 | 4 | 0 | 0 | 0 | 0 | 3 | 0 | 4 | 0 | 0 | 0 | 0 | 4 | 0 | 4 | 0 | 0 | 0 | 0 |
| 192 | 4 | 4 | 4 | 4 | 3 | 4 | 4 | 4 | 4 | 4 | 4 | 3 | 4 | 4 | 4 | 4 | 4 | 4 | 3 | 4 | 4 | 4 | 4 | 4 | 4 | 3 | 4 | 4 | 4 | 4 | 4 | 4 | 3 | 4 | 4 |
| 193 | 3 | 3 | 3 | 2 | 0 | 2 | 0 | 3 | 3 | 3 | 2 | 0 | 2 | 0 | 3 | 3 | 3 | 2 | 0 | 2 | 0 | 3 | 3 | 3 | 2 | 0 | 2 | 0 | 3 | 3 | 3 | 2 | 0 | 2 | 0 |
| 194 | 3 | 2 | 3 | 1 | 0 | 1 | 0 | 2 | 2 | 3 | 1 | 0 | 1 | 0 | 2 | 2 | 3 | 1 | 0 | 1 | 0 | 2 | 2 | 3 | 1 | 0 | 1 | 0 | 3 | 2 | 3 | 1 | 0 | 1 | 0 |
| 195 | 3 | 2 | 3 | 1 | 0 | 1 | 0 | 1 | 1 | 1 | 1 | 0 | 1 | 0 | 1 | 1 | 1 | 1 | 0 | 1 | 0 | 1 | 1 | 1 | 1 | 0 | 1 | 0 | 3 | 2 | 3 | 1 | 0 | 1 | 0 |
| 196 | 4 | 2 | 5 | 4 | 4 | 4 | 3 | 3 | 2 | 5 | 4 | 4 | 4 | 3 | 3 | 2 | 5 | 4 | 4 | 4 | 3 | 3 | 2 | 5 | 4 | 4 | 4 | 3 | 4 | 2 | 5 | 4 | 4 | 4 | 3 |
| 197 | 3 | 4 | 3 | 4 | 3 | 4 | 4 | 2 | 3 | 2 | 4 | 3 | 4 | 4 | 2 | 3 | 2 | 3 | 3 | 3 | 4 | 2 | 3 | 2 | 3 | 3 | 3 | 4 | 3 | 4 | 3 | 4 | 3 | 4 | 4 |
| 198 | 3 | 3 | 0 | 3 | 2 | 3 | 4 | 2 | 3 | 0 | 3 | 2 | 3 | 4 | 2 | 3 | 0 | 3 | 2 | 3 | 4 | 2 | 3 | 0 | 3 | 2 | 3 | 4 | 3 | 3 | 0 | 3 | 2 | 3 | 4 |
| 199 | 3 | 3 | 0 | 3 | 2 | 3 | 4 | 3 | 3 | 0 | 3 | 2 | 3 | 4 | 3 | 3 | 0 | 3 | 2 | 3 | 4 | 3 | 3 | 0 | 3 | 2 | 3 | 4 | 3 | 3 | 0 | 3 | 2 | 3 | 4 |
| 200 | 3 | 3 | 0 | 3 | 0 | 3 | 0 | 3 | 3 | 0 | 3 | 0 | 3 | 0 | 3 | 3 | 0 | 3 | 0 | 3 | 0 | 3 | 3 | 0 | 3 | 0 | 3 | 0 | 3 | 3 | 0 | 3 | 0 | 3 | 0 |
| 201 | 3 | 3 | 0 | 4 | 0 | 4 | 0 | 4 | 4 | 0 | 4 | 0 | 4 | 0 | 4 | 4 | 0 | 4 | 0 | 4 | 0 | 4 | 4 | 0 | 4 | 0 | 4 | 0 | 3 | 3 | 0 | 4 | 0 | 4 | 0 |
| 202 | 3 | 3 | 0 | 3 | 0 | 3 | 4 | 2 | 3 | 0 | 3 | 0 | 3 | 4 | 2 | 3 | 0 | 3 | 0 | 3 | 4 | 2 | 3 | 0 | 3 | 0 | 3 | 4 | 3 | 3 | 0 | 3 | 0 | 3 | 4 |
| 203 | 3 | 3 | 0 | 3 | 0 | 3 | 4 | 2 | 3 | 0 | 3 | 0 | 3 | 4 | 2 | 3 | 0 | 3 | 0 | 3 | 4 | 2 | 3 | 0 | 3 | 0 | 3 | 4 | 3 | 3 | 0 | 3 | 0 | 3 | 4 |
| 204 | 3 | 3 | 0 | 3 | 2 | 3 | 4 | 1 | 3 | 0 | 3 | 2 | 3 | 4 | 1 | 3 | 0 | 3 | 2 | 3 | 4 | 1 | 3 | 0 | 3 | 2 | 3 | 4 | 3 | 3 | 0 | 3 | 2 | 3 | 4 |
| 205 | 3 | 3 | 0 | 3 | 2 | 3 | 4 | 1 | 3 | 0 | 3 | 2 | 3 | 4 | 1 | 3 | 0 | 3 | 2 | 3 | 4 | 1 | 3 | 0 | 3 | 2 | 3 | 4 | 3 | 3 | 0 | 3 | 2 | 3 | 4 |
| 206 | 4 | 3 | 0 | 5 | 4 | 5 | 4 | 4 | 4 | 0 | 5 | 4 | 5 | 4 | 4 | 4 | 0 | 5 | 4 | 5 | 4 | 4 | 4 | 0 | 5 | 4 | 5 | 4 | 4 | 3 | 0 | 5 | 4 | 5 | 4 |
| 207 | 4 | 5 | 0 | 0 | 0 | 0 | 0 | 3 | 5 | 0 | 0 | 0 | 0 | 0 | 3 | 5 | 0 | 0 | 0 | 0 | 0 | 3 | 5 | 0 | 0 | 0 | 0 | 0 | 4 | 5 | 0 | 0 | 0 | 0 | 0 |
| 208 | 4 | 2 | 0 | 3 | 4 | 3 | 0 | 3 | 2 | 0 | 3 | 4 | 3 | 0 | 4 | 4 | 0 | 4 | 4 | 4 | 0 | 4 | 4 | 0 | 4 | 4 | 4 | 0 | 4 | 2 | 0 | 3 | 4 | 3 | 0 |
| 209 | 3 | 4 | 3 | 5 | 0 | 5 | 0 | 2 | 2 | 2 | 3 | 0 | 3 | 0 | 2 | 2 | 2 | 3 | 0 | 3 | 0 | 2 | 2 | 2 | 3 | 0 | 3 | 0 | 3 | 4 | 3 | 5 | 0 | 5 | 0 |
| 210 | 2 | 4 | 0 | 0 | 4 | 0 | 4 | 1 | 2 | 0 | 0 | 3 | 0 | 3 | 1 | 2 | 0 | 0 | 3 | 0 | 3 | 1 | 2 | 0 | 0 | 3 | 0 | 3 | 2 | 4 | 0 | 0 | 4 | 0 | 4 |
| 211 | 4 | 3 | 0 | 0 | 0 | 0 | 4 | 3 | 3 | 0 | 0 | 0 | 0 | 3 | 3 | 3 | 0 | 0 | 0 | 0 | 3 | 3 | 3 | 0 | 0 | 0 | 0 | 3 | 4 | 3 | 0 | 0 | 0 | 0 | 4 |
| 212 | 0 | 0 | 0 | 0 | 0 | 0 | 0 | 0 | 0 | 0 | 0 | 0 | 0 | 0 | 0 | 0 | 0 | 0 | 0 | 0 | 0 | 0 | 0 | 0 | 0 | 0 | 0 | 0 | 0 | 0 | 0 | 0 | 0 | 0 | 0 |
| 213 | 2 | 3 | 0 | 0 | 0 | 0 | 0 | 2 | 2 | 0 | 0 | 0 | 0 | 0 | 3 | 3 | 0 | 0 | 0 | 0 | 0 | 3 | 3 | 0 | 0 | 0 | 0 | 0 | 2 | 3 | 0 | 0 | 0 | 0 | 0 |
| 214 | 2 | 4 | 0 | 4 | 3 | 4 | 4 | 2 | 1 | 0 | 1 | 2 | 1 | 1 | 2 | 1 | 0 | 1 | 2 | 1 | 1 | 2 | 1 | 0 | 1 | 2 | 1 | 1 | 2 | 4 | 0 | 4 | 3 | 4 | 4 |
| 215 | 4 | 4 | 0 | 3 | 0 | 3 | 4 | 3 | 4 | 0 | 3 | 0 | 3 | 4 | 3 | 4 | 0 | 3 | 0 | 3 | 4 | 3 | 4 | 0 | 3 | 0 | 3 | 4 | 4 | 4 | 0 | 3 | 0 | 3 | 4 |
| 216 | 2 | 1 | 0 | 0 | 0 | 0 | 0 | 1 | 1 | 0 | 0 | 0 | 0 | 0 | 1 | 1 | 0 | 0 | 0 | 0 | 0 | 1 | 1 | 0 | 0 | 0 | 0 | 0 | 2 | 1 | 0 | 0 | 0 | 0 | 0 |
| 217 | 4 | 4 | 0 | 4 | 5 | 4 | 0 | 4 | 3 | 0 | 4 | 5 | 4 | 0 | 4 | 3 | 0 | 4 | 5 | 4 | 0 | 4 | 3 | 0 | 4 | 5 | 4 | 0 | 4 | 4 | 0 | 4 | 5 | 4 | 0 |
Source: generated by the authors based on the respondents’ completed questionnaire.
Table A4.
The list of threats likelihood per respondent.
| Governance Risks | Operational Risks | Human Resources Risks | Financial Risks | ICT Risks | Capital Adequacy Risks | Financial Crime Risks | Governance Risks | Operational Risks | Human Resources Risks | Financial Risks | ICT Risks | Capital Adequacy Risks | Financial Crime Risks | Governance Risks | Operational Risks | Human Resources Risks | Financial Risks | ICT Risks | Capital Adequacy Risks | Financial Crime Risks | Governance Risks | Operational Risks | Human Resources Risks | Financial Risks | ICT Risks | Capital Adequacy Risks | Financial Crime Risks | Governance Risks | Operational Risks | Human Resources Risks | Financial Risks | ICT Risks | Capital Adequacy Risks | Financial Crime Risks | |
|---|---|---|---|---|---|---|---|---|---|---|---|---|---|---|---|---|---|---|---|---|---|---|---|---|---|---|---|---|---|---|---|---|---|---|---|
| Respondent 1 | Respondent 2 | Respondent 3 | Respondent 4 | Respondent 5 | |||||||||||||||||||||||||||||||
| 1 | 0 | 0 | 0 | 1 | 1 | 0 | 0 | 0 | 0 | 0 | 1 | 1 | 0 | 0 | 0 | 0 | 0 | 1 | 1 | 0 | 0 | 0 | 0 | 0 | 1 | 1 | 0 | 0 | 0 | 0 | 0 | 1 | 1 | 0 | 0 |
| 2 | 0 | 0 | 0 | 1 | 1 | 0 | 0 | 0 | 0 | 0 | 1 | 1 | 0 | 0 | 0 | 0 | 0 | 1 | 1 | 0 | 0 | 0 | 0 | 0 | 1 | 1 | 0 | 0 | 0 | 0 | 0 | 1 | 1 | 0 | 0 |
| 3 | 0 | 0 | 0 | 2 | 2 | 0 | 0 | 0 | 0 | 0 | 2 | 2 | 0 | 0 | 0 | 0 | 0 | 1 | 1 | 0 | 0 | 0 | 0 | 0 | 1 | 1 | 0 | 0 | 0 | 0 | 0 | 2 | 2 | 0 | 0 |
| 4 | 0 | 0 | 0 | 2 | 2 | 0 | 0 | 0 | 0 | 0 | 1 | 1 | 0 | 0 | 0 | 0 | 0 | 2 | 2 | 0 | 0 | 0 | 0 | 0 | 2 | 2 | 0 | 0 | 0 | 0 | 0 | 1 | 1 | 0 | 0 |
| 5 | 0 | 0 | 0 | 4 | 5 | 0 | 0 | 0 | 0 | 0 | 2 | 2 | 0 | 0 | 0 | 0 | 0 | 2 | 2 | 0 | 0 | 0 | 0 | 0 | 3 | 3 | 0 | 0 | 0 | 0 | 0 | 2 | 2 | 0 | 0 |
| 6 | 0 | 0 | 0 | 3 | 4 | 0 | 0 | 0 | 0 | 0 | 3 | 3 | 0 | 0 | 0 | 0 | 0 | 3 | 3 | 0 | 0 | 0 | 0 | 0 | 2 | 2 | 0 | 0 | 0 | 0 | 0 | 3 | 3 | 0 | 0 |
| 7 | 0 | 0 | 0 | 3 | 3 | 0 | 0 | 0 | 0 | 0 | 2 | 2 | 0 | 0 | 0 | 0 | 0 | 1 | 1 | 0 | 0 | 0 | 0 | 0 | 1 | 1 | 0 | 0 | 0 | 0 | 0 | 2 | 2 | 0 | 0 |
| 8 | 0 | 0 | 0 | 3 | 2 | 0 | 0 | 0 | 0 | 0 | 2 | 2 | 0 | 0 | 0 | 0 | 0 | 2 | 2 | 0 | 0 | 0 | 0 | 0 | 2 | 2 | 0 | 0 | 0 | 0 | 0 | 2 | 2 | 0 | 0 |
| 9 | 0 | 0 | 0 | 2 | 1 | 0 | 0 | 0 | 0 | 0 | 1 | 1 | 0 | 0 | 0 | 0 | 0 | 1 | 1 | 0 | 0 | 0 | 0 | 0 | 1 | 1 | 0 | 0 | 0 | 0 | 0 | 1 | 1 | 0 | 0 |
| 10 | 0 | 0 | 0 | 3 | 0 | 0 | 0 | 0 | 0 | 0 | 2 | 0 | 0 | 0 | 0 | 0 | 0 | 2 | 0 | 0 | 0 | 0 | 0 | 0 | 2 | 0 | 0 | 0 | 0 | 0 | 0 | 2 | 0 | 0 | 0 |
| 11 | 0 | 0 | 0 | 3 | 0 | 0 | 0 | 0 | 0 | 0 | 2 | 0 | 0 | 0 | 0 | 0 | 0 | 2 | 0 | 0 | 0 | 0 | 0 | 0 | 2 | 0 | 0 | 0 | 0 | 0 | 0 | 2 | 0 | 0 | 0 |
| 12 | 4 | 4 | 4 | 4 | 4 | 0 | 0 | 4 | 4 | 4 | 4 | 4 | 0 | 0 | 4 | 4 | 4 | 4 | 4 | 0 | 0 | 4 | 4 | 4 | 4 | 4 | 0 | 0 | 4 | 4 | 4 | 4 | 4 | 0 | 0 |
| 13 | 0 | 0 | 3 | 0 | 0 | 0 | 0 | 0 | 0 | 1 | 0 | 0 | 0 | 0 | 0 | 0 | 2 | 0 | 0 | 0 | 0 | 0 | 0 | 2 | 0 | 0 | 0 | 0 | 0 | 0 | 1 | 0 | 0 | 0 | 0 |
| 14 | 0 | 0 | 3 | 0 | 0 | 0 | 0 | 0 | 0 | 1 | 0 | 0 | 0 | 0 | 0 | 0 | 2 | 0 | 0 | 0 | 0 | 0 | 0 | 1 | 0 | 0 | 0 | 0 | 0 | 0 | 1 | 0 | 0 | 0 | 0 |
| 15 | 0 | 0 | 3 | 0 | 3 | 0 | 0 | 0 | 0 | 3 | 0 | 3 | 0 | 0 | 0 | 0 | 1 | 0 | 1 | 0 | 0 | 0 | 0 | 1 | 0 | 1 | 0 | 0 | 0 | 0 | 3 | 0 | 3 | 0 | 0 |
| 16 | 0 | 0 | 1 | 1 | 1 | 0 | 0 | 0 | 0 | 1 | 1 | 1 | 0 | 0 | 0 | 0 | 1 | 1 | 1 | 0 | 0 | 0 | 0 | 1 | 1 | 1 | 0 | 0 | 0 | 0 | 1 | 1 | 1 | 0 | 0 |
| 17 | 0 | 0 | 2 | 2 | 2 | 0 | 0 | 0 | 0 | 2 | 2 | 2 | 0 | 0 | 0 | 0 | 2 | 2 | 2 | 0 | 0 | 0 | 0 | 2 | 2 | 2 | 0 | 0 | 0 | 0 | 3 | 3 | 3 | 0 | 0 |
| 18 | 0 | 3 | 3 | 0 | 3 | 0 | 0 | 0 | 3 | 3 | 0 | 3 | 0 | 0 | 0 | 2 | 2 | 0 | 2 | 0 | 0 | 0 | 2 | 2 | 0 | 2 | 0 | 0 | 0 | 3 | 3 | 0 | 3 | 0 | 0 |
| 19 | 0 | 3 | 3 | 0 | 3 | 0 | 0 | 0 | 3 | 3 | 0 | 4 | 0 | 0 | 0 | 2 | 2 | 0 | 2 | 0 | 0 | 0 | 2 | 2 | 0 | 2 | 0 | 0 | 0 | 3 | 3 | 0 | 3 | 0 | 0 |
| 20 | 0 | 3 | 3 | 3 | 3 | 0 | 0 | 0 | 4 | 2 | 4 | 3 | 0 | 0 | 0 | 3 | 2 | 3 | 3 | 0 | 0 | 0 | 2 | 2 | 3 | 2 | 0 | 0 | 0 | 3 | 3 | 3 | 3 | 0 | 0 |
| 21 | 0 | 4 | 4 | 4 | 4 | 0 | 0 | 0 | 2 | 2 | 1 | 2 | 0 | 0 | 0 | 1 | 1 | 1 | 1 | 0 | 0 | 0 | 1 | 1 | 1 | 1 | 0 | 0 | 0 | 2 | 2 | 2 | 2 | 0 | 0 |
| 22 | 0 | 3 | 3 | 3 | 3 | 3 | 4 | 0 | 3 | 1 | 2 | 2 | 2 | 2 | 0 | 3 | 2 | 2 | 2 | 2 | 2 | 0 | 3 | 2 | 2 | 2 | 2 | 2 | 0 | 3 | 3 | 3 | 3 | 3 | 2 |
| 23 | 0 | 3 | 0 | 3 | 3 | 0 | 0 | 0 | 2 | 0 | 3 | 3 | 0 | 0 | 0 | 2 | 0 | 2 | 2 | 0 | 0 | 0 | 2 | 0 | 2 | 2 | 0 | 0 | 0 | 3 | 0 | 3 | 3 | 0 | 0 |
| 24 | 0 | 0 | 0 | 0 | 1 | 0 | 0 | 0 | 0 | 0 | 0 | 1 | 0 | 0 | 0 | 0 | 0 | 0 | 1 | 0 | 0 | 0 | 0 | 0 | 0 | 1 | 0 | 0 | 0 | 0 | 0 | 0 | 2 | 0 | 0 |
| 25 | 0 | 0 | 0 | 0 | 1 | 0 | 0 | 0 | 0 | 0 | 0 | 1 | 0 | 0 | 0 | 0 | 0 | 0 | 1 | 0 | 0 | 0 | 0 | 0 | 0 | 1 | 0 | 0 | 0 | 0 | 0 | 0 | 3 | 0 | 0 |
| 26 | 0 | 1 | 0 | 0 | 1 | 0 | 1 | 0 | 1 | 0 | 0 | 1 | 0 | 1 | 0 | 1 | 0 | 0 | 1 | 0 | 1 | 0 | 1 | 0 | 0 | 1 | 0 | 1 | 0 | 2 | 0 | 0 | 2 | 0 | 2 |
| 27 | 0 | 0 | 0 | 0 | 1 | 0 | 0 | 0 | 0 | 0 | 0 | 1 | 0 | 0 | 0 | 0 | 0 | 0 | 1 | 0 | 0 | 0 | 0 | 0 | 0 | 1 | 0 | 0 | 0 | 0 | 0 | 0 | 2 | 0 | 0 |
| 28 | 0 | 0 | 0 | 0 | 1 | 0 | 0 | 0 | 0 | 0 | 0 | 1 | 0 | 0 | 0 | 0 | 0 | 0 | 1 | 0 | 0 | 0 | 0 | 0 | 0 | 1 | 0 | 0 | 0 | 0 | 0 | 0 | 2 | 0 | 0 |
| 29 | 0 | 3 | 0 | 3 | 3 | 3 | 3 | 0 | 2 | 0 | 3 | 3 | 3 | 2 | 0 | 2 | 0 | 2 | 2 | 2 | 2 | 0 | 2 | 0 | 2 | 2 | 2 | 2 | 0 | 2 | 0 | 2 | 2 | 2 | 2 |
| 30 | 0 | 4 | 0 | 0 | 4 | 0 | 0 | 0 | 3 | 0 | 0 | 3 | 0 | 0 | 0 | 2 | 0 | 0 | 2 | 0 | 0 | 0 | 2 | 0 | 0 | 2 | 0 | 0 | 0 | 3 | 0 | 0 | 3 | 0 | 0 |
| 31 | 0 | 3 | 0 | 0 | 3 | 0 | 0 | 0 | 1 | 0 | 0 | 1 | 0 | 0 | 0 | 1 | 0 | 0 | 1 | 0 | 0 | 0 | 1 | 0 | 0 | 1 | 0 | 0 | 0 | 2 | 0 | 0 | 2 | 0 | 0 |
| 32 | 0 | 1 | 0 | 0 | 1 | 0 | 0 | 0 | 3 | 0 | 0 | 3 | 0 | 0 | 0 | 2 | 0 | 0 | 2 | 0 | 0 | 0 | 2 | 0 | 0 | 2 | 0 | 0 | 0 | 3 | 0 | 0 | 3 | 0 | 0 |
| 33 | 0 | 0 | 0 | 0 | 1 | 0 | 0 | 0 | 0 | 0 | 0 | 1 | 0 | 0 | 0 | 0 | 0 | 0 | 1 | 0 | 0 | 0 | 0 | 0 | 0 | 1 | 0 | 0 | 0 | 0 | 0 | 0 | 2 | 0 | 0 |
| 34 | 0 | 1 | 0 | 1 | 1 | 0 | 0 | 0 | 1 | 0 | 1 | 2 | 0 | 0 | 0 | 1 | 0 | 1 | 2 | 0 | 0 | 0 | 1 | 0 | 1 | 2 | 0 | 0 | 0 | 2 | 0 | 2 | 2 | 0 | 0 |
| 35 | 0 | 4 | 1 | 0 | 1 | 0 | 0 | 0 | 3 | 2 | 0 | 2 | 0 | 0 | 0 | 2 | 2 | 0 | 2 | 0 | 0 | 0 | 2 | 2 | 0 | 2 | 0 | 0 | 0 | 3 | 3 | 0 | 3 | 0 | 0 |
| 36 | 0 | 0 | 0 | 0 | 1 | 0 | 0 | 0 | 0 | 0 | 0 | 1 | 0 | 0 | 0 | 0 | 0 | 0 | 1 | 0 | 0 | 0 | 0 | 0 | 0 | 1 | 0 | 0 | 0 | 0 | 0 | 0 | 2 | 0 | 0 |
| 37 | 0 | 0 | 0 | 0 | 4 | 0 | 0 | 0 | 0 | 0 | 0 | 3 | 0 | 0 | 0 | 0 | 0 | 0 | 3 | 0 | 0 | 0 | 0 | 0 | 0 | 3 | 0 | 0 | 0 | 0 | 0 | 0 | 3 | 0 | 0 |
| 38 | 0 | 0 | 0 | 0 | 1 | 0 | 0 | 0 | 0 | 0 | 0 | 1 | 0 | 0 | 0 | 0 | 0 | 0 | 1 | 0 | 0 | 0 | 0 | 0 | 0 | 1 | 0 | 0 | 0 | 0 | 0 | 0 | 2 | 0 | 0 |
| 39 | 0 | 0 | 0 | 0 | 3 | 0 | 0 | 0 | 0 | 0 | 0 | 2 | 0 | 0 | 0 | 0 | 0 | 0 | 2 | 0 | 0 | 0 | 0 | 0 | 0 | 2 | 0 | 0 | 0 | 0 | 0 | 0 | 2 | 0 | 0 |
| 40 | 0 | 1 | 0 | 1 | 1 | 1 | 0 | 0 | 2 | 0 | 2 | 3 | 2 | 0 | 0 | 2 | 0 | 2 | 2 | 2 | 0 | 0 | 2 | 0 | 2 | 2 | 2 | 0 | 0 | 2 | 0 | 2 | 2 | 2 | 0 |
| 41 | 0 | 0 | 0 | 2 | 2 | 2 | 0 | 0 | 0 | 0 | 1 | 1 | 1 | 0 | 0 | 0 | 0 | 1 | 1 | 1 | 0 | 0 | 0 | 0 | 1 | 1 | 1 | 0 | 0 | 0 | 0 | 1 | 1 | 1 | 0 |
| 42 | 0 | 0 | 0 | 1 | 1 | 1 | 0 | 0 | 0 | 0 | 1 | 1 | 1 | 0 | 0 | 0 | 0 | 1 | 1 | 1 | 0 | 0 | 0 | 0 | 1 | 1 | 1 | 0 | 0 | 0 | 0 | 1 | 1 | 1 | 0 |
| 43 | 0 | 0 | 0 | 0 | 1 | 0 | 0 | 0 | 0 | 0 | 0 | 1 | 0 | 0 | 0 | 0 | 0 | 0 | 1 | 0 | 0 | 0 | 0 | 0 | 0 | 1 | 0 | 0 | 0 | 0 | 0 | 0 | 3 | 0 | 0 |
| 44 | 0 | 0 | 0 | 0 | 3 | 0 | 0 | 0 | 0 | 0 | 0 | 3 | 0 | 0 | 0 | 0 | 0 | 0 | 3 | 0 | 0 | 0 | 0 | 0 | 0 | 3 | 0 | 0 | 0 | 0 | 0 | 0 | 3 | 0 | 0 |
| 45 | 3 | 3 | 3 | 3 | 3 | 3 | 0 | 2 | 3 | 2 | 2 | 2 | 2 | 0 | 1 | 1 | 1 | 2 | 2 | 2 | 0 | 1 | 1 | 1 | 2 | 2 | 2 | 0 | 2 | 2 | 2 | 2 | 2 | 2 | 0 |
| 46 | 0 | 0 | 0 | 0 | 1 | 0 | 0 | 0 | 0 | 0 | 0 | 2 | 0 | 0 | 0 | 0 | 0 | 0 | 2 | 0 | 0 | 0 | 0 | 0 | 0 | 2 | 0 | 0 | 0 | 0 | 0 | 0 | 2 | 0 | 0 |
| 47 | 0 | 0 | 0 | 0 | 1 | 0 | 0 | 0 | 0 | 0 | 0 | 1 | 0 | 0 | 0 | 0 | 0 | 0 | 1 | 0 | 0 | 0 | 0 | 0 | 0 | 1 | 0 | 0 | 0 | 0 | 0 | 0 | 2 | 0 | 0 |
| 48 | 4 | 4 | 4 | 4 | 4 | 4 | 4 | 3 | 4 | 2 | 4 | 4 | 4 | 4 | 3 | 3 | 2 | 3 | 3 | 3 | 4 | 3 | 3 | 2 | 3 | 3 | 3 | 4 | 3 | 3 | 1 | 3 | 3 | 3 | 4 |
| 49 | 0 | 0 | 0 | 0 | 0 | 0 | 3 | 0 | 0 | 0 | 0 | 0 | 0 | 2 | 0 | 0 | 0 | 0 | 0 | 0 | 2 | 0 | 0 | 0 | 0 | 0 | 0 | 2 | 0 | 0 | 0 | 0 | 0 | 0 | 2 |
| 50 | 0 | 0 | 0 | 0 | 0 | 0 | 3 | 0 | 0 | 0 | 0 | 0 | 0 | 3 | 0 | 0 | 0 | 0 | 0 | 0 | 3 | 0 | 0 | 0 | 0 | 0 | 0 | 3 | 0 | 0 | 0 | 0 | 0 | 0 | 2 |
| 51 | 0 | 0 | 0 | 0 | 0 | 0 | 1 | 0 | 0 | 0 | 0 | 0 | 0 | 1 | 0 | 0 | 0 | 0 | 0 | 0 | 1 | 0 | 0 | 0 | 0 | 0 | 0 | 1 | 0 | 0 | 0 | 0 | 0 | 0 | 1 |
| 52 | 0 | 0 | 0 | 0 | 0 | 0 | 4 | 0 | 0 | 0 | 0 | 0 | 0 | 4 | 0 | 0 | 0 | 0 | 0 | 0 | 4 | 0 | 0 | 0 | 0 | 0 | 0 | 4 | 0 | 0 | 0 | 0 | 0 | 0 | 1 |
| 53 | 0 | 0 | 0 | 0 | 0 | 0 | 3 | 0 | 0 | 0 | 0 | 0 | 0 | 3 | 0 | 0 | 0 | 0 | 0 | 0 | 3 | 0 | 0 | 0 | 0 | 0 | 0 | 3 | 0 | 0 | 0 | 0 | 0 | 0 | 1 |
| 54 | 0 | 0 | 0 | 0 | 0 | 0 | 1 | 0 | 0 | 0 | 0 | 0 | 0 | 1 | 0 | 0 | 0 | 0 | 0 | 0 | 1 | 0 | 0 | 0 | 0 | 0 | 0 | 1 | 0 | 0 | 0 | 0 | 0 | 0 | 1 |
| 55 | 0 | 0 | 0 | 0 | 0 | 0 | 1 | 0 | 0 | 0 | 0 | 0 | 0 | 1 | 0 | 0 | 0 | 0 | 0 | 0 | 1 | 0 | 0 | 0 | 0 | 0 | 0 | 1 | 0 | 0 | 0 | 0 | 0 | 0 | 1 |
| 56 | 0 | 0 | 0 | 0 | 0 | 0 | 3 | 0 | 0 | 0 | 0 | 0 | 0 | 3 | 0 | 0 | 0 | 0 | 0 | 0 | 3 | 0 | 0 | 0 | 0 | 0 | 0 | 3 | 0 | 0 | 0 | 0 | 0 | 0 | 1 |
| 57 | 0 | 0 | 0 | 0 | 0 | 0 | 1 | 0 | 0 | 0 | 0 | 0 | 0 | 1 | 0 | 0 | 0 | 0 | 0 | 0 | 1 | 0 | 0 | 0 | 0 | 0 | 0 | 1 | 0 | 0 | 0 | 0 | 0 | 0 | 1 |
| 58 | 0 | 0 | 0 | 0 | 0 | 0 | 3 | 0 | 0 | 0 | 0 | 0 | 0 | 3 | 0 | 0 | 0 | 0 | 0 | 0 | 3 | 0 | 0 | 0 | 0 | 0 | 0 | 3 | 0 | 0 | 0 | 0 | 0 | 0 | 1 |
| 59 | 0 | 0 | 0 | 0 | 0 | 0 | 3 | 0 | 0 | 0 | 0 | 0 | 0 | 3 | 0 | 0 | 0 | 0 | 0 | 0 | 3 | 0 | 0 | 0 | 0 | 0 | 0 | 3 | 0 | 0 | 0 | 0 | 0 | 0 | 1 |
| 60 | 0 | 0 | 0 | 0 | 0 | 0 | 1 | 0 | 0 | 0 | 0 | 0 | 0 | 1 | 0 | 0 | 0 | 0 | 0 | 0 | 1 | 0 | 0 | 0 | 0 | 0 | 0 | 1 | 0 | 0 | 0 | 0 | 0 | 0 | 1 |
| 61 | 0 | 0 | 0 | 0 | 0 | 0 | 3 | 0 | 0 | 0 | 0 | 0 | 0 | 3 | 0 | 0 | 0 | 0 | 0 | 0 | 3 | 0 | 0 | 0 | 0 | 0 | 0 | 3 | 0 | 0 | 0 | 0 | 0 | 0 | 1 |
| 62 | 0 | 0 | 0 | 0 | 0 | 0 | 3 | 0 | 0 | 0 | 0 | 0 | 0 | 3 | 0 | 0 | 0 | 0 | 0 | 0 | 3 | 0 | 0 | 0 | 0 | 0 | 0 | 3 | 0 | 0 | 0 | 0 | 0 | 0 | 1 |
| 63 | 0 | 0 | 0 | 0 | 0 | 0 | 1 | 0 | 0 | 0 | 0 | 0 | 0 | 1 | 0 | 0 | 0 | 0 | 0 | 0 | 1 | 0 | 0 | 0 | 0 | 0 | 0 | 1 | 0 | 0 | 0 | 0 | 0 | 0 | 1 |
| 64 | 0 | 0 | 0 | 0 | 0 | 0 | 2 | 0 | 0 | 0 | 0 | 0 | 0 | 3 | 0 | 0 | 0 | 0 | 0 | 0 | 3 | 0 | 0 | 0 | 0 | 0 | 0 | 3 | 0 | 0 | 0 | 0 | 0 | 0 | 1 |
| 65 | 0 | 0 | 0 | 0 | 0 | 0 | 3 | 0 | 0 | 0 | 0 | 0 | 0 | 4 | 0 | 0 | 0 | 0 | 0 | 0 | 4 | 0 | 0 | 0 | 0 | 0 | 0 | 4 | 0 | 0 | 0 | 0 | 0 | 0 | 1 |
| 66 | 0 | 0 | 0 | 0 | 0 | 0 | 3 | 0 | 0 | 0 | 0 | 0 | 0 | 3 | 0 | 0 | 0 | 0 | 0 | 0 | 3 | 0 | 0 | 0 | 0 | 0 | 0 | 3 | 0 | 0 | 0 | 0 | 0 | 0 | 1 |
| 67 | 0 | 0 | 0 | 0 | 0 | 0 | 2 | 0 | 0 | 0 | 0 | 0 | 0 | 1 | 0 | 0 | 0 | 0 | 0 | 0 | 1 | 0 | 0 | 0 | 0 | 0 | 0 | 1 | 0 | 0 | 0 | 0 | 0 | 0 | 1 |
| 68 | 0 | 0 | 0 | 0 | 0 | 0 | 4 | 0 | 0 | 0 | 0 | 0 | 0 | 4 | 0 | 0 | 0 | 0 | 0 | 0 | 4 | 0 | 0 | 0 | 0 | 0 | 0 | 4 | 0 | 0 | 0 | 0 | 0 | 0 | 2 |
| 69 | 0 | 0 | 0 | 0 | 0 | 0 | 5 | 0 | 0 | 0 | 0 | 0 | 0 | 2 | 0 | 0 | 0 | 0 | 0 | 0 | 2 | 0 | 0 | 0 | 0 | 0 | 0 | 2 | 0 | 0 | 0 | 0 | 0 | 0 | 2 |
| 70 | 0 | 0 | 0 | 0 | 0 | 0 | 3 | 0 | 0 | 0 | 0 | 0 | 0 | 2 | 0 | 0 | 0 | 0 | 0 | 0 | 2 | 0 | 0 | 0 | 0 | 0 | 0 | 2 | 0 | 0 | 0 | 0 | 0 | 0 | 2 |
| 71 | 5 | 0 | 0 | 5 | 0 | 5 | 5 | 2 | 0 | 0 | 2 | 0 | 2 | 2 | 2 | 0 | 0 | 2 | 0 | 2 | 2 | 2 | 0 | 0 | 2 | 0 | 2 | 2 | 2 | 0 | 0 | 2 | 0 | 2 | 2 |
| 72 | 5 | 0 | 0 | 5 | 0 | 5 | 5 | 2 | 0 | 0 | 2 | 0 | 2 | 2 | 2 | 0 | 0 | 2 | 0 | 2 | 2 | 2 | 0 | 0 | 2 | 0 | 2 | 2 | 2 | 0 | 0 | 2 | 0 | 2 | 2 |
| 73 | 3 | 0 | 0 | 3 | 0 | 3 | 3 | 2 | 0 | 0 | 2 | 0 | 2 | 2 | 2 | 0 | 0 | 2 | 0 | 2 | 2 | 2 | 0 | 0 | 2 | 0 | 2 | 2 | 2 | 0 | 0 | 2 | 0 | 2 | 2 |
| 74 | 3 | 0 | 0 | 0 | 0 | 0 | 3 | 4 | 0 | 0 | 0 | 0 | 0 | 4 | 4 | 0 | 0 | 0 | 0 | 0 | 4 | 4 | 0 | 0 | 0 | 0 | 0 | 4 | 2 | 0 | 0 | 0 | 0 | 0 | 2 |
| 75 | 3 | 0 | 0 | 0 | 0 | 0 | 3 | 3 | 0 | 0 | 0 | 0 | 0 | 3 | 3 | 0 | 0 | 0 | 0 | 0 | 3 | 3 | 0 | 0 | 0 | 0 | 0 | 3 | 1 | 0 | 0 | 0 | 0 | 0 | 1 |
| 76 | 3 | 0 | 0 | 0 | 0 | 0 | 3 | 3 | 0 | 0 | 0 | 0 | 0 | 3 | 3 | 0 | 0 | 0 | 0 | 0 | 3 | 3 | 0 | 0 | 0 | 0 | 0 | 3 | 1 | 0 | 0 | 0 | 0 | 0 | 1 |
| 77 | 5 | 0 | 0 | 5 | 0 | 5 | 5 | 3 | 0 | 0 | 3 | 0 | 3 | 3 | 3 | 0 | 0 | 3 | 0 | 3 | 3 | 3 | 0 | 0 | 3 | 0 | 3 | 3 | 1 | 0 | 0 | 1 | 0 | 1 | 1 |
| 78 | 5 | 0 | 0 | 5 | 0 | 5 | 5 | 3 | 0 | 0 | 3 | 0 | 3 | 3 | 3 | 0 | 0 | 3 | 0 | 3 | 3 | 3 | 0 | 0 | 3 | 0 | 3 | 3 | 1 | 0 | 0 | 1 | 0 | 1 | 1 |
| 79 | 1 | 0 | 0 | 1 | 0 | 1 | 1 | 1 | 0 | 0 | 1 | 0 | 1 | 1 | 1 | 0 | 0 | 1 | 0 | 1 | 1 | 1 | 0 | 0 | 1 | 0 | 1 | 1 | 1 | 0 | 0 | 1 | 0 | 1 | 1 |
| 80 | 0 | 0 | 0 | 5 | 0 | 5 | 5 | 0 | 0 | 0 | 4 | 0 | 4 | 4 | 0 | 0 | 0 | 4 | 0 | 4 | 4 | 0 | 0 | 0 | 4 | 0 | 4 | 4 | 0 | 0 | 0 | 4 | 0 | 4 | 4 |
| 81 | 0 | 0 | 0 | 5 | 0 | 5 | 5 | 0 | 0 | 0 | 4 | 0 | 4 | 4 | 0 | 0 | 0 | 4 | 0 | 4 | 4 | 0 | 0 | 0 | 4 | 0 | 4 | 4 | 0 | 0 | 0 | 4 | 0 | 4 | 4 |
| 82 | 0 | 0 | 0 | 1 | 0 | 1 | 1 | 0 | 0 | 0 | 1 | 0 | 1 | 1 | 0 | 0 | 0 | 1 | 0 | 1 | 1 | 0 | 0 | 0 | 1 | 0 | 1 | 1 | 0 | 0 | 0 | 1 | 0 | 1 | 1 |
| 83 | 0 | 0 | 0 | 3 | 0 | 3 | 3 | 0 | 0 | 0 | 3 | 0 | 3 | 3 | 0 | 0 | 0 | 3 | 0 | 3 | 3 | 0 | 0 | 0 | 3 | 0 | 3 | 3 | 0 | 0 | 0 | 3 | 0 | 3 | 3 |
| 84 | 0 | 0 | 0 | 0 | 0 | 0 | 2 | 0 | 0 | 0 | 0 | 0 | 0 | 3 | 0 | 0 | 0 | 0 | 0 | 0 | 3 | 0 | 0 | 0 | 0 | 0 | 0 | 3 | 0 | 0 | 0 | 0 | 0 | 0 | 3 |
| 85 | 0 | 0 | 0 | 0 | 0 | 0 | 3 | 0 | 0 | 0 | 0 | 0 | 0 | 2 | 0 | 0 | 0 | 0 | 0 | 0 | 2 | 0 | 0 | 0 | 0 | 0 | 0 | 2 | 0 | 0 | 0 | 0 | 0 | 0 | 2 |
| 86 | 0 | 0 | 0 | 0 | 0 | 0 | 3 | 0 | 0 | 0 | 0 | 0 | 0 | 2 | 0 | 0 | 0 | 0 | 0 | 0 | 2 | 0 | 0 | 0 | 0 | 0 | 0 | 2 | 0 | 0 | 0 | 0 | 0 | 0 | 2 |
| 87 | 0 | 0 | 0 | 0 | 0 | 0 | 1 | 0 | 0 | 0 | 0 | 0 | 0 | 1 | 0 | 0 | 0 | 0 | 0 | 0 | 1 | 0 | 0 | 0 | 0 | 0 | 0 | 1 | 0 | 0 | 0 | 0 | 0 | 0 | 1 |
| 88 | 0 | 0 | 0 | 0 | 0 | 0 | 2 | 0 | 0 | 0 | 0 | 0 | 0 | 1 | 0 | 0 | 0 | 0 | 0 | 0 | 1 | 0 | 0 | 0 | 0 | 0 | 0 | 1 | 0 | 0 | 0 | 0 | 0 | 0 | 1 |
| 89 | 0 | 0 | 0 | 0 | 0 | 0 | 3 | 0 | 0 | 0 | 0 | 0 | 0 | 3 | 0 | 0 | 0 | 0 | 0 | 0 | 3 | 0 | 0 | 0 | 0 | 0 | 0 | 3 | 0 | 0 | 0 | 0 | 0 | 0 | 3 |
| 90 | 0 | 0 | 0 | 0 | 0 | 0 | 3 | 0 | 0 | 0 | 0 | 0 | 0 | 4 | 0 | 0 | 0 | 0 | 0 | 0 | 4 | 0 | 0 | 0 | 0 | 0 | 0 | 4 | 0 | 0 | 0 | 0 | 0 | 0 | 4 |
| 91 | 0 | 0 | 0 | 0 | 0 | 0 | 3 | 0 | 0 | 0 | 0 | 0 | 0 | 2 | 0 | 0 | 0 | 0 | 0 | 0 | 2 | 0 | 0 | 0 | 0 | 0 | 0 | 2 | 0 | 0 | 0 | 0 | 0 | 0 | 2 |
| 92 | 0 | 0 | 0 | 0 | 0 | 0 | 3 | 0 | 0 | 0 | 0 | 0 | 0 | 2 | 0 | 0 | 0 | 0 | 0 | 0 | 2 | 0 | 0 | 0 | 0 | 0 | 0 | 2 | 0 | 0 | 0 | 0 | 0 | 0 | 2 |
| 93 | 0 | 0 | 0 | 0 | 0 | 0 | 3 | 0 | 0 | 0 | 0 | 0 | 0 | 4 | 0 | 0 | 0 | 0 | 0 | 0 | 4 | 0 | 0 | 0 | 0 | 0 | 0 | 4 | 0 | 0 | 0 | 0 | 0 | 0 | 4 |
| 94 | 0 | 0 | 0 | 0 | 0 | 0 | 3 | 0 | 0 | 0 | 0 | 0 | 0 | 3 | 0 | 0 | 0 | 0 | 0 | 0 | 3 | 0 | 0 | 0 | 0 | 0 | 0 | 3 | 0 | 0 | 0 | 0 | 0 | 0 | 3 |
| 95 | 0 | 0 | 0 | 0 | 0 | 0 | 2 | 0 | 0 | 0 | 0 | 0 | 0 | 2 | 0 | 0 | 0 | 0 | 0 | 0 | 2 | 0 | 0 | 0 | 0 | 0 | 0 | 2 | 0 | 0 | 0 | 0 | 0 | 0 | 2 |
| 96 | 0 | 0 | 0 | 0 | 0 | 0 | 2 | 0 | 0 | 0 | 0 | 0 | 0 | 3 | 0 | 0 | 0 | 0 | 0 | 0 | 3 | 0 | 0 | 0 | 0 | 0 | 0 | 3 | 0 | 0 | 0 | 0 | 0 | 0 | 3 |
| 97 | 0 | 0 | 0 | 0 | 0 | 0 | 2 | 0 | 0 | 0 | 0 | 0 | 0 | 1 | 0 | 0 | 0 | 0 | 0 | 0 | 1 | 0 | 0 | 0 | 0 | 0 | 0 | 1 | 0 | 0 | 0 | 0 | 0 | 0 | 1 |
| 98 | 0 | 0 | 0 | 0 | 0 | 0 | 2 | 0 | 0 | 0 | 0 | 0 | 0 | 1 | 0 | 0 | 0 | 0 | 0 | 0 | 1 | 0 | 0 | 0 | 0 | 0 | 0 | 1 | 0 | 0 | 0 | 0 | 0 | 0 | 1 |
| 99 | 0 | 0 | 0 | 0 | 0 | 0 | 2 | 0 | 0 | 0 | 0 | 0 | 0 | 2 | 0 | 0 | 0 | 0 | 0 | 0 | 2 | 0 | 0 | 0 | 0 | 0 | 0 | 2 | 0 | 0 | 0 | 0 | 0 | 0 | 2 |
| 100 | 0 | 0 | 0 | 0 | 0 | 0 | 2 | 0 | 0 | 0 | 0 | 0 | 0 | 3 | 0 | 0 | 0 | 0 | 0 | 0 | 3 | 0 | 0 | 0 | 0 | 0 | 0 | 3 | 0 | 0 | 0 | 0 | 0 | 0 | 3 |
| 101 | 0 | 0 | 0 | 0 | 0 | 0 | 2 | 0 | 0 | 0 | 0 | 0 | 0 | 1 | 0 | 0 | 0 | 0 | 0 | 0 | 1 | 0 | 0 | 0 | 0 | 0 | 0 | 1 | 0 | 0 | 0 | 0 | 0 | 0 | 1 |
| 102 | 0 | 0 | 0 | 0 | 0 | 0 | 2 | 0 | 0 | 0 | 0 | 0 | 0 | 2 | 0 | 0 | 0 | 0 | 0 | 0 | 2 | 0 | 0 | 0 | 0 | 0 | 0 | 2 | 0 | 0 | 0 | 0 | 0 | 0 | 2 |
| 103 | 0 | 0 | 0 | 0 | 0 | 0 | 2 | 0 | 0 | 0 | 0 | 0 | 0 | 2 | 0 | 0 | 0 | 0 | 0 | 0 | 2 | 0 | 0 | 0 | 0 | 0 | 0 | 2 | 0 | 0 | 0 | 0 | 0 | 0 | 2 |
| 104 | 0 | 0 | 0 | 0 | 0 | 0 | 3 | 0 | 0 | 0 | 0 | 0 | 0 | 2 | 0 | 0 | 0 | 0 | 0 | 0 | 2 | 0 | 0 | 0 | 0 | 0 | 0 | 2 | 0 | 0 | 0 | 0 | 0 | 0 | 2 |
| 105 | 0 | 0 | 0 | 0 | 0 | 0 | 3 | 0 | 0 | 0 | 0 | 0 | 0 | 2 | 0 | 0 | 0 | 0 | 0 | 0 | 2 | 0 | 0 | 0 | 0 | 0 | 0 | 2 | 0 | 0 | 0 | 0 | 0 | 0 | 2 |
| 106 | 0 | 0 | 0 | 0 | 0 | 0 | 3 | 0 | 0 | 0 | 0 | 0 | 0 | 2 | 0 | 0 | 0 | 0 | 0 | 0 | 2 | 0 | 0 | 0 | 0 | 0 | 0 | 2 | 0 | 0 | 0 | 0 | 0 | 0 | 2 |
| 107 | 0 | 0 | 0 | 0 | 0 | 0 | 2 | 0 | 0 | 0 | 0 | 0 | 0 | 1 | 0 | 0 | 0 | 0 | 0 | 0 | 1 | 0 | 0 | 0 | 0 | 0 | 0 | 1 | 0 | 0 | 0 | 0 | 0 | 0 | 1 |
| 108 | 0 | 0 | 0 | 0 | 0 | 0 | 2 | 0 | 0 | 0 | 0 | 0 | 0 | 2 | 0 | 0 | 0 | 0 | 0 | 0 | 2 | 0 | 0 | 0 | 0 | 0 | 0 | 2 | 0 | 0 | 0 | 0 | 0 | 0 | 2 |
| 109 | 0 | 0 | 0 | 0 | 0 | 0 | 2 | 0 | 0 | 0 | 0 | 0 | 0 | 2 | 0 | 0 | 0 | 0 | 0 | 0 | 2 | 0 | 0 | 0 | 0 | 0 | 0 | 2 | 0 | 0 | 0 | 0 | 0 | 0 | 2 |
| 110 | 0 | 0 | 0 | 0 | 0 | 0 | 2 | 0 | 0 | 0 | 0 | 0 | 0 | 1 | 0 | 0 | 0 | 0 | 0 | 0 | 1 | 0 | 0 | 0 | 0 | 0 | 0 | 1 | 0 | 0 | 0 | 0 | 0 | 0 | 1 |
| 111 | 0 | 0 | 0 | 0 | 0 | 0 | 2 | 0 | 0 | 0 | 0 | 0 | 0 | 3 | 0 | 0 | 0 | 0 | 0 | 0 | 3 | 0 | 0 | 0 | 0 | 0 | 0 | 3 | 0 | 0 | 0 | 0 | 0 | 0 | 3 |
| 112 | 0 | 0 | 0 | 0 | 0 | 0 | 2 | 0 | 0 | 0 | 0 | 0 | 0 | 1 | 0 | 0 | 0 | 0 | 0 | 0 | 1 | 0 | 0 | 0 | 0 | 0 | 0 | 1 | 0 | 0 | 0 | 0 | 0 | 0 | 1 |
| 113 | 0 | 0 | 0 | 0 | 0 | 0 | 2 | 0 | 0 | 0 | 0 | 0 | 0 | 1 | 0 | 0 | 0 | 0 | 0 | 0 | 1 | 0 | 0 | 0 | 0 | 0 | 0 | 1 | 0 | 0 | 0 | 0 | 0 | 0 | 1 |
| 114 | 0 | 0 | 0 | 0 | 0 | 0 | 2 | 0 | 0 | 0 | 0 | 0 | 0 | 2 | 0 | 0 | 0 | 0 | 0 | 0 | 2 | 0 | 0 | 0 | 0 | 0 | 0 | 2 | 0 | 0 | 0 | 0 | 0 | 0 | 2 |
| 115 | 0 | 0 | 0 | 0 | 0 | 0 | 2 | 0 | 0 | 0 | 0 | 0 | 0 | 1 | 0 | 0 | 0 | 0 | 0 | 0 | 1 | 0 | 0 | 0 | 0 | 0 | 0 | 1 | 0 | 0 | 0 | 0 | 0 | 0 | 1 |
| 116 | 0 | 0 | 0 | 0 | 0 | 0 | 2 | 0 | 0 | 0 | 0 | 0 | 0 | 2 | 0 | 0 | 0 | 0 | 0 | 0 | 2 | 0 | 0 | 0 | 0 | 0 | 0 | 2 | 0 | 0 | 0 | 0 | 0 | 0 | 2 |
| 117 | 0 | 0 | 0 | 0 | 0 | 0 | 2 | 0 | 0 | 0 | 0 | 0 | 0 | 1 | 0 | 0 | 0 | 0 | 0 | 0 | 1 | 0 | 0 | 0 | 0 | 0 | 0 | 1 | 0 | 0 | 0 | 0 | 0 | 0 | 1 |
| 118 | 0 | 3 | 0 | 0 | 0 | 0 | 3 | 0 | 3 | 0 | 0 | 0 | 0 | 3 | 0 | 3 | 0 | 0 | 0 | 0 | 3 | 0 | 3 | 0 | 0 | 0 | 0 | 3 | 0 | 1 | 0 | 0 | 0 | 0 | 1 |
| 119 | 0 | 4 | 0 | 0 | 0 | 0 | 4 | 0 | 1 | 0 | 0 | 0 | 0 | 1 | 0 | 1 | 0 | 0 | 0 | 0 | 1 | 0 | 1 | 0 | 0 | 0 | 0 | 1 | 0 | 1 | 0 | 0 | 0 | 0 | 1 |
| 120 | 0 | 3 | 0 | 0 | 0 | 0 | 3 | 0 | 3 | 0 | 0 | 0 | 0 | 3 | 0 | 1 | 0 | 0 | 0 | 0 | 1 | 0 | 1 | 0 | 0 | 0 | 0 | 1 | 0 | 1 | 0 | 0 | 0 | 0 | 1 |
| 121 | 0 | 3 | 0 | 0 | 0 | 0 | 3 | 0 | 3 | 0 | 0 | 0 | 0 | 3 | 0 | 1 | 0 | 0 | 0 | 0 | 1 | 0 | 1 | 0 | 0 | 0 | 0 | 1 | 0 | 1 | 0 | 0 | 0 | 0 | 1 |
| 122 | 0 | 3 | 0 | 0 | 0 | 0 | 3 | 0 | 3 | 0 | 0 | 0 | 0 | 3 | 0 | 1 | 0 | 0 | 0 | 0 | 1 | 0 | 1 | 0 | 0 | 0 | 0 | 1 | 0 | 1 | 0 | 0 | 0 | 0 | 1 |
| 123 | 0 | 3 | 0 | 0 | 0 | 0 | 3 | 0 | 3 | 0 | 0 | 0 | 0 | 3 | 0 | 1 | 0 | 0 | 0 | 0 | 1 | 0 | 1 | 0 | 0 | 0 | 0 | 1 | 0 | 1 | 0 | 0 | 0 | 0 | 1 |
| 124 | 0 | 3 | 0 | 0 | 0 | 0 | 3 | 0 | 3 | 0 | 0 | 0 | 0 | 3 | 0 | 1 | 0 | 0 | 0 | 0 | 1 | 0 | 1 | 0 | 0 | 0 | 0 | 1 | 0 | 1 | 0 | 0 | 0 | 0 | 1 |
| 125 | 0 | 4 | 0 | 0 | 0 | 0 | 4 | 0 | 4 | 0 | 0 | 0 | 0 | 4 | 0 | 5 | 0 | 0 | 0 | 0 | 5 | 0 | 5 | 0 | 0 | 0 | 0 | 5 | 0 | 5 | 0 | 0 | 0 | 0 | 5 |
| 126 | 0 | 3 | 0 | 0 | 0 | 0 | 3 | 0 | 3 | 0 | 0 | 0 | 0 | 3 | 0 | 1 | 0 | 0 | 0 | 0 | 1 | 0 | 1 | 0 | 0 | 0 | 0 | 1 | 0 | 1 | 0 | 0 | 0 | 0 | 1 |
| 127 | 0 | 1 | 0 | 0 | 0 | 0 | 1 | 0 | 3 | 0 | 0 | 0 | 0 | 3 | 0 | 5 | 0 | 0 | 0 | 0 | 5 | 0 | 5 | 0 | 0 | 0 | 0 | 5 | 0 | 3 | 0 | 0 | 0 | 0 | 3 |
| 128 | 0 | 2 | 0 | 0 | 0 | 0 | 2 | 0 | 3 | 0 | 0 | 0 | 0 | 3 | 0 | 4 | 0 | 0 | 0 | 0 | 4 | 0 | 4 | 0 | 0 | 0 | 0 | 4 | 0 | 2 | 0 | 0 | 0 | 0 | 2 |
| 129 | 0 | 3 | 0 | 3 | 0 | 0 | 3 | 0 | 5 | 0 | 5 | 0 | 0 | 5 | 0 | 2 | 0 | 2 | 0 | 0 | 2 | 0 | 2 | 0 | 2 | 0 | 0 | 2 | 0 | 2 | 0 | 2 | 0 | 0 | 2 |
| 130 | 0 | 3 | 0 | 3 | 0 | 0 | 3 | 0 | 5 | 0 | 5 | 0 | 0 | 5 | 0 | 2 | 0 | 2 | 0 | 0 | 2 | 0 | 2 | 0 | 2 | 0 | 0 | 2 | 0 | 2 | 0 | 2 | 0 | 0 | 2 |
| 131 | 0 | 2 | 0 | 2 | 0 | 2 | 2 | 0 | 5 | 0 | 5 | 0 | 5 | 5 | 0 | 2 | 0 | 2 | 0 | 2 | 2 | 0 | 2 | 0 | 2 | 0 | 2 | 2 | 0 | 2 | 0 | 2 | 0 | 2 | 2 |
| 132 | 0 | 2 | 0 | 2 | 0 | 2 | 2 | 0 | 5 | 0 | 5 | 0 | 5 | 5 | 0 | 2 | 0 | 2 | 0 | 2 | 2 | 0 | 2 | 0 | 2 | 0 | 2 | 2 | 0 | 2 | 0 | 2 | 0 | 2 | 2 |
| 133 | 0 | 5 | 0 | 5 | 0 | 5 | 5 | 0 | 4 | 0 | 4 | 0 | 4 | 4 | 0 | 2 | 0 | 2 | 0 | 2 | 2 | 0 | 2 | 0 | 2 | 0 | 2 | 2 | 0 | 2 | 0 | 2 | 0 | 2 | 2 |
| 134 | 0 | 5 | 0 | 5 | 0 | 5 | 5 | 0 | 3 | 0 | 3 | 0 | 3 | 3 | 0 | 3 | 0 | 3 | 0 | 3 | 3 | 0 | 3 | 0 | 3 | 0 | 3 | 3 | 0 | 3 | 0 | 3 | 0 | 3 | 3 |
| 135 | 0 | 5 | 0 | 5 | 0 | 0 | 5 | 0 | 4 | 0 | 4 | 0 | 0 | 4 | 0 | 4 | 0 | 4 | 0 | 0 | 4 | 0 | 4 | 0 | 4 | 0 | 0 | 4 | 0 | 4 | 0 | 4 | 0 | 0 | 4 |
| 136 | 0 | 5 | 0 | 5 | 0 | 0 | 5 | 0 | 3 | 0 | 3 | 0 | 0 | 3 | 0 | 3 | 0 | 3 | 0 | 0 | 3 | 0 | 3 | 0 | 3 | 0 | 0 | 3 | 0 | 3 | 0 | 3 | 0 | 0 | 3 |
| 137 | 0 | 1 | 0 | 1 | 0 | 0 | 1 | 0 | 3 | 0 | 3 | 0 | 0 | 3 | 0 | 3 | 0 | 3 | 0 | 0 | 3 | 0 | 3 | 0 | 3 | 0 | 0 | 3 | 0 | 3 | 0 | 3 | 0 | 0 | 3 |
| 138 | 0 | 4 | 0 | 4 | 0 | 0 | 4 | 0 | 3 | 0 | 3 | 0 | 0 | 3 | 0 | 3 | 0 | 3 | 0 | 0 | 3 | 0 | 3 | 0 | 3 | 0 | 0 | 3 | 0 | 3 | 0 | 3 | 0 | 0 | 3 |
| 139 | 0 | 4 | 0 | 4 | 0 | 0 | 4 | 0 | 3 | 0 | 3 | 0 | 0 | 3 | 0 | 3 | 0 | 3 | 0 | 0 | 3 | 0 | 3 | 0 | 3 | 0 | 0 | 3 | 0 | 3 | 0 | 3 | 0 | 0 | 3 |
| 140 | 0 | 1 | 0 | 1 | 0 | 0 | 1 | 0 | 2 | 0 | 2 | 0 | 0 | 2 | 0 | 2 | 0 | 2 | 0 | 0 | 2 | 0 | 2 | 0 | 2 | 0 | 0 | 2 | 0 | 2 | 0 | 2 | 0 | 0 | 2 |
| 141 | 0 | 3 | 0 | 3 | 0 | 0 | 3 | 0 | 1 | 0 | 1 | 0 | 0 | 1 | 0 | 1 | 0 | 1 | 0 | 0 | 1 | 0 | 1 | 0 | 1 | 0 | 0 | 1 | 0 | 1 | 0 | 1 | 0 | 0 | 1 |
| 142 | 0 | 2 | 0 | 0 | 0 | 0 | 2 | 0 | 5 | 0 | 0 | 0 | 0 | 5 | 0 | 1 | 0 | 0 | 0 | 0 | 1 | 0 | 1 | 0 | 0 | 0 | 0 | 1 | 0 | 1 | 0 | 0 | 0 | 0 | 1 |
| 143 | 0 | 4 | 0 | 0 | 0 | 0 | 4 | 0 | 3 | 0 | 0 | 0 | 0 | 3 | 0 | 5 | 0 | 0 | 0 | 0 | 5 | 0 | 5 | 0 | 0 | 0 | 0 | 5 | 0 | 1 | 0 | 0 | 0 | 0 | 1 |
| 144 | 0 | 4 | 0 | 0 | 0 | 0 | 4 | 0 | 1 | 0 | 0 | 0 | 0 | 1 | 0 | 5 | 0 | 0 | 0 | 0 | 5 | 0 | 5 | 0 | 0 | 0 | 0 | 5 | 0 | 1 | 0 | 0 | 0 | 0 | 1 |
| 145 | 0 | 0 | 0 | 0 | 0 | 0 | 2 | 0 | 0 | 0 | 0 | 0 | 0 | 3 | 0 | 0 | 0 | 0 | 0 | 0 | 1 | 0 | 0 | 0 | 0 | 0 | 0 | 1 | 0 | 0 | 0 | 0 | 0 | 0 | 1 |
| 146 | 0 | 0 | 0 | 0 | 0 | 0 | 3 | 0 | 0 | 0 | 0 | 0 | 0 | 5 | 0 | 0 | 0 | 0 | 0 | 0 | 5 | 0 | 0 | 0 | 0 | 0 | 0 | 5 | 0 | 0 | 0 | 0 | 0 | 0 | 5 |
| 147 | 0 | 0 | 0 | 0 | 0 | 0 | 4 | 0 | 0 | 0 | 0 | 0 | 0 | 2 | 0 | 0 | 0 | 0 | 0 | 0 | 1 | 0 | 0 | 0 | 0 | 0 | 0 | 1 | 0 | 0 | 0 | 0 | 0 | 0 | 1 |
| 148 | 3 | 3 | 0 | 3 | 0 | 3 | 0 | 2 | 2 | 0 | 2 | 0 | 2 | 0 | 1 | 1 | 0 | 1 | 0 | 1 | 0 | 1 | 1 | 0 | 1 | 0 | 1 | 0 | 1 | 1 | 0 | 1 | 0 | 1 | 0 |
| 149 | 3 | 3 | 0 | 3 | 0 | 3 | 0 | 3 | 3 | 0 | 3 | 0 | 3 | 0 | 1 | 1 | 0 | 1 | 0 | 1 | 0 | 1 | 1 | 0 | 1 | 0 | 1 | 0 | 1 | 1 | 0 | 1 | 0 | 1 | 0 |
| 150 | 0 | 4 | 0 | 4 | 0 | 0 | 0 | 0 | 3 | 0 | 3 | 0 | 0 | 0 | 0 | 3 | 0 | 3 | 0 | 0 | 0 | 0 | 2 | 0 | 2 | 0 | 0 | 0 | 0 | 2 | 0 | 2 | 0 | 0 | 0 |
| 151 | 0 | 4 | 0 | 4 | 0 | 0 | 0 | 0 | 2 | 0 | 2 | 0 | 0 | 0 | 0 | 2 | 0 | 2 | 0 | 0 | 0 | 0 | 1 | 0 | 1 | 0 | 0 | 0 | 0 | 1 | 0 | 1 | 0 | 0 | 0 |
| 152 | 0 | 4 | 0 | 4 | 0 | 0 | 0 | 0 | 3 | 0 | 3 | 0 | 0 | 0 | 0 | 3 | 0 | 3 | 0 | 0 | 0 | 0 | 2 | 0 | 2 | 0 | 0 | 0 | 0 | 1 | 0 | 1 | 0 | 0 | 0 |
| 153 | 0 | 4 | 0 | 4 | 0 | 0 | 4 | 0 | 1 | 0 | 1 | 0 | 0 | 1 | 0 | 1 | 0 | 1 | 0 | 0 | 1 | 0 | 1 | 0 | 1 | 0 | 0 | 1 | 0 | 1 | 0 | 1 | 0 | 0 | 1 |
| 154 | 4 | 4 | 4 | 4 | 4 | 4 | 4 | 2 | 2 | 2 | 2 | 2 | 2 | 2 | 2 | 2 | 2 | 2 | 2 | 2 | 2 | 1 | 1 | 1 | 1 | 1 | 1 | 1 | 1 | 1 | 1 | 1 | 1 | 1 | 1 |
| 155 | 0 | 3 | 3 | 3 | 0 | 3 | 0 | 0 | 1 | 1 | 1 | 0 | 1 | 0 | 0 | 1 | 1 | 1 | 0 | 1 | 0 | 0 | 1 | 1 | 1 | 0 | 1 | 0 | 0 | 1 | 1 | 1 | 0 | 1 | 0 |
| 156 | 3 | 2 | 0 | 4 | 0 | 4 | 4 | 4 | 3 | 0 | 4 | 0 | 4 | 4 | 2 | 2 | 0 | 2 | 0 | 2 | 2 | 1 | 1 | 0 | 1 | 0 | 1 | 1 | 1 | 1 | 0 | 1 | 0 | 1 | 1 |
| 157 | 3 | 2 | 0 | 4 | 0 | 4 | 4 | 3 | 3 | 0 | 4 | 0 | 4 | 4 | 2 | 2 | 0 | 2 | 0 | 2 | 2 | 1 | 1 | 0 | 1 | 0 | 1 | 1 | 1 | 1 | 0 | 1 | 0 | 1 | 1 |
| 158 | 1 | 2 | 2 | 4 | 0 | 4 | 4 | 2 | 2 | 2 | 4 | 0 | 4 | 4 | 2 | 2 | 2 | 2 | 0 | 2 | 2 | 1 | 1 | 1 | 1 | 0 | 1 | 1 | 1 | 1 | 1 | 1 | 0 | 1 | 1 |
| 159 | 3 | 3 | 0 | 3 | 0 | 3 | 0 | 2 | 2 | 0 | 2 | 0 | 2 | 0 | 1 | 1 | 1 | 1 | 0 | 1 | 0 | 1 | 1 | 1 | 1 | 0 | 1 | 0 | 1 | 1 | 1 | 1 | 0 | 1 | 0 |
| 160 | 4 | 4 | 0 | 4 | 0 | 4 | 0 | 1 | 1 | 0 | 1 | 0 | 1 | 0 | 1 | 1 | 0 | 1 | 0 | 1 | 0 | 1 | 1 | 0 | 1 | 0 | 1 | 0 | 1 | 1 | 0 | 1 | 0 | 1 | 0 |
| 161 | 1 | 2 | 0 | 2 | 0 | 2 | 0 | 1 | 1 | 0 | 1 | 0 | 1 | 0 | 1 | 1 | 0 | 1 | 0 | 1 | 0 | 1 | 1 | 0 | 1 | 0 | 1 | 0 | 1 | 1 | 0 | 1 | 0 | 1 | 0 |
| 162 | 3 | 3 | 0 | 4 | 0 | 4 | 4 | 2 | 2 | 0 | 2 | 0 | 2 | 2 | 3 | 3 | 0 | 3 | 0 | 3 | 3 | 2 | 2 | 0 | 2 | 0 | 2 | 2 | 1 | 1 | 0 | 1 | 0 | 1 | 1 |
| 163 | 1 | 1 | 0 | 1 | 0 | 1 | 0 | 1 | 1 | 0 | 1 | 0 | 1 | 0 | 1 | 1 | 0 | 1 | 0 | 1 | 0 | 1 | 1 | 0 | 1 | 0 | 1 | 0 | 1 | 1 | 0 | 1 | 0 | 1 | 0 |
| 164 | 2 | 2 | 0 | 4 | 0 | 4 | 4 | 4 | 4 | 0 | 3 | 0 | 3 | 3 | 3 | 3 | 0 | 3 | 0 | 3 | 3 | 2 | 2 | 0 | 2 | 0 | 2 | 2 | 2 | 2 | 0 | 2 | 0 | 2 | 2 |
| 165 | 3 | 1 | 0 | 3 | 0 | 3 | 0 | 1 | 1 | 0 | 1 | 0 | 1 | 0 | 1 | 1 | 0 | 1 | 0 | 1 | 0 | 1 | 1 | 0 | 1 | 0 | 1 | 0 | 1 | 1 | 0 | 1 | 0 | 1 | 0 |
| 166 | 0 | 1 | 0 | 3 | 3 | 3 | 0 | 0 | 2 | 0 | 2 | 2 | 2 | 0 | 0 | 1 | 0 | 1 | 1 | 1 | 0 | 0 | 1 | 0 | 1 | 1 | 1 | 0 | 0 | 1 | 0 | 1 | 1 | 1 | 0 |
| 167 | 4 | 2 | 0 | 4 | 4 | 4 | 0 | 1 | 1 | 0 | 1 | 1 | 1 | 0 | 1 | 1 | 0 | 1 | 1 | 1 | 0 | 1 | 1 | 0 | 1 | 1 | 1 | 0 | 1 | 1 | 0 | 1 | 1 | 1 | 0 |
| 168 | 4 | 2 | 0 | 4 | 4 | 4 | 0 | 3 | 4 | 0 | 3 | 3 | 3 | 0 | 1 | 1 | 0 | 1 | 1 | 1 | 0 | 1 | 1 | 0 | 1 | 1 | 1 | 0 | 1 | 1 | 0 | 1 | 1 | 1 | 0 |
| 169 | 3 | 3 | 0 | 3 | 0 | 3 | 0 | 2 | 2 | 0 | 2 | 0 | 2 | 0 | 1 | 1 | 0 | 1 | 0 | 1 | 0 | 1 | 1 | 0 | 1 | 0 | 1 | 0 | 1 | 1 | 0 | 1 | 0 | 1 | 0 |
| 170 | 0 | 2 | 0 | 2 | 0 | 2 | 0 | 0 | 1 | 0 | 1 | 0 | 1 | 0 | 0 | 1 | 0 | 1 | 0 | 1 | 0 | 0 | 1 | 0 | 1 | 0 | 1 | 0 | 0 | 1 | 0 | 1 | 0 | 1 | 0 |
| 171 | 4 | 2 | 4 | 4 | 4 | 4 | 0 | 3 | 3 | 3 | 3 | 3 | 3 | 0 | 2 | 2 | 2 | 2 | 2 | 2 | 0 | 2 | 2 | 2 | 2 | 2 | 2 | 0 | 2 | 2 | 2 | 2 | 2 | 2 | 0 |
| 172 | 4 | 2 | 4 | 4 | 4 | 4 | 0 | 2 | 2 | 2 | 2 | 2 | 2 | 0 | 2 | 2 | 2 | 2 | 2 | 2 | 0 | 2 | 2 | 2 | 2 | 2 | 2 | 0 | 2 | 2 | 2 | 2 | 2 | 2 | 0 |
| 173 | 4 | 4 | 0 | 4 | 4 | 4 | 0 | 3 | 3 | 0 | 3 | 3 | 3 | 0 | 1 | 1 | 0 | 1 | 1 | 1 | 0 | 1 | 1 | 0 | 1 | 1 | 1 | 0 | 1 | 1 | 0 | 1 | 1 | 1 | 0 |
| 174 | 3 | 3 | 4 | 4 | 0 | 4 | 3 | 2 | 2 | 2 | 2 | 0 | 2 | 2 | 2 | 2 | 2 | 2 | 0 | 2 | 2 | 2 | 2 | 2 | 2 | 0 | 2 | 2 | 2 | 2 | 2 | 2 | 0 | 2 | 2 |
| 175 | 3 | 2 | 1 | 3 | 2 | 3 | 0 | 1 | 1 | 1 | 1 | 1 | 1 | 0 | 3 | 3 | 3 | 3 | 3 | 3 | 0 | 3 | 3 | 3 | 3 | 3 | 3 | 0 | 2 | 2 | 2 | 2 | 2 | 2 | 0 |
| 176 | 0 | 4 | 0 | 0 | 4 | 0 | 4 | 0 | 3 | 0 | 0 | 3 | 0 | 3 | 0 | 4 | 0 | 0 | 4 | 0 | 4 | 0 | 4 | 0 | 0 | 4 | 0 | 4 | 0 | 3 | 0 | 0 | 3 | 0 | 3 |
| 177 | 3 | 2 | 0 | 0 | 3 | 0 | 0 | 3 | 2 | 0 | 0 | 3 | 0 | 0 | 3 | 2 | 0 | 0 | 3 | 0 | 0 | 3 | 2 | 0 | 0 | 3 | 0 | 0 | 2 | 2 | 0 | 0 | 2 | 0 | 0 |
| 178 | 2 | 0 | 0 | 0 | 2 | 0 | 0 | 3 | 0 | 0 | 0 | 3 | 0 | 0 | 4 | 0 | 0 | 0 | 4 | 0 | 0 | 4 | 0 | 0 | 0 | 4 | 0 | 0 | 2 | 0 | 0 | 0 | 2 | 0 | 0 |
| 179 | 4 | 0 | 0 | 0 | 0 | 0 | 0 | 3 | 0 | 0 | 0 | 0 | 0 | 0 | 4 | 0 | 0 | 0 | 0 | 0 | 0 | 4 | 0 | 0 | 0 | 0 | 0 | 0 | 4 | 0 | 0 | 0 | 0 | 0 | 0 |
| 180 | 4 | 4 | 0 | 0 | 0 | 0 | 0 | 3 | 3 | 0 | 0 | 0 | 0 | 0 | 4 | 4 | 0 | 0 | 0 | 0 | 0 | 4 | 4 | 0 | 0 | 0 | 0 | 0 | 4 | 4 | 0 | 0 | 0 | 0 | 0 |
| 181 | 4 | 0 | 4 | 0 | 0 | 0 | 0 | 3 | 0 | 3 | 0 | 0 | 0 | 0 | 4 | 0 | 4 | 0 | 0 | 0 | 0 | 4 | 0 | 4 | 0 | 0 | 0 | 0 | 4 | 0 | 4 | 0 | 0 | 0 | 0 |
| 182 | 4 | 0 | 0 | 0 | 0 | 0 | 0 | 3 | 0 | 0 | 0 | 0 | 0 | 0 | 4 | 0 | 0 | 0 | 0 | 0 | 0 | 4 | 0 | 0 | 0 | 0 | 0 | 0 | 4 | 0 | 0 | 0 | 0 | 0 | 0 |
| 183 | 4 | 0 | 0 | 4 | 0 | 0 | 0 | 3 | 0 | 0 | 3 | 0 | 0 | 0 | 4 | 0 | 0 | 4 | 0 | 0 | 0 | 4 | 0 | 0 | 4 | 0 | 0 | 0 | 4 | 0 | 0 | 4 | 0 | 0 | 0 |
| 184 | 3 | 0 | 0 | 0 | 0 | 3 | 0 | 3 | 0 | 0 | 0 | 0 | 3 | 0 | 4 | 0 | 0 | 0 | 0 | 4 | 0 | 4 | 0 | 0 | 0 | 0 | 4 | 0 | 4 | 0 | 0 | 0 | 0 | 4 | 0 |
| 185 | 4 | 0 | 0 | 0 | 0 | 0 | 0 | 3 | 0 | 0 | 0 | 0 | 0 | 0 | 4 | 0 | 0 | 0 | 0 | 0 | 0 | 4 | 0 | 0 | 0 | 0 | 0 | 0 | 4 | 0 | 0 | 0 | 0 | 0 | 0 |
| 186 | 4 | 0 | 0 | 0 | 0 | 0 | 0 | 3 | 0 | 0 | 0 | 0 | 0 | 0 | 4 | 0 | 0 | 0 | 0 | 0 | 0 | 4 | 0 | 0 | 0 | 0 | 0 | 0 | 4 | 0 | 0 | 0 | 0 | 0 | 0 |
| 187 | 4 | 0 | 0 | 0 | 0 | 0 | 0 | 3 | 0 | 0 | 0 | 0 | 0 | 0 | 4 | 0 | 0 | 0 | 0 | 0 | 0 | 4 | 0 | 0 | 0 | 0 | 0 | 0 | 4 | 0 | 0 | 0 | 0 | 0 | 0 |
| 188 | 3 | 0 | 0 | 0 | 0 | 0 | 3 | 3 | 0 | 0 | 0 | 0 | 0 | 3 | 3 | 0 | 0 | 0 | 0 | 0 | 3 | 3 | 0 | 0 | 0 | 0 | 0 | 3 | 4 | 0 | 0 | 0 | 0 | 0 | 4 |
| 189 | 4 | 0 | 4 | 0 | 0 | 0 | 0 | 2 | 0 | 2 | 0 | 0 | 0 | 0 | 4 | 0 | 4 | 0 | 0 | 0 | 0 | 4 | 0 | 4 | 0 | 0 | 0 | 0 | 4 | 0 | 4 | 0 | 0 | 0 | 0 |
| 190 | 3 | 0 | 3 | 0 | 0 | 0 | 3 | 1 | 0 | 1 | 0 | 0 | 0 | 1 | 2 | 0 | 2 | 0 | 0 | 0 | 2 | 2 | 0 | 2 | 0 | 0 | 0 | 2 | 1 | 0 | 1 | 0 | 0 | 0 | 1 |
| 191 | 4 | 0 | 4 | 0 | 0 | 0 | 0 | 4 | 0 | 4 | 0 | 0 | 0 | 0 | 4 | 0 | 4 | 0 | 0 | 0 | 4 | 4 | 0 | 4 | 0 | 0 | 0 | 4 | 1 | 0 | 1 | 0 | 0 | 0 | 1 |
| 192 | 3 | 3 | 3 | 3 | 3 | 3 | 3 | 1 | 1 | 1 | 1 | 1 | 1 | 1 | 1 | 1 | 1 | 1 | 1 | 1 | 1 | 1 | 1 | 1 | 1 | 1 | 1 | 1 | 1 | 1 | 1 | 1 | 1 | 1 | 1 |
| 193 | 3 | 3 | 3 | 3 | 0 | 3 | 0 | 2 | 2 | 2 | 2 | 0 | 2 | 0 | 2 | 2 | 2 | 2 | 0 | 2 | 0 | 2 | 2 | 2 | 2 | 0 | 2 | 0 | 1 | 1 | 1 | 1 | 0 | 1 | 0 |
| 194 | 1 | 1 | 1 | 1 | 0 | 1 | 0 | 1 | 1 | 1 | 1 | 0 | 1 | 0 | 2 | 2 | 2 | 2 | 0 | 2 | 0 | 2 | 2 | 2 | 2 | 0 | 2 | 0 | 1 | 1 | 1 | 1 | 0 | 1 | 0 |
| 195 | 2 | 2 | 2 | 2 | 0 | 2 | 0 | 1 | 1 | 1 | 1 | 0 | 1 | 0 | 1 | 1 | 1 | 1 | 0 | 1 | 0 | 1 | 1 | 1 | 1 | 0 | 1 | 0 | 1 | 1 | 1 | 1 | 0 | 1 | 0 |
| 196 | 3 | 3 | 3 | 3 | 3 | 3 | 3 | 3 | 3 | 3 | 3 | 3 | 3 | 3 | 2 | 2 | 2 | 2 | 2 | 2 | 2 | 2 | 2 | 2 | 2 | 2 | 2 | 2 | 2 | 2 | 2 | 2 | 2 | 2 | 2 |
| 197 | 1 | 1 | 1 | 2 | 2 | 2 | 2 | 1 | 1 | 1 | 2 | 2 | 2 | 2 | 1 | 1 | 1 | 1 | 1 | 1 | 2 | 1 | 1 | 1 | 1 | 1 | 1 | 2 | 1 | 1 | 1 | 1 | 1 | 1 | 2 |
| 198 | 4 | 2 | 0 | 4 | 2 | 4 | 4 | 3 | 2 | 0 | 3 | 2 | 3 | 3 | 1 | 1 | 0 | 1 | 1 | 1 | 1 | 1 | 1 | 0 | 1 | 1 | 1 | 1 | 1 | 1 | 0 | 1 | 1 | 1 | 1 |
| 199 | 3 | 3 | 0 | 3 | 2 | 3 | 3 | 1 | 1 | 0 | 1 | 1 | 1 | 1 | 1 | 1 | 0 | 1 | 1 | 1 | 1 | 1 | 1 | 0 | 1 | 1 | 1 | 1 | 1 | 1 | 0 | 1 | 1 | 1 | 1 |
| 200 | 2 | 2 | 0 | 2 | 0 | 2 | 0 | 3 | 3 | 0 | 3 | 0 | 3 | 0 | 1 | 1 | 0 | 1 | 0 | 1 | 0 | 1 | 1 | 0 | 1 | 0 | 1 | 0 | 1 | 1 | 0 | 1 | 0 | 1 | 0 |
| 201 | 2 | 2 | 0 | 2 | 0 | 2 | 0 | 3 | 3 | 0 | 3 | 0 | 3 | 0 | 1 | 1 | 0 | 1 | 0 | 1 | 0 | 1 | 1 | 0 | 1 | 0 | 1 | 0 | 1 | 1 | 0 | 1 | 0 | 1 | 0 |
| 202 | 2 | 2 | 0 | 2 | 0 | 2 | 2 | 2 | 2 | 0 | 2 | 0 | 2 | 2 | 1 | 1 | 0 | 1 | 0 | 1 | 1 | 1 | 1 | 0 | 1 | 0 | 1 | 1 | 1 | 1 | 0 | 1 | 0 | 1 | 1 |
| 203 | 2 | 2 | 0 | 2 | 0 | 2 | 2 | 2 | 2 | 0 | 2 | 0 | 2 | 2 | 1 | 1 | 0 | 1 | 0 | 1 | 1 | 1 | 1 | 0 | 1 | 0 | 1 | 1 | 1 | 1 | 0 | 1 | 0 | 1 | 1 |
| 204 | 3 | 3 | 0 | 3 | 2 | 3 | 3 | 4 | 4 | 0 | 4 | 4 | 4 | 4 | 1 | 1 | 0 | 1 | 1 | 1 | 1 | 1 | 1 | 0 | 1 | 1 | 1 | 1 | 1 | 1 | 0 | 1 | 1 | 1 | 1 |
| 205 | 3 | 3 | 0 | 3 | 2 | 3 | 3 | 4 | 4 | 0 | 4 | 4 | 4 | 4 | 1 | 1 | 0 | 1 | 1 | 1 | 1 | 1 | 1 | 0 | 1 | 1 | 1 | 1 | 1 | 1 | 0 | 1 | 1 | 1 | 1 |
| 206 | 4 | 3 | 0 | 3 | 2 | 3 | 3 | 3 | 3 | 0 | 3 | 2 | 3 | 3 | 1 | 1 | 0 | 1 | 1 | 1 | 1 | 1 | 1 | 0 | 1 | 1 | 1 | 1 | 1 | 1 | 0 | 1 | 1 | 1 | 1 |
| 207 | 1 | 2 | 0 | 0 | 0 | 0 | 0 | 3 | 3 | 0 | 0 | 0 | 0 | 0 | 4 | 4 | 0 | 0 | 0 | 0 | 0 | 4 | 4 | 0 | 0 | 0 | 0 | 0 | 4 | 4 | 0 | 0 | 0 | 0 | 0 |
| 208 | 1 | 1 | 0 | 1 | 1 | 1 | 0 | 3 | 3 | 0 | 3 | 3 | 3 | 0 | 2 | 2 | 0 | 2 | 2 | 2 | 0 | 1 | 1 | 0 | 1 | 1 | 1 | 0 | 1 | 1 | 0 | 1 | 1 | 1 | 0 |
| 209 | 1 | 1 | 1 | 1 | 0 | 1 | 0 | 2 | 2 | 2 | 2 | 0 | 2 | 0 | 1 | 1 | 1 | 1 | 0 | 1 | 0 | 1 | 1 | 1 | 1 | 0 | 1 | 0 | 1 | 1 | 1 | 1 | 0 | 1 | 0 |
| 210 | 3 | 1 | 0 | 0 | 3 | 0 | 4 | 2 | 1 | 0 | 0 | 2 | 0 | 2 | 2 | 1 | 0 | 0 | 2 | 0 | 2 | 1 | 1 | 0 | 0 | 1 | 0 | 1 | 1 | 1 | 0 | 0 | 1 | 0 | 1 |
| 211 | 1 | 2 | 0 | 0 | 0 | 0 | 3 | 1 | 2 | 0 | 0 | 0 | 0 | 2 | 3 | 3 | 0 | 0 | 0 | 0 | 3 | 2 | 2 | 0 | 0 | 0 | 0 | 2 | 2 | 2 | 0 | 0 | 0 | 0 | 2 |
| 212 | 0 | 0 | 0 | 0 | 0 | 0 | 0 | 0 | 0 | 0 | 0 | 0 | 0 | 0 | 0 | 0 | 0 | 0 | 0 | 0 | 0 | 0 | 0 | 0 | 0 | 0 | 0 | 0 | 0 | 0 | 0 | 0 | 0 | 0 | 0 |
| 213 | 1 | 3 | 0 | 0 | 0 | 0 | 0 | 3 | 3 | 0 | 0 | 0 | 0 | 0 | 4 | 3 | 0 | 0 | 0 | 0 | 0 | 3 | 3 | 0 | 0 | 0 | 0 | 0 | 3 | 3 | 0 | 0 | 0 | 0 | 0 |
| 214 | 3 | 1 | 0 | 3 | 3 | 3 | 3 | 2 | 1 | 0 | 2 | 2 | 2 | 2 | 1 | 1 | 0 | 1 | 1 | 1 | 1 | 1 | 1 | 0 | 1 | 1 | 1 | 1 | 1 | 1 | 0 | 1 | 1 | 1 | 1 |
| 215 | 3 | 4 | 0 | 3 | 0 | 3 | 4 | 3 | 3 | 0 | 3 | 0 | 3 | 3 | 4 | 4 | 0 | 4 | 0 | 4 | 4 | 3 | 3 | 0 | 3 | 0 | 3 | 3 | 1 | 1 | 0 | 1 | 0 | 1 | 1 |
| 216 | 1 | 1 | 0 | 0 | 0 | 0 | 0 | 1 | 1 | 0 | 0 | 0 | 0 | 0 | 2 | 2 | 0 | 0 | 0 | 0 | 0 | 1 | 1 | 0 | 0 | 0 | 0 | 0 | 1 | 1 | 0 | 0 | 0 | 0 | 0 |
| 217 | 2 | 3 | 0 | 3 | 3 | 3 | 0 | 2 | 2 | 0 | 2 | 2 | 2 | 0 | 3 | 3 | 0 | 3 | 3 | 3 | 0 | 4 | 4 | 0 | 4 | 4 | 4 | 0 | 3 | 3 | 0 | 3 | 3 | 3 | 0 |
Source: generated by the authors based on the respondents’ completed questionnaire.
Table A5.
The list of vulnerabilities impacts per respondent.
| Governance Risks | Operational Risks | Human Resources Risks | Financial Risks | ICT Risks | Capital Adequacy Risks | Financial Crime Risks | Governance Risks | Operational Risks | Human Resources Risks | Financial Risks | ICT Risks | Capital Adequacy Risks | Financial Crime Risks | Governance Risks | Operational Risks | Human Resources Risks | Financial Risks | ICT Risks | Capital Adequacy Risks | Financial Crime Risks | Governance Risks | Operational Risks | Human Resources Risks | Financial Risks | ICT Risks | Capital Adequacy Risks | Financial Crime Risks | Governance Risks | Operational Risks | Human Resources Risks | Financial Risks | ICT Risks | Capital Adequacy Risks | Financial Crime Risks | |
|---|---|---|---|---|---|---|---|---|---|---|---|---|---|---|---|---|---|---|---|---|---|---|---|---|---|---|---|---|---|---|---|---|---|---|---|
| Respondent 1 | Respondent 2 | Respondent 3 | Respondent 4 | Respondent 5 | |||||||||||||||||||||||||||||||
| 1 | 3 | 0 | 0 | 0 | 0 | 0 | 0 | 3 | 0 | 0 | 0 | 0 | 0 | 0 | 3 | 0 | 0 | 0 | 0 | 0 | 0 | 3 | 0 | 0 | 0 | 0 | 0 | 0 | 3 | 0 | 0 | 0 | 0 | 0 | 0 |
| 2 | 3 | 3 | 0 | 0 | 4 | 0 | 0 | 3 | 3 | 0 | 0 | 4 | 0 | 0 | 3 | 3 | 0 | 0 | 4 | 0 | 0 | 3 | 3 | 0 | 0 | 4 | 0 | 0 | 3 | 3 | 0 | 0 | 4 | 0 | 0 |
| 3 | 3 | 0 | 0 | 0 | 0 | 0 | 0 | 3 | 0 | 0 | 0 | 0 | 0 | 0 | 3 | 0 | 0 | 0 | 0 | 0 | 0 | 3 | 0 | 0 | 0 | 0 | 0 | 0 | 3 | 0 | 0 | 0 | 0 | 0 | 0 |
| 4 | 3 | 0 | 0 | 0 | 0 | 0 | 0 | 3 | 0 | 0 | 0 | 0 | 0 | 0 | 3 | 0 | 0 | 0 | 0 | 0 | 0 | 3 | 0 | 0 | 0 | 0 | 0 | 0 | 3 | 0 | 0 | 0 | 0 | 0 | 0 |
| 5 | 3 | 0 | 3 | 0 | 0 | 0 | 0 | 3 | 0 | 3 | 0 | 0 | 0 | 0 | 3 | 0 | 3 | 0 | 0 | 0 | 0 | 3 | 0 | 3 | 0 | 0 | 0 | 0 | 3 | 0 | 3 | 0 | 0 | 0 | 0 |
| 6 | 3 | 3 | 3 | 4 | 4 | 4 | 4 | 3 | 3 | 3 | 4 | 4 | 4 | 4 | 3 | 3 | 3 | 4 | 4 | 4 | 4 | 3 | 3 | 3 | 4 | 4 | 4 | 4 | 3 | 3 | 3 | 4 | 4 | 4 | 4 |
| 7 | 3 | 0 | 0 | 0 | 0 | 0 | 0 | 3 | 0 | 0 | 0 | 0 | 0 | 0 | 3 | 0 | 0 | 0 | 0 | 0 | 0 | 3 | 0 | 0 | 0 | 0 | 0 | 0 | 3 | 0 | 0 | 0 | 0 | 0 | 0 |
| 8 | 3 | 3 | 0 | 4 | 0 | 4 | 4 | 3 | 3 | 0 | 4 | 0 | 4 | 4 | 3 | 3 | 0 | 4 | 0 | 4 | 4 | 3 | 3 | 0 | 4 | 0 | 4 | 4 | 3 | 3 | 0 | 4 | 0 | 4 | 4 |
| 9 | 3 | 3 | 3 | 0 | 4 | 0 | 4 | 3 | 3 | 3 | 0 | 4 | 0 | 4 | 3 | 3 | 3 | 0 | 4 | 0 | 4 | 3 | 3 | 3 | 0 | 4 | 0 | 4 | 3 | 3 | 3 | 0 | 4 | 0 | 4 |
| 10 | 3 | 3 | 3 | 0 | 0 | 0 | 0 | 3 | 3 | 3 | 0 | 0 | 0 | 0 | 3 | 3 | 3 | 0 | 0 | 0 | 0 | 3 | 3 | 3 | 0 | 0 | 0 | 0 | 3 | 3 | 3 | 0 | 0 | 0 | 0 |
| 11 | 0 | 3 | 3 | 0 | 4 | 0 | 4 | 0 | 3 | 3 | 0 | 4 | 0 | 4 | 0 | 3 | 3 | 0 | 4 | 0 | 4 | 0 | 3 | 3 | 0 | 4 | 0 | 4 | 0 | 3 | 3 | 0 | 4 | 0 | 4 |
| 12 | 0 | 3 | 3 | 0 | 4 | 0 | 4 | 0 | 3 | 3 | 0 | 4 | 0 | 4 | 0 | 3 | 3 | 0 | 4 | 0 | 4 | 0 | 3 | 3 | 0 | 4 | 0 | 4 | 0 | 3 | 3 | 0 | 4 | 0 | 4 |
| 13 | 3 | 0 | 0 | 0 | 4 | 0 | 0 | 3 | 0 | 0 | 0 | 4 | 0 | 0 | 3 | 0 | 0 | 0 | 4 | 0 | 0 | 3 | 0 | 0 | 0 | 4 | 0 | 0 | 3 | 0 | 0 | 0 | 4 | 0 | 0 |
| 14 | 3 | 3 | 3 | 4 | 4 | 4 | 4 | 3 | 3 | 3 | 4 | 4 | 4 | 4 | 3 | 3 | 3 | 4 | 4 | 4 | 4 | 3 | 3 | 3 | 4 | 4 | 4 | 4 | 3 | 3 | 3 | 4 | 4 | 4 | 4 |
| 15 | 3 | 3 | 3 | 4 | 4 | 4 | 4 | 3 | 3 | 3 | 4 | 4 | 4 | 4 | 3 | 3 | 3 | 4 | 4 | 4 | 4 | 3 | 3 | 3 | 4 | 4 | 4 | 4 | 3 | 3 | 3 | 4 | 4 | 4 | 4 |
| 16 | 0 | 3 | 0 | 0 | 4 | 0 | 0 | 0 | 3 | 0 | 0 | 4 | 0 | 0 | 0 | 3 | 0 | 0 | 4 | 0 | 0 | 0 | 3 | 0 | 0 | 4 | 0 | 0 | 0 | 3 | 0 | 0 | 4 | 0 | 0 |
| 17 | 0 | 3 | 0 | 0 | 4 | 0 | 0 | 0 | 3 | 0 | 0 | 4 | 0 | 0 | 0 | 3 | 0 | 0 | 4 | 0 | 0 | 0 | 3 | 0 | 0 | 4 | 0 | 0 | 0 | 3 | 0 | 0 | 4 | 0 | 0 |
| 18 | 0 | 3 | 0 | 4 | 0 | 4 | 0 | 0 | 3 | 0 | 4 | 0 | 4 | 0 | 0 | 3 | 0 | 4 | 0 | 4 | 0 | 0 | 3 | 0 | 4 | 0 | 4 | 0 | 0 | 3 | 0 | 4 | 0 | 4 | 0 |
| 19 | 0 | 3 | 0 | 4 | 4 | 0 | 4 | 0 | 3 | 0 | 4 | 4 | 0 | 4 | 0 | 3 | 0 | 4 | 4 | 0 | 4 | 0 | 3 | 0 | 4 | 4 | 0 | 4 | 0 | 3 | 0 | 4 | 4 | 0 | 4 |
| 20 | 3 | 3 | 3 | 4 | 4 | 0 | 0 | 3 | 3 | 3 | 4 | 4 | 0 | 0 | 3 | 3 | 3 | 4 | 4 | 0 | 0 | 3 | 3 | 3 | 4 | 4 | 0 | 0 | 3 | 3 | 3 | 4 | 4 | 0 | 0 |
| 21 | 3 | 3 | 3 | 4 | 4 | 4 | 4 | 3 | 3 | 3 | 4 | 4 | 4 | 4 | 3 | 3 | 3 | 4 | 4 | 4 | 4 | 3 | 3 | 3 | 4 | 4 | 4 | 4 | 3 | 3 | 3 | 4 | 4 | 4 | 4 |
| 22 | 0 | 3 | 0 | 0 | 4 | 0 | 0 | 0 | 3 | 0 | 0 | 4 | 0 | 0 | 0 | 3 | 0 | 0 | 4 | 0 | 0 | 0 | 3 | 0 | 0 | 4 | 0 | 0 | 0 | 3 | 0 | 0 | 4 | 0 | 0 |
| 23 | 0 | 3 | 3 | 0 | 4 | 0 | 0 | 0 | 3 | 3 | 0 | 4 | 0 | 0 | 0 | 3 | 3 | 0 | 4 | 0 | 0 | 0 | 3 | 3 | 0 | 4 | 0 | 0 | 0 | 3 | 3 | 0 | 4 | 0 | 0 |
| 24 | 0 | 3 | 0 | 0 | 4 | 0 | 0 | 0 | 3 | 0 | 0 | 4 | 0 | 0 | 0 | 3 | 0 | 0 | 4 | 0 | 0 | 0 | 3 | 0 | 0 | 4 | 0 | 0 | 0 | 3 | 0 | 0 | 4 | 0 | 0 |
| 25 | 3 | 3 | 0 | 4 | 4 | 4 | 4 | 3 | 3 | 0 | 4 | 4 | 4 | 4 | 3 | 3 | 0 | 4 | 4 | 4 | 4 | 3 | 3 | 0 | 4 | 4 | 4 | 4 | 3 | 3 | 0 | 4 | 4 | 4 | 4 |
| 26 | 0 | 3 | 0 | 0 | 4 | 0 | 0 | 0 | 3 | 0 | 0 | 4 | 0 | 0 | 0 | 3 | 0 | 0 | 4 | 0 | 0 | 0 | 3 | 0 | 0 | 4 | 0 | 0 | 0 | 3 | 0 | 0 | 4 | 0 | 0 |
| 27 | 0 | 0 | 0 | 0 | 4 | 0 | 0 | 0 | 0 | 0 | 0 | 4 | 0 | 0 | 0 | 0 | 0 | 0 | 4 | 0 | 0 | 0 | 0 | 0 | 0 | 4 | 0 | 0 | 0 | 0 | 0 | 0 | 4 | 0 | 0 |
| 28 | 0 | 0 | 3 | 0 | 4 | 0 | 0 | 0 | 0 | 3 | 0 | 4 | 0 | 0 | 0 | 0 | 3 | 0 | 4 | 0 | 0 | 0 | 0 | 3 | 0 | 4 | 0 | 0 | 0 | 0 | 3 | 0 | 4 | 0 | 0 |
| 29 | 0 | 3 | 0 | 4 | 4 | 0 | 4 | 0 | 3 | 0 | 4 | 4 | 0 | 4 | 0 | 3 | 0 | 4 | 4 | 0 | 4 | 0 | 3 | 0 | 4 | 4 | 0 | 4 | 0 | 3 | 0 | 4 | 4 | 0 | 4 |
| 30 | 0 | 0 | 0 | 0 | 4 | 0 | 0 | 0 | 0 | 0 | 0 | 4 | 0 | 0 | 0 | 0 | 0 | 0 | 4 | 0 | 0 | 0 | 0 | 0 | 0 | 4 | 0 | 0 | 0 | 0 | 0 | 0 | 4 | 0 | 0 |
| 31 | 0 | 0 | 0 | 0 | 4 | 0 | 0 | 0 | 0 | 0 | 0 | 4 | 0 | 0 | 0 | 0 | 0 | 0 | 4 | 0 | 0 | 0 | 0 | 0 | 0 | 4 | 0 | 0 | 0 | 0 | 0 | 0 | 4 | 0 | 0 |
| 32 | 0 | 0 | 3 | 0 | 4 | 0 | 0 | 0 | 0 | 3 | 0 | 4 | 0 | 0 | 0 | 0 | 3 | 0 | 4 | 0 | 0 | 0 | 0 | 3 | 0 | 4 | 0 | 0 | 0 | 0 | 3 | 0 | 4 | 0 | 0 |
| 33 | 0 | 0 | 3 | 0 | 4 | 0 | 0 | 0 | 0 | 3 | 0 | 4 | 0 | 0 | 0 | 0 | 3 | 0 | 4 | 0 | 0 | 0 | 0 | 3 | 0 | 4 | 0 | 0 | 0 | 0 | 3 | 0 | 4 | 0 | 0 |
| 34 | 0 | 0 | 0 | 0 | 4 | 0 | 0 | 0 | 0 | 0 | 0 | 4 | 0 | 0 | 0 | 0 | 0 | 0 | 4 | 0 | 0 | 0 | 0 | 0 | 0 | 4 | 0 | 0 | 0 | 0 | 0 | 0 | 4 | 0 | 0 |
| 35 | 0 | 0 | 0 | 0 | 4 | 0 | 0 | 0 | 0 | 0 | 0 | 4 | 0 | 0 | 0 | 0 | 0 | 0 | 4 | 0 | 0 | 0 | 0 | 0 | 0 | 4 | 0 | 0 | 0 | 0 | 0 | 0 | 4 | 0 | 0 |
| 36 | 0 | 0 | 0 | 0 | 4 | 0 | 0 | 0 | 0 | 0 | 0 | 4 | 0 | 0 | 0 | 0 | 0 | 0 | 4 | 0 | 0 | 0 | 0 | 0 | 0 | 4 | 0 | 0 | 0 | 0 | 0 | 0 | 4 | 0 | 0 |
| 37 | 0 | 3 | 0 | 0 | 4 | 0 | 4 | 0 | 3 | 0 | 0 | 4 | 0 | 4 | 0 | 3 | 0 | 0 | 4 | 0 | 4 | 0 | 3 | 0 | 0 | 4 | 0 | 4 | 0 | 3 | 0 | 0 | 4 | 0 | 4 |
| 38 | 0 | 3 | 3 | 4 | 4 | 0 | 4 | 0 | 3 | 3 | 4 | 4 | 0 | 4 | 0 | 3 | 3 | 4 | 4 | 0 | 4 | 0 | 3 | 3 | 4 | 4 | 0 | 4 | 0 | 3 | 3 | 4 | 4 | 0 | 4 |
| 39 | 0 | 0 | 0 | 0 | 4 | 0 | 0 | 0 | 0 | 0 | 0 | 4 | 0 | 0 | 0 | 0 | 0 | 0 | 4 | 0 | 0 | 0 | 0 | 0 | 0 | 4 | 0 | 0 | 0 | 0 | 0 | 0 | 4 | 0 | 0 |
| 40 | 0 | 3 | 0 | 0 | 4 | 0 | 0 | 0 | 3 | 0 | 0 | 4 | 0 | 0 | 0 | 3 | 0 | 0 | 4 | 0 | 0 | 0 | 3 | 0 | 0 | 4 | 0 | 0 | 0 | 3 | 0 | 0 | 4 | 0 | 0 |
| 41 | 0 | 3 | 0 | 0 | 4 | 0 | 0 | 0 | 3 | 0 | 0 | 4 | 0 | 0 | 0 | 3 | 0 | 0 | 4 | 0 | 0 | 0 | 3 | 0 | 0 | 4 | 0 | 0 | 0 | 3 | 0 | 0 | 4 | 0 | 0 |
| 42 | 3 | 3 | 0 | 4 | 4 | 0 | 4 | 3 | 3 | 0 | 4 | 4 | 0 | 4 | 3 | 3 | 0 | 4 | 4 | 0 | 4 | 3 | 3 | 0 | 4 | 4 | 0 | 4 | 3 | 3 | 0 | 4 | 4 | 0 | 4 |
| 43 | 0 | 3 | 0 | 4 | 4 | 0 | 4 | 0 | 3 | 0 | 4 | 4 | 0 | 4 | 0 | 3 | 0 | 4 | 4 | 0 | 4 | 0 | 3 | 0 | 4 | 4 | 0 | 4 | 0 | 3 | 0 | 4 | 4 | 0 | 4 |
| 44 | 0 | 0 | 0 | 0 | 4 | 0 | 0 | 0 | 0 | 0 | 0 | 4 | 0 | 0 | 0 | 0 | 0 | 0 | 4 | 0 | 0 | 0 | 0 | 0 | 0 | 4 | 0 | 0 | 0 | 0 | 0 | 0 | 4 | 0 | 0 |
| 45 | 0 | 3 | 0 | 4 | 4 | 4 | 4 | 0 | 3 | 0 | 4 | 4 | 4 | 4 | 0 | 3 | 0 | 4 | 4 | 4 | 4 | 0 | 3 | 0 | 4 | 4 | 4 | 4 | 0 | 3 | 0 | 4 | 4 | 4 | 4 |
| 46 | 0 | 0 | 0 | 4 | 4 | 0 | 0 | 0 | 0 | 0 | 4 | 4 | 0 | 0 | 0 | 0 | 0 | 4 | 4 | 0 | 0 | 0 | 0 | 0 | 4 | 4 | 0 | 0 | 0 | 0 | 0 | 4 | 4 | 0 | 0 |
| 47 | 0 | 3 | 0 | 4 | 4 | 4 | 4 | 0 | 3 | 0 | 4 | 4 | 4 | 4 | 0 | 3 | 0 | 4 | 4 | 4 | 4 | 0 | 3 | 0 | 4 | 4 | 4 | 4 | 0 | 3 | 0 | 4 | 4 | 4 | 4 |
| 48 | 0 | 3 | 0 | 4 | 4 | 0 | 4 | 0 | 3 | 0 | 4 | 4 | 0 | 4 | 0 | 3 | 0 | 4 | 4 | 0 | 4 | 0 | 3 | 0 | 4 | 4 | 0 | 4 | 0 | 3 | 0 | 4 | 4 | 0 | 4 |
| 49 | 0 | 3 | 0 | 0 | 4 | 0 | 0 | 0 | 3 | 0 | 0 | 4 | 0 | 0 | 0 | 3 | 0 | 0 | 4 | 0 | 0 | 0 | 3 | 0 | 0 | 4 | 0 | 0 | 0 | 3 | 0 | 0 | 4 | 0 | 0 |
| 50 | 0 | 0 | 3 | 0 | 0 | 0 | 4 | 0 | 0 | 3 | 0 | 0 | 0 | 4 | 0 | 0 | 3 | 0 | 0 | 0 | 4 | 0 | 0 | 3 | 0 | 0 | 0 | 4 | 0 | 0 | 3 | 0 | 0 | 0 | 4 |
| 51 | 0 | 3 | 3 | 4 | 0 | 4 | 4 | 0 | 3 | 3 | 4 | 0 | 4 | 4 | 0 | 3 | 3 | 4 | 0 | 4 | 4 | 0 | 3 | 3 | 4 | 0 | 4 | 4 | 0 | 3 | 3 | 4 | 0 | 4 | 4 |
| 52 | 3 | 3 | 3 | 4 | 4 | 4 | 4 | 3 | 3 | 3 | 4 | 4 | 4 | 4 | 3 | 3 | 3 | 4 | 4 | 4 | 4 | 3 | 3 | 3 | 4 | 4 | 4 | 4 | 3 | 3 | 3 | 4 | 4 | 4 | 4 |
| 53 | 0 | 3 | 0 | 4 | 0 | 0 | 4 | 0 | 3 | 0 | 4 | 0 | 0 | 4 | 0 | 3 | 0 | 4 | 0 | 0 | 4 | 0 | 3 | 0 | 4 | 0 | 0 | 4 | 0 | 3 | 0 | 4 | 0 | 0 | 4 |
| 54 | 3 | 3 | 3 | 4 | 4 | 4 | 4 | 3 | 3 | 3 | 4 | 4 | 4 | 4 | 3 | 3 | 3 | 4 | 4 | 4 | 4 | 3 | 3 | 3 | 4 | 4 | 4 | 4 | 3 | 3 | 3 | 4 | 4 | 4 | 4 |
| 55 | 3 | 3 | 3 | 4 | 4 | 4 | 4 | 3 | 3 | 3 | 4 | 4 | 4 | 4 | 3 | 3 | 3 | 4 | 4 | 4 | 4 | 3 | 3 | 3 | 4 | 4 | 4 | 4 | 3 | 3 | 3 | 4 | 4 | 4 | 4 |
| 56 | 3 | 3 | 3 | 4 | 4 | 4 | 4 | 3 | 3 | 3 | 4 | 4 | 4 | 4 | 3 | 3 | 3 | 4 | 4 | 4 | 4 | 3 | 3 | 3 | 4 | 4 | 4 | 4 | 3 | 3 | 3 | 4 | 4 | 4 | 4 |
| 57 | 0 | 0 | 3 | 0 | 0 | 0 | 0 | 0 | 0 | 3 | 0 | 0 | 0 | 0 | 0 | 0 | 3 | 0 | 0 | 0 | 0 | 0 | 0 | 3 | 0 | 0 | 0 | 0 | 0 | 0 | 3 | 0 | 0 | 0 | 0 |
| 58 | 0 | 0 | 0 | 0 | 0 | 0 | 0 | 0 | 0 | 0 | 0 | 0 | 0 | 0 | 0 | 0 | 0 | 0 | 0 | 0 | 0 | 0 | 0 | 0 | 0 | 0 | 0 | 0 | 0 | 0 | 0 | 0 | 0 | 0 | 0 |
| 59 | 0 | 0 | 0 | 0 | 0 | 0 | 0 | 0 | 0 | 0 | 0 | 0 | 0 | 0 | 0 | 0 | 0 | 0 | 0 | 0 | 0 | 0 | 0 | 0 | 0 | 0 | 0 | 0 | 0 | 0 | 0 | 0 | 0 | 0 | 0 |
| 60 | 0 | 3 | 0 | 0 | 0 | 0 | 0 | 0 | 3 | 0 | 0 | 0 | 0 | 0 | 0 | 3 | 0 | 0 | 0 | 0 | 0 | 0 | 3 | 0 | 0 | 0 | 0 | 0 | 0 | 3 | 0 | 0 | 0 | 0 | 0 |
| 61 | 0 | 0 | 0 | 0 | 0 | 0 | 0 | 0 | 0 | 0 | 0 | 0 | 0 | 0 | 0 | 0 | 0 | 0 | 0 | 0 | 0 | 0 | 0 | 0 | 0 | 0 | 0 | 0 | 0 | 0 | 0 | 0 | 0 | 0 | 0 |
| 62 | 0 | 0 | 0 | 0 | 4 | 0 | 0 | 0 | 0 | 0 | 0 | 4 | 0 | 0 | 0 | 0 | 0 | 0 | 4 | 0 | 0 | 0 | 0 | 0 | 0 | 4 | 0 | 0 | 0 | 0 | 0 | 0 | 4 | 0 | 0 |
| 63 | 0 | 3 | 0 | 4 | 0 | 4 | 0 | 0 | 3 | 0 | 4 | 0 | 4 | 0 | 0 | 3 | 0 | 4 | 0 | 4 | 0 | 0 | 3 | 0 | 4 | 0 | 4 | 0 | 0 | 3 | 0 | 4 | 0 | 4 | 0 |
| 64 | 0 | 0 | 0 | 4 | 0 | 0 | 0 | 0 | 0 | 0 | 4 | 0 | 0 | 0 | 0 | 0 | 0 | 4 | 0 | 0 | 0 | 0 | 0 | 0 | 4 | 0 | 0 | 0 | 0 | 0 | 0 | 4 | 0 | 0 | 0 |
| 65 | 0 | 0 | 0 | 4 | 0 | 0 | 0 | 0 | 0 | 0 | 4 | 0 | 0 | 0 | 0 | 0 | 0 | 4 | 0 | 0 | 0 | 0 | 0 | 0 | 4 | 0 | 0 | 0 | 0 | 0 | 0 | 4 | 0 | 0 | 0 |
| 66 | 0 | 3 | 0 | 4 | 0 | 4 | 0 | 0 | 3 | 0 | 4 | 0 | 4 | 0 | 0 | 3 | 0 | 4 | 0 | 4 | 0 | 0 | 3 | 0 | 4 | 0 | 4 | 0 | 0 | 3 | 0 | 4 | 0 | 4 | 0 |
| 67 | 0 | 0 | 0 | 4 | 0 | 4 | 0 | 0 | 0 | 0 | 4 | 0 | 4 | 0 | 0 | 0 | 0 | 4 | 0 | 4 | 0 | 0 | 0 | 0 | 4 | 0 | 4 | 0 | 0 | 0 | 0 | 4 | 0 | 4 | 0 |
| 68 | 0 | 3 | 0 | 4 | 4 | 0 | 4 | 0 | 3 | 0 | 4 | 4 | 0 | 4 | 0 | 3 | 0 | 4 | 4 | 0 | 4 | 0 | 3 | 0 | 4 | 4 | 0 | 4 | 0 | 3 | 0 | 4 | 4 | 0 | 4 |
| 69 | 0 | 3 | 0 | 4 | 0 | 4 | 0 | 0 | 3 | 0 | 4 | 0 | 4 | 0 | 0 | 3 | 0 | 4 | 0 | 4 | 0 | 0 | 3 | 0 | 4 | 0 | 4 | 0 | 0 | 3 | 0 | 4 | 0 | 4 | 0 |
| 70 | 3 | 3 | 3 | 4 | 4 | 4 | 4 | 3 | 3 | 3 | 4 | 4 | 4 | 4 | 3 | 3 | 3 | 4 | 4 | 4 | 4 | 3 | 3 | 3 | 4 | 4 | 4 | 4 | 3 | 3 | 3 | 4 | 4 | 4 | 4 |
| 71 | 0 | 3 | 0 | 0 | 0 | 4 | 0 | 0 | 3 | 0 | 0 | 0 | 4 | 0 | 0 | 3 | 0 | 0 | 0 | 4 | 0 | 0 | 3 | 0 | 0 | 0 | 4 | 0 | 0 | 3 | 0 | 0 | 0 | 4 | 0 |
| 72 | 3 | 3 | 0 | 4 | 0 | 4 | 0 | 3 | 3 | 0 | 4 | 0 | 4 | 0 | 3 | 3 | 0 | 4 | 0 | 4 | 0 | 3 | 3 | 0 | 4 | 0 | 4 | 0 | 3 | 3 | 0 | 4 | 0 | 4 | 0 |
| 73 | 3 | 3 | 0 | 4 | 0 | 4 | 0 | 3 | 3 | 0 | 4 | 0 | 4 | 0 | 3 | 3 | 0 | 4 | 0 | 4 | 0 | 3 | 3 | 0 | 4 | 0 | 4 | 0 | 3 | 3 | 0 | 4 | 0 | 4 | 0 |
| 74 | 0 | 3 | 0 | 4 | 0 | 4 | 0 | 0 | 3 | 0 | 4 | 0 | 4 | 0 | 0 | 3 | 0 | 4 | 0 | 4 | 0 | 0 | 3 | 0 | 4 | 0 | 4 | 0 | 0 | 3 | 0 | 4 | 0 | 4 | 0 |
| 75 | 0 | 3 | 0 | 4 | 0 | 4 | 0 | 0 | 3 | 0 | 4 | 0 | 4 | 0 | 0 | 3 | 0 | 4 | 0 | 4 | 0 | 0 | 3 | 0 | 4 | 0 | 4 | 0 | 0 | 3 | 0 | 4 | 0 | 4 | 0 |
| 76 | 0 | 3 | 0 | 4 | 0 | 4 | 0 | 0 | 3 | 0 | 4 | 0 | 4 | 0 | 0 | 3 | 0 | 4 | 0 | 4 | 0 | 0 | 3 | 0 | 4 | 0 | 4 | 0 | 0 | 3 | 0 | 4 | 0 | 4 | 0 |
| 77 | 3 | 3 | 3 | 4 | 4 | 0 | 0 | 3 | 3 | 3 | 4 | 4 | 0 | 0 | 3 | 3 | 3 | 4 | 4 | 0 | 0 | 3 | 3 | 3 | 4 | 4 | 0 | 0 | 3 | 3 | 3 | 4 | 4 | 0 | 0 |
| 78 | 3 | 3 | 3 | 4 | 4 | 4 | 0 | 3 | 3 | 3 | 4 | 4 | 4 | 0 | 3 | 3 | 3 | 4 | 4 | 4 | 0 | 3 | 3 | 3 | 4 | 4 | 4 | 0 | 3 | 3 | 3 | 4 | 4 | 4 | 0 |
Source: generated by the authors.
Table A6.
The list of vulnerabilities likelihood per respondent.
| Governance Risks | Operational Risks | Human Resources Risks | Financial Risks | ICT Risks | Capital Adequacy Risks | Financial Crime Risks | Governance Risks | Operational Risks | Human Resources Risks | Financial Risks | ICT Risks | Capital Adequacy Risks | Financial Crime Risks | Governance Risks | Operational Risks | Human Resources Risks | Financial Risks | ICT Risks | Capital Adequacy Risks | Financial Crime Risks | Governance Risks | Operational Risks | Human Resources Risks | Financial Risks | ICT Risks | Capital Adequacy Risks | Financial Crime Risks | Governance Risks | Operational Risks | Human Resources Risks | Financial Risks | ICT Risks | Capital Adequacy Risks | Financial Crime Risks | |
|---|---|---|---|---|---|---|---|---|---|---|---|---|---|---|---|---|---|---|---|---|---|---|---|---|---|---|---|---|---|---|---|---|---|---|---|
| Respondent 1 | Respondent 2 | Respondent 3 | Respondent 4 | Respondent 5 | |||||||||||||||||||||||||||||||
| 1 | 4 | 0 | 0 | 0 | 0 | 0 | 0 | 3 | 0 | 0 | 0 | 0 | 0 | 0 | 4 | 0 | 0 | 0 | 0 | 0 | 0 | 4 | 0 | 0 | 0 | 0 | 0 | 0 | 3 | 0 | 0 | 0 | 0 | 0 | 0 |
| 2 | 4 | 4 | 0 | 0 | 3 | 0 | 0 | 5 | 5 | 0 | 0 | 4 | 0 | 0 | 1 | 1 | 0 | 0 | 3 | 0 | 0 | 1 | 1 | 0 | 0 | 3 | 0 | 0 | 1 | 1 | 0 | 0 | 2 | 0 | 0 |
| 3 | 4 | 0 | 0 | 0 | 0 | 0 | 0 | 3 | 0 | 0 | 0 | 0 | 0 | 0 | 4 | 0 | 0 | 0 | 0 | 0 | 0 | 4 | 0 | 0 | 0 | 0 | 0 | 0 | 2 | 0 | 0 | 0 | 0 | 0 | 0 |
| 4 | 3 | 0 | 0 | 0 | 0 | 0 | 0 | 1 | 0 | 0 | 0 | 0 | 0 | 0 | 2 | 0 | 0 | 0 | 0 | 0 | 0 | 2 | 0 | 0 | 0 | 0 | 0 | 0 | 2 | 0 | 0 | 0 | 0 | 0 | 0 |
| 5 | 4 | 0 | 4 | 0 | 0 | 0 | 0 | 2 | 0 | 2 | 0 | 0 | 0 | 0 | 3 | 0 | 3 | 0 | 0 | 0 | 0 | 3 | 0 | 3 | 0 | 0 | 0 | 0 | 2 | 0 | 2 | 0 | 0 | 0 | 0 |
| 6 | 4 | 2 | 3 | 2 | 2 | 3 | 3 | 2 | 2 | 3 | 2 | 2 | 2 | 3 | 5 | 3 | 2 | 4 | 3 | 3 | 3 | 5 | 3 | 2 | 4 | 3 | 3 | 3 | 3 | 2 | 2 | 3 | 2 | 2 | 1 |
| 7 | 4 | 0 | 0 | 0 | 0 | 0 | 0 | 1 | 0 | 0 | 0 | 0 | 0 | 0 | 2 | 0 | 0 | 0 | 0 | 0 | 0 | 2 | 0 | 0 | 0 | 0 | 0 | 0 | 1 | 0 | 0 | 0 | 0 | 0 | 0 |
| 8 | 1 | 1 | 0 | 1 | 0 | 1 | 2 | 1 | 1 | 0 | 1 | 0 | 1 | 2 | 3 | 4 | 0 | 3 | 0 | 3 | 3 | 3 | 4 | 0 | 3 | 0 | 3 | 3 | 2 | 1 | 0 | 2 | 0 | 2 | 1 |
| 9 | 4 | 4 | 4 | 0 | 3 | 0 | 3 | 2 | 2 | 2 | 0 | 2 | 0 | 3 | 3 | 3 | 4 | 0 | 3 | 0 | 4 | 3 | 3 | 4 | 0 | 3 | 0 | 4 | 2 | 2 | 2 | 0 | 2 | 0 | 1 |
| 10 | 4 | 3 | 3 | 0 | 0 | 0 | 0 | 3 | 3 | 3 | 0 | 0 | 0 | 0 | 4 | 4 | 4 | 0 | 0 | 0 | 0 | 4 | 4 | 4 | 0 | 0 | 0 | 0 | 2 | 2 | 2 | 0 | 0 | 0 | 0 |
| 11 | 0 | 4 | 4 | 0 | 3 | 0 | 2 | 0 | 3 | 3 | 0 | 3 | 0 | 3 | 0 | 3 | 3 | 0 | 3 | 0 | 3 | 0 | 3 | 3 | 0 | 3 | 0 | 3 | 0 | 2 | 2 | 0 | 2 | 0 | 1 |
| 12 | 0 | 2 | 2 | 0 | 2 | 0 | 2 | 0 | 2 | 2 | 0 | 2 | 0 | 3 | 0 | 3 | 3 | 0 | 4 | 0 | 3 | 0 | 3 | 3 | 0 | 4 | 0 | 3 | 0 | 3 | 3 | 0 | 3 | 0 | 1 |
| 13 | 1 | 0 | 0 | 0 | 2 | 0 | 0 | 2 | 0 | 0 | 0 | 2 | 0 | 0 | 1 | 0 | 0 | 0 | 1 | 0 | 0 | 1 | 0 | 0 | 0 | 1 | 0 | 0 | 1 | 0 | 0 | 0 | 1 | 0 | 0 |
| 14 | 2 | 3 | 3 | 2 | 2 | 2 | 3 | 3 | 3 | 3 | 2 | 4 | 2 | 4 | 3 | 3 | 3 | 3 | 4 | 3 | 3 | 3 | 3 | 3 | 3 | 4 | 3 | 3 | 2 | 2 | 2 | 2 | 2 | 2 | 1 |
| 15 | 3 | 3 | 3 | 2 | 2 | 2 | 2 | 2 | 2 | 2 | 2 | 2 | 2 | 2 | 3 | 2 | 2 | 2 | 2 | 2 | 3 | 3 | 2 | 2 | 2 | 2 | 2 | 3 | 2 | 2 | 2 | 2 | 2 | 2 | 1 |
| 16 | 0 | 2 | 0 | 0 | 2 | 0 | 0 | 0 | 3 | 0 | 0 | 3 | 0 | 0 | 0 | 1 | 0 | 0 | 1 | 0 | 0 | 0 | 1 | 0 | 0 | 1 | 0 | 0 | 0 | 1 | 0 | 0 | 1 | 0 | 0 |
| 17 | 0 | 3 | 0 | 0 | 3 | 0 | 0 | 0 | 4 | 0 | 0 | 4 | 0 | 0 | 0 | 1 | 0 | 0 | 1 | 0 | 0 | 0 | 1 | 0 | 0 | 1 | 0 | 0 | 0 | 1 | 0 | 0 | 1 | 0 | 0 |
| 18 | 0 | 3 | 0 | 3 | 0 | 3 | 0 | 0 | 2 | 0 | 1 | 0 | 1 | 0 | 0 | 4 | 0 | 4 | 0 | 4 | 0 | 0 | 4 | 0 | 4 | 0 | 4 | 0 | 0 | 3 | 0 | 3 | 0 | 3 | 0 |
| 19 | 0 | 3 | 0 | 2 | 4 | 0 | 2 | 0 | 3 | 0 | 2 | 4 | 0 | 2 | 0 | 3 | 0 | 3 | 4 | 0 | 4 | 0 | 3 | 0 | 3 | 4 | 0 | 4 | 0 | 2 | 0 | 2 | 3 | 0 | 1 |
| 20 | 1 | 2 | 2 | 2 | 2 | 0 | 0 | 3 | 3 | 2 | 3 | 3 | 0 | 0 | 4 | 2 | 2 | 3 | 3 | 0 | 0 | 4 | 2 | 2 | 3 | 3 | 0 | 0 | 2 | 2 | 2 | 2 | 2 | 0 | 0 |
| 21 | 3 | 3 | 3 | 3 | 3 | 3 | 3 | 2 | 3 | 3 | 4 | 2 | 4 | 4 | 4 | 3 | 3 | 4 | 2 | 4 | 4 | 4 | 3 | 3 | 4 | 2 | 4 | 4 | 3 | 1 | 1 | 3 | 2 | 2 | 1 |
| 22 | 0 | 3 | 0 | 0 | 3 | 0 | 0 | 0 | 2 | 0 | 0 | 2 | 0 | 0 | 0 | 1 | 0 | 0 | 1 | 0 | 0 | 0 | 1 | 0 | 0 | 1 | 0 | 0 | 0 | 1 | 0 | 0 | 1 | 0 | 0 |
| 23 | 0 | 2 | 3 | 0 | 2 | 0 | 0 | 0 | 1 | 2 | 0 | 2 | 0 | 0 | 0 | 3 | 3 | 0 | 3 | 0 | 0 | 0 | 3 | 3 | 0 | 3 | 0 | 0 | 0 | 2 | 2 | 0 | 2 | 0 | 0 |
| 24 | 0 | 3 | 0 | 0 | 4 | 0 | 0 | 0 | 3 | 0 | 0 | 3 | 0 | 0 | 0 | 3 | 0 | 0 | 3 | 0 | 0 | 0 | 3 | 0 | 0 | 3 | 0 | 0 | 0 | 2 | 0 | 0 | 2 | 0 | 0 |
| 25 | 2 | 2 | 0 | 4 | 2 | 2 | 2 | 2 | 2 | 0 | 4 | 2 | 2 | 2 | 2 | 2 | 0 | 4 | 2 | 2 | 2 | 2 | 2 | 0 | 4 | 2 | 2 | 2 | 2 | 2 | 0 | 2 | 2 | 2 | 1 |
| 26 | 0 | 3 | 0 | 0 | 3 | 0 | 0 | 0 | 2 | 0 | 0 | 2 | 0 | 0 | 0 | 1 | 0 | 0 | 1 | 0 | 0 | 0 | 1 | 0 | 0 | 1 | 0 | 0 | 0 | 1 | 0 | 0 | 1 | 0 | 0 |
| 27 | 0 | 0 | 0 | 0 | 3 | 0 | 0 | 0 | 0 | 0 | 0 | 2 | 0 | 0 | 0 | 0 | 0 | 0 | 1 | 0 | 0 | 0 | 0 | 0 | 0 | 1 | 0 | 0 | 0 | 0 | 0 | 0 | 1 | 0 | 0 |
| 28 | 0 | 0 | 2 | 0 | 4 | 0 | 0 | 0 | 0 | 2 | 0 | 2 | 0 | 0 | 0 | 0 | 1 | 0 | 1 | 0 | 0 | 0 | 0 | 1 | 0 | 1 | 0 | 0 | 0 | 0 | 2 | 0 | 2 | 0 | 0 |
| 29 | 0 | 2 | 0 | 2 | 3 | 0 | 3 | 0 | 2 | 0 | 2 | 2 | 0 | 3 | 0 | 2 | 0 | 2 | 2 | 0 | 2 | 0 | 2 | 0 | 2 | 2 | 0 | 2 | 0 | 2 | 0 | 2 | 3 | 0 | 1 |
| 30 | 0 | 0 | 0 | 0 | 3 | 0 | 0 | 0 | 0 | 0 | 0 | 3 | 0 | 0 | 0 | 0 | 0 | 0 | 3 | 0 | 0 | 0 | 0 | 0 | 0 | 3 | 0 | 0 | 0 | 0 | 0 | 0 | 3 | 0 | 0 |
| 31 | 0 | 0 | 0 | 0 | 3 | 0 | 0 | 0 | 0 | 0 | 0 | 3 | 0 | 0 | 0 | 0 | 0 | 0 | 3 | 0 | 0 | 0 | 0 | 0 | 0 | 3 | 0 | 0 | 0 | 0 | 0 | 0 | 2 | 0 | 0 |
| 32 | 0 | 0 | 2 | 0 | 2 | 0 | 0 | 0 | 0 | 1 | 0 | 1 | 0 | 0 | 0 | 0 | 1 | 0 | 1 | 0 | 0 | 0 | 0 | 1 | 0 | 1 | 0 | 0 | 0 | 0 | 1 | 0 | 1 | 0 | 0 |
| 33 | 0 | 0 | 3 | 0 | 3 | 0 | 0 | 0 | 0 | 2 | 0 | 2 | 0 | 0 | 0 | 0 | 2 | 0 | 2 | 0 | 0 | 0 | 0 | 2 | 0 | 2 | 0 | 0 | 0 | 0 | 1 | 0 | 2 | 0 | 0 |
| 34 | 0 | 0 | 0 | 0 | 2 | 0 | 0 | 0 | 0 | 0 | 0 | 2 | 0 | 0 | 0 | 0 | 0 | 0 | 2 | 0 | 0 | 0 | 0 | 0 | 0 | 2 | 0 | 0 | 0 | 0 | 0 | 0 | 2 | 0 | 0 |
| 35 | 0 | 0 | 0 | 0 | 3 | 0 | 0 | 0 | 0 | 0 | 0 | 2 | 0 | 0 | 0 | 0 | 0 | 0 | 2 | 0 | 0 | 0 | 0 | 0 | 0 | 2 | 0 | 0 | 0 | 0 | 0 | 0 | 2 | 0 | 0 |
| 36 | 0 | 0 | 0 | 0 | 2 | 0 | 0 | 0 | 0 | 0 | 0 | 1 | 0 | 0 | 0 | 0 | 0 | 0 | 1 | 0 | 0 | 0 | 0 | 0 | 0 | 1 | 0 | 0 | 0 | 0 | 0 | 0 | 1 | 0 | 0 |
| 37 | 0 | 2 | 0 | 0 | 4 | 0 | 2 | 0 | 2 | 0 | 0 | 3 | 0 | 2 | 0 | 2 | 0 | 0 | 3 | 0 | 2 | 0 | 2 | 0 | 0 | 3 | 0 | 2 | 0 | 2 | 0 | 0 | 3 | 0 | 1 |
| 38 | 0 | 2 | 2 | 2 | 3 | 0 | 3 | 0 | 2 | 2 | 2 | 3 | 0 | 3 | 0 | 2 | 2 | 2 | 3 | 0 | 3 | 0 | 2 | 2 | 2 | 3 | 0 | 3 | 0 | 2 | 2 | 2 | 2 | 0 | 1 |
| 39 | 0 | 0 | 0 | 0 | 3 | 0 | 0 | 0 | 0 | 0 | 0 | 2 | 0 | 0 | 0 | 0 | 0 | 0 | 2 | 0 | 0 | 0 | 0 | 0 | 0 | 2 | 0 | 0 | 0 | 0 | 0 | 0 | 2 | 0 | 0 |
| 40 | 0 | 2 | 0 | 0 | 3 | 0 | 0 | 0 | 2 | 0 | 0 | 2 | 0 | 0 | 0 | 2 | 0 | 0 | 2 | 0 | 0 | 0 | 2 | 0 | 0 | 2 | 0 | 0 | 0 | 2 | 0 | 0 | 2 | 0 | 0 |
| 41 | 0 | 2 | 0 | 0 | 2 | 0 | 0 | 0 | 2 | 0 | 0 | 2 | 0 | 0 | 0 | 3 | 0 | 0 | 3 | 0 | 0 | 0 | 3 | 0 | 0 | 3 | 0 | 0 | 0 | 2 | 0 | 0 | 2 | 0 | 0 |
| 42 | 3 | 3 | 0 | 3 | 4 | 0 | 2 | 2 | 2 | 0 | 2 | 3 | 0 | 2 | 2 | 2 | 0 | 2 | 3 | 0 | 2 | 2 | 2 | 0 | 2 | 3 | 0 | 2 | 2 | 2 | 0 | 2 | 2 | 0 | 1 |
| 43 | 0 | 3 | 0 | 3 | 3 | 0 | 3 | 0 | 2 | 0 | 2 | 2 | 0 | 2 | 0 | 4 | 0 | 4 | 4 | 0 | 3 | 0 | 4 | 0 | 4 | 4 | 0 | 3 | 0 | 3 | 0 | 3 | 3 | 0 | 1 |
| 44 | 0 | 0 | 0 | 0 | 4 | 0 | 0 | 0 | 0 | 0 | 0 | 3 | 0 | 0 | 0 | 0 | 0 | 0 | 3 | 0 | 0 | 0 | 0 | 0 | 0 | 3 | 0 | 0 | 0 | 0 | 0 | 0 | 3 | 0 | 0 |
| 45 | 0 | 3 | 0 | 3 | 3 | 3 | 4 | 0 | 3 | 0 | 3 | 3 | 3 | 4 | 0 | 3 | 0 | 3 | 3 | 3 | 4 | 0 | 3 | 0 | 3 | 3 | 3 | 4 | 0 | 1 | 0 | 1 | 3 | 1 | 1 |
| 46 | 0 | 0 | 0 | 2 | 3 | 0 | 0 | 0 | 0 | 0 | 2 | 2 | 0 | 0 | 0 | 0 | 0 | 2 | 2 | 0 | 0 | 0 | 0 | 0 | 2 | 2 | 0 | 0 | 0 | 0 | 0 | 2 | 2 | 0 | 0 |
| 47 | 0 | 2 | 0 | 2 | 2 | 2 | 2 | 0 | 2 | 0 | 2 | 2 | 2 | 3 | 0 | 2 | 0 | 2 | 2 | 2 | 3 | 0 | 2 | 0 | 2 | 2 | 2 | 3 | 0 | 2 | 0 | 2 | 2 | 2 | 1 |
| 48 | 0 | 2 | 0 | 2 | 2 | 0 | 2 | 0 | 3 | 0 | 3 | 3 | 0 | 3 | 0 | 3 | 0 | 3 | 3 | 0 | 3 | 0 | 3 | 0 | 3 | 3 | 0 | 3 | 0 | 3 | 0 | 3 | 3 | 0 | 1 |
| 49 | 0 | 3 | 0 | 0 | 3 | 0 | 0 | 0 | 2 | 0 | 0 | 2 | 0 | 0 | 0 | 2 | 0 | 0 | 2 | 0 | 0 | 0 | 2 | 0 | 0 | 2 | 0 | 0 | 0 | 2 | 0 | 0 | 2 | 0 | 0 |
| 50 | 0 | 0 | 3 | 0 | 0 | 0 | 3 | 0 | 0 | 2 | 0 | 0 | 0 | 4 | 0 | 0 | 2 | 0 | 0 | 0 | 4 | 0 | 0 | 2 | 0 | 0 | 0 | 4 | 0 | 0 | 2 | 0 | 0 | 0 | 1 |
| 51 | 0 | 1 | 1 | 1 | 0 | 1 | 1 | 0 | 3 | 3 | 4 | 0 | 4 | 5 | 0 | 1 | 1 | 1 | 0 | 1 | 1 | 0 | 1 | 1 | 1 | 0 | 1 | 1 | 0 | 1 | 1 | 1 | 0 | 1 | 1 |
| 52 | 4 | 3 | 3 | 2 | 2 | 2 | 3 | 4 | 3 | 3 | 2 | 2 | 2 | 3 | 4 | 3 | 3 | 2 | 2 | 2 | 3 | 4 | 3 | 3 | 2 | 2 | 2 | 3 | 3 | 3 | 3 | 2 | 2 | 2 | 1 |
| 53 | 0 | 1 | 0 | 1 | 0 | 0 | 3 | 0 | 1 | 0 | 1 | 0 | 0 | 3 | 0 | 1 | 0 | 1 | 0 | 0 | 3 | 0 | 1 | 0 | 1 | 0 | 0 | 3 | 0 | 1 | 0 | 1 | 0 | 0 | 1 |
| 54 | 3 | 3 | 3 | 3 | 3 | 3 | 3 | 2 | 2 | 2 | 2 | 3 | 2 | 3 | 2 | 2 | 2 | 2 | 3 | 2 | 3 | 2 | 2 | 2 | 2 | 3 | 2 | 3 | 1 | 1 | 2 | 3 | 1 | 1 | 1 |
| 55 | 3 | 3 | 3 | 3 | 3 | 3 | 2 | 2 | 2 | 2 | 2 | 2 | 2 | 2 | 2 | 2 | 2 | 2 | 2 | 2 | 2 | 2 | 2 | 2 | 2 | 2 | 2 | 2 | 1 | 1 | 2 | 2 | 1 | 2 | 1 |
| 56 | 3 | 3 | 3 | 2 | 2 | 2 | 2 | 4 | 4 | 3 | 2 | 4 | 2 | 2 | 4 | 4 | 3 | 2 | 4 | 2 | 2 | 4 | 4 | 3 | 2 | 4 | 2 | 2 | 2 | 2 | 2 | 2 | 3 | 2 | 1 |
| 57 | 0 | 0 | 3 | 0 | 0 | 0 | 0 | 0 | 0 | 4 | 0 | 0 | 0 | 0 | 0 | 0 | 4 | 0 | 0 | 0 | 0 | 0 | 0 | 4 | 0 | 0 | 0 | 0 | 0 | 0 | 4 | 0 | 0 | 0 | 0 |
| 58 | 0 | 0 | 0 | 0 | 0 | 0 | 0 | 0 | 0 | 0 | 0 | 0 | 0 | 0 | 0 | 0 | 0 | 0 | 0 | 0 | 0 | 0 | 0 | 0 | 0 | 0 | 0 | 0 | 0 | 0 | 0 | 0 | 0 | 0 | 0 |
| 59 | 0 | 0 | 0 | 0 | 0 | 0 | 0 | 0 | 0 | 0 | 0 | 0 | 0 | 0 | 0 | 0 | 0 | 0 | 0 | 0 | 0 | 0 | 0 | 0 | 0 | 0 | 0 | 0 | 0 | 0 | 0 | 0 | 0 | 0 | 0 |
| 60 | 0 | 2 | 0 | 0 | 0 | 0 | 0 | 0 | 2 | 0 | 0 | 0 | 0 | 0 | 0 | 1 | 0 | 0 | 0 | 0 | 0 | 0 | 1 | 0 | 0 | 0 | 0 | 0 | 0 | 2 | 0 | 0 | 0 | 0 | 0 |
| 61 | 0 | 0 | 0 | 0 | 0 | 0 | 0 | 0 | 0 | 0 | 0 | 0 | 0 | 0 | 0 | 0 | 0 | 0 | 0 | 0 | 0 | 0 | 0 | 0 | 0 | 0 | 0 | 0 | 0 | 0 | 0 | 0 | 0 | 0 | 0 |
| 62 | 0 | 0 | 0 | 0 | 3 | 0 | 0 | 0 | 0 | 0 | 0 | 2 | 0 | 0 | 0 | 0 | 0 | 0 | 1 | 0 | 0 | 0 | 0 | 0 | 0 | 1 | 0 | 0 | 0 | 0 | 0 | 0 | 2 | 0 | 0 |
| 63 | 0 | 2 | 0 | 3 | 0 | 3 | 0 | 0 | 2 | 0 | 4 | 0 | 4 | 0 | 0 | 4 | 0 | 4 | 0 | 4 | 0 | 0 | 4 | 0 | 4 | 0 | 4 | 0 | 0 | 3 | 0 | 3 | 0 | 3 | 0 |
| 64 | 0 | 0 | 0 | 3 | 0 | 0 | 0 | 0 | 0 | 0 | 4 | 0 | 0 | 0 | 0 | 0 | 0 | 4 | 0 | 0 | 0 | 0 | 0 | 0 | 4 | 0 | 0 | 0 | 0 | 0 | 0 | 3 | 0 | 0 | 0 |
| 65 | 0 | 0 | 0 | 3 | 0 | 0 | 0 | 0 | 0 | 0 | 2 | 0 | 0 | 0 | 0 | 0 | 0 | 1 | 0 | 0 | 0 | 0 | 0 | 0 | 1 | 0 | 0 | 0 | 0 | 0 | 0 | 1 | 0 | 0 | 0 |
| 66 | 0 | 3 | 0 | 3 | 0 | 3 | 0 | 0 | 3 | 0 | 4 | 0 | 4 | 0 | 0 | 3 | 0 | 4 | 0 | 4 | 0 | 0 | 3 | 0 | 4 | 0 | 4 | 0 | 0 | 4 | 0 | 3 | 0 | 4 | 0 |
| 67 | 0 | 0 | 0 | 2 | 0 | 2 | 0 | 0 | 0 | 0 | 2 | 0 | 2 | 0 | 0 | 0 | 0 | 2 | 0 | 2 | 0 | 0 | 0 | 0 | 2 | 0 | 2 | 0 | 0 | 0 | 0 | 2 | 0 | 2 | 0 |
| 68 | 0 | 3 | 0 | 3 | 3 | 0 | 3 | 0 | 4 | 0 | 3 | 4 | 0 | 4 | 0 | 4 | 0 | 3 | 4 | 0 | 4 | 0 | 4 | 0 | 3 | 4 | 0 | 4 | 0 | 4 | 0 | 3 | 4 | 0 | 1 |
| 69 | 0 | 1 | 0 | 3 | 0 | 3 | 0 | 0 | 1 | 0 | 3 | 0 | 3 | 0 | 0 | 1 | 0 | 3 | 0 | 3 | 0 | 0 | 1 | 0 | 3 | 0 | 3 | 0 | 0 | 1 | 0 | 3 | 0 | 3 | 0 |
| 70 | 3 | 3 | 3 | 3 | 3 | 3 | 3 | 4 | 3 | 2 | 3 | 4 | 3 | 4 | 4 | 3 | 2 | 3 | 4 | 3 | 4 | 4 | 3 | 2 | 3 | 4 | 3 | 4 | 3 | 3 | 2 | 2 | 3 | 2 | 1 |
| 71 | 0 | 2 | 0 | 0 | 0 | 2 | 0 | 0 | 1 | 0 | 0 | 0 | 1 | 0 | 0 | 1 | 0 | 0 | 0 | 1 | 0 | 0 | 1 | 0 | 0 | 0 | 1 | 0 | 0 | 1 | 0 | 0 | 0 | 1 | 0 |
| 72 | 1 | 2 | 0 | 2 | 0 | 2 | 0 | 1 | 1 | 0 | 1 | 0 | 1 | 0 | 1 | 1 | 0 | 1 | 0 | 1 | 0 | 1 | 1 | 0 | 1 | 0 | 1 | 0 | 1 | 1 | 0 | 1 | 0 | 1 | 0 |
| 73 | 1 | 2 | 0 | 2 | 0 | 2 | 0 | 1 | 1 | 0 | 1 | 0 | 1 | 0 | 1 | 1 | 0 | 1 | 0 | 1 | 0 | 1 | 1 | 0 | 1 | 0 | 1 | 0 | 1 | 1 | 0 | 1 | 0 | 1 | 0 |
| 74 | 0 | 3 | 0 | 3 | 0 | 3 | 0 | 0 | 2 | 0 | 2 | 0 | 2 | 0 | 0 | 2 | 0 | 2 | 0 | 2 | 0 | 0 | 2 | 0 | 2 | 0 | 2 | 0 | 0 | 2 | 0 | 2 | 0 | 2 | 0 |
| 75 | 0 | 2 | 0 | 2 | 0 | 2 | 0 | 0 | 2 | 0 | 3 | 0 | 3 | 0 | 0 | 2 | 0 | 3 | 0 | 3 | 0 | 0 | 2 | 0 | 3 | 0 | 3 | 0 | 0 | 2 | 0 | 3 | 0 | 3 | 0 |
| 76 | 0 | 3 | 0 | 3 | 0 | 3 | 0 | 0 | 3 | 0 | 3 | 0 | 3 | 0 | 0 | 3 | 0 | 3 | 0 | 3 | 0 | 0 | 3 | 0 | 3 | 0 | 3 | 0 | 0 | 3 | 0 | 3 | 0 | 3 | 0 |
| 77 | 1 | 2 | 2 | 2 | 2 | 0 | 0 | 4 | 2 | 3 | 3 | 3 | 0 | 0 | 4 | 2 | 3 | 3 | 3 | 0 | 0 | 4 | 2 | 3 | 3 | 3 | 0 | 0 | 4 | 2 | 3 | 3 | 3 | 0 | 0 |
| 78 | 2 | 2 | 2 | 2 | 2 | 2 | 0 | 2 | 2 | 2 | 2 | 2 | 2 | 0 | 2 | 2 | 2 | 2 | 2 | 2 | 0 | 2 | 2 | 2 | 2 | 2 | 2 | 0 | 2 | 2 | 2 | 2 | 2 | 2 | 0 |
Source: generated by the authors based on the respondents’ completed questionnaire.
Table A7.
Calculated risk per risk (threat) group and respondents. Source for PLS-SM data analysis.
| G1 | G2 | G3 | G4 | G5 | O1 | O2 | O3 | O4 | O5 | H1 | H2 | H3 | H4 | H5 | F1 | F2 | F3 | F4 | F5 | I1 | I2 | I3 | I4 | I5 | C1 | C2 | C3 | C4 | C5 | A1 | A2 | A3 | A4 | A5 | |
|---|---|---|---|---|---|---|---|---|---|---|---|---|---|---|---|---|---|---|---|---|---|---|---|---|---|---|---|---|---|---|---|---|---|---|---|
| 1 | 2 | 2 | 2 | 2 | 2 | 2 | 2 | 2 | 2 | 2 | 2 | 2 | 2 | 2 | 2 | 6 | 5 | 5 | 5 | 5 | 7 | 6 | 5 | 5 | 6 | 2 | 2 | 2 | 2 | 2 | 2 | 3 | 3 | 3 | 1 |
| 2 | 2 | 2 | 2 | 2 | 2 | 2 | 2 | 2 | 2 | 2 | 2 | 2 | 2 | 2 | 2 | 9 | 8 | 7 | 7 | 8 | 11 | 9 | 7 | 7 | 8 | 2 | 2 | 2 | 2 | 2 | 2 | 3 | 3 | 3 | 1 |
| 3 | 4 | 3 | 3 | 3 | 3 | 8 | 5 | 4 | 4 | 4 | 5 | 3 | 3 | 3 | 3 | 11 | 7 | 6 | 6 | 6 | 4 | 3 | 3 | 3 | 3 | 5 | 4 | 3 | 3 | 3 | 5 | 4 | 4 | 4 | 2 |
| 4 | 4 | 4 | 4 | 4 | 3 | 8 | 7 | 6 | 6 | 7 | 4 | 4 | 4 | 4 | 4 | 4 | 4 | 4 | 4 | 4 | 11 | 10 | 8 | 8 | 10 | 2 | 2 | 2 | 2 | 2 | 2 | 3 | 3 | 3 | 1 |
| 5 | 2 | 2 | 2 | 2 | 2 | 2 | 2 | 2 | 2 | 2 | 11 | 6 | 6 | 6 | 7 | 2 | 2 | 2 | 2 | 2 | 6 | 5 | 3 | 3 | 5 | 2 | 2 | 2 | 2 | 2 | 2 | 3 | 3 | 3 | 1 |
| 6 | 2 | 2 | 2 | 2 | 2 | 8 | 7 | 6 | 6 | 7 | 8 | 6 | 5 | 6 | 7 | 7 | 6 | 6 | 6 | 7 | 11 | 9 | 8 | 7 | 9 | 3 | 3 | 3 | 3 | 3 | 4 | 4 | 3 | 3 | 2 |
| 7 | 2 | 2 | 2 | 2 | 2 | 5 | 4 | 4 | 4 | 5 | 2 | 2 | 2 | 2 | 2 | 5 | 5 | 4 | 4 | 4 | 9 | 8 | 7 | 7 | 9 | 3 | 3 | 3 | 3 | 3 | 5 | 5 | 4 | 4 | 3 |
| 8 | 4 | 3 | 3 | 3 | 3 | 5 | 5 | 4 | 4 | 4 | 4 | 2 | 2 | 2 | 2 | 5 | 5 | 4 | 4 | 4 | 9 | 9 | 7 | 8 | 9 | 5 | 5 | 3 | 3 | 4 | 5 | 6 | 6 | 6 | 3 |
| 9 | 2 | 2 | 2 | 2 | 2 | 4 | 4 | 3 | 3 | 4 | 2 | 2 | 2 | 2 | 2 | 3 | 3 | 3 | 3 | 3 | 9 | 8 | 8 | 8 | 9 | 2 | 2 | 2 | 2 | 2 | 2 | 3 | 3 | 3 | 1 |
| 10 | 3 | 3 | 2 | 2 | 2 | 4 | 4 | 3 | 3 | 3 | 3 | 2 | 2 | 2 | 2 | 6 | 6 | 5 | 5 | 6 | 10 | 9 | 8 | 8 | 9 | 6 | 6 | 5 | 5 | 5 | 2 | 3 | 3 | 3 | 1 |
| 11 | 3 | 3 | 3 | 3 | 2 | 3 | 3 | 3 | 3 | 2 | 2 | 2 | 2 | 2 | 2 | 4 | 3 | 3 | 3 | 3 | 3 | 2 | 2 | 2 | 2 | 4 | 3 | 3 | 3 | 3 | 10 | 10 | 10 | 10 | 5 |
| 12 | 3 | 2 | 3 | 3 | 2 | 2 | 2 | 2 | 2 | 2 | 2 | 2 | 2 | 2 | 2 | 2 | 2 | 2 | 2 | 2 | 3 | 2 | 2 | 2 | 2 | 2 | 2 | 2 | 2 | 2 | 9 | 10 | 9 | 9 | 5 |
| 13 | 2 | 2 | 2 | 2 | 2 | 11 | 11 | 7 | 8 | 7 | 2 | 2 | 2 | 2 | 2 | 5 | 6 | 4 | 4 | 4 | 3 | 2 | 2 | 2 | 2 | 4 | 4 | 3 | 3 | 3 | 11 | 13 | 9 | 9 | 6 |
| 14 | 2 | 2 | 2 | 2 | 2 | 11 | 9 | 9 | 9 | 9 | 2 | 2 | 2 | 2 | 2 | 10 | 9 | 9 | 9 | 9 | 3 | 2 | 2 | 2 | 2 | 2 | 2 | 2 | 2 | 2 | 12 | 12 | 11 | 11 | 8 |
| 15 | 10 | 7 | 4 | 4 | 5 | 10 | 8 | 3 | 3 | 5 | 2 | 2 | 2 | 2 | 2 | 10 | 9 | 4 | 4 | 6 | 3 | 2 | 2 | 2 | 2 | 10 | 8 | 4 | 4 | 6 | 2 | 3 | 3 | 3 | 1 |
| 16 | 9 | 9 | 8 | 7 | 5 | 9 | 9 | 8 | 6 | 6 | 4 | 3 | 3 | 3 | 3 | 13 | 13 | 9 | 7 | 6 | 3 | 2 | 2 | 2 | 2 | 13 | 12 | 9 | 7 | 6 | 13 | 14 | 10 | 8 | 4 |
| 17 | 10 | 7 | 7 | 7 | 7 | 6 | 5 | 4 | 4 | 4 | 5 | 4 | 4 | 4 | 3 | 7 | 5 | 5 | 5 | 5 | 6 | 5 | 4 | 4 | 4 | 7 | 5 | 4 | 4 | 4 | 4 | 4 | 4 | 4 | 2 |
| 18 | 9 | 7 | 5 | 5 | 5 | 8 | 8 | 5 | 5 | 5 | 3 | 2 | 2 | 2 | 2 | 9 | 9 | 6 | 6 | 6 | 6 | 6 | 4 | 4 | 4 | 9 | 9 | 6 | 6 | 5 | 9 | 9 | 7 | 7 | 4 |
| 19 | 6 | 6 | 7 | 6 | 5 | 7 | 6 | 7 | 6 | 6 | 3 | 2 | 2 | 2 | 2 | 4 | 4 | 4 | 4 | 4 | 5 | 4 | 3 | 3 | 3 | 4 | 4 | 4 | 3 | 3 | 6 | 5 | 5 | 5 | 2 |
Source: generated by the authors.
References
- Suleiman, Z.; Shaikholla, S.; Dikhanbayeva, D.; Shehab, E.; Turkyilmaz, A. Industry 4.0: Clustering of Concepts and Characteristics. Cogent Eng. 2022, 9, 2034264. [Google Scholar] [CrossRef]
- Ardito, L.; Petruzzelli, A.M.; Panniello, U.; Garavelli, A.C. Towards Industry 4.0. Bus. Process Manag. J. 2019, 25, 323–346. [Google Scholar] [CrossRef]
- Vaidya, S.; Ambad, P.; Bhosle, S. Industry 4.0—A Glimpse. Procedia Manuf. 2018, 20, 233–238. [Google Scholar] [CrossRef]
- Tupa, J.; Steiner, F. Industry 4.0 and Business Process Management. Tehnički Glasnik 2019, 13, 349–355. [Google Scholar] [CrossRef] [Green Version]
- Alcácer, V.; Cruz-Machado, V. Scanning the Industry 4.0: A Literature Review on Technologies for Manufacturing Systems. Eng. Sci. Technol. Int. J. 2019, 22, 899–919. [Google Scholar] [CrossRef]
- Ribeiro da Silva, E.H.D.; Shinohara, A.C.; Pinheiro de Lima, E.; Angelis, J.; Machado, C.G. Reviewing Digital Manufacturing Concept in the Industry 4.0 Paradigm. Procedia CIRP 2019, 81, 240–245. [Google Scholar] [CrossRef]
- Verhoef, P.C.; Broekhuizen, T.; Bart, Y.; Bhattacharya, A.; Qi Dong, J.; Fabian, N.; Haenlein, M. Digital Transformation: A Multidisciplinary Reflection and Research Agenda. J. Bus. Res. 2021, 122, 889–901. [Google Scholar] [CrossRef]
- Pilat, D.; Hatem, L.; Ker, D.; Mitchell, J. A Roadmap toward a Common Framework for Measuring the Digital Economy; Publisher: OECD. Available online: http://www.oecd.org/sti/roadmap-toward-a-common-framework-for-measuring-the-digital-economy.pdf (accessed on 17 March 2023).
- Ertz, M.; Boily, É. The Rise of the Digital Economy: Thoughts on Blockchain Technology and Cryptocurrencies for the Collaborative Economy. Int. J. Innov. Stud. 2019, 3, 84–93. [Google Scholar] [CrossRef]
- Kraus, S.; Durst, S.; Ferreira, J.J.; Veiga, P.; Kailer, N.; Weinmann, A. Digital Transformation in Business and Management Research: An Overview of the Current Status Quo. Int. J. Inf. Manag. 2022, 63, 102466. [Google Scholar] [CrossRef]
- Cernisevs, O. Analysis of the Factors Influencing the Formation of The Transaction Price in The Blockchain. Financ. Credit. Syst. Prospect. Dev. 2021, 3, 36–47. [Google Scholar] [CrossRef]
- Buka, S.; Surmach, A.; Cernisevs, O. Analysis of Aspects of the Regional Economy in the Digital Economy, Using the Example of Financial Services. Rev. Econ. Financ. 2022, 20, 203–207. [Google Scholar] [CrossRef]
- Cernisevs, O.; Popova, Y. ICO as Crypto-Assets Manufacturing within a Smart City. Smart Cities 2022, 6, 40–56. [Google Scholar] [CrossRef]
- Popova, Y.; Cernisevs, O. Smart City: Sharing of Financial Services. Soc. Sci. 2022, 12, 8. [Google Scholar] [CrossRef]
- Cordoș, G.S.; Fülöp, M.T.; Tiron-Tudor, A. UK audit reporting practices in the pre-ISA700 (2015 revision) era. Asian J. Bus. Ethics 2020, 9, 349–370. [Google Scholar] [CrossRef]
- Fülöp, M.T.; Tiron-Tudor, A.; Cordos, G.S. Audit education role in decreasing the expectation gap. J. Educ. Bus. 2019, 94, 306–313. [Google Scholar] [CrossRef]
- Fülöp, M.T.; Topor, D.I.; Ionescu, C.A.; Căpușneanu, S.; Breaz, T.O.; Stanescu, S.G. Fintech accounting and Industry 4.0: Future-proofing or threats to the accounting profession? J. Bus. Econ. Manag. 2022, 23, 997–1015. [Google Scholar] [CrossRef]
- Maté, A.; Zoumpatianos, K.; Palpanas, T.; Trujillo, J.; Mylopoulos, J.; Koci, E. A Systematic Approach for Dynamic Targeted Monitoring of KPIs. In CASCON; IBM Corp: Riverton, WY, USA, 2014; pp. 192–206. [Google Scholar]
- Siedler, C.; Langlotz, P.; Aurich, J.C. Modeling and Assessing the Effects of Digital Technologies on KPIs in Manufacturing Systems. Procedia CIRP 2020, 93, 682–687. [Google Scholar] [CrossRef]
- Simons, R. Sistemi Di Controllo e Misure Di Performance; EGEA: Milano, Italy, 2004. [Google Scholar]
- Shin, J.; Kim, Y.J.; Jung, S.; Kim, C. Product and Service Innovation: Comparison between Performance and Efficiency. J. Innov. Knowl. 2022, 7, 100191. [Google Scholar] [CrossRef]
- John Behringer Using Key Risk Indicators to Recover, Improve or Maintain Institutional Performance; 2011. Available online: http://mcgladrey.com/Banking-Financial-Institutions/Using-key-risk-indicators-to-recover-improve-or-maintain-institutional-performance (accessed on 3 January 2021).
- Schmid, M.M.; Sabato, G.; Aebi, V. Risk Management, Corporate Governance, and Bank Performance in the Financial Crisis. SSRN Electron. J. 2011, 36, 3213–3226. [Google Scholar] [CrossRef] [Green Version]
- Meier, H.; Lagemann, H.; Morlock, F.; Rathmann, C. Key Performance Indicators for Assessing the Planning and Delivery of Industrial Services. Procedia CIRP 2013, 11, 99–104. [Google Scholar] [CrossRef]
- Horváth, D.; Szabó, R.Z. Driving Forces and Barriers of Industry 4.0: Do Multinational and Small and Medium-Sized Companies Have Equal Opportunities? Technol. Forecast Soc. Chang. 2019, 146, 119–132. [Google Scholar] [CrossRef]
- Paritala, P.K.; Manchikatla, S.; Yarlagadda, P.K.D.V. Digital Manufacturing- Applications Past, Current, and Future Trends. Procedia Eng. 2017, 174, 982–991. [Google Scholar] [CrossRef] [Green Version]
- Esmaeilian, B.; Behdad, S.; Wang, B. The Evolution and Future of Manufacturing: A Review. J. Manuf. Syst. 2016, 39, 79–100. [Google Scholar] [CrossRef]
- Da Silva, E.R.; Shinohara, A.C.; Nielsen, C.P.; de Lima, E.P.; Angelis, J. Operating Digital Manufacturing in Industry 4.0: The Role of Advanced Manufacturing Technologies. Procedia CIRP 2020, 93, 174–179. [Google Scholar] [CrossRef]
- Zhu, Z.; Dhokia, V.G.; Nassehi, A.; Newman, S.T. A Review of Hybrid Manufacturing Processes–State of the Art and Future Perspectives. Int. J. Comput. Integr. Manuf. 2013, 26, 596–615. [Google Scholar] [CrossRef] [Green Version]
- Bajgoric, N.; Moon, Y.B. Business Model for Digital Economy Era: A Framework Based on the Churchman’s Theory of Design Integrity. Int. J. Bus. Syst. Res. 2017, 11, 284. [Google Scholar] [CrossRef]
- Torabi, S.A.; Giahi, R.; Sahebjamnia, N. An Enhanced Risk Assessment Framework for Business Continuity Management Systems. Saf. Sci. 2016, 89, 201–218. [Google Scholar] [CrossRef]
- Wang, Y.; Li, G.; Li, J.; Zhu, X. Comprehensive Identification of Operational Risk Factors Based on Textual Risk Disclosures. Procedia Comput. Sci. 2018, 139, 136–143. [Google Scholar] [CrossRef]
- Kaddumi, T.; Al-Kilani, Q.A. Operational Risks and Financial Performance—The Context of The Jordanian Banking Environment. J. Southwest Jiaotong Univ. 2022, 57, 338–349. [Google Scholar] [CrossRef]
- Ibrahim, I.; Melhem, B. Impact of the Human Resources on the Risk Management and the Company Performance. Int. J. Econ. Manag. Sci. 2016, 5, 1–5. [Google Scholar] [CrossRef]
- Silva, J.L.; Navarro, V.L. Work Organization and the Health of Bank Employees. Rev. Lat. Am. Enfermagem 2012, 20, 226–234. [Google Scholar] [CrossRef] [PubMed] [Green Version]
- Zhang, Q. Research on Bank Financial Risk Control Mechanism Based on KMV Model. Front. Bus. Econ. Manag. 2022, 6, 241–244. [Google Scholar] [CrossRef]
- Varga, S.; Brynielsson, J.; Franke, U. Cyber-Threat Perception and Risk Management in the Swedish Financial Sector. Comput. Secur. 2021, 105, 102239. [Google Scholar] [CrossRef]
- Nguyen, Q.T.T.; Nguyen, S.T.B.; Nguyen, Q.v. Can Higher Capital Discipline Bank Risk: Evidence from a Meta-Analysis. J. Risk Financ. Manag. 2019, 12, 134. [Google Scholar] [CrossRef] [Green Version]
- Hummel, K.; Laun, U.; Krauss, A. Management of Environmental and Social Risks and Topics in the Banking Sector—An Empirical Investigation. Br. Account. Rev. 2021, 53, 100921. [Google Scholar] [CrossRef]
- Laeven, L.; Levine, R. Bank Governance, Regulation and Risk Taking. J. Financ. Econ 2009, 93, 259–275. [Google Scholar] [CrossRef] [Green Version]
- Kunz, J.; Heitz, M. Banks’ Risk Culture and Management Control Systems: A Systematic Literature Review. J. Manag. Control 2021, 32, 439–493. [Google Scholar] [CrossRef]
- Faccia, A.; Moşteanu, N.R.; Cavaliere, L.P.L.; Mataruna-Dos-Santos, L.J. Electronic Money Laundering, The Dark Side of Fintech. In Proceedings of the 2020 12th International Conference on Information Management and Engineering, Amsterdam, The Netherlands, 16–18 September 2020; ACM: New York, NY, USA, 2020; pp. 29–34. [Google Scholar]
- Smart, A.; Creelman, J. RBPM: Integrating Risk Frameworks and Standards with the Balanced Scorecard. In Risk-Based Performance Management; Palgrave Macmillan: London, UK, 2013; pp. 53–84. [Google Scholar]
- Cox, L. Some Limitations of “Risk = Threat × Vulnerability × Consequence” for Risk Analysis of Terrorist Attacks. Risk Anal. 2008, 28, 1749–1761. [Google Scholar] [CrossRef] [PubMed]
- Abid, A.; Gull, A.A.; Hussain, N.; Nguyen, D.K. Risk Governance and Bank Risk-Taking Behavior: Evidence from Asian Banks. J. Int. Financ. Mark. Inst. Money 2021, 75, 101466. [Google Scholar] [CrossRef]
- Dash, G.; Paul, J. CB-SEM vs PLS-SEM Methods for Research in Social Sciences and Technology Forecasting. Technol. Forecast. Soc. Chang. 2021, 173, 121092. [Google Scholar] [CrossRef]
- Chin, W.; Cheah, J.-H.; Liu, Y.; Ting, H.; Lim, X.-J.; Cham, T.H. Demystifying the Role of Causal-Predictive Modeling Using Partial Least Squares Structural Equation Modeling in Information Systems Research. Ind. Manag. Data Syst. 2020, 120, 2161–2209. [Google Scholar] [CrossRef]
- Hair, J.F.; Hult, G.T.M.; Ringle, C.M.; Sarstedt, M.; Danks, N.P.; Ray, S. An Introduction to Structural Equation Modeling; Springer: Cham, Switzerland, 2021; pp. 1–29. [Google Scholar] [CrossRef]
- Popova, Y.; Zagulova, D. UTAUT Model for Smart City Concept Implementation: Use of Web Applications by Residents for Everyday Operations. Informatics 2022, 9, 27. [Google Scholar] [CrossRef]
- Popova, Y.; Popovs, S. Impact of Smart Economy on Smart Areas and Mediation Effect of National Economy. Sustainability 2022, 14, 2789. [Google Scholar] [CrossRef]
- Mateos-Aparicio, G. Partial Least Squares (PLS) Methods: Origins, Evolution, and Application to Social Sciences. Commun. Stat. Theory Methods 2011, 40, 2305–2317. [Google Scholar] [CrossRef] [Green Version]
- Ringle, C.M.; Sarstedt, M.; Mitchell, R.; Gudergan, S.P. Partial Least Squares Structural Equation Modeling in HRM Research. Int. J. Hum. Resour. Manag. 2020, 31, 1617–1643. [Google Scholar] [CrossRef]
- Memon, M.A.; Ramayah, T.; Ting, H.; Cheah, J.H.; Chuah, F.; Cham, T.H. Pls-Sem Statistical Programs: A Review. J. Appl. Struct. Equ. Model. 2021, 5, i–xiv. [Google Scholar] [CrossRef]
- Widaman, K.F. Exploratory Factor Analysis and Confirmatory Factor Analysis. In APA Handbook of Research Methods in Psychology, Vol 3: Data Analysis and Research Publication; American Psychological Association: Washington, DC, USA, 2012; pp. 361–389. [Google Scholar]
- Hair, J.F.; Risher, J.J.; Sarstedt, M.; Ringle, C.M. When to Use and How to Report the Results of PLS-SEM. Eur. Bus. Rev. 2019, 31, 2–24. [Google Scholar] [CrossRef]
- Nunnally, J.D. Psychometric Theory, 2nd ed.; McGraw-Hill: New York, NY, USA, 1978. [Google Scholar]
- Kock, N. WarpPLS 5.0 User Manual; ScriptWarp Systems: Laredo, TX, USA, 2015. [Google Scholar]
- Wong, K.K.K. Mastering Partial Least Squares Structural Equation Modeling (Pls-Sem) with Smartpls in 38 Hours; iUniverse: Bloomington, IN, USA, 2019; ISBN 9781532066498. [Google Scholar]
- Peter, J.P. Reliability: A Review of Psychometric Basics and Recent Marketing Practices. J. Mark. Res. 1979, 16, 6–17. [Google Scholar] [CrossRef]
- Bagozzi, R.P.; Yi, Y. On the Evaluation of Structural Equation Models. J. Acad. Mark. Sci. 1988, 16, 74–94. [Google Scholar] [CrossRef]
- Fornell, C.; Larcker, D.F. Evaluating Structural Equation Models with Unobservable Variables and Measurement Error. J. Mark. Res. 1981, 18, 39–50. [Google Scholar] [CrossRef]
- Henseler, J.; Ringle, C.M.; Sarstedt, M. A New Criterion for Assessing Discriminant Validity in Variance-Based Structural Equation Modeling. J. Acad. Mark. Sci. 2015, 43, 115–135. [Google Scholar] [CrossRef] [Green Version]
- Hair, J.; Hollingsworth, C.L.; Randolph, A.B.; Chong, A.Y.L. An Updated and Expanded Assessment of PLS-SEM in Information Systems Research. Ind. Manag. Data Syst. 2017, 117, 442–458. [Google Scholar] [CrossRef]
- Chin, W.W. The Partial Least Squares Approach to Structural Equation Modeling. In Modern Methods for Business Research; Marcoulides, G.A., Ed.; Lawrence Erlbaum Associates: Hillsdale, NJ, USA, 1998; pp. 294–336. [Google Scholar]
- Petter, S.; Straub, D.; Rai, A. Specifying Formative Constructs in Information Systems Research. MIS Q. 2007, 31, 623. [Google Scholar] [CrossRef] [Green Version]
- Hair, J.F., Jr.; Anderson, R.E.; Babin, B.J.; Black, W.C. Multivariate Data Analysis: A Global Perspective, 7th ed.; Pearson Education: Upper Saddle River, NJ, USA, 2010; ISBN 9780135153093. [Google Scholar]
- Hair, J.F.; Ringle, C.M.; Sarstedt, M. PLS-SEM: Indeed a Silver Bullet. J. Mark. Theory Pract. 2011, 19, 139–152. [Google Scholar] [CrossRef]
- Popova, Y.; Zagulova, D. Aspects of E-Scooter Sharing in the Smart City. Informatics 2022, 9, 36. [Google Scholar] [CrossRef]
- Van Greuning, H.; Bratanovic, S.-S.B. Capital Adequacy. In Analyzing Banking Risk, 4th ed.; A Framework for Assessing Corporate Governance and Risk Management; The World Bank: Washington, DC, USA, 2020; pp. 127–172. [Google Scholar]
- Greenacre, J.; Buckley, R.P. Using Trusts to Protect Mobile Money Customers. Singap. J. Leg. Stud. 2014, 59–78. Available online: http://www.jstor.org/stable/24872233 (accessed on 17 March 2023).
- Brener, A. Payment Service Directive II and Its Implications. In Disrupting Finance; Springer International Publishing: Cham, Switzerland, 2019; pp. 103–119. [Google Scholar]
- Polasik, M.; Huterska, A.; Iftikhar, R.; Mikula, Š. The Impact of Payment Services Directive 2 on the PayTech Sector Development in Europe. J. Econ. Behav. Organ. 2020, 178, 385–401. [Google Scholar] [CrossRef]
- Khalilzadeh, M.; Katoueizadeh, L.; Zavadskas, E.K. Risk Identification and Prioritization in Banking Projects of Payment Service Provider Companies: An Empirical Study. Front. Bus. Res. China 2020, 14, 15. [Google Scholar] [CrossRef]
- Fantazzini, D.; Calabrese, R. Crypto Exchanges and Credit Risk: Modeling and Forecasting the Probability of Closure. J. Risk Financ. Manag. 2021, 14, 516. [Google Scholar] [CrossRef]
- Dijkstra, T.K.; Henseler, J. Consistent Partial Least Squares Path Modeling. MIS Q. 2015, 39, 297–316. [Google Scholar] [CrossRef]
- Hair, J.; Hult, G.T.M.; Ringle, C.; Sarstedt, M. A Primer on Partial Least Squares Structural Equation Modeling; Springer: Cham, Switzerland, 2014; ISBN 1452217440. [Google Scholar]
- Ab Hamid, M.R.; Sami, W.; Mohmad Sidek, M.H. Discriminant Validity Assessment: Use of Fornell & Larcker Criterion versus HTMT Criterion. J. Phys. Conf. Ser. 2017, 890, 012163. [Google Scholar] [CrossRef]
Figure 1.
Structural model risk types relations. (Source: generated by the authors based on PLS-SEM in SmartPLS 4.0.)
Figure 1.
Structural model risk types relations. (Source: generated by the authors based on PLS-SEM in SmartPLS 4.0.)

Table 1.
Threat evaluation criteria for internal processes.
| Risk Group | Very High | High | Medium | Low | Very Low |
|---|---|---|---|---|---|
| Governance | More than 50% of decisions are not delivered for final execution, which is a critical failure. Making decisions too slowly results in crucial failures that make it impossible to carry out essential tasks. The impact threatens the initiative or organization’s continued existence. | A less than 50% failure rate occurs when choices are not delivered for final execution. Failure to make choices results in the breakdown of crucial processes, which lowers performance. The initiative, activity, or organization’s survival is in jeopardy. | Decisions are not provided in time for the last execution. Delays in making decisions have an effect on the company and lead to poorer performance, including missed goals. Although there is no threat to an organization’s existence, there may be a thorough evaluation. | Decisions are not provided in time for the last execution. Delays in making decisions have an effect on the company and lead to poorer performance, including missed goals. Although there is no threat to an organization’s existence, there may be a thorough evaluation. | Minor failures of the internal procedure’s execution. |
| Operational | A widespread or protracted halt to activities: -Inability to promote services effectively. -Dangerous market share loss threat. | To handle operational issues, significant internal and/or external resources must be committed: -Significant and/or ongoing business disruptions. | Implementing increased internal and/or external resources is necessary for handling operational challenges: -More extensive or widespread organizational inefficiency (s). | Aggravation of the resources that must be dedicated to resolving practical issues: -Minor inefficiencies in functioning. | Modest resources need to be committed to internal operational issues: -Insignificant operational inefficiency. |
| Financial | >EUR 990,000 | EUR 330,000.01–EUR 990,000 | EUR 160,000.01–EUR 330,000 | EUR 30,000.01–EUR 160,000 | <EUR 30,000 |
| Human Resources | Protracted unavailability of critical skills/personnel. | Unavailability of critical skills of personnel. | Unavailability of core skills affecting services. | Minor impact to capability. | Minor skill impact. |
| Cyber | Destruction or complete loss of >50% of assets. Critical failure(s) preventing core activities from being performed. The impact threatens survival of the project or organization itself. | Extensive damage or loss of <50% of assets. Breakdown of key activities leading to reduction in performance. Survival of the project/activity/organization is threated. | Damage or loss of <20% of assets. Impact on organization resulting in reduced performance such as targets not being met. Organization’s existence is not threatened but could be subject to significant review. | Minor damage or loss of <5% of assets. Some impact on business areas in terms of delays and system quality but able to de dealt with at operational level. | Minor damage or vandalism of assets. Minimal impact on non-core business operations. The impact can be dealt with by routine operations. |
| Capital Adequacy | >50% of the capital | 30–50% of the capital | 15–30% of the capital | 5–15% of the capital | <than 5% of the capital |
| Financial Crime | Extreme consequences | High consequences | Medium consequences | Low consequences | Minor consequences |
Source: generated by the authors.
Table 2.
Vulnerabilities evaluation criteria.
| Very High | High | Medium | Low | Very Low |
|---|---|---|---|---|
| Event is expected to occur in most circumstances 90–100%. | Event will probably occur in most circumstances 60–90%. | Event is as likely to occur as to not occur 35–60%. | Event could occur at some point in time 10–35%. | Event may only occur in exceptional circumstances 0–10%. |
Source: generated by the authors.
Table 3.
The use weights of components.
| Numeric Value | Letter Abbreviation | Title |
|---|---|---|
| 1 | VL | Very low/irrelevant |
| 2 | L | Low |
| 3 | M | Medium |
| 4 | H | High |
| 5 | VH | Very high |
Source: generated by the authors.
Table 4.
Recommended assessment of PLS-SEM.
| Assessment | Description | Criteria |
|---|---|---|
| Construct validity (outer model) | ||
| Number of iterations | Sum of the outer weights’ changes between two iterations [52] | 5–10 |
| Maximum number of iterations [53] | 300 | |
| Item reliability | Indicators loadings (IL) [54,55,56,57] | >0.70 (highly satisfactory) |
| >0.50≤0.70 (acceptable) | ||
| >0.40≤0.50 (week) | ||
| Convergent validity (the study variables represent the latent constructs intended for measurement, as demonstrated by convergent validity) | Design reliability, a gauge of the scale components’ internal coherence [56,58]—(CR) | >0.80 [59] (satisfactory) |
| >0.70≤0.80 (acceptable) | ||
| >0.60≤0.70 (an acceptable range in exploratory study is 0.60 to 0.70) | ||
| Average variance extracted (AVE) | >0.5 [60] | |
| AVE > 0.5 and CR ≤ 0.6 [61] | ||
| Discriminant validity | Fornell and Larcker (F&L), in SmartPLS—divergent validity heterotrait: monotrait ratios (HTMT) [62,63] | Confidence intervals should not contain a value of 1; values lower than 0.85 for conceptually different constructs and below 0.90 for similar constructs |
| Structural model (inner model) | ||
| Coefficient of determination | The preferred number is a greater one [52,64]—R2 | 0.67 (substantial) |
| 0.33 (average) | ||
| 0.19 (weak) | ||
| Standardized path coefficients | Identify the importance and the confidence intervals—B (β) | from −1 to +1. |
| Effect size | The strength of the connection between two variables in a population is measured by the effect size—f2 | 0.35 (strong effects) |
| 0.15 (moderate) | ||
| 0.02 (weak) | ||
| Variance inflation factor | An indicator of the degree of multicollinearity (VIF) | VIF ≤ 3.3 [65,66,67] |
| Final model evaluation | ||
| Fit measures | Standardized root mean square residual (SRMR)—the disparity between the observed correlation and the model-implied correlation matrix is known as the SRMR. As a result, it enables evaluation of the (model) fit criterion using the average magnitude of the discrepancies between observed and anticipated correlations [62]. | ≤0.08 |
Developed by authors based on the [68].
Table 5.
Measurement values.
| Constructs | CR | AVE | Composite Reliability (rho_a) |
|---|---|---|---|
| Cyber Risk | 0.995 | 0.981 | 1.005 |
| Operational Risk | 0.976 | 0.912 | 0.995 |
| Financial Risk | 0.970 | 0.894 | 0.980 |
| Financial Crime Risk | 0.989 | 0.9s54 | 1.073 |
| Human Resource Risk | 0.992 | 0.968 | 1.004 |
| Governance Risk | 0.983 | 0.935 | 0.994 |
| Capital Adequacy Risk | 0.986 | 0.947 | 0.988 |
Source: generated by the authors on the basis of SmartPls 4.0.
Table 6.
Fornell–Larcker criterion.
| AML | Capital Adequacy | Cyber | Finance | Governance | Operational | Staff | |
|---|---|---|---|---|---|---|---|
| AML | 0.977 | ||||||
| Capital Adequacy | 0.253 | 0.973 | |||||
| Cyber | −0.657 | −0.264 | 0.991 | ||||
| Finance | 0.255 | 0.490 | −0.121 | 0.945 | |||
| Governance | 0.127 | 0.755 | −0.344 | 0.304 | 0.967 | ||
| Operational | 0.492 | 0.334 | −0.258 | 0.526 | 0.311 | 0.955 | |
| Staff | −0.311 | −0.110 | 0.171 | −0.128 | −0.020 | −0.004 | 0.984 |
Source: generated by the authors on the basis of SmartPls 4.0.
Table 7.
HTMT requirement.
| AML | Capital Adequacy | Cyber | Finance | Governance | Operational | Staff | |
|---|---|---|---|---|---|---|---|
| AML | |||||||
| Capital Adequacy | 0.215 | ||||||
| Cyber | 0.659 | 0.261 | |||||
| Finance | 0.232 | 0.483 | 0.138 | ||||
| Governance | 0.127 | 0.756 | 0.343 | 0.291 | |||
| Operational | 0.490 | 0.315 | 0.247 | 0.529 | 0.299 | ||
| Staff | 0.325 | 0.108 | 0.168 | 0.127 | 0.053 | 0.046 |
Source: generated by the authors on the basis of SmartPls 4.0.
Table 8.
Inner model collinearity statistics (VIF).
| Capital Adequacy | Finance | |
|---|---|---|
| AML | 2.665 | 2.665 |
| Capital Adequacy | ||
| Cyber | 2.124 | 2.124 |
| Finance | ||
| Governance | 1.320 | 1.320 |
| Operational | 1.575 | 1.575 |
| Staff | 1.154 | 1.154 |
Source: generated by the authors on the basis of SmartPls 4.0. Background color: it shows that this row excluded from calculation.
Table 9.
Direct effects.
| Risk Group | β | f2 | STDEV | 2.5% | 97.5% |
|---|---|---|---|---|---|
| AML risk → Capital adequacy | 0.150 | 0.061 | 0.233 | −0.229 | 0.680 |
| AML risk → Finance | 0.016 | 0.000 | 1.614 | −0.602 | 0.765 |
| Cyber risk → Capital adequacy | 0.119 | 0.039 | 0.198 | −0.179 | 0.592 |
| Cyber risk → Finance | 0.072 | 0.006 | 0.294 | −0.470 | 0.663 |
| Governance risk → Capital adequacy | 0.742 | 1.202 | 0.278 | 0.223 | 1.223 |
| Governance risk → Finance | 0.218 | 0.044 | 1.482 | −0.674 | 0.995 |
| Operational risk → Capital adequacy | 0.013 | 0.000 | 0.244 | −0.467 | 0.433 |
| Operational risk → Finance | 0.447 | 0.044 | 3.507 | −0.732 | 0.950 |
| Staff risk → Capital adequacy | −0.062 | 0.005 | 0.393 | −1.153 | 0.401 |
| Staff risk → Finance | −0.200 | 0.023 | 1.175 | −1.099 | 1.177 |
Source: generated by the authors on the basis of SmartPls 4.0.
Table 10.
Result of hypotheses testing.
| Hypotheses | Result of Checking | |
|---|---|---|
| H1 | AML risk → Capital adequacy | Confirmed |
| H2 | AML risk → Finance | Not Confirmed |
| H3 | Cyber risk → Capital adequacy | Confirmed |
| H4 | Cyber risk → Finance | Not Confirmed |
| H5 | Governance risk → Capital adequacy | Confirmed |
| H6 | Governance risk → Finance | Confirmed |
| H7 | Operational risk → Capital adequacy | Not Confirmed |
| H8 | Operational risk → Finance | Confirmed |
| H9 | Staff risk → Capital adequacy | Not Confirmed |
| H10 | Staff risk → Finance | Not Confirmed |
Source: generated by the authors on the basis of SmartPls 4.0.
Disclaimer/Publisher’s Note: The statements, opinions and data contained in all publications are solely those of the individual author(s) and contributor(s) and not of MDPI and/or the editor(s). MDPI and/or the editor(s) disclaim responsibility for any injury to people or property resulting from any ideas, methods, instructions or products referred to in the content. |
© 2023 by the authors. Licensee MDPI, Basel, Switzerland. This article is an open access article distributed under the terms and conditions of the Creative Commons Attribution (CC BY) license (https://creativecommons.org/licenses/by/4.0/).
Share and Cite
MDPI and ACS Style
Cernisevs, O.; Popova, Y.; Cernisevs, D. Risk-Based Approach for Selecting Company Key Performance Indicator in an Example of Financial Services. Informatics 2023, 10, 54. https://doi.org/10.3390/informatics10020054
AMA Style
Cernisevs O, Popova Y, Cernisevs D. Risk-Based Approach for Selecting Company Key Performance Indicator in an Example of Financial Services. Informatics. 2023; 10(2):54. https://doi.org/10.3390/informatics10020054
Chicago/Turabian StyleCernisevs, Olegs, Yelena Popova, and Dmitrijs Cernisevs. 2023. "Risk-Based Approach for Selecting Company Key Performance Indicator in an Example of Financial Services" Informatics 10, no. 2: 54. https://doi.org/10.3390/informatics10020054
Note that from the first issue of 2016, this journal uses article numbers instead of page numbers. See further details here.