
FOXS-GSC—Fast Offset Xpath Service with HexagonS Communication


1
Serra Talhada Academic Unit, Federal Rural University of Pernambuco (UFRPE), Serra Talhada 56909-535, PE, Brazil
2
Computer System Department, University of São Paulo (USP), São Carlos 13566-590, SP, Brazil
3
Department of Exact and Technological Sciences, State University of Southwest Bahia (UESB), Vitória da Conquista 45083-900, BA, Brazil
*
Author to whom correspondence should be addressed.
Informatics 2023, 10(3), 56; https://doi.org/10.3390/informatics10030056
Submission received: 5 May 2023
/
Revised: 5 June 2023
/
Accepted: 29 June 2023
/
Published: 4 July 2023
(This article belongs to the Special Issue The Smart Cities Continuum via Machine Learning and Artificial Intelligence)
Abstract
:Congestion in large cities is widely recognized as a problem that impacts various aspects of society, including the economy and public health. To support the urban traffic system and to mitigate traffic congestion and the damage it causes, in this article we propose an assistant Intelligent Transport Systems (ITS) service for traffic management in Vehicular Networks (VANET), which we name FOXS-GSC, for Fast Offset Xpath Service with hexaGonS Communication. FOXS-GSC uses a VANET communication and fog computing paradigm to detect and recommend an alternative vehicle route to avoid traffic jams. Unlike the previous solutions in the literature, the proposed service offers a versatile approach in which traffic road classification and route suggestions can be made by infrastructure or by the vehicle itself without compromising the quality of the route service. To achieve this, the service operates in a decentralized way, and the components of the service (vehicles/infrastructure) exchange messages containing vehicle information and regional traffic information. For communication, the proposed approach uses a new dedicated multi-hop protocol that has been specifically designed based on the characteristics and requirements of a vehicle routing service. Therefore, by adapting to the inherent characteristics of a vehicle routing service, such as the density of regions, the proposed communication protocol both enhances reliability and improves the overall efficiency of the vehicle routing service. Simulation results comparing FOXS-GSC with baseline solutions and other proposals from the literature demonstrate its significant impact, reducing network congestion by up to 95% while maintaining a coverage of 97% across various scenery characteristics. Concerning road traffic efficiency, the traffic quality is increasing by 29%, for a reduction in carbon emissions of 10%.
1. Introduction
Embedded devices are now available for vehicles, supporting a wide range of services and applications aimed at managing traffic both in urban areas and on roadways [1]. These devices can sense the streets and highways of a city, providing new services and assisting ITS in the aim of optimizing the entire infrastructure of a city’s transport system [2]. To illustrate the potential of ITS applications and services, a study conducted by the World Health Organization [3] has revealed that road accidents worldwide cause 1.35 million deaths per year, with an estimated cost to the world economy of USD 1.8 trillion in crash injuries [4]. Frontal collisions account for about 33.7% of these accidents, and about 32.6% are due to lack of attention [5]. Thus, devices and mechanisms that monitor traffic and detect road events can help to reduce such accidents.
To monitor traffic on public roads, a mechanism is employed that verifies the density, direction, and other information of the vehicles [6]. This mechanism aims to detect slow traffic, possible congestion points, and traffic interruptions, enabling drivers to avoid them [7,8]. The lack or improper implementation of such a traffic monitoring system can significantly impact a nation’s budget. For example, traffic congestion costs approximately 2% of the European Union’s GDP [9], and over 160 billion US dollars per year in the United States [10]. To address this issue, computational research is necessary to provide the infrastructure needed to cover the entire transport system, which requires developing efficient information and communication technologies that can integrate vehicles [11,12]. This integration can be accomplished through communication between vehicles as well as between vehicles and roadside infrastructure such as a cellular network.
There are various approaches in the literature that aim to detect and alleviate traffic congestion in urban areas through vehicle networks [13,14]. One such approach, described in [13], employs vehicle-to-vehicle communication to estimate the speed and density of vehicles on the road. While this technique does not rely on infrastructure, it involves several challenges, such as minimizing information redundancy, reducing network overhead, and achieving accurate classification in a short amount of time. Additionally, this approach may suffer from frequent disconnections due to the highly dynamic topology of vehicle networks. Another approach, described in [14], uses communication between vehicles and a roadside access point (known as Vehicle-to-Infrastructure or V2I communication) to estimate their speed, location, and destination. While this technique appears to be more reliable, it faces various communication challenges, such as redundant data and long information delivery time. The fog computing paradigm is employed to overcome these limitations by leveraging the proximity of vehicles to reduce the delay in sending and receiving information.
In this sense, the present work proposes a new communication mechanism called Fast Offset Xpath Service with hexaGonS Communication (FOXS-GSC) based on FOXS [15]. Unlike previous works that focused on monitoring and classifying traffic conditions and calculating vehicle routes based on a fog computing infrastructure, FOXS-GSC focuses on developing an efficient communication protocol that allows vehicles far from a cloudlet to receive and send information about their routes.
The proposed protocol divides the environment into sectors based on the number of vehicles in them, taking advantage of traffic congestion characteristics, where the density is more significant in congested regions. FOXS-GSC allows greater coverage of the service even when the infrastructure is not within the coverage radius. However, the service may be unreachable due to particular properties of the current network. When this happens, vehicles using FOXS-GSC can detect traffic congestion and calculate a new route based on the traffic knowledge acquired through messages sent by other vehicles during their journey. The main contributions of this work are twofold:
- Design and evaluation of a multi-hop communication protocol that enables even those vehicles far from a cloudlet to receive and send information about their routes.
- Design and evaluation of a system to detect traffic congestion and then calculate a new route based on traffic knowledge.
FOX-GSC is compared to three baseline solutions found in the literature: DESTINy [16], CHIMERA [17], and PAN [18]. As an example, we consider the road network in Ottawa, Canada. The proposed strategy shows promising results in terms of network metrics. FOXS-GSC reduces the number of transited messages by more than 90% and maintains a tax of 20% more messages properly responded. In terms of traffic efficiency, FOXS-GSC reduces stopped time by up to 39% and travel time by up to 22%.
2. Related Work
Generally, many ITS applications use Vehicular Ad Hoc Networks to send messages from a source (vehicle, RSU) to all vehicles located inside a geographic region [19]. Such activity is known as data dissemination. Two important challenges in developing a data discrimination solution are the broadcast storm and the intermittently connected network problems. The broadcast storm problem happens when many nearby vehicles try to communicate at the same time, drastically increasing message collision [20,21]. The intermittently connected network problem happens when the number of vehicles is reduced (e.g., daybreak, holidays, and rural areas), requiring the data messages to be disseminated using direct multi-hop communication [22,23]. In addition to these challenges, each application has specific requirements which demand different strategies to support data dissemination. Many data dissemination solutions have been proposed to address these challenges [19,20,21,22,23,24,25,26,27,28,29,30].
Tonguz et al. [20] presented Distributed Vehicular Broadcast (DV-CAST), a data dissemination solution that proposes solving the broadcast storm and network partition problems. DV-CAST uses periodic beacon messages to build a local topology (one-hop neighbors) used to rebroadcast a message to the vehicle moving in the same direction as the destination. DV-CAST performs data dissemination in both sparse and dense networks, focusing only on highway topologies. In a dense network, the receiver applies the broadcast suppression algorithm and uses the store-carry-forward algorithm sparsely. However, the performance of DV-CAST depends on the well-tuned beacon frequency.
UV-CAST (urban vehicular broad-cast protocol) [22] was proposed to perform data dissemination in different traffic conditions. UV-CAST uses broadcast suppression or store-carry-forward depending on the vehicle’s relative position with respect to the sender. If the vehicle is on the edge of a connected component, UV-CAST infers that it has a higher probability of meeting new neighbors. Thus, the received message is stored until rendezvous with a new neighbor. However, if the vehicle is not a border vehicle then the broadcast suppression algorithm can rebroadcast the message.
Villas et al. [24] proposed the Data Dissemination Protocol in Vehicular Networks (DRIVE), a new solution to perform data dissemination in VANETs, considering dense and sparse network scenarios. DRIVE relies exclusively on local one-hop neighbor information to deliver messages in these scenarios. It uses the predictability of vehicle mobility and the distance to the transmitter to create a preference zone in order to set the delay on the message retransmission. Furthermore, the solution employs implicit acknowledgments to guarantee robustness in message delivery under sparse scenarios. However, the number of transmissions is increased by the need for acknowledgment messages.
Meneguette et al. [26] proposed a data dissemination protocol called Autonomic Data Dissemination in Highway for VANETs (ADDHV), providing more excellent coverage and low delay in data dissemination independently of the regional traffic conditions. The authors created two mechanisms to mitigate the broadcast storm and network partition problems. For the broadcast storm problem, a mechanism based on [24] was used, which defined regions called sweet spots inside of which vehicles have a higher priority to rebroadcast messages and a lower delay. For the network partition problem, an autonomic computing technique was implemented to decide whether the vehicle should disseminate a packet or not. This choice was based on a propagation efficiency concept and the geographic localization of vehicles. However, ADDHV can introduce additional network overhead because of the store-carry-forward mechanism applied in the solution.
Akabane et al. [28] developed the Context-Aware Routing pROtocol (CARRO), which explores the geographic context knowledge for data dissemination VANETs on urban and highway scenery. The CARRO protocol, similar to DRIVE [24], selects vehicles located in a high-priority geographic region to disseminate a message. In order to create network topology knowledge about the neighboring vehicles at one hop, each vehicle periodically transmits beacons with its position, velocity, and direction. When CARRO detects the network partition problem, the store-carry-forward mechanism is used. However, this mechanism can increase the network delay. In addition, the high number of beacons necessary for the solution work can increase the overhead.
Cunha et al. [27] introduced the Clustering Coefficient and node DEGREE protocol (CC-DEGREE), which uses two social metrics to choose the most reliable vehicles to retransmit the message. The first metric is the clustering coefficient, which is defined by the number of connections between the vehicle neighbours divided by the total number of possible connections between vehicle neighbours. The second metric is the node degree, which is defined by the number of one-hop neighbours. The CC-DEGREE protocol operates independently of the road traffic density. However, the CC-DEGREE computes the clustering coefficient metric based only on the position of an individual vehicle, and as such has low variability for dense scenarios and an impact on the choice of nodes to retransmit. This characteristic causes similar wait time assignments to several vehicles, increasing the probability of message collision.
Costa et al. [25] proposed a data dissemination protocol for VANETs based on complex network metrics in an urban scenario, which they named DDRX. In DDRX, vehicles maintain local knowledge of their one-hop and two-hop neighbors, which is used to build a subgraph. Using complex metrics (i.e., betweenness centrality and degree centrality), DDRX selects the best vehicles to retransmit the message. DDRX provides data dissemination with low overhead and delay, maximizing coverage and minimizing the number of packet collisions.
Lourenço et al. [16] proposed DESTINy (DEcentralized System for Traffic Management), a distributed solution to traffic management that uses the vehicle’s computational power to detect congestion and calculate new routes when necessary. To this end, each vehicle receives information about the traffic characteristics of the nearby roads through an auxiliary communication infrastructure (RSU). This RSU is responsible for updating and sending the road information (e.g., the time it took the vehicle to travel on each road) within the defined region. Periodically, vehicles request road characteristics from the nearest RSU; based on this information, the onboard application performs the routing process. Road processing is distributed among vehicles, while the RSU has responsibility for collecting and aggregating road characteristics and sending this information to the vehicles. DESTINy uses a V2V communication protocol based on destination distance.
Singh et al. [29] proposed an efficient vehicular relay selection scheme for Vehicular Delay-Tolerant Networks (VDTNs) to address the problem of dropped packets in these networks. Their paper highlighted the importance of VDTNs in emergency situations when traditional networks fail due to natural disasters or faulty infrastructure. The proposed scheme considers nodes’ selfish nature and relay nodes’ inefficiency in order to select the most efficient and cooperative relay node for packet forwarding. However, this solution can forward packet replicas to multiple best-choice relays, thereby flooding the network with replicated packages.
Rizwan et al. [30] proposed the DDP4V protocol for VANET applications, which aims to improve data packet delivery time and reduce latency. This is achieved by suppressing broadcast messages and reducing dispersed packets using NFV (Node Forwarding Value) mechanism. The NFV mechanism assigns a value to each vehicle based on its position and connectivity within the network, and the next hop is chosen based on this value. However, this solution has connectivity issues in areas with low vehicle densities.
Summarizing the comparison of solutions using the Vanets communication protocol, Table 1 lists the main features of the aforementioned related works and highlights the main contributions of the protocol presented in this work. It can be observed that no previous works have focused on vehicle routing services, meaning that they have not taken into account the characteristics of this type of service, such as the density and region of the communicators. Another novel feature that FOXS-GSC implements is a transmission recovery mechanism based on backtracking.
3. Proposed Solution
This section describes the proposed distributed communication protocol, which we call Fast Offset Xpath Service with hexaGonS Communication (FOXS-GSC). This protocol selects relay nodes based on message retransmission to disseminate data in an urban VANET scenario. FOXS-GSC considers the destination node’s geographic position and the position of neighboring nodes concerning the (re)transmitting node. For this, vehicles must maintain local knowledge of their neighbors obtained using beacons sent by vehicles.
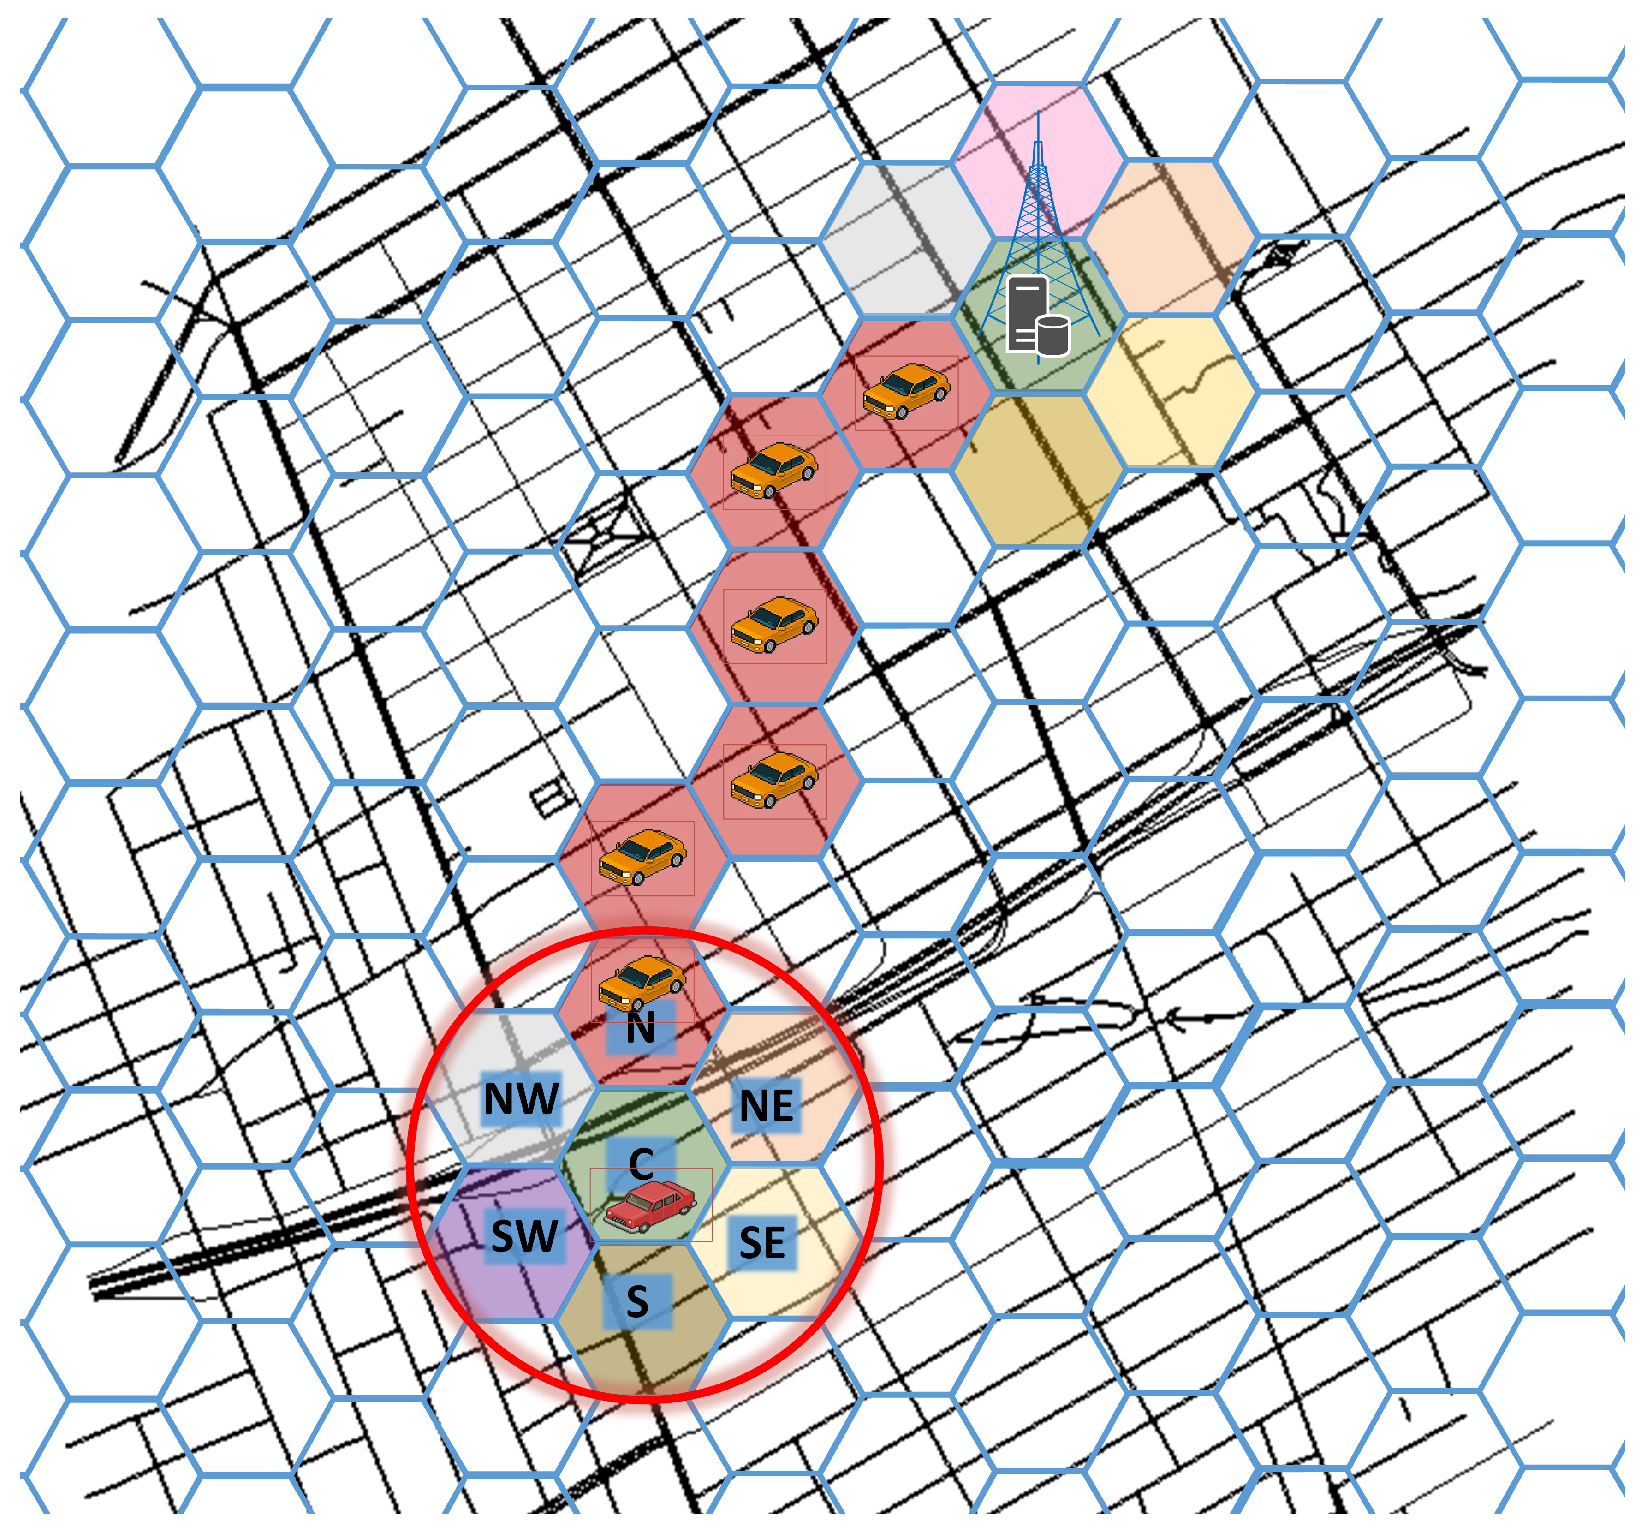
Our protocol discretizes the scenario in sectors with a hexagonal shape (Figure 1). Using this division, each vehicle populates its adjacent sectors with vehicles in its neighborhood. The messages are carried in multiple hops between adjacent sectors that contain at least one vehicle (relay) until reaching the destination (the red hexagons in Figure 1). Note that while there may be several paths between the origin and the destination, the algorithm chooses the path with the fewest hops. If desired, however, another metric for the graph weight, such as network or sector occupation, can easily be implemented in the presented solution.
3.1. Overview
FOXS-GSC is a congestion control service based FOXS. The major upgrade in FOXS-GSC is to the proposed communication protocol, allowing multi-hop communication.
FOXS-GSC uses the fog computing paradigm, which provides resources closer to devices; its advantages include low latency, wide geographical distribution, real-time interaction, mobility, scalability, and extensibility. Cloudlets are used to achieve this; these are fog computational entities with processing and communication capabilities. In the studied scenario, the cloudlets are integrated into a network infrastructure consisting of Roadside Units (RSUs). Cloudlets are capable of direct communication with other cloudlets using a direct link or via the internet.
FOXS-GSC permits the use of fewer cloudlets; thus, full map coverage is not necessary, as multi-hop communication is available between both vehicles and cloudlets. Using the proposed communication protocol, it is possible to place cloudlets only at those strategic points that serve the largest number of vehicles with the least number of hops between vehicles and cloudlets (e.g., highly dense road or crossroads). In addition, the distribution of cloudlets can be based on the computing load for improved load balancing.
The proposed protocol aims to send a message using multi-hop communication between two specific nodes. In the FOXS-GSC solution, the vehicle requests a route to cloudlet and responds to the vehicle requesting the new route. As a premise, all vehicles know the cloudlet’s geographic location on the map, meaning that a request message from the routing service is sent to the nearest cloudlet.
3.2. Sectorization of the Scenario
A regular hexagon is a polygon that has desirable properties for the proposed communication protocol. Hexagons have six sides and corners. In a regular hexagon, the size from the corner to the center is the same as the hexagon’s side. Moreover, hexagons have six adjacent neighbors, with equal distances between the center and the centers of all neighbors (see Figure 2).
Thanks to these characteristics, hexagons can uniformly cover the plane efficiently without overlapping; moreover, it is possible to circumscribe the hexagon and its adjacent neighbors regularly [31,32]. The center of the hexagon is shared with the center of the resulting circle.
As a definition, the radius of the circle that circumscribes the hexagon and its six adjacent neighbors is calculated such that the vehicle located in the central sector (Figure 2) can communicate with any vehicle located in the neighboring sectors.
An equation can be deduced to calculate a hexagon size that permits these communication characteristics. To do this, the hexagon is represented in a Cartesian plane (see Figure 2). The units are the distance between any corner and the hexagon’s center. The angle of two adjacent sides is 120 grades, the hexagon’s width (w) is
and its height (h) is
where is derived from sin(60).
A triangle is drawn on the plane that connects the most distant corners of two neighboring hexagons as the hypotenuse. The hypotenuse, represented by the , is the node’s communication coverage. The largest cathetus is represented by a and the smallest by b. Equations (5) and (6) present the cathetus size inferred concerning the Cartesian plane:
Finally, the Pythagorean theorem is applied as follows (Equation (7)):
Thus, the formula for calculating the size of the hexagon is obtained (Equation (8)):
For sectorization of the map, the Hexagonal Binning algorithm [33] is used, having as input the dimensions of the map and the hexagon height .
3.3. Neighborhood Knowledge Discovery
The proposed communication protocol uses a vehicle’s On-Board Unit (OBU) to acquire knowledge of neighboring vehicles that are at a distance of one hop. The OBU is a device with processing power mounted on vehicles that allows DSRC/802.11p communications with other OBUs and RSUs. Periodic vehicle beacons are sent out containing information such as the vehicle’s ID and current location. As vehicles already send beacons, increased network overhead is avoided.
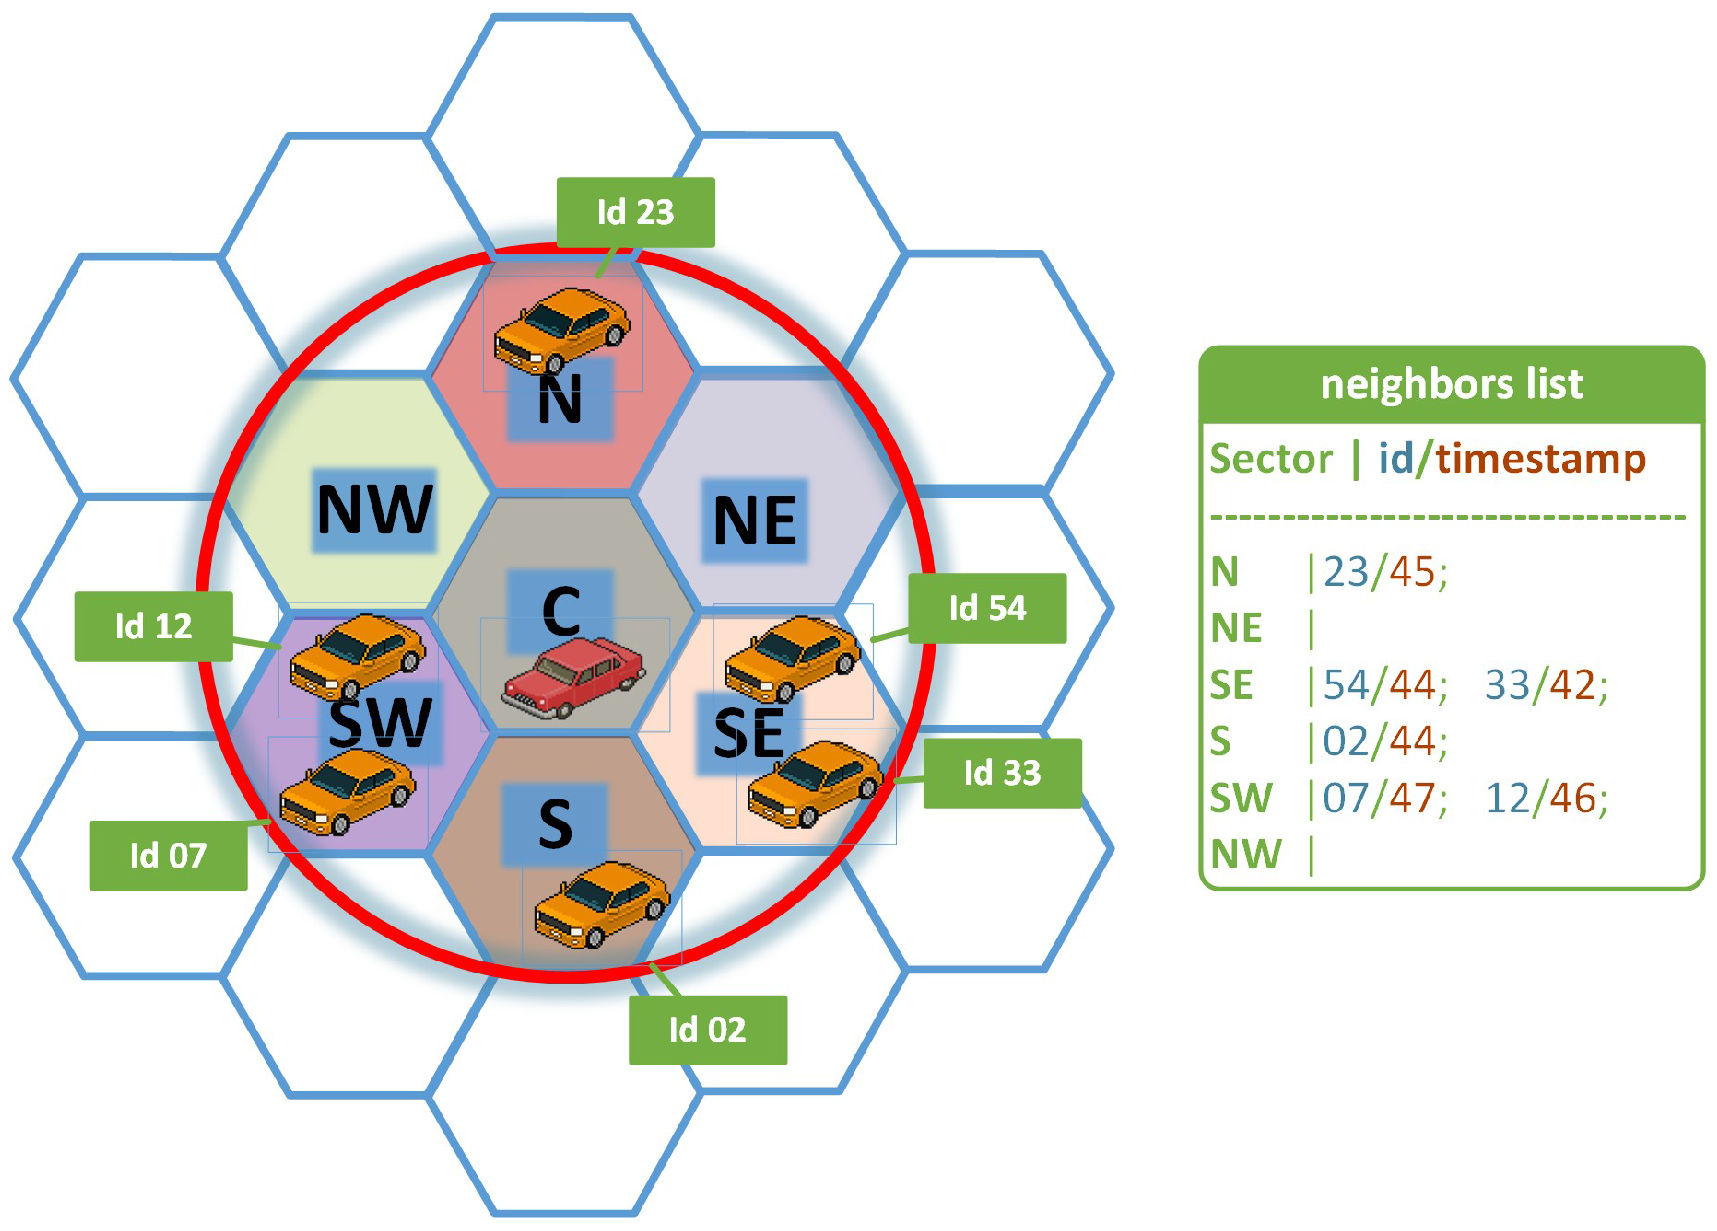
Upon receiving a beacon, the protocol stores the vehicle’s ID and location as well as the timestamp. The protocol stores this information in one of six lists representing the neighboring sectors (N, NE, SE, S, SW, NW) of the receiving vehicle according to the current position of the vehicle that sent the beacon. Figure 3 shows the vehicle positions and sectors and the neighbor list with the vehicle IDs and timestamps.
The lists containing the aforementioned information are used to choose the next hop for message transmission. However, information from neighbors quickly becomes out of date due to vehicle mobility. Thus, the list must be constantly updated within a periodic update window. The update period was estimated according to the average time required for a vehicle to change sectors at an average speed for a given scenario. For example, in a scenario with an average speed of 54 km/h (15 m/s), the time required for a vehicle to leave a sector with a size of 160 m where it is located in the center is approximately 5 s. Several works have estimated a similar update window and used it to generate satisfactory results [20,24,25].
3.4. Dissemination Process
The message forwarding process is performed by choosing the most suitable vehicle to forward (relay) the message to the destination node. FOXS-GSC has two wireless communicating components, namely, cloudlets and vehicles. Cloudlets receive messages directed to them that originate from a vehicle. Cloudlets process these messages, and respond to the originating vehicle when the message is a route request. In addition, cloudlets exchange messages with other cloudlets to update traffic conditions. Vehicles send periodic messages containing information about road conditions, and when necessary send a route request to the cloudlets. Moreover, vehicles can work as relay nodes to retransmit messages according to the proposed protocol rules.
The proposed protocol has two routing methodologies. These methodologies are related to the destination of the message sent. If the message is directed to a cloudlet (e.g., requests for routes or road conditions), the only information about the destination is the cloudlet’s geographical position. As cloudlets in FOXS-GSC only send messages to specific vehicles when requested, the response message (e.g., new route) to the vehicle contains the list of all relay nodes used to forward the message to the destination.
The proposed protocol adds the following information to the original message presented in Table 2.
3.5. Message Routing Addressed to Cloudlet
This routing method occurs when only the destination’s geographical location is known, that is, when a message is sent to a cloudlet. When a vehicle prepares a message addressed to cloudlet, it checks whether the cloudlet is within its communication coverage. If it is, the message is sent directly; otherwise, it is necessary to use the proposed multi-hop communication protocol.
The proposed multi-hop protocol uses the prior knowledge of the cloudlets’ geographical locations and the knowledge on neighboring nodes acquired through their received beacons. Figure 1 presents the discretized scenario and the behavior of the proposed protocol. As can be seen, the vehicle in sector C wants to send a message to the nearest RSU. When the routing process starts, it is necessary to check which neighbor sectors have at least one vehicle and which sectors have been visited in order to avoid looping. Therefore, to find the best path to the destination, the protocol performs high-level routing using the shortest path algorithm (e.g., Dijkstra) in the graph representing the sectors discretized in the scenario. When the next sector is chosen, one vehicle located in this sector is selected and the message is addressed to it. This method is executed at each hop by the respective relay until reaching the destination. Algorithm 1 formalizes this protocol.
In Algorithm 1, the initial node is the sector in which the vehicle is located and the final node is the destination cloudlet sector. The other input parameters are the neighbor list, the list of hexagons and their positions, the list of cloudlet IDs and positions, the list of vehicle IDs and position, and the current sector (lines 1 to 3).
| Algorithm 1: Next Sector Chooser |
 |
To avoid the protocol choosing a sector that does not have any vehicles or creating a loop when the message is routed to the destination, sector nodes can be removed from the hexagon sector graph in certain cases. The first case is presented in Algorithm 1, line 6, where the algorithm checks which neighboring list () contain at least one active vehicle. Neighboring sectors that do not have any vehicles are temporarily removed from the sector graph. In the second case (Algorithm 1, line 9), all sectors contained in the list received in the message to be retransmitted are temporarily removed from the graph ().
In this way, the next hop is chosen based on the shortest path between the current sector and the destination sector (see Algorithm 1, line 16). After choosing the sector, the algorithm verifies whether more than one vehicle is a relay candidate in this sector. If this is the case, the vehicle with the most recent beacon is chosen as a relay (see Algorithm 1, line 12). Finally, the message field is updated (see Algorithm 1, lines 13 to 16). During the message retransmission process, note that the ID of vehicle relays and visited sectors are stored in the lists and , respectively (see Algorithm 1, lines 15, 16). This process is repeated until reaching the destination. In addition to being used in the above method, these lists are used in the service response message process, which is presented in Section 3.6.
In case of retransmission errors, the proposed protocol includes a recovery mode. The recovery technique is similar to the backtracking technique, in which the previous relay tries a different sector nearer by (if any exists) if a relay node does not have any neighboring sectors containing vehicles suitable for retransmission. In this technique, a timer is triggered for each message sent. If the vehicle does not listen to the retransmission within this period, the message is updated (the (1) is added and the sector previously used for transmission is placed in the list) and the process of choosing a new next-hop sector for retransmission is initiated (Algorithm 1). The is used to limit the number of backtracking steps.
Figure 4 shows a flowchart describing the behavior of the protocol when sending the message from a vehicle to a cloudlet. The protocol receives a message (MSG) that can originate from the vehicle itself (e.g., a route request) or be a retransmission message from a neighboring vehicle (stage A in Figure 4). The protocol first checks whether the message is destined for an adjacent sector (B). If it is, the message is sent directly (G). Otherwise, Algorithm 1 is executed to choose a retransmission node (C), then MSG is sent (D). After sending the message in stage (D), a timer is activated to wait for retransmission by the relay node chosen by Algorithm 1 (E). If the message has been listened to, the protocol returns to the beginning and starts again (H). If not, recovery mode is activated (F) and the protocol checks whether is less than a defined N value. If it is, the (1) is added and Algorithm 1 is executed again (C). If not, the protocol proceeds to (H). When stage (H) is reached, the protocol returns to stage (A) to wait for a new message.
3.6. Response Message Routing
The response routing method is used when the hops (relays) necessary to reach the destination node are known. For the FOXS-GSC case, this method is used when a new route for the requesting vehicle is answered. As the service response time is sufficiently fast compared to network topology changes (vehicles moving), the requesting vehicle’s response message uses the list of relay nodes (MSG.) contained in the request message.
Figure 5 shows a flowchart describing the protocol’s behavior when sending a message from a cloudlet to a vehicle. In stage (A), the protocol receives a message (MSG) created by the cloudlet service (e.g., route response) or a retransmission message where the vehicle that received the message is a relay. At each retransmission of the response message, the protocol removes the last ID from the list and copies its value to the next hop field (MSG.) (B). Afterwards, it checks whether the next hop is the destination (B). If it is, the message is transmitted and the protocol is finalized. Otherwise, the message is sent (D) and a timer is activated to wait for the retransmission of the message on the next hop (E).
This methodology is applied due to the likelihood of a transmission failure (e.g., topology change). Thus, the recovery mode is used. The timer is set to 100 ms, which is the time for two-channel changes in the 802.11p protocol. If the message is listened to, the protocol ends. Otherwise, recovery mode is activated (F). Thus, the message is updated, consecutively removing all visited sectors and vehicles from MSG. and MSG.. After this, the retransmission process is switched to the protocol phase presented in the previous step in Section 3.5. When stage (H) is reached, the flow returns to the beginning and starts again.
This is possible because the relayed message contains the destination vehicle sector and the fact that the response time is sufficiently fast to ensure that the vehicle is located in the same sector as it was when it sent the original requisition message.
With the communication protocol defined, the next subsection presents the vehicle routing service that uses this protocol. The vehicle routing service used here is an improvement on the FOXS service [15]. FOXS is a vehicle route suggestion service based on the fog computing paradigm. In its operation, the scenario is sectorized; each sector contains a fog-based infrastructure with storage, computation, and communication capabilities, referred to as a cloudlet. The size of the sectors is based on the communication radius of the cloudlets. Each cloudlet is responsible for acquiring, classifying, and routing the vehicles within its sector.
Among the main changes we introduce are the use of multi-hop communication between vehicles and infrastructure, the method of acquiring traffic knowledge, and the service’s ability to work autonomously when the infrastructure is unreachable.
3.7. FOXS-GSC Route Service Operation
The FOXS-GSC route service operation is divided into two stages: (i) data gathering and data processing, in which data transmission and road traffic classification occur; and (ii) service delivery, in which the proposed algorithms and techniques are used to compute new routes and deliver them to users.
3.7.1. Data Gathering and Data Processing
The information acquisition process is carried out as follows. Vehicles periodically send a message () with aggregated data (average speed and occupation) of roads in their sectors to a nearby cloudlet to acquire knowledge of road conditions. To aggregate a vehicle’s knowledge of the roads in its current sector, a beacon message is sent containing the vehicle’s ID and position along with data about the road on which it is traveling. The vehicles that receive this beacon store the data for aggregation with data acquired from other beacon messages. Data aggregation is performed using the Exponential Moving Average (EMA) technique, as described in [15], to obtain the updated road weight.
Vehicles periodically send information about the roads in their current sector to the nearest cloudlet.
To prevent several vehicles in the same sector sending similar information in a short period, the following procedure is illustrated in Figure 6. All vehicles in the scenario schedule to send messages in N seconds (two vehicle beacons and a time of 4s each was used) for a message containing data on the roads in their sector. When this time is reached, the message is sent and the counter restarts (Figure 6 stage A). When vehicles inside the same sector listen to a message with aggregated information, they aggregate the new information and reschedule message dissemination for the next N-second interval (Figure 6, stage B).
During the transmission of aggregated messages to the cloudlet, vehicles within the communication radius of the relay vehicles listen to the message. Therefore, the vehicles collect the information contained in the message about the conditions of the roads in the originating sector of the message. This information is needed for the congestion control process presented in the next step (Section 3.7.2, Service Delivery).
As cloudlets only receive knowledge on the sectors closest to their geographical position, road condition information is shared among all cloudlets in order to provide full knowledge of the scenario. For this, a FOXS publish/subscribe protocol based on MQTT (Message Queuing Telemetry Transport, described in [15]) is used.
3.7.2. Service Delivery
In this stage, the FOXS-GSC congestion control process is carried out. A route request decision can be made by vehicles in two possible situations: first, route requests may occur periodically for congestion prevention and balancing traffic, for which the cloudlets use a congestion control algorithm; second, road information acquired by vehicles according to the previous step may verify congestion on a road to which the vehicle is traveling. In both situations, the vehicle in question requests a new route from the nearest cloudlet. The cloudlet that receives the request executes a Boltzmann probabilistic congestion control algorithm (presented in [15]), then answers by providing a new route to the requesting vehicle using the proposed communication protocol.
However, for several reasons, the requested vehicle route message may not reach the nearest cloudlet, including network congestion causing packet loss or there being too few vehicles on the network to allow communication between the source and the destination. In light of this problem, when requesting a new route the vehicle starts a timer using the timestamp of the beacon. After reaching the time limit, the vehicle infers that the message has been lost. In this case, if the cloudlet is in coverage the message is sent again; otherwise, the vehicle performs the routing on its own using the local knowledge obtained in the step presented in [15]. Local vehicle routing is less effective than the routing performed by cloudlet, as vehicles have only restricted knowledge of the road traffic conditions in the scenario.
4. FOXS-GSC Performance Evaluation
This section presents a performance evaluation conducted to validate the proposed FOXS-GSC solution. Simulations varying the number of RSUs and vehicle density were carried to analyze the efficiency of the proposed multi-hop communication protocol and route suggestion technique.
The experiments were divided into (i) network communication, (ii) scenario coverage evaluation, and (iii) traffic efficiency evaluation.
- (i)
- The network communication experiment was used to evaluate the impact of different vehicle densities on FOXS-GSC and other solutions (Flooding, DESTINy [16]) from the literature.
- (ii)
- The scenario coverage evaluation analyzed FOXS-GSC with respect to the impact of scenario coverage by varying the number of RSUs and their relationship with the scenario density.
- (iii)
- The traffic efficiency evaluation assessed the traffic efficiency of FOXS-GSC by varying the scenario coverage.
To conduct the experimental simulations, we used OMNeT++ 5 (Objective Modular Network Testbed) [34] for the network simulator and SUMO 0.25.0 simulator (Simulation of Urban Mobility) [35] for the traffic simulator. SUMO is an open-source traffic simulator framework which controls and models objects in a lane scenario. For the vehicular network, we used the Veins 4.3 (Vehicles in Network Simulation) framework [36]. Veins implements the IEEE 1609.4 DSRC/WAVE and IEEE 802.11p protocols and includes a signal attenuation model to consider obstacles. CO2 emissions and fuel consumption metrics were gathered by the EMIT model (described in HBEFA (http://www.hbefa.net, (accessed on 30 May 2023)), Handbook Emission Factors for Road Transport) integrated into SUMO. The evaluation was based on realistic scenarios, as the SUMO simulator can import real city maps through Open Street Maps (Open Street Maps is a free collaborative mapping project (http://www.openstreetmap.org/), (accessed on 30 May 2023)).
4.1. Network Evaluation
4.1.1. Methodology
This evaluation considered an area of 1 km2 from New York City, USA. The scenario configuration used vehicle densities of 50, 150, and 500 vehicles/km2. We used one RSU to obtain partial scenario coverage, allowing us to evaluate the efficiency of the proposed multi-hop solution.
The network parameters for all simulations were set to 18 Mbit/s at the MAC layer and a transmission power of 2.2 mW, resulting in coverage of approximately 300 m under a two-ray ground propagation model [36]. In the case where the simulation is stable (i.e., all vehicles are in the scenario), all vehicles periodically send a message to the nearest cloudlet; when a cloudlet receives a message, it sends a reply to the vehicle that sent the message. To prevent all vehicles from sending messages at the same time, a period is added using a random variable. This experiment simulates the behavior of the proposed service when a route is requested from the cloudlet, which then responds with a suggested route.
Table 3 shows the simulation parameters and values used in our evaluation.
The following metrics were considered to evaluate the performance of the proposed multi-hop data communication protocol:
- Total number of packets re-transmitted: displays the number of retransmissions required to reach the destination.
- Number of collisions per vehicle: the total number of collisions per vehicle in the system.
- Receive coverage: the percentage of vehicles that receive an answer at least once during the simulation time.
- Percentage of messages received: the percentage of messages sent that were answered.
4.1.2. Results
Figure 7a shows the number of messages re-transmitted. Flooding had the largest number of messages re-transmitted, with more than 135,000 messages in the scenario with 500 vehicles/km2. This occurs because Flooding does not have a broadcast suppression mechanism. The suppression mechanism of DESTINy, which is based on the distance to the destination, reduces the number of messages by 70% in comparison to Flooding. However, many messages continue to be generated until the message reaches the destination, reaching 90% higher than the FOXS-GSC with the same vehicle density. The average number of re-transmissions per message sent for FOXS-GSC is equal to the number of sectors on the path to the destination. Thus, the number of messages in the system is reduced.
Figure 7b shows the number of packet collisions relative to the number of vehicles. FOXS-GSC keeps the collision number stable in relation to the number of vehicles, with messages for a density of 500 vehicles/km2. Note that the number of collisions with Flooding (26,000 for the density of 500 vehicles/km2) grows much faster than that of DESTINy (8000 for 500 vehicles/km2) and FOXS-GSC. This is related to the large number of messages needing to be re-transmitted (see Figure 7a).
Figure 7c shows the percentage of vehicles that sent and received at least one message during the simulation. FOXS-GSC reached an average of 98% coverage. Flooding and DESTINy had significantly lower coverage with increasing vehicle density, covering only 33% and 64% of vehicles in the scenario with a density of 500 vehicles/km2. These values are corroborated by the high number of collisions when using these solutions. On the other hand, that FOXS-GSC is able to reach the entire monitored environment.
Figure 7d shows the percentages of messages sent and properly answered during the simulation. In the low-density scenario (50 vehicles/km2), the percentage of messages answered was 79% for FOXS-GSC, 65% for Flooding, and 60% for DESTINy. With increased density, FOXS-GSC maintained an average percentage of messages delivered at 74%, whereas the same value for Flooding and DESTINy was greatly reduced, falling below 20% with a density of 500 vehicles/km2. This is due to the large number of message collisions generated by these solutions. Thus, the proposed solution proves to be efficient in both the sparse scenario and the dense scenario.
4.2. Scenario Coverage Evaluation
4.2.1. Methodology
To assess the impact of the number of RSUs on the proposed protocol, these experiments were performed while varying both the number of RSUs and the density of the scenario. The scenario we used was the same as in the previous assessment (Manhattan 1 km2 with densities of 50, 150, 500 vehicles per km2). We varied the number of RSUs from one to four and then eight, with the scenario with eight RSUs providing full coverage of the scenario. The metrics evaluated were total packets re-transmitted, number of collisions per vehicle, receive coverage, and percentage of messages answered. These experiments worked similarly to the previous network evaluation experiment, with all vehicles periodically sending messages to the nearest cloudlet and the cloudlet responding to the vehicles. The simulation parameters and values used in this evaluation are presented in Table 3.
4.2.2. Results
In Figure 8b, it can be noted that the number of packet collisions increases with the need to use multi-hop communication, as more messages are needed to reach the destination that is the most distant. Note that the greater the RSU coverage, the fewer messages are needed to reach the goal.
Figure 8a shows the number of packets re-transmitted. It can be seen that, as expected, the lower the number of RSUs and the greater the density of vehicles, the greater the number of re-transmitted messages. The method applied by FOXS-GSC for interactive intersection routing manages to keep the number of messages in the system low even with a large number of vehicles and reduced RSU coverage.
FOXS-GSC has good coverage, as shown in Figure 8c. When vehicle density is low, problems such as network disconnection reduce the coverage area. This problem can be reduced by applying a transmission methodology such as store-carry-forward. The FOXS-GSC protocol uses this methodology for its congestion control service; however, it is not implemented here, as regions with low density have a low probability of traffic congestion.
As expected, the percentage of responses for messages sent (see Figure 8d) is higher when the number of RSUs is higher. When using one RSU with a vehicle density of 50 vehicles/km2, the number of collisions (76%) is influenced by the network partition problem. For a density of 500 vehicles/km2, the results are influenced by packet collisions, as shown in Figure 8b. Note the peak for a density of 150 vehicles/km2 in the scenario with one RSU; this is due to the fact that this scenario has a sufficient number of vehicles to avoid network partition without having enough for packet collisions to reduce the delivery rate.
4.3. Traffic Efficiency Evaluation
In this evaluation, we compared FOX-GSC with existing solutions from the literature, namely, DESTINy [16], CHIMERA [17], and PAN [18], the latter utilizing two different variations. The first variation, PAN1, involves computing a single route and assigning it to the vehicle. The second variation, PAN3, computes three routes and randomly selects one. Additionally, our solution was compared to a baseline scenario (base) without any vehicle routing solution and with Dynamic Shortest Path (DSP), which simply reroutes vehicles along the shortest path.
4.3.1. Methodology
For this evaluation, we chose the city of Ottawa, Canada. The scenario (Figure 9) was obtained from OpenStreetMap (http://www.openstreetmap.org/, (accessed on 30 May 2023)), and represents an area of 8 km2 in the downtown region. The Ottawa scenario has 2200 vehicles inserted during the simulation, representing a traffic jam, and 409.42 km of total road length. The mobility model we used was random origin–destination.
The network parameters were set to 18 Mbit/s at the MAC layer and the transmission power was set to mW. Table 4 shows the simulation parameters and values used in this evaluation.
The routing interval was set to 120 s for all solutions, and three alternative routes were used for FOXS-GSC, PAN3, and CHIMERA to obtain a more appropriate evaluation. This number of alternative routes was chosen because it had the best results for all solutions in the evaluated scenarios.
The following metrics were used to evaluate the different traffic congestion services:
- Traveled time: the average travel time from the starting point to the destination of all vehicles.
- Stopped time: the average time spent stuck in traffic jams for all vehicles.
- Average speed: the average speed of all vehicles.
- Traveled distance: the average distance that all vehicles traveled.
- Fuel consumption: the average fuel consumption of all vehicles that traversed the whole route.
- CO2 emission: the average CO2 emissions for all vehicles during their trip.
- PTI: the reliability of the ratio of the 95% travel time to the ideal flow on the same path.
- Route compute location: the respective percentages of the location where the route was computed (i.e., vehicle or cloudlet).
4.3.2. Results
Figure 10 shows the values and BASE related percentage of all metrics for the implemented solutions regarding traffic efficiency. For this evaluation, FOXS-GSC was compared with the DSP, PAN1, PAN3, and CHIMERA solutions. To evaluate FOXS-GSC in scenarios with different levels of coverage, we used 1, 23, and 50 RSUs, with 50 RSUs providing full scenario coverage. PAN1, PAN3, and CHIMERA, all used 50 RSUs to provide full coverage, as this was assumed in the original proposals.
Compared with the BASE results (see Figure 10a), the solutions from the literature reduced the stopped time metric by 16.17% (PAN1), 13.68% (PAN3), and 21.36% (CHIMERA), while the proposed FOXS-GSC protocol achieved a reduction of 22.01% with one RSU, 30.46% with 23 RSUs, and 39.14% with 50 RSUs. These results are primarily a reflection of the higher average speed metric achieved with FOXS-GSC (see Figure 10b), resulting in its reaching better performance compared to the other evaluated solutions even in the scenario with only one RSU.
In the scenarios with 1, 50, and 23 RSUs, FOXS-GSC increased the average speed by 9.04%, 13.44%, 17.47%, respectively. These results are due to the effectiveness of the road classification approach that FOXS-GSC implements and the probabilistic mechanism it uses to choose one of K alternative routes. It should be remarked that the DSP solution increased stopped time by 90% and reduced the average speed metric by 18% compared to BASE. This occurs because the routing algorithm that DSP implements simply uses the shortest path, resulting in its forwarding all of the vehicles to the same road, creating a new congestion point. The other evaluated solutions compute a new route based on the road conditions when necessary, thereby avoiding this problem.
Considering the average speed metric, the results for the PAN1 solution are 6.5% faster than BASE, while PAN3 achieves an increase of 5.1%. In this case, PAN3 has worse results than PAN1 because it computes three alternative routes and chooses one at random. However, in this scenario the second-best and third-best routes may have very different traffic jam conditions and route sizes compared to the best route considering the geography of this particular city map. FOXS-GSC is able to avoid this problem by choosing an alternative route using the route size factor parameter and the probability mechanism to reduce the chance of choosing a poor route. The travel time metric (see Figure 10c) presents similar behavior. FOXS-GSC more efficiently manages urban traffic, decreasing the travel time in the scenarios with 1, 23, and 50 RSUs by 12.14%, 17.34%, and 22.63%, respectively. With 50 RSUs, the results for FOX-GSC were twice as good as tose for CHIMERA, which reduced travel time by 11.73% when compared to the BASE solution.
Considering the traveled distance metric (see Figure 10d), only the DSP solution reduced the distance traveled compared to BASE (2.39%). This is due to DSP always choosing the shortest path, unlike other solutions, which use the traffic conditions when computing a new route. Regarding FOXS-GSC, in the scenarios with 1, 23, and 50 RSUs the alternative routes computed are not longer than the original ones (0.99%, 1.28%, and 0.39%, respectively). This is due to the route size factor parameter implemented by FOXS-GSC, which manages the maximum length of alternative routes.
Analyzing the fuel and CO2 emission consumption metrics (Figure 10e,f respectively), it can be noted that both of these metrics are directly influenced by the travel time, stopped time, and distance traveled. In analyzing these metrics, it is found that in the scenario with one RSU FOXS-GSC is able to reduce fuel consumption almost half and CO2 emissions by 4.25% when compared with second-best solution (CHIMERA, with 2.68%). In the scenario with 50 RSUs, FOXS-GSC reduces CO2 emissions by more than three times (10.27%).
The PTI metric, which evaluates the congestion control quality, is shown in Figure 11. FOXS-GSC with 1, 23, and 50 RSUs achieved the best PTI index results (, , and , respectively) among the evaluated solutions, further confirming its excellent performance, as with 50 RSUs FOXS-GSC achieved results 19% better than the next-best solution, CHIMERA.
For all metrics evaluated except distance traveled, FOX-GSC had increased performance in the scenario with larger coverage. This occurs because as coverage increases, more vehicles are able to communicate with the cloudlets, thereby receiving a more accurate route suggestions, as the cloudlets possess a global knowledge of the scenario. In the case of the distance traveled, in the scenario with 50 RSUs the cloudlets with full knowledge are always able to suggest the best and shortest route. For the scenario with 23 RSUs and the scenario with only one RSU, more vehicles need to compute the new route using only their own local knowledge. Thus, to avoid nearby congestion, FOXS-GSC sometimes takes a longer route. However, as shown, even in this case the mechanism that limits the size of the route keeps the distance traveled statistically similar to that in the PAN1, PAN3, and CHIMERA solutions.
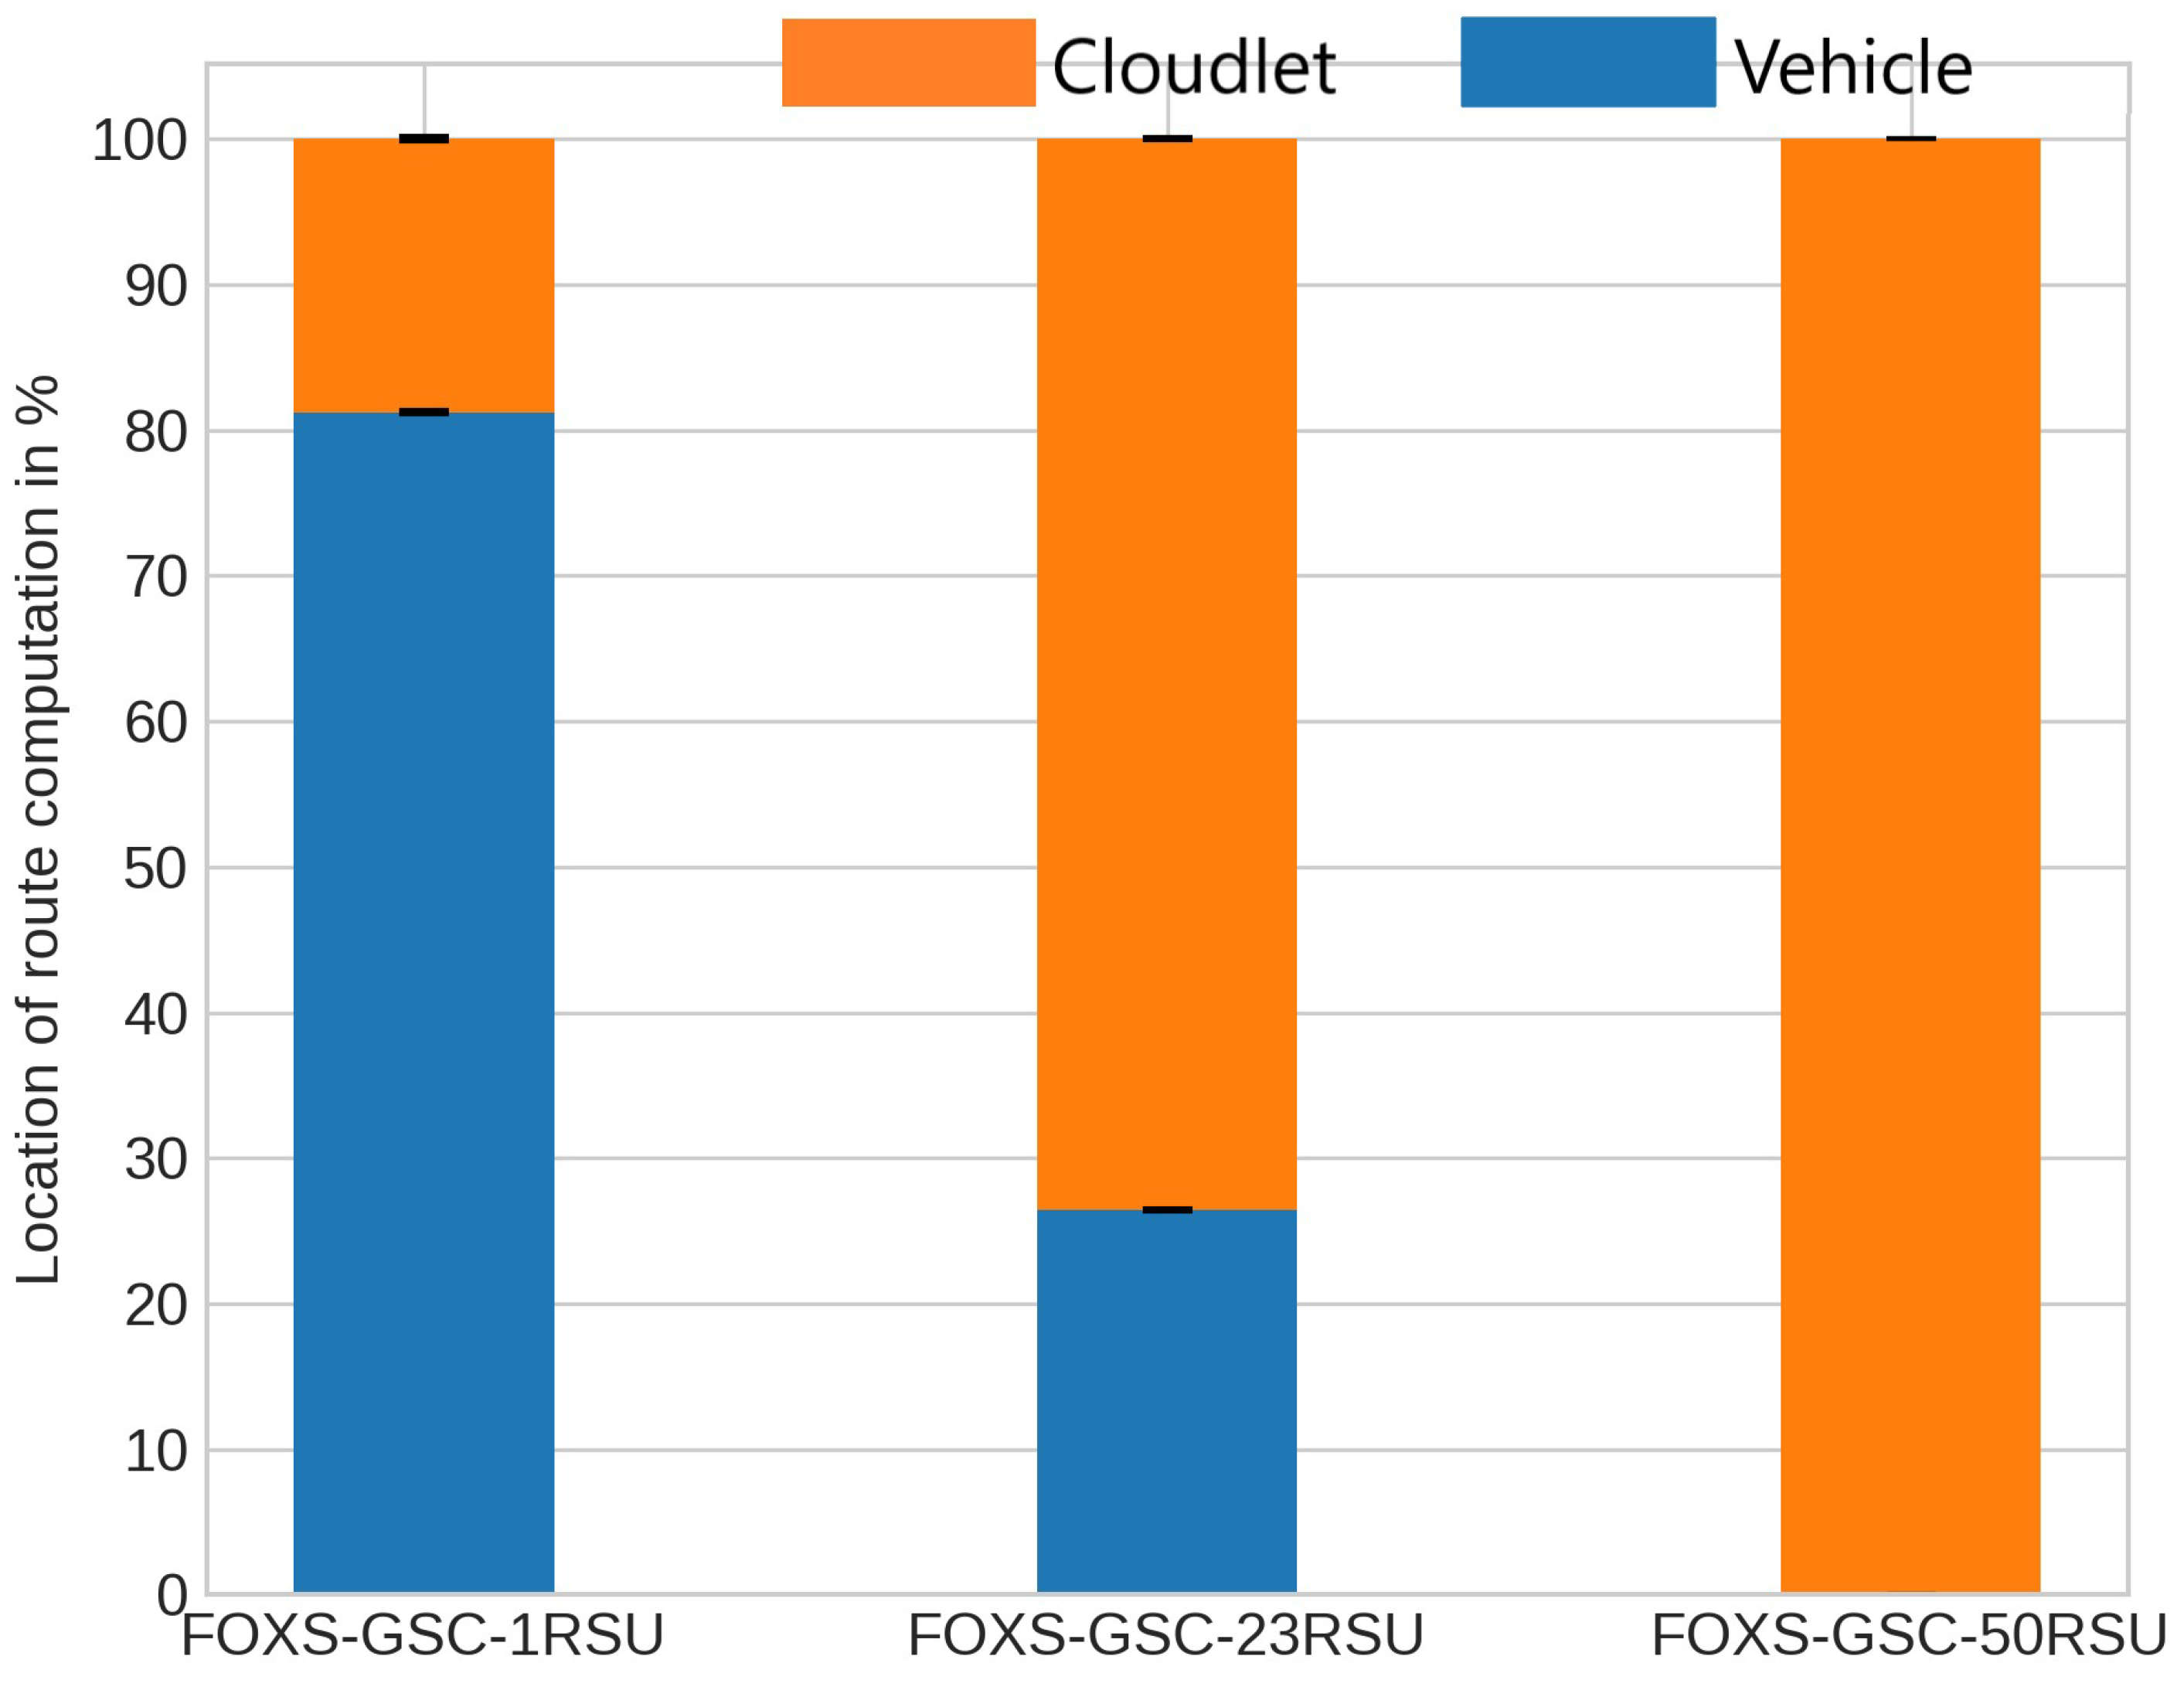
Figure 12 presents the percentages for the location where the route was computed (e.g., vehicle or cloudlet) for FOXS-GSC when varying the scenario coverage using 1, 23, and 50 RSUs. As expected, the number of RSUs covering the scenario impacts how many vehicles need to compute their own route; thus, better coverage provides better traffic management, as shown in Figure 10 and Figure 11. Using these results, traffic engineers can make appropriate trade-offs between the cost of implementing cloudlets and the effective gain realized by improving traffic flow.
5. Conclusions
This article has presented FOXS-GSC, a decentralized traffic service for route suggestion that uses a distributed multi-hop communication protocol. The proposed multi-hop protocol efficiently allows vehicles to communicate with an RSU that is not in coverage range. The protocol sectorizes the scenario using hexagons. Messages are carried along a path between the origin and destination using the sectors occupied by vehicles. When unable to communicate with an RSU, vehicles are able to calculate their own alternative route, thereby reducing infrastructure dependency.
Several experiments were executed to show the efficiency of the proposed communication protocol and traffic service. These experiments showed the packet collision when using FOXS-GSC remained low even when the density of the scenario increased, having up to 95% fewer collisions than the other tested solutions. Similar behavior was observed for the receive coverage and packets transmitted. In regard to traffic efficiency, the proposed protocol reduced related several drawbacks: a 39% reduction in stopped time, 10% reduction in carbon emission, and 19% reduction in PTI.
The proposed routing service shows good results even when there is no communication with the RSU. Our results in scenario with varied levels of RSU distribution show that the coverage influences the quality of the solution. However, the multi-hop protocol developed in this research alleviates this problem. As seen in our experiments, despite a difference in results of up to 50% for FOXS-GSC between the scenario with minimum coverage and the scenario with full coverage, in the scenario with minimum coverage FOXS-GSC obtained better results than the other compared solutions. These results show that a routing service is highly dependent on the dissemination of traffic data within the network. One of the key factors in the good results obtained in this study was the integration of the routing service and the sectored multi-hop protocol, which takes into account relevant data for the routing service such as the traffic density of the region. Continuing this general analysis, it is possible to infer from the results obtained in this research that, in addition to the importance of the density of the region, a trade-off must be observed between the cost of implementing the infrastructure and the effective gain in improved traffic flow.
The proposed solution does have several limitations, although these can serve as a guide for future research directions. A deeper study involving traffic engineers and urban specialists is necessary to determine an effective RSU distribution that considers the communication radius and whether there are roads within its coverage. Additionally, it is necessary to verify the feasibility of implementing Roadside Units (RSUs) by assessing locations where they can be deployed while ensuring compliance with regional laws and regulations. The routing mechanisms used in the proposed solution only detect existing congestion or congestion that is on the verge of forming. Therefore, the vehicle route suggestions are limited, and could use a more detailed prediction service based on the history and patterns of traffic behavior. The FOXS-GSC multi-hop communication protocol was developed based on the requirements of the router service, and this protocol has the limitation of not addressing the network partition problem. Finally, implementing methodologies in the FOX-GSC communication protocol that offer privacy and security for the transmitted data while maintaining low computation overhead and low communication overhead, such as the methods proposed in [37,38], is desirable for application in real-world environments.
In our future work, we plan to execute experiments considering different scenarios and extend the service to include mobile fog computing nodes (e.g., buses), thereby removing the need for full coverage. Buses are a plausible choice for mobile nodes, as they have a predefined route, making it possible to schedule services according to this route. In addition, the proposed algorithm for distributing the RSUs in the scenario based on the demand across different sectors can potentially reduce the number of hops necessary for vehicles to communicate.
Author Contributions
Conceptualization, C.A.R.L.B.; methodology, C.A.R.L.B., G.P.R.F. and R.M.; formal analysis, C.A.R.L.B.; writing–original draft preparation, C.A.R.L.B.; writing–review and editing, Brennand, G.P.R.F. and R.M. All authors have read and agreed to the published version of the manuscript.
Funding
This research was funded by São Paulo Research Foundation (FAPESP), grants #2020/07162-0, #2021/06210-3.
Institutional Review Board Statement
Not applicable.
Informed Consent Statement
Not applicable.
Data Availability Statement
Not applicable.
Conflicts of Interest
The authors declare no conflict of interest.
References
- Rodrigues, D.; Severino, J.N.; Cristiani, A.L.; Costa, F.T.M.; Nakamura, L.H.V.; Meneguette, R.I. A Low-Cost Vehicular Infrastructure of Monitoring and Communicating Information for Intelligent Transport Systems. J. Comput. Sci. 2019, 15, 930–943. [Google Scholar] [CrossRef] [Green Version]
- Meneguette, R.I. Intelligent Transport System in Smart Cities: Aspects and Challenges of Vehicular Networks and Cloud; Springer: Cham, Switzerland, 2018. [Google Scholar]
- World Health Organization. Global Status Report on Road Safety 2018: Summary; Technical report; World Health Organization: Geneva, Switzerland, 2018. [Google Scholar]
- Chen, S.; Kuhn, M.; Prettner, K.; Bloom, D.E. The global macroeconomic burden of road injuries: Estimates and projections for 166 countries. Lancet Planet. Health 2019, 3, e390–e398. [Google Scholar] [CrossRef] [PubMed]
- Instituto de Pesquisa Econômica Aplicada. Acidentes de Trânsito nas Rodovias Federais Brasileiras. Caracterização, Tendências e Custos Para a Sociedade; Instituto de Pesquisa Econômica Aplicada: Brasilia, Brazil, 2015.
- De Souza, A.M.; Brennand, C.A.; Yokoyama, R.S.; Donato, E.A.; Madeira, E.R.; Villas, L.A. Traffic management systems: A classification, review, challenges, and future perspectives. Int. J. Distrib. Sens. Netw. 2017, 13, 1550147716683612. [Google Scholar] [CrossRef]
- Correa, C.; Ueyama, J.; Meneguette, R.I.; Villas, L.A. VANets: An Exploratory Evaluation in Vehicular Ad Hoc Network for Urban Environment. In Proceedings of the 2014 IEEE 13th International Symposium on Network Computing and Applications, Cambridge, MA, USA, 21–23 August 2014; IEEE: Toulouse, France, 2014; pp. 45–49. [Google Scholar] [CrossRef]
- Brennand, C.A.R.L.; De Souza, A.M.; Maia, G.; Boukerche, A.; Ramos, H.; Loureiro, A.; Villas, L.A. An Intelligent Transportation System for Detection and Control of Congested Roads in Urban Centers. In Proceedings of the 2015 IEEE Symposium on Computers and Communications (ISCC), Larnaca, Cyprus, 6–9 July 2015; IEEE: Toulouse, France, 2015; pp. 476–481. [Google Scholar] [CrossRef]
- Allen, H.; Millard, K.; Stonehill, M. A summary of the proceedings from the united nations climate change conference in doha qatar and their significance for the land transport sector. In Proceedings of the Copenhagen: Bridging the Gap (BtG) Initiative, Doha, Qatar, 1 September 2013. [Google Scholar]
- Schrank, D.; Eisele, B.; Lomax, T.; Bak, J. 2015 Urban Mobility Scorecard, Mobility Report; Texas Transportation Institute: Bryan, TX, USA, 2015.
- Silva, T.H.; Viana, A.C.; Benevenuto, F.; Villas, L.; Salles, J.; Loureiro, A.; Quercia, D. Urban Computing Leveraging Location-Based Social Network Data: A Survey. ACM Comput. Surv. 2019, 52, 1–39. [Google Scholar] [CrossRef]
- Brennand, C.A.R.L.; Cunha, F.; Maia, G.; Cerqueira, E.; Loureiro, A.; Villas, L.A. FOX: A Traffic Management System of Computer-Based Vehicles FOG. In Proceedings of the 2016 IEEE Symposium on Computers and Communications (ISCC), Messina, Italy, 27–30 June 2016; IEEE: Toulouse, France, 2016; pp. 982–987. [Google Scholar] [CrossRef]
- Meneguette, R.I.; Boukerche, A.; Maia, G.; Loureiro, A.A.; Villas, L.A. A Self-Adaptive Data Dissemination Solution for Intelligent Transportation Systems. In Proceedings of the 11th ACM Symposium on Performance Evaluation of Wireless Ad Hoc, Sensor, & Ubiquitous Networks, PE-WASUN’14, Montreal, QC, Canada, 21–26 September 2014; ACM: New York, NY, USA, 2014; pp. 69–76. [Google Scholar] [CrossRef]
- Brennand, C.A.R.L.; Boukerche, A.; Meneguette, R.; Villas, L.A. A novel urban traffic management mechanism based on FOG. In Proceedings of the 2017 IEEE Symposium on Computers and Communications (ISCC), Heraklion, Greece, 3–6 July 2017; IEEE: Toulouse, France, 2017; pp. 377–382. [Google Scholar] [CrossRef]
- Brennand, C.A.R.L.; Filho, G.P.R.; Maia, G.; Cunha, F.; Guidoni, D.L.; Villas, L.A. Towards a Fog-Enabled Intelligent Transportation System to Reduce Traffic Jam. Sensors 2019, 19, 3916. [Google Scholar] [CrossRef] [PubMed] [Green Version]
- Lourenço, M.; Souza, F.S.; Silva, C.M.; Meneguette, R.I.; Guidoni, D.L. A Hybrid V2I and V2V Approach for Urban Traffic Management in Vehicular Networks. In Proceedings of the 2019 IEEE Latin-American Conference on Communications (LATINCOM), Salvador, Brazil, 11–13 November 2019; IEEE: Toulouse, France, 2019; pp. 1–6. [Google Scholar]
- de Souza, A.M.; Yokoyama, R.S.; Maia, G.; Loureiro, A.; Villas, L. Real-time path planning to prevent traffic jam through an intelligent transportation system. In Proceedings of the2016 IEEE Symposium on Computers and Communication (ISCC), Messina, Italy, 27–30 June 2016; IEEE: Toulouse, France, 2016; pp. 726–731. [Google Scholar]
- Pan, J.; Popa, I.S.; Zeitouni, K.; Borcea, C. Proactive vehicular traffic rerouting for lower travel time. IEEE Trans. Veh. Technol. 2013, 62, 3551–3568. [Google Scholar] [CrossRef] [Green Version]
- da Cunha, F.D.; Villas, L.; Boukerche, A.; Maia, G.; Viana, A.C.; Mini, R.A.F.; Loureiro, A.A.F. Data communication in VANETs: Protocols, applications and challenges. Ad Hoc Netw. 2016, 44, 90–103. [Google Scholar] [CrossRef]
- Tonguz, O.; Wisitpongphan, N.; Bai, F. DV-CAST: A distributed vehicular broadcast protocol for vehicular ad hoc networks. Wirel. Commun. IEEE 2010, 17, 47–57. [Google Scholar] [CrossRef]
- Schwartz, R.S.; Barbosa, R.R.; Meratnia, N.; Heijenk, G.; Scholten, H. A directional data dissemination protocol for vehicular environments. Comput. Commun. 2011, 34, 2057–2071. [Google Scholar] [CrossRef]
- Viriyasitavat, W.; Tonguz, O.; Bai, F. UV-CAST: An urban vehicular broadcast protocol. IEEE Commun. Mag. 2011, 49, 116–124. [Google Scholar] [CrossRef]
- Ros, F.; Ruiz, P.; Stojmenovic, I. Acknowledgment-Based Broadcast Protocol for Reliable and Efficient Data Dissemination in Vehicular Ad Hoc Networks. Mob. Comput. IEEE Trans. 2012, 11, 33–46. [Google Scholar] [CrossRef]
- Villas, L.A.; Boukerche, A.; Maia, G.; Pazzi, R.W.; Loureiro, A.A. DRIVE: An efficient and robust data dissemination protocol for highway and urban vehicular ad hoc networks. Comput. Netw. 2014, 75, 381–394. [Google Scholar] [CrossRef]
- da Costa, J.B.; de Souza, A.M.; Rosário, D.; Cerqueira, E.; Villas, L.A. Efficient data dissemination protocol based on complex networks’ metrics for urban vehicular networks. J. Internet Serv. Appl. 2019, 10, 15. [Google Scholar] [CrossRef] [Green Version]
- Meneguette, R.I.; Maia, G.; Madeira, E.R.; Loureiro, A.A.; Villas, L.A. Autonomic data dissemination in highway Vehicular Ad Hoc Networks with diverse traffic conditions. In Proceedings of the 2014 IEEE Symposium on Computers and Communications (ISCC), Funchal, Portugal, 23–26 June 2014; IEEE: Toulouse, France, 2014; pp. 1–6. [Google Scholar]
- Cunha, F.D.; Maia, G.G.; Viana, A.C.; Mini, R.A.; Villas, L.A.; Loureiro, A.A. Socially inspired data dissemination for vehicular ad hoc networks. In Proceedings of the 17th ACM International Conference on Modeling, Analysis and Simulation of Wireless and Mobile Systems, Montreal, QC, Canada, 21–26 September 2014; ACM: New York, NY, USA, 2014; pp. 81–85. [Google Scholar]
- Akabane, A.T.; Pazzi, R.W.; Madeira, E.R.; Villas, L.A. CARRO: A context-awareness protocol for data dissemination in urban and highway scenarios. In Proceedings of the 2016 8th IEEE Latin-American Conference on Communications (LATINCOM), Medellin, Colombia, 15–17 November 2016; IEEE: Toulouse, France, 2016; pp. 1–6. [Google Scholar]
- Singh, A.K.; Pamula, R.; Jain, P.K.; Srivastava, G. An efficient vehicular-relay selection scheme for vehicular communication. Soft Comput. 2023, 27, 3443–3459. [Google Scholar] [CrossRef]
- Rizwan, A.; Karras, D.A.; Dighriri, M.; Kumar, J.; Dixit, E.; Jalali, A.; Mahmoud, A. Simulation of IoT-based vehicular ad hoc networks (VANETs) for smart traffic management systems. Wirel. Commun. Mob. Comput. 2022, 2022, 3378558. [Google Scholar] [CrossRef]
- Ball, P. How honeycombs can build themselves. Nature 2013, 10, 1–5. [Google Scholar] [CrossRef]
- Li, T.; Xia, M.; Chen, J.; Gao, S.; De Silva, C. A hexagonal grid-based sampling planner for aquatic environmental monitoring using unmanned surface vehicles. In Proceedings of the 2017 IEEE International Conference on Systems, Man, and Cybernetics (SMC), Banff, AB, Canada, 5–8 October 2017; IEEE: Toulouse, France, 2017; pp. 3683–3688. [Google Scholar]
- Carr, D.B.; Littlefield, R.J.; Nicholson, W.L.; Littlefield, J.S. Scatterplot Matrix Techniques for Large N. J. Am. Stat. Assoc. 1987, 82, 424–436. [Google Scholar] [CrossRef]
- OMNET++. OMNeT++ Network Simulation Framework. Available online: http://omnetpp.org/ (accessed on 1 February 2023).
- Behrisch, M.; Bieker, L.; Erdmann, J.; Krajzewicz, D. SUMO—Simulation of Urban MObility: An Overview. In Proceedings of the International Conference on Advances in System Simulation (SIMUL’11), Barcelona, Spain, 23–29 October 2011; ThinkMind: Coimbatore, India, 2011; pp. 63–68. [Google Scholar]
- Sommer, C.; German, R.; Dressler, F. Bidirectionally Coupled Network and Road Traffic Simulation for Improved IVC Analysis. IEEE Trans. Mob. Comput. 2011, 10, 3–15. [Google Scholar] [CrossRef] [Green Version]
- Liu, Z.; Ma, J.; Weng, J.; Huang, F.; Wu, Y.; Wei, L.; Li, Y. LPPTE: A lightweight privacy-preserving trust evaluation scheme for facilitating distributed data fusion in cooperative vehicular safety applications. Inf. Fusion 2021, 73, 144–156. [Google Scholar] [CrossRef]
- Liu, Z.; Weng, J.; Guo, J.; Ma, J.; Huang, F.; Sun, H.; Cheng, Y. PPTM: A Privacy-Preserving Trust Management Scheme for Emergency Message Dissemination in Space–Air–Ground-Integrated Vehicular Networks. IEEE Internet Things J. 2021, 9, 5943–5956. [Google Scholar] [CrossRef]
Figure 1.
Hexagonal multhop communication.

Figure 2.
Hexagon properties.

Figure 3.
Vehicle sectors and neighbor list.

Figure 4.
Flowchart of message routing addressed to a cloudlet.

Figure 5.
Flowchart of response message routing.

Figure 6.
State diagram for sending aggregated information message.

Figure 7.
Results of comparative evaluation between FOXS-GSC and other solutions from the literature: (a) total of packets re-transmitted; (b) number of collisions per vehicle; (c) receive coverage (%); (d) percentage of messages returned.
Figure 7.
Results of comparative evaluation between FOXS-GSC and other solutions from the literature: (a) total of packets re-transmitted; (b) number of collisions per vehicle; (c) receive coverage (%); (d) percentage of messages returned.

Figure 8.
Network comparison results with different levels of RSU coverage: (a) total number of packets re-transmitted; (b) number of collisions per vehicle; (c) receive coverage (%); (d) percentage of messages returned.
Figure 8.
Network comparison results with different levels of RSU coverage: (a) total number of packets re-transmitted; (b) number of collisions per vehicle; (c) receive coverage (%); (d) percentage of messages returned.

Figure 9.
Topology of the Ottawa scenario.

Figure 10.
Traffic efficiency comparison results: (a) stopped time; (b) average speed; (c) traveled time; (d) traveled distance; (e) fuel consumption; (f) CO2 emissions.
Figure 10.
Traffic efficiency comparison results: (a) stopped time; (b) average speed; (c) traveled time; (d) traveled distance; (e) fuel consumption; (f) CO2 emissions.

Figure 11.
Planning Time Index (PTI).

Figure 12.
Percentages of the location where the route was computed (vehicle or cloudlet).


Table 1.
Comparison of related solutions.
| Work | Geolocation Routing | Story-Carry-Forward | Fault Recovery | Broadcast Suppression | Router Service Dedicated | Scenario |
|---|---|---|---|---|---|---|
| DV-CAST [20] | X | V | X | delay vehicle direction | X | highway |
| UV-CAST [22] | X | V | X | intersection vehicles | X | urban/highway |
| DRIVE [24] | X | X | X | delay sweet spot | X | urban/highway |
| ADDHV [26] | X | V | X | delay sweet spot | X | urban/highway |
| CARRO [28] | X | V | X | delay sweet spot | X | urban/highway |
| CC-DEGREE [27] | X | X | X | clustering coefficient | X | urban |
| DDRX [25] | X | X | X | complex network metrics | X | urban |
| DESTINy [16] | V | V | X | closeer destination vehicle | X | urban |
| Singh-VDTN [29] | X | V | X | controlled packet replicas | X | urban |
| DDP4V [30] | V | V | X | sections zones | X | urban/highway |
| FOXS-GSC | V | X | backtracking | populated sectors | V | urban/highway |
Table 2.
Protocol message format (MSG).
| Field | Description |
|---|---|
| origin_sector | sector that the initial node is within |
| origin_node | initial node id |
| destination_sector | sector that the destination node is within |
| destination_node | destination node id |
| nexthop_sector | next sector |
| nexthop_vehicle | next hop (relay) |
| visited_sectors | list of visited sectors |
| visited_vehicles | list of vehicle used as relay |
| recovery_tag | number of backtrack steps |
Table 3.
Simulation parameters.
| Parameters | Values |
|---|---|
| Map | Manhattan downtown |
| Map Size | 1 km2 |
| Transmission power | 2.2 mW |
| Communication range | 300 m |
| Bit rate | 18 Mbit/s |
| Beacons | 4 s |
| Number of RSUs * | 1, 4, 8 |
| Confidence interval | 95% |
| Message sending period | 3 s |
* Only one RSU was used in the experiments described in Section 4.2.
Table 4.
Simulation parameters.
| Parameters | Values |
|---|---|
| Map | Ottawa downtown |
| Map Size | 8 km2 |
| Transmission power | 2.2 mW |
| Communication range | 300 m |
| Bit rate | 18 Mbit/s |
| Beacons | 4 s |
| Route size factor | 25% |
| Alternative routes (k) | 3 |
| Number of RSUs * | 1, 23, 50 |
| AoK | 3 km |
| Confidence interval | 95% |
| Interval to request new route | 120 s |
* Only FOXS-GSC was varied, from 1 to 23 and then 50 RSUs. The other solutions all used 50 RSUs, providing full coverage.
Disclaimer/Publisher’s Note: The statements, opinions and data contained in all publications are solely those of the individual author(s) and contributor(s) and not of MDPI and/or the editor(s). MDPI and/or the editor(s) disclaim responsibility for any injury to people or property resulting from any ideas, methods, instructions or products referred to in the content. |
© 2023 by the authors. Licensee MDPI, Basel, Switzerland. This article is an open access article distributed under the terms and conditions of the Creative Commons Attribution (CC BY) license (https://creativecommons.org/licenses/by/4.0/).
Share and Cite
MDPI and ACS Style
Brennand, C.A.R.L.; Meneguette, R.; Filho, G.P.R. FOXS-GSC—Fast Offset Xpath Service with HexagonS Communication. Informatics 2023, 10, 56. https://doi.org/10.3390/informatics10030056
AMA Style
Brennand CARL, Meneguette R, Filho GPR. FOXS-GSC—Fast Offset Xpath Service with HexagonS Communication. Informatics. 2023; 10(3):56. https://doi.org/10.3390/informatics10030056
Chicago/Turabian StyleBrennand, Celso A. R. L., Rodolfo Meneguette, and Geraldo P. Rocha Filho. 2023. "FOXS-GSC—Fast Offset Xpath Service with HexagonS Communication" Informatics 10, no. 3: 56. https://doi.org/10.3390/informatics10030056
Note that from the first issue of 2016, this journal uses article numbers instead of page numbers. See further details here.