
Exploring Multidimensional Embeddings for Decision Support Using Advanced Visualization Techniques


Institute of Data Science and Digital Technologies, Vilnius University, 08412 Vilnius, Lithuania
*
Author to whom correspondence should be addressed.
†
These authors contributed equally to this work.
Informatics 2024, 11(1), 11; https://doi.org/10.3390/informatics11010011
Submission received: 22 December 2023
/
Revised: 19 February 2024
/
Accepted: 23 February 2024
/
Published: 26 February 2024
(This article belongs to the Section Machine Learning)
Abstract
:As artificial intelligence has evolved, deep learning models have become important in extracting and interpreting complex patterns from raw multidimensional data. These models produce multidimensional embeddings that, while containing a lot of information, are often not directly understandable. Dimensionality reduction techniques play an important role in transforming multidimensional data into interpretable formats for decision support systems. To address this problem, the paper presents an analysis of dimensionality reduction and visualization techniques that embrace complex data representations and are useful inferences for decision systems. A novel framework is proposed, utilizing a Siamese neural network with a triplet loss function to analyze multidimensional data encoded into images, thus transforming these data into multidimensional embeddings. This approach uses dimensionality reduction techniques to transform these embeddings into a lower-dimensional space. This transformation not only improves interpretability but also maintains the integrity of the complex data structures. The efficacy of this approach is demonstrated using a keystroke dynamics dataset. The results support the integration of these visualization techniques into decision support systems. The visualization process not only simplifies the complexity of the data, but also reveals deep patterns and relationships hidden in the embeddings. Thus, a comprehensive framework for visualizing and interpreting complex keystroke dynamics is described, making a significant contribution to the field of user authentication.
1. Introduction
In the rapidly growing field of artificial intelligence, deep learning models, widely used in pattern recognition tasks, are excellent at extracting multidimensional features from raw data, transforming them into embeddings that reflect the complex patterns and relationships inherent in the dataset. However, the multidimensional nature of these embeddings presents a major challenge: they cannot be easily interpreted by humans without additional analysis. This comprehensibility gap requires effective dimensionality reduction and data visualization strategies, which are important for several reasons. Dimensionality reduction is crucial to overcome the "curse of dimensionality", a phenomenon where a high-dimensional feature space leads to a sparse data distribution. As the dimension increases, the volume of the space increases exponentially, making the available data too sparse to produce reliable results. This sparsity makes it difficult for algorithms to detect patterns or make predictions with high accuracy. Dimensionality reduction techniques help to overcome this curse and improve the performance and accuracy of machine learning models.
Consider multidimensional raw data described by n features. Let us denote the data samples as , , where each n-dimensional data point , and m is the number of data samples. Dimensionality reduction aims to find the points , , in a lower-dimensional space , , so that certain properties (such as distances or other proximities between the points) of the dataset were preserved as faithfully as possible. This dimensionality reduction is very important for interpreting data because it transforms the data into a more convenient form. If we choose , the dimensionality reduction allows us to visualize the obtained points in 2D or 3D space. Furthermore, data visualization is crucial for understanding data in decision support systems. By transforming multidimensional data into a more comprehensible and manageable form, dimensionality reduction techniques enable decision makers to uncover hidden patterns and relationships, leading to more informed decisions. Dimensionality reduction methods can assist in identifying and understanding the unique characteristics of different data clusters, which is crucial for making informed decisions in a decision support system [1,2].
Often, the need for visualization arises not only in the analysis of raw data, but also in embeddings derived by deep neural networks such as Convolutional Neural Networks (CNNs). Visualization allows researchers and practitioners to gain insight into the learned representations (embeddings), contributing to a deeper understanding of model behavior. This understanding plays a key role in decision making, especially in sensitive applications such as user authentication, medical diagnosis, and autonomous driving, where fast and accurate decisions are of crucial importance. Furthermore, visualization of CNN embeddings helps to identify patterns and anomalies that may not be obvious in high-dimensional space. It allows us to explore the relationships and clusters formed by the embeddings, providing a qualitative assessment of the effectiveness of the model. For example, in user authentication using keystroke dynamics [3], visualization of the embeddings can show how well the model discriminates between different users, which is important for assessing the reliability of an authentication system.
This paper aims to investigate the efficiency of advanced dimensionality reduction and visualization techniques in the context of analyzing multidimensional embeddings obtained by deep neural networks. The paper presents a new dimensionality reduction framework that not only improves the interpretation of multidimensional data, but also significantly enhances the comprehensibility of the data, such as in the domain of user authentication. This research is designed to deepen the understanding of complex data structures and facilitate more informed decision-making processes.
The main contributions of this paper are the following:
- An innovative dimensionality reduction-based visualization framework is proposed, which uniquely integrates dimensionality reduction techniques with Siamese neural networks with a triplet loss function. It is specifically designed for interpreting and visualizing complex multidimensional embeddings from deep neural networks. It significantly enhances the interpretability of high-dimensional data, facilitating insightful and efficient analysis in decision support systems.
- The usefulness and effectiveness of the proposed framework are demonstrated through an empirical evaluation using a keystroke dynamics dataset to solve a user authentication problem. This approach illustrates the ability of the framework to efficiently process and visualize multidimensional data to make reasoned decisions in user authentication systems.
The remainder of the paper is organized as follows. Section 2 presents related works in the field of dimensionality reduction and multidimensional data visualization. The dimensionality reduction framework for multidimensional embedding visualization is outlined in Section 3. The obtained results are presented and analyzed in Section 4. Finally, Section 5 summarizes the main findings and highlights future research directions.
2. Related Works
Dimensionality reduction and data visualization techniques are important in machine learning, especially when analyzing complex data [4,5,6]. These methods are particularly valuable in exploratory analysis, offering insights into similarity relations in multidimensional data, which is essential for understanding and interpreting neural network embeddings.
Classical methods such as Principal Component Analysis (PCA) [7,8] and Multidimensional Scaling (MDS) [8,9,10] have traditionally been used to reduce dimensionality in data visualization. PCA reduces the dimensionality of the data by identifying orthogonal linear combinations of the original variables (features) that have maximum variance [11]. However, the linear PCA approach may not fully capture the complexity of nonlinear structures present in the data, which has led to the development of local distance-preserving methods such as Local Linear Embedding (LLE) [12] and Isomap [13,14]. More recent methods such as t-Distributed Stochastic Neighbour Embedding (t-SNE) [15] and Uniform Manifold Approximation and Projection (UMAP) [16] have gained popularity due to their ability to preserve the local structure of high-dimensional data, making them particularly suitable for visualizing embeddings obtained by deep neural networks.
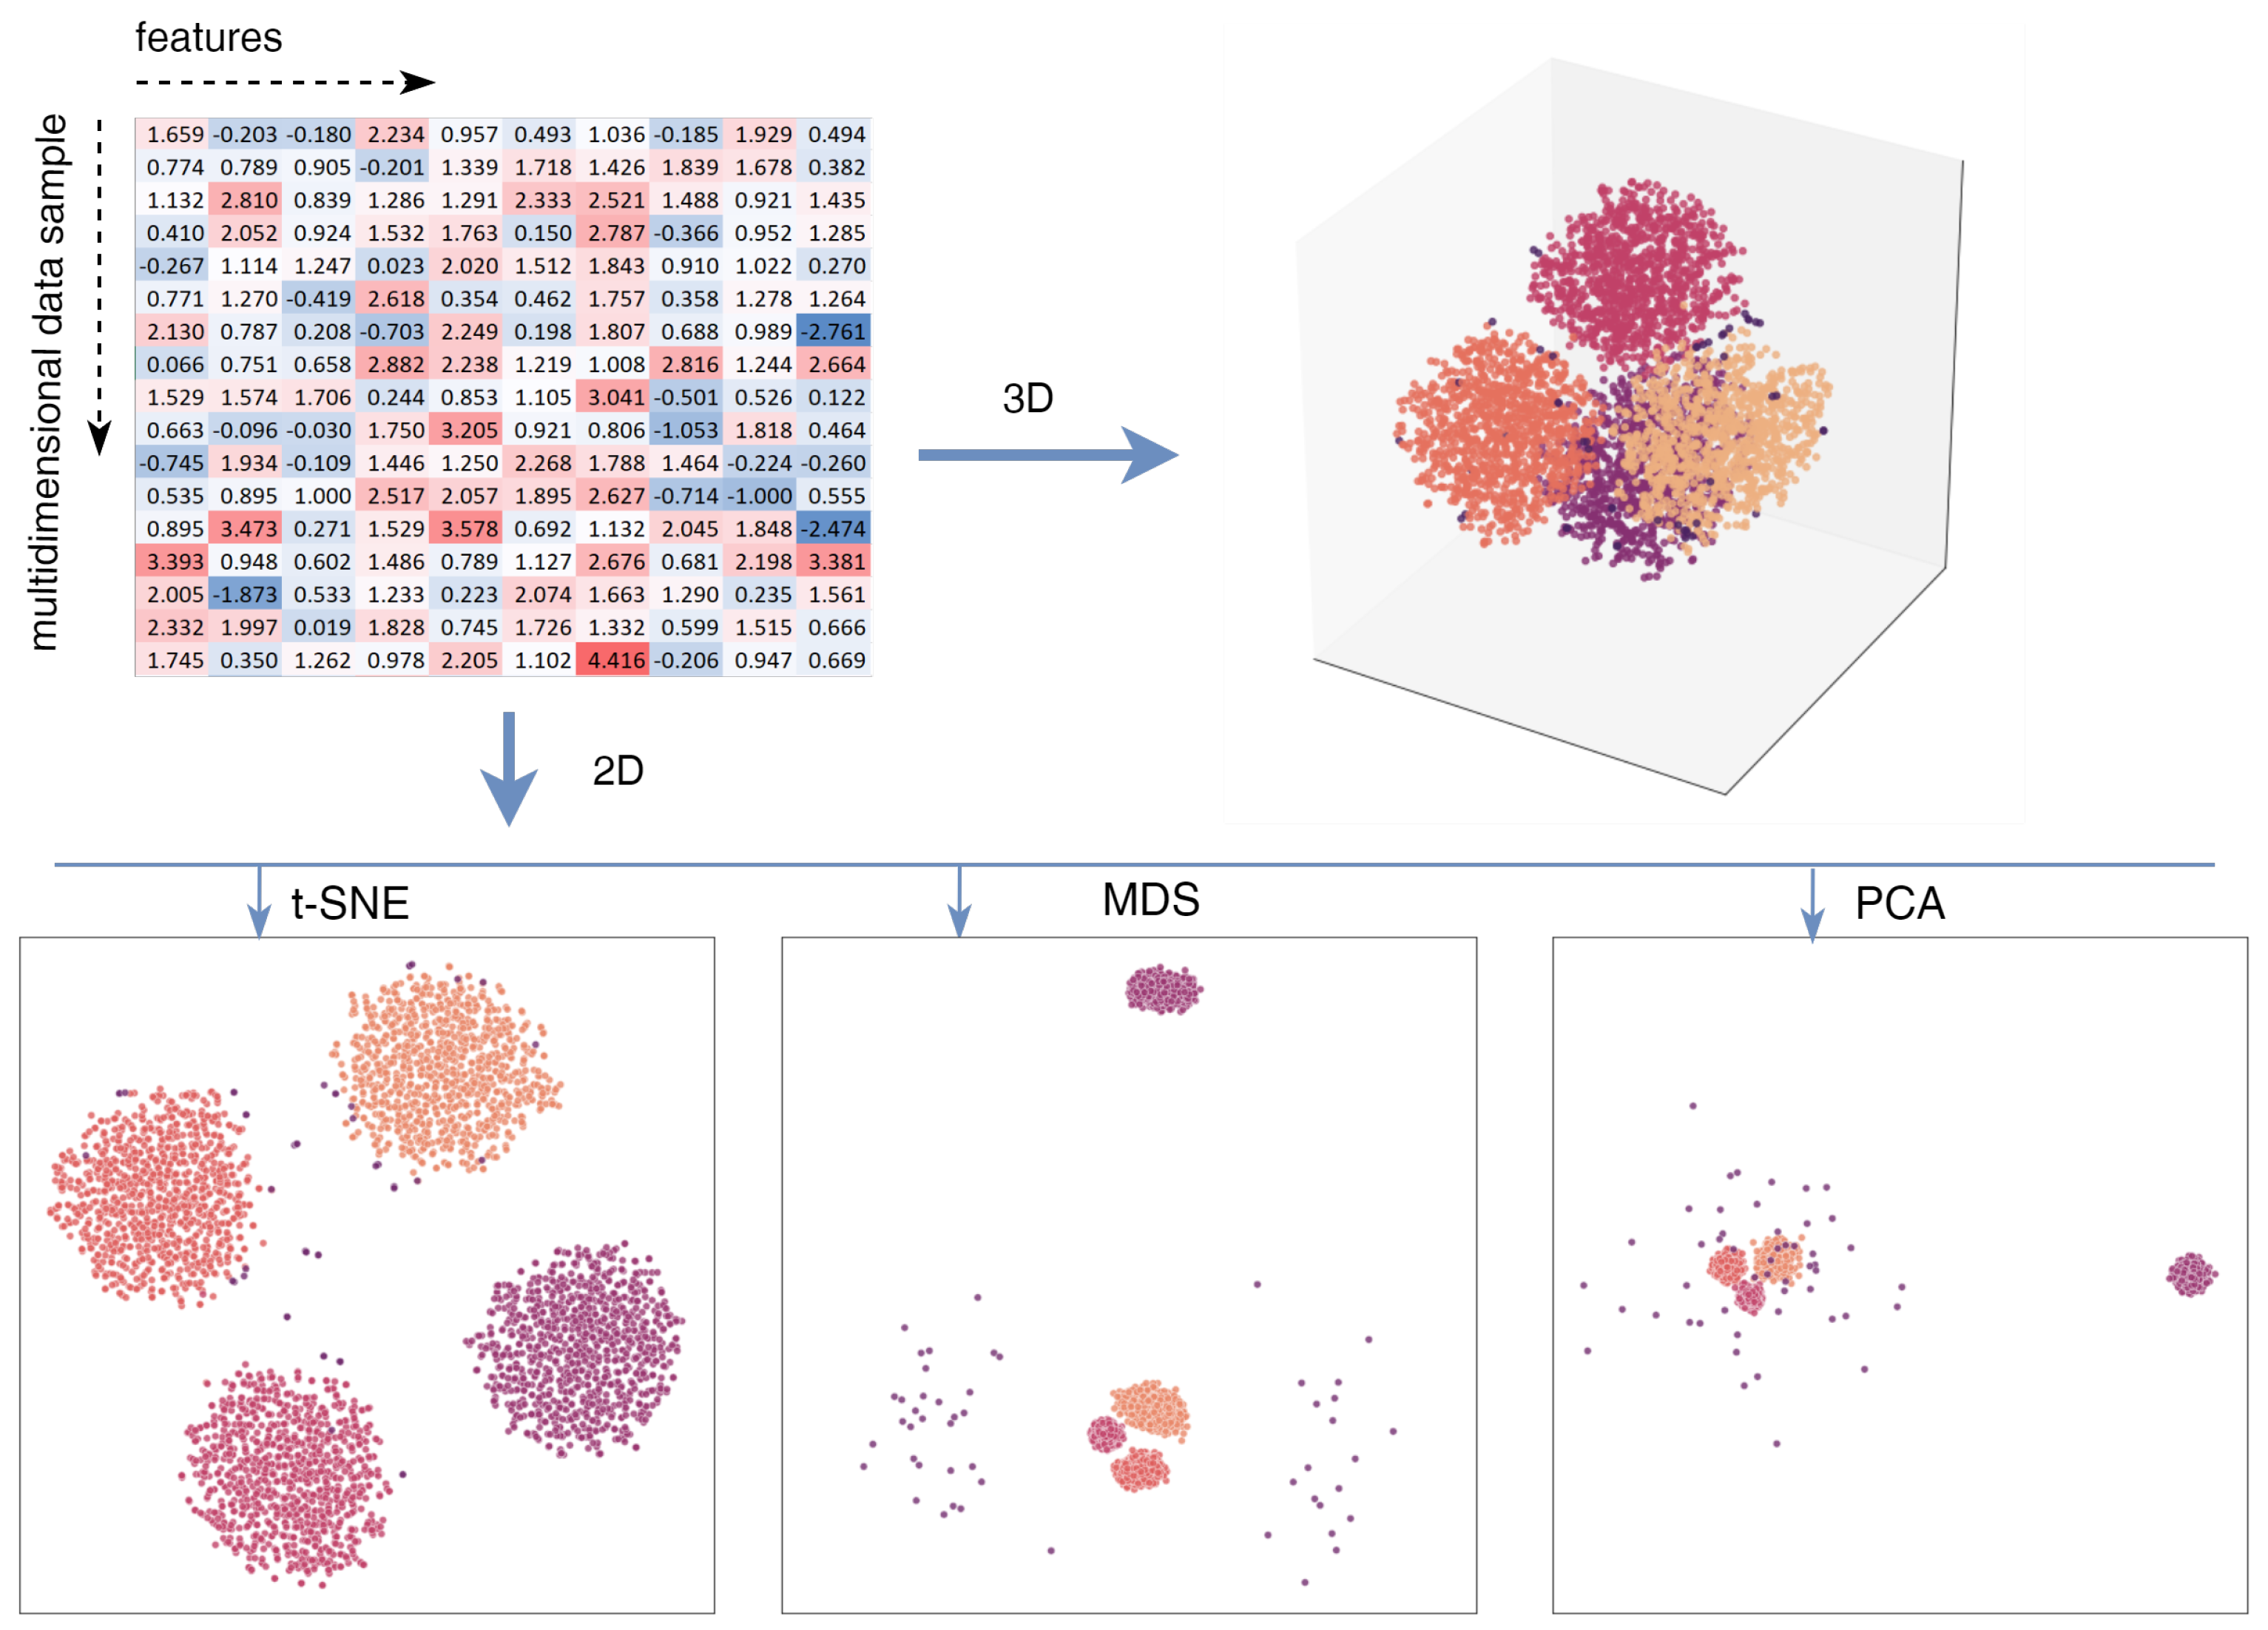
These techniques transform multidimensional data into a lower-dimensional space, which not only simplifies data visualization [17,18,19], but also improves the computational efficiency of the tasks. In addition, visualizing the data in these reduced dimensions is very important for data interpretation. Figure 1 (top left) shows an example of a tabular raw synthetic dataset consisting of 4050 samples in 10-dimensional space (). The data has been generated to include four distinct clusters with additional noise and outliers. Analyzing the raw tabular data, particularly discerning interlocations and clustering, is challenging without deeper analysis. In the visualization shown at the top right, where the dimensionality of the data is reduced to three (3D space), the results are displayed in a Cartesian coordinate system, providing a clearer perspective of the data structure. While we can see the clusters of data here, they are overlapping, and it is challenging to see them in their completeness without additional interactive tools. At the bottom of the figure, visualizations where the data dimensionality is reduced to two (2D space) by three different methods (t-SNE, MDS, and PCA) are shown. Here, we can see that the clusters are best expressed using the t-SNE method, while with MDS and PCA, although the clusters are visible, the noise is also quite significant. This example demonstrates that while traditional tabular representations of multidimensional data hide complex structures, dimensionality reduction techniques can greatly improve clarity.
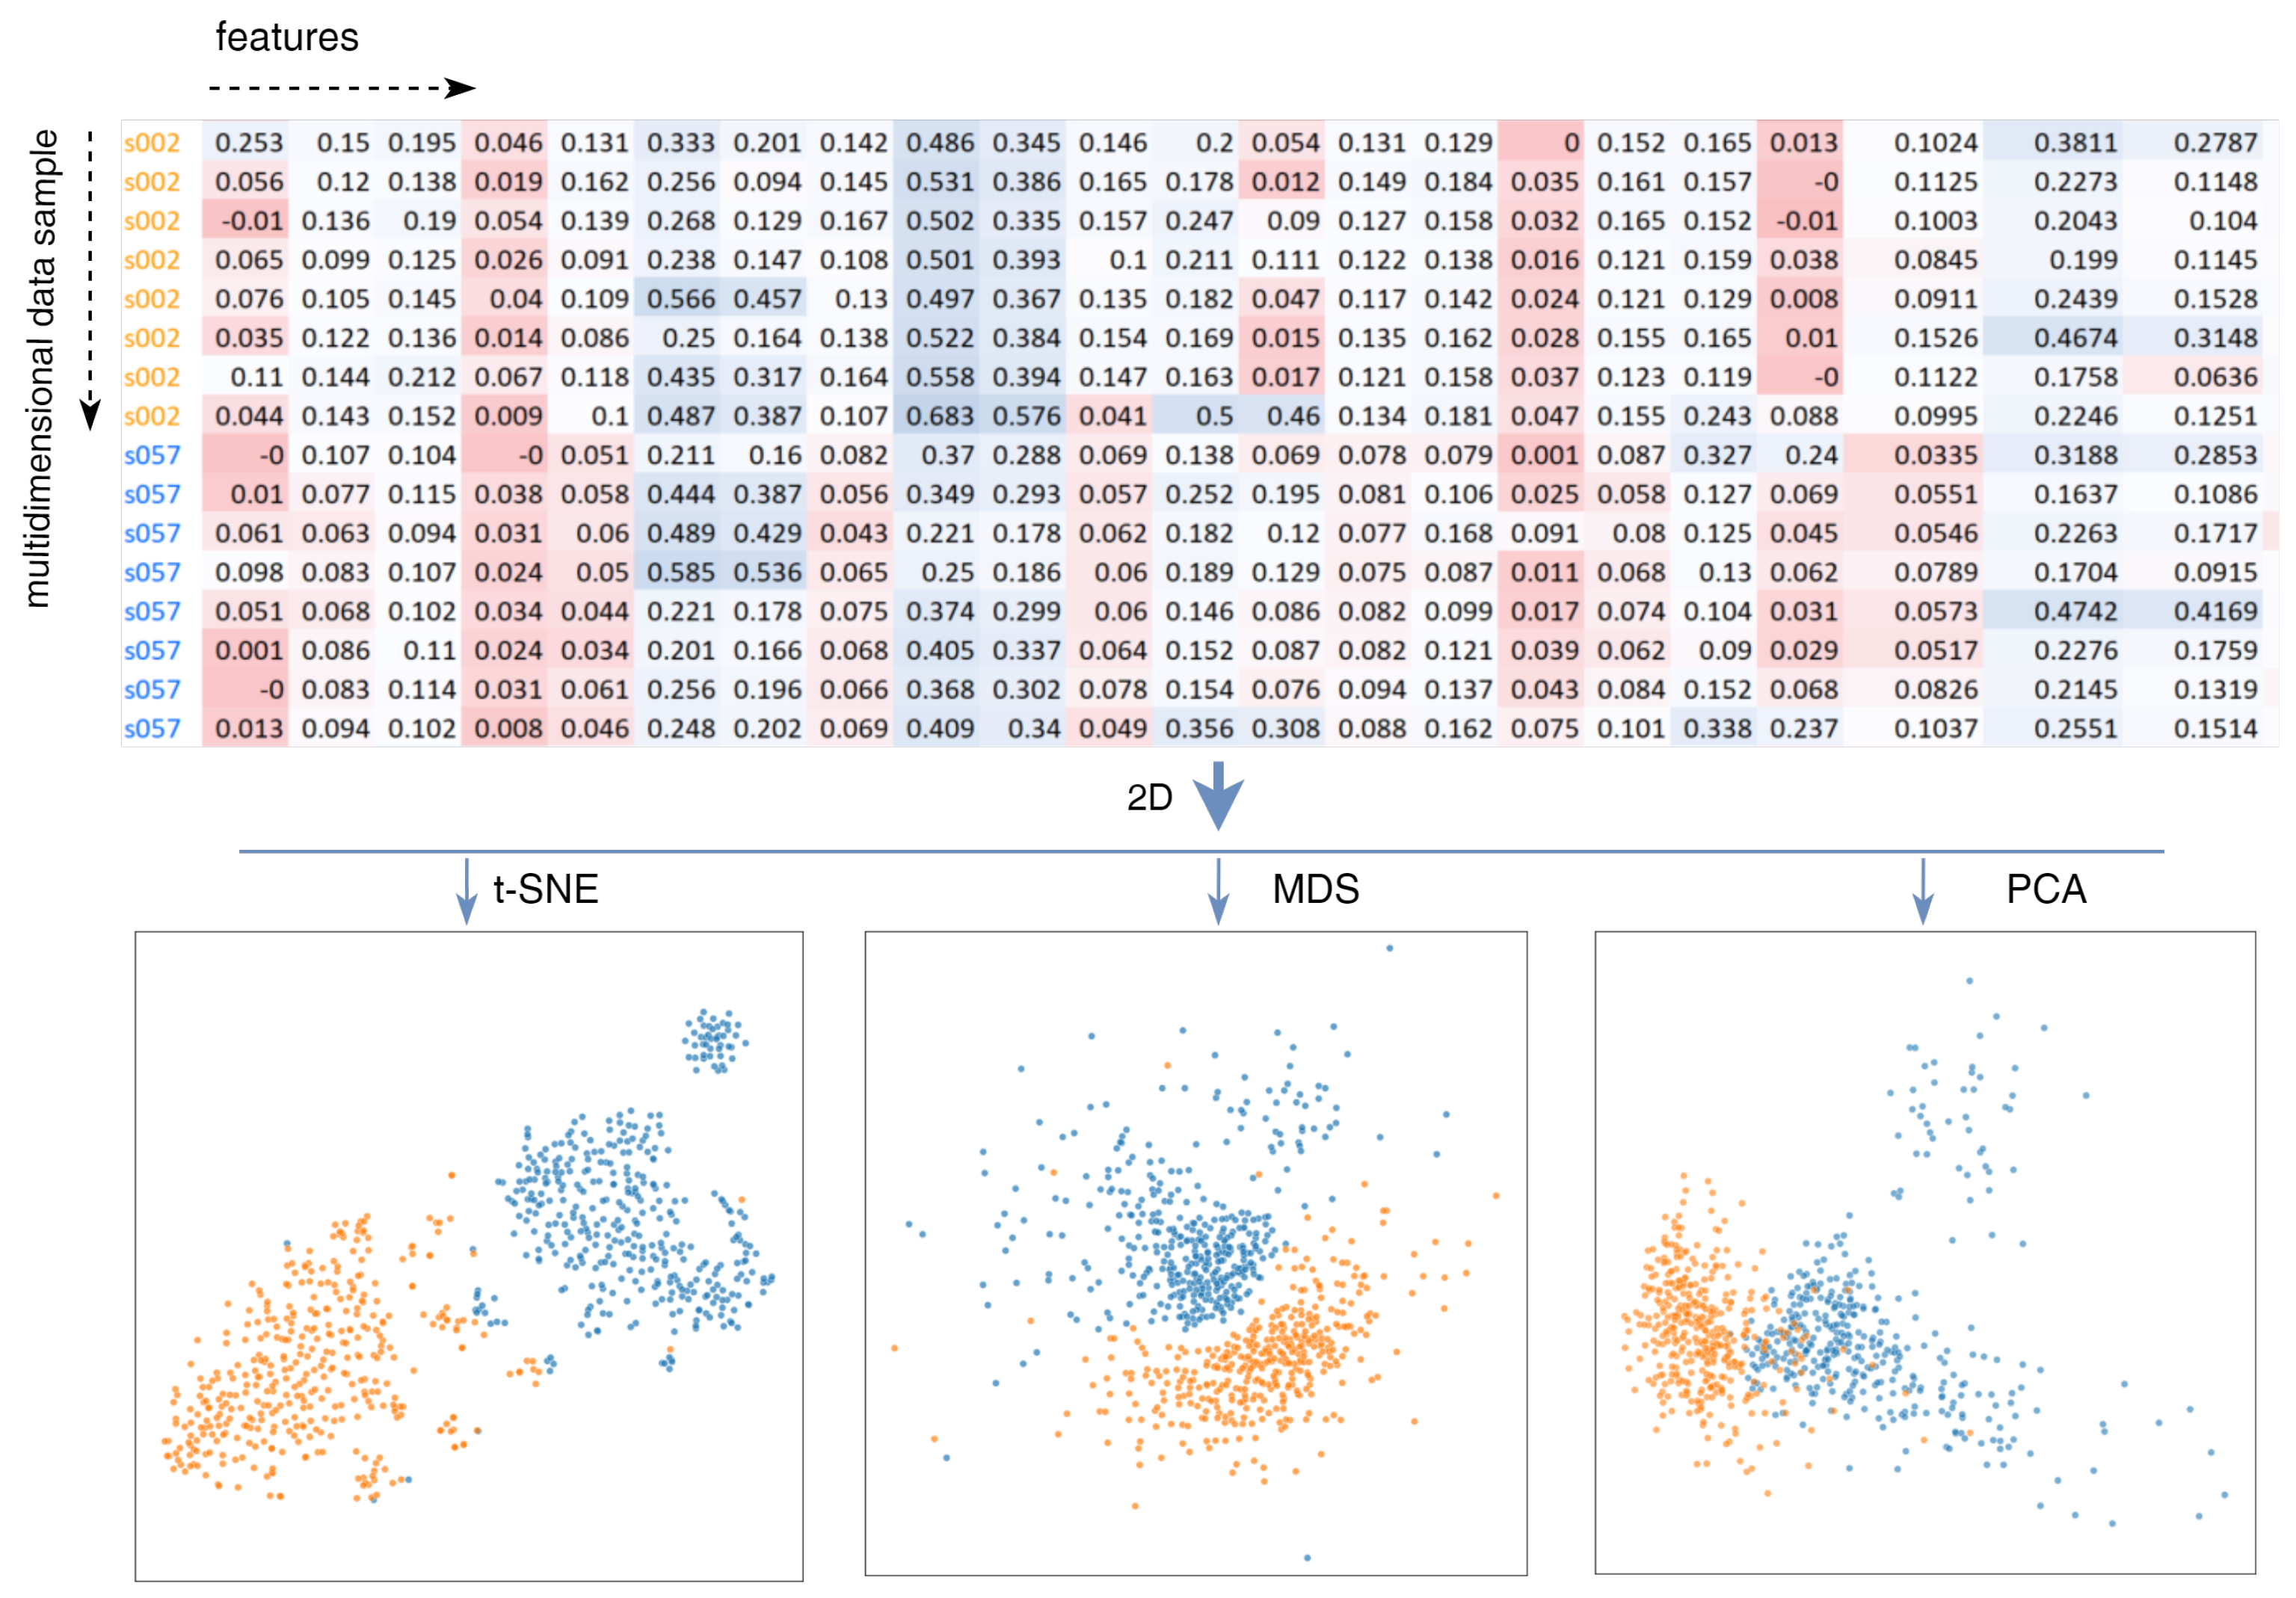
To demonstrate the practical application of dimensionality reduction techniques, we consider an example using keystroke dynamics data from the CMU dataset (see Section 3.2). This dataset consists of multidimensional time series representing the password typing behavior of users, which are inherently difficult to interpret in raw form due to the high-dimensional space. In raw form, each typed password record represents a complex pattern of user typing behavior, recorded as a series of time intervals between keystrokes. The raw data is unsuitable for direct human perception because there are no patterns or relationships that can be easily interpreted (see top of Figure 2). By applying dimensionality reduction techniques to transform multidimensional keystroke dynamics into 2D space the internal structure of the data is preserved. To illustrate, consider data associated with two separate different users, each of whom entered a password 400 times (). Methods such as t-SNE, MDS, and PCA have been used to visualize the data in a more intuitive way. Applying these methods allows us to identify distinct clusters in the transformed data that correspond to the unique typing patterns of each user. As shown in Figure 2, the t-SNE method in particular effectively separates data points into consistent clusters, allowing us to visually distinguish between two users. This visualization clarity demonstrates the potential of dimensionality reduction methods to authenticate users by highlighting individual keystroke dynamics. Different dimensionality reduction methods emphasize different aspects of the data. While PCA provides a broad overview by maximizing variance and identifying potential linear relationships, t-SNE and MDS focus on preserving local and global patterns, respectively. The resulting 2D visual representation of the data is more understandable and highlights the unique typing characteristics of each user, which is important for authentication purposes. While there is already some visual separation of users, decision making is complicated by overlapping clusters when there are many users. Therefore, in the remainder of this paper, a strategy to improve the visualization of clusters is proposed (see Section 3).
The importance of dimensionality-reduction techniques for transforming multidimensional data into lower-dimensional data to facilitate easier visualization and analysis is discussed in [20]. It focuses on the use of popular nonlinear dimensionality reduction algorithms such as t-SNE and UMAP. In the article [21], traditional dimensionality reduction methods such as PCA and Isomap are compared with autoencoders. The study demonstrated the relevance of PCA in this context, despite the emergence of autoencoders as a more flexible neural network alternative for dimensionality reduction. While autoencoders provided nonlinear dimensionality reduction that can outperform methods such as PCA, they also required more computational time or resources for training. The findings showed that PCA remained competitive with neural networks in terms of accuracy when the projection dimensionality was large enough. However, PCA was significantly faster and less computationally intensive than autoencoders.
The paper [22] explored the use of vibration features extracted based on machine learning models for identifying bearing faults. The possibility of reducing the number of features was examined, and the performance of the model was observed when working with reduced dimensionality of the input data. Of all the methods evaluated, PCA performed the best, second only to manual feature selection based on expert knowledge. Visual analytics for cluster analysis and dimensionality reduction of high-dimensional electronic health records was proposed and analyzed in [23]. The main contribution of the proposed visual analytics was to bring together a wide range of state-of-the-art and traditional analysis methods, integrating them seamlessly and making them accessible through interactive visualizations.
The study [24] investigated how different visualization methods reflect both discrete and continuous structures in single-cell data. The focus was on a new method and its comparison with UMAP. The authors used both simulated and real datasets to evaluate the performance of these methods. They aimed to find out how well these methods preserve different patterns, such as discrete clusters, continua, and branching structures in low-dimensional visualizations. The paper [25] presented a self-supervised learning algorithm that obtained interpretable and consistent embeddings of high-dimensional recordings using auxiliary variables. It combined the concepts of nonlinear independent component analysis and contrastive learning to generate latent embeddings that were dependent on behavior and/or time. The proposed algorithm was compared with t-SNE and UMAP.
In summary, recent studies have shown the growing importance of neural networks for dimensionality reduction and data visualization, especially while preserving data structure. These techniques find applications in fields ranging from genomics to cybersecurity. The dimensionality reduction methods previously described are summarized in Table 1. The comparative study has shown that while autoencoders and other deep learning-based techniques provide flexibility, methods such as PCA, t-SNE, LLE, and UMAP remain competitive and are suitable for balancing computational efficiency, the ability to handle specific data structures, and methodological relevance to the study objectives. The continuous development of neural network technologies requires innovative solutions to overcome the challenges of data volume, computational requirements, and interpretation. Effective dimensionality reduction and visualization techniques can have a direct impact on decision-making, problem-solving, and knowledge discovery. Further research is needed to ensure that these methods remain practical and relevant to real-world problems.
3. Research Design
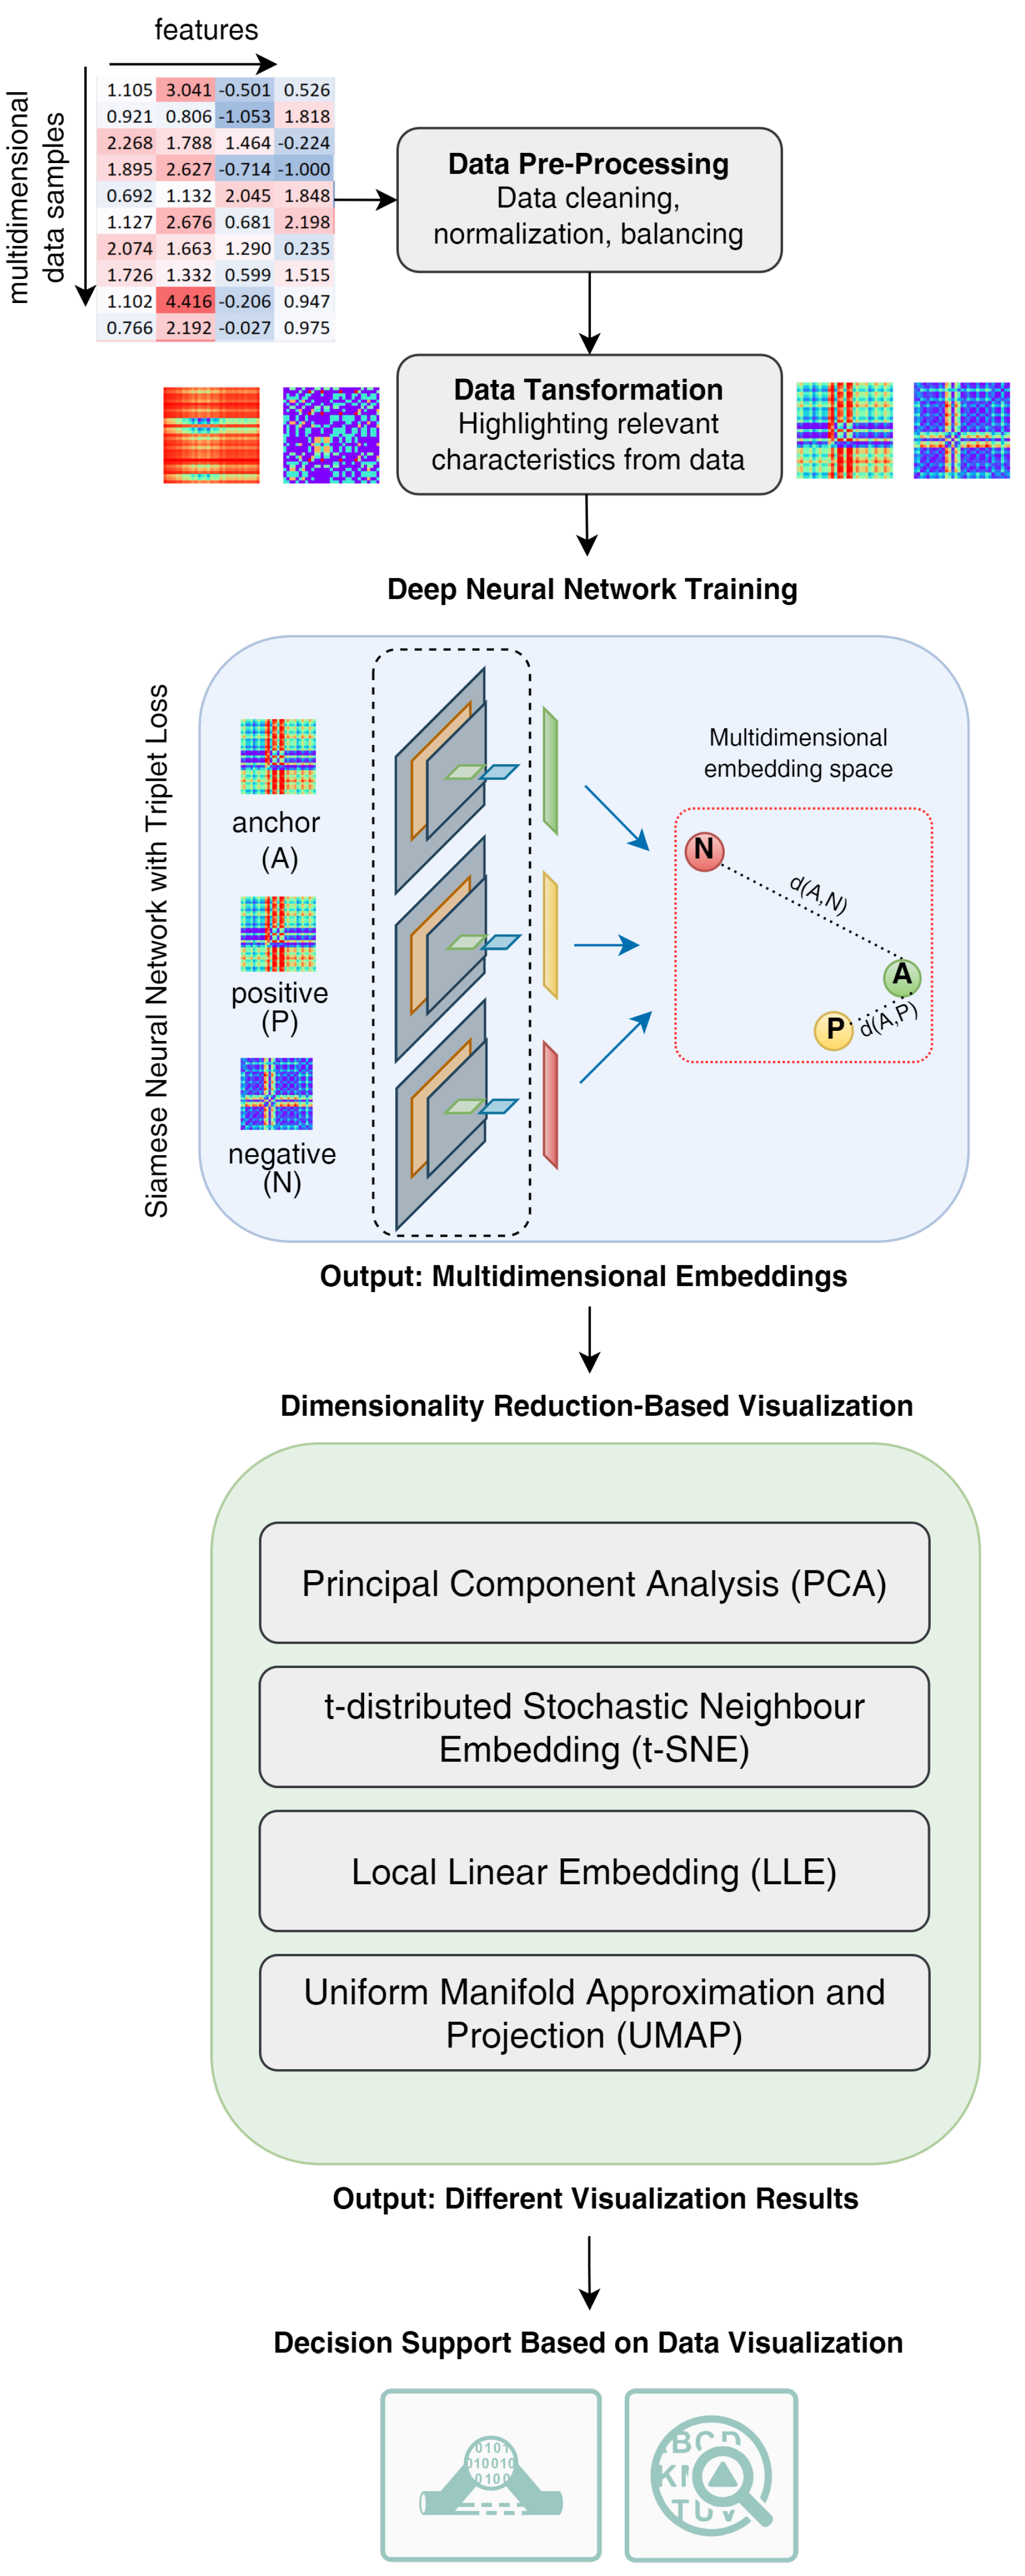
This section presents a proposed dimensionality reduction-based visualization framework for multidimensional embeddings derived from deep neural networks to improve decision making for better data comprehension in solving complex problems where similarities and dissimilarities between data samples need to be revealed. The transformation of tabular data into images is described. Dimensionality reduction-based visualization of the multidimensional embeddings obtained by a Siamese neural network with triplet loss is discussed.
3.1. Decision Support Using Multidimensional Embeddings and Visualization Techniques
The visualization process comprises several stages (see Figure 3), each with a specific purpose, to ensure that the data are accurately represented in a lower-dimensional space, facilitating analysis and decision making. An expanded and detailed description of the process follows:
- Data Pre-Processing. The raw multidimensional tabular data are initially pre-processed, which involves data cleaning, filtering, normalization, and balancing. Incorporating these pre-processing steps improves the quality of the raw data, which is a critical factor in the decision-making process. The process of data cleaning, normalizing, and balancing is more likely to produce clear and distinguishable patterns in visualization, especially when classification or prediction accuracy is of primary importance.
- Data Transformation. The tabular or non-image data are transformed into image data that a CNN can use to exploit feature relationships to improve prediction or classification accuracy. A number of methods can be used to transform tabular data into images, such as the Gramian Angular Summation Field (GASF), the Gramian Angular Difference Field (GADF), and recurrence plots [26,27].
- Deep Neural Network Training. The Siamese neural network with a triplet loss function is used. The transformed data are passed through a Siamese neural network with CNN branches. The network processes the data in triplets: anchor, positive (similar to the anchor), and negative (dissimilar to the anchor) samples. The goal is to train the network to obtain embeddings such that the distance between the anchor and positive samples is minimized and the distance between the anchor and negative samples is maximized in the latent embedding space. The network outputs are multidimensional embeddings of the data analyzed. These embeddings represent the similarities and dissimilarities between the data samples. In this way, each data sample is converted to a point in the embedding space.
- Dimensionality Reduction-Based Visualization. The multidimensional embeddings are projected into a two-dimensional space for visualization purposes using various dimensionality reduction techniques. Techniques such as PCA, t-SNE, LLE, and UMAP are used to preserve the significant structures of the multidimensional data in the lower-dimensional space. The choice of these methods can provide a comprehensive view of the multidimensional data structure. PCA offers a quick way to look at the variance and potential linear relationships, while t-SNE and UMAP can reveal more information on data groupings and structures that PCA might miss. LLE provides insights into the manifold’s local geometries. The use of these techniques can provide a reliable disclosure of the internal structure and relationships of the data (e.g., outliers, clusters, noise, and other patterns), which is essential for decision support systems where an accurate and clear explanation of the data is critical.
- Decision Support Based on Visualization. Decision-making often involves making sense of complex, multidimensional data. Dimensionality reduction simplifies these data without sacrificing important information, allowing decision makers to draw conclusions based on more comprehensible information. The resulting visualization can help identify patterns, trends, and anomalies that may not be evident in the raw data, enabling more informed decisions to be made faster.
This framework is a novel approach that combines Siamese neural networks with dimensionality reduction techniques such as PCA, t-SNE, LLE, and UMAP. This hybrid method leverages the strengths of both deep learning and traditional data analysis techniques. This solution provides a different perspective on multidimensional data visualization, where the multidimensional embeddings generated by Siamese neural networks become interpretable through enhanced dimensionality reduction, which is a novel approach in the field of decision support systems. By simplifying the visualization of complex data, the framework enables informed decision-making based on patterns in data that would otherwise be difficult to interpret. It enhances the ability to identify anomalies and outliers, which is critical for risk management, fraud detection, and user authentication. The approach can be generalized and applied to various fields that require sophisticated data analysis, such as bioinformatics, finance, cybersecurity (especially in user authentication and anomaly detection), and customer behavior analysis. In healthcare, it can be used to analyze complex patient data to identify patterns that contribute to specific health outcomes. In business intelligence, it can help understand customer segments and market trends by visualizing complex customer data.
The integration of different dimensionality reduction techniques ensures that the approach can be adapted to specific data characteristics, thereby increasing its applicability to different datasets and use cases. This approach is suitable for analyzing particularly large datasets because each sample, regardless of its complexity, is represented as a point in the embedding space independently of other data samples. The solution can be used to efficiently process and analyze large amounts of data.
3.2. Use Case Analysis Based on Keystroke Dynamics to User Authentication
To demonstrate, validate, and evaluate the effectiveness of the new framework proposed in this paper, the relevant problem of static user authentication was chosen. During the authentication process, the person’s typing style is analyzed when they enter a predefined text. When a person types, the keystroke pattern is captured, and the collected data are used to create a unique keystroke dynamics profile to authenticate the user. The Carnegie Mellon University (CMU) dataset [28] was used as a basis for demonstrating the new approach. When the password ”.tie5roanl” is entered, the keyboard generates 31 features of time series corresponding to the keystroke dynamics of the password. Fifty-one users participated in the typing task. Each user typed the password 400 times. The CMU dataset containes multidimensional data , , corresponding to a set of time series that capture the patterns of typing behavior across different users, where , . Each dimension represents a distinct aspect of the keystroke pattern, such as latency, duration, and pressure, recorded over time as users type the predefined text.
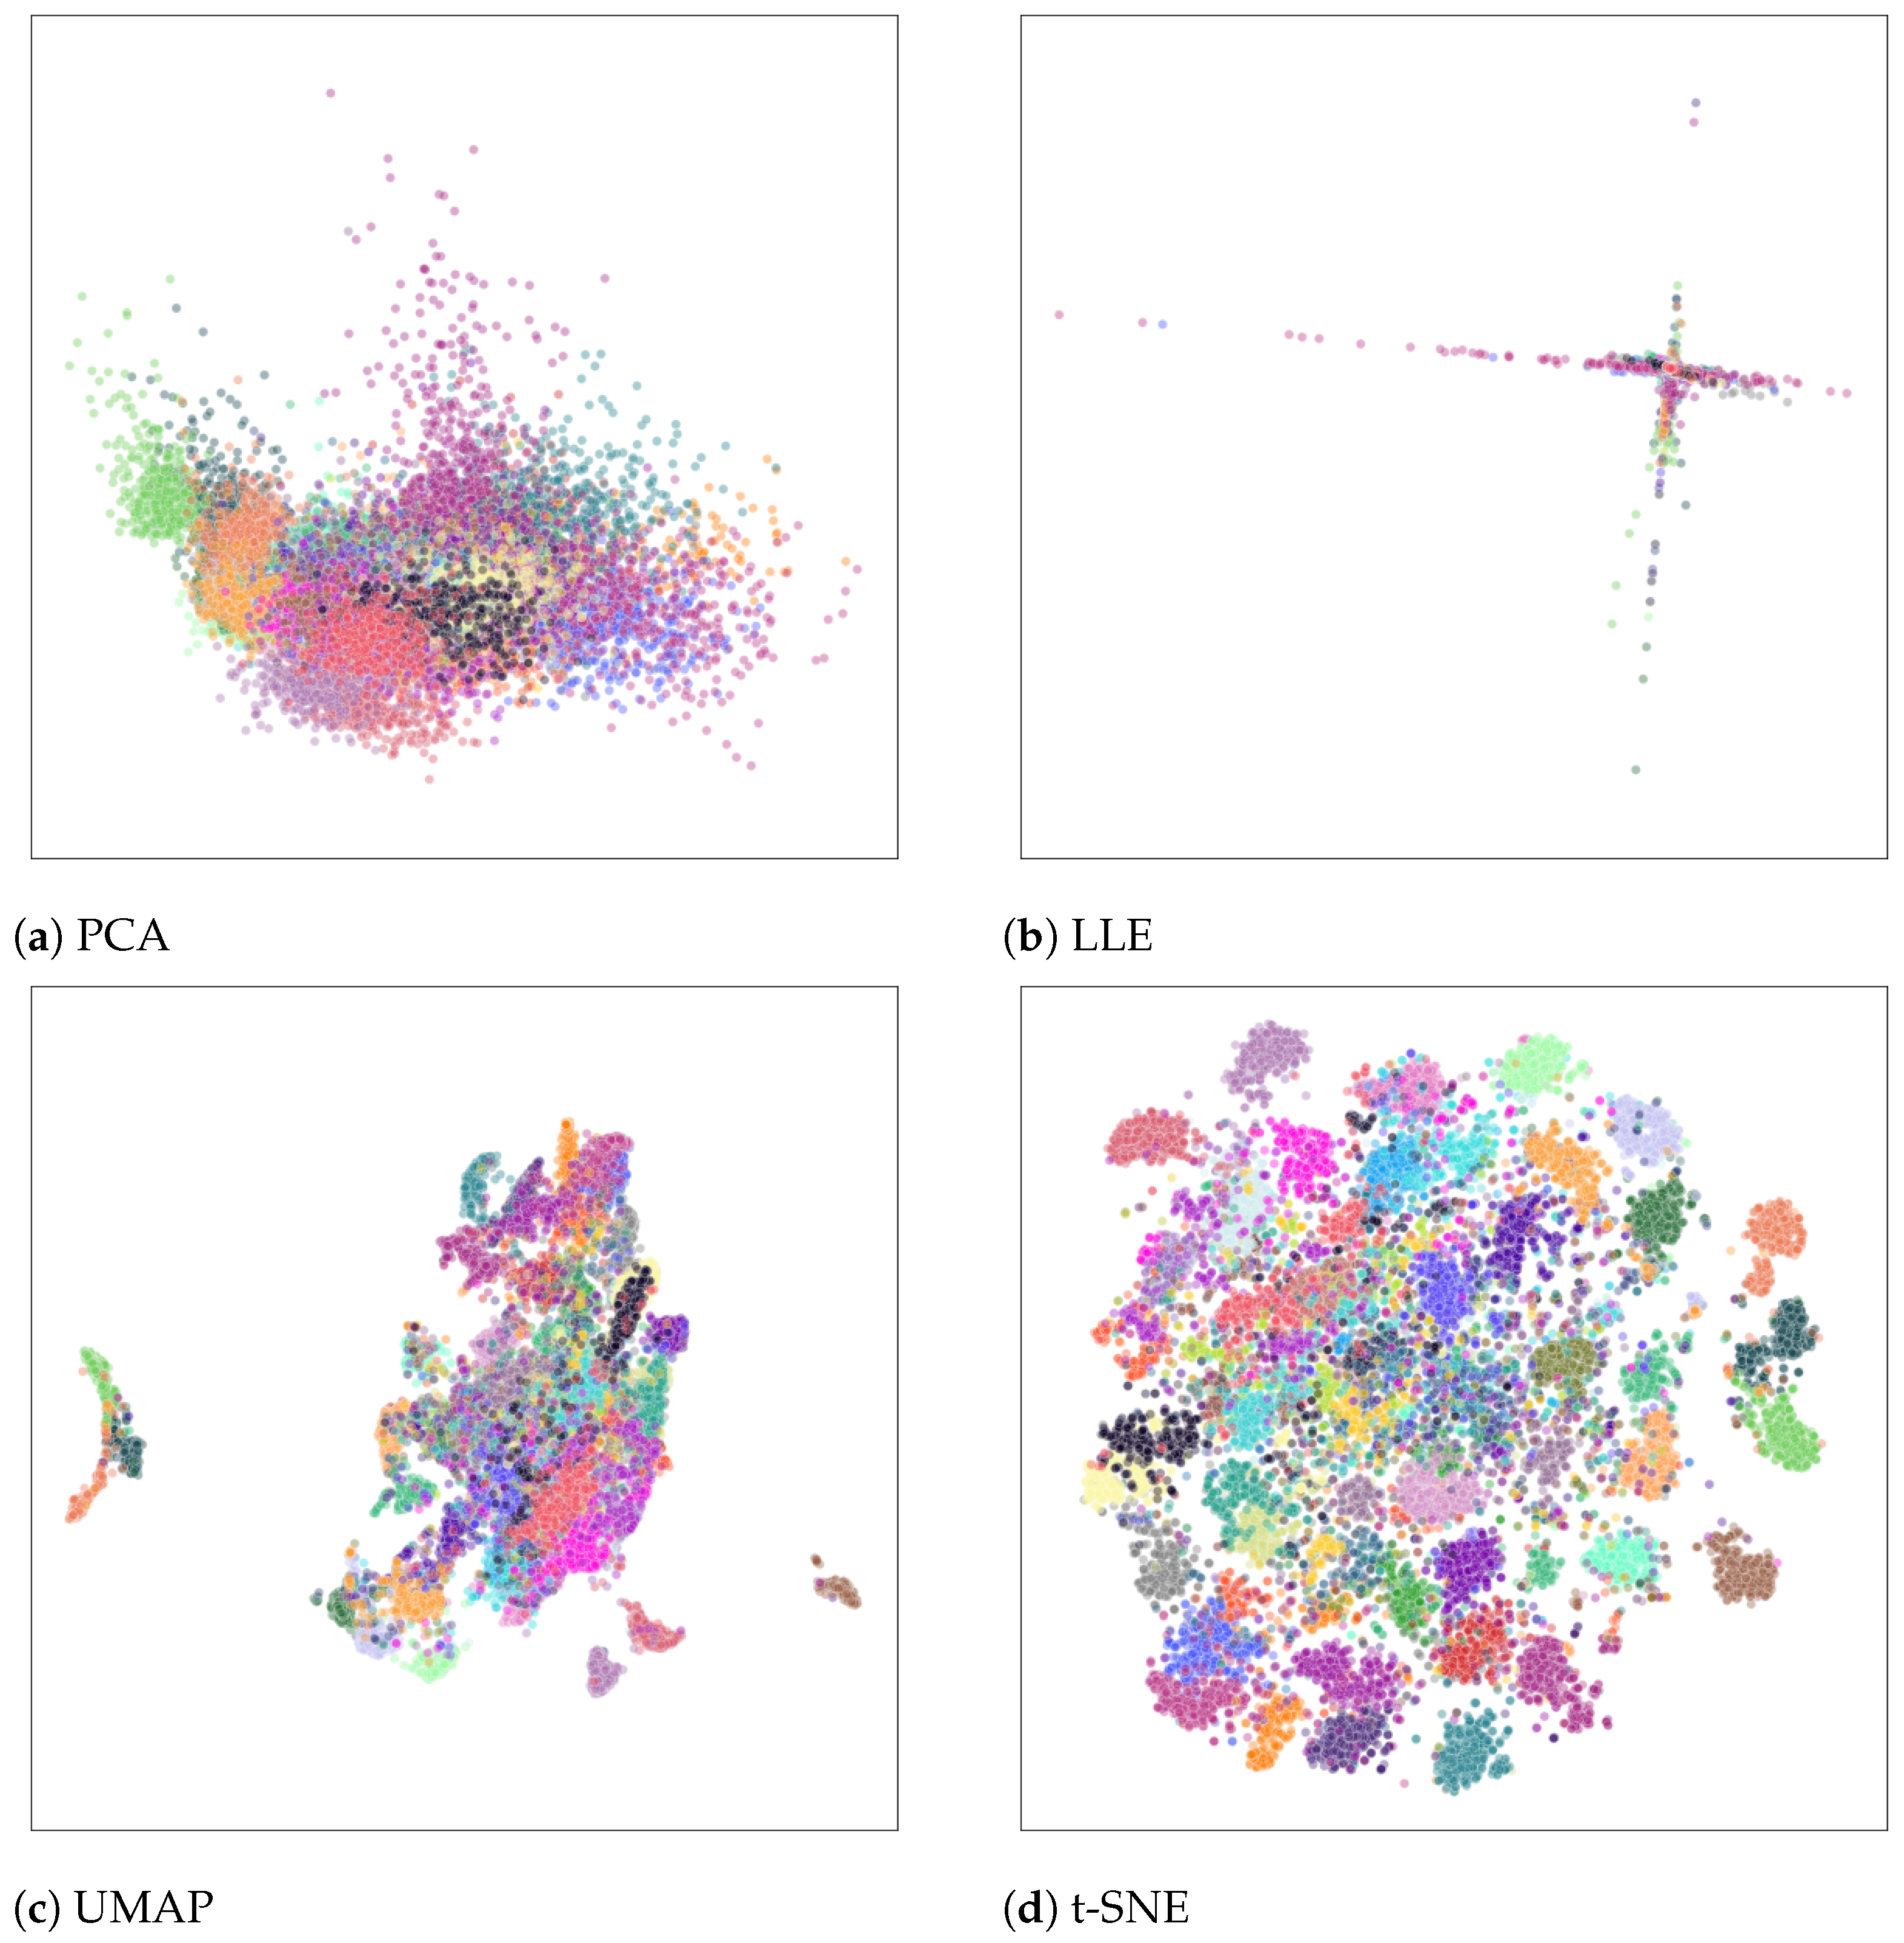
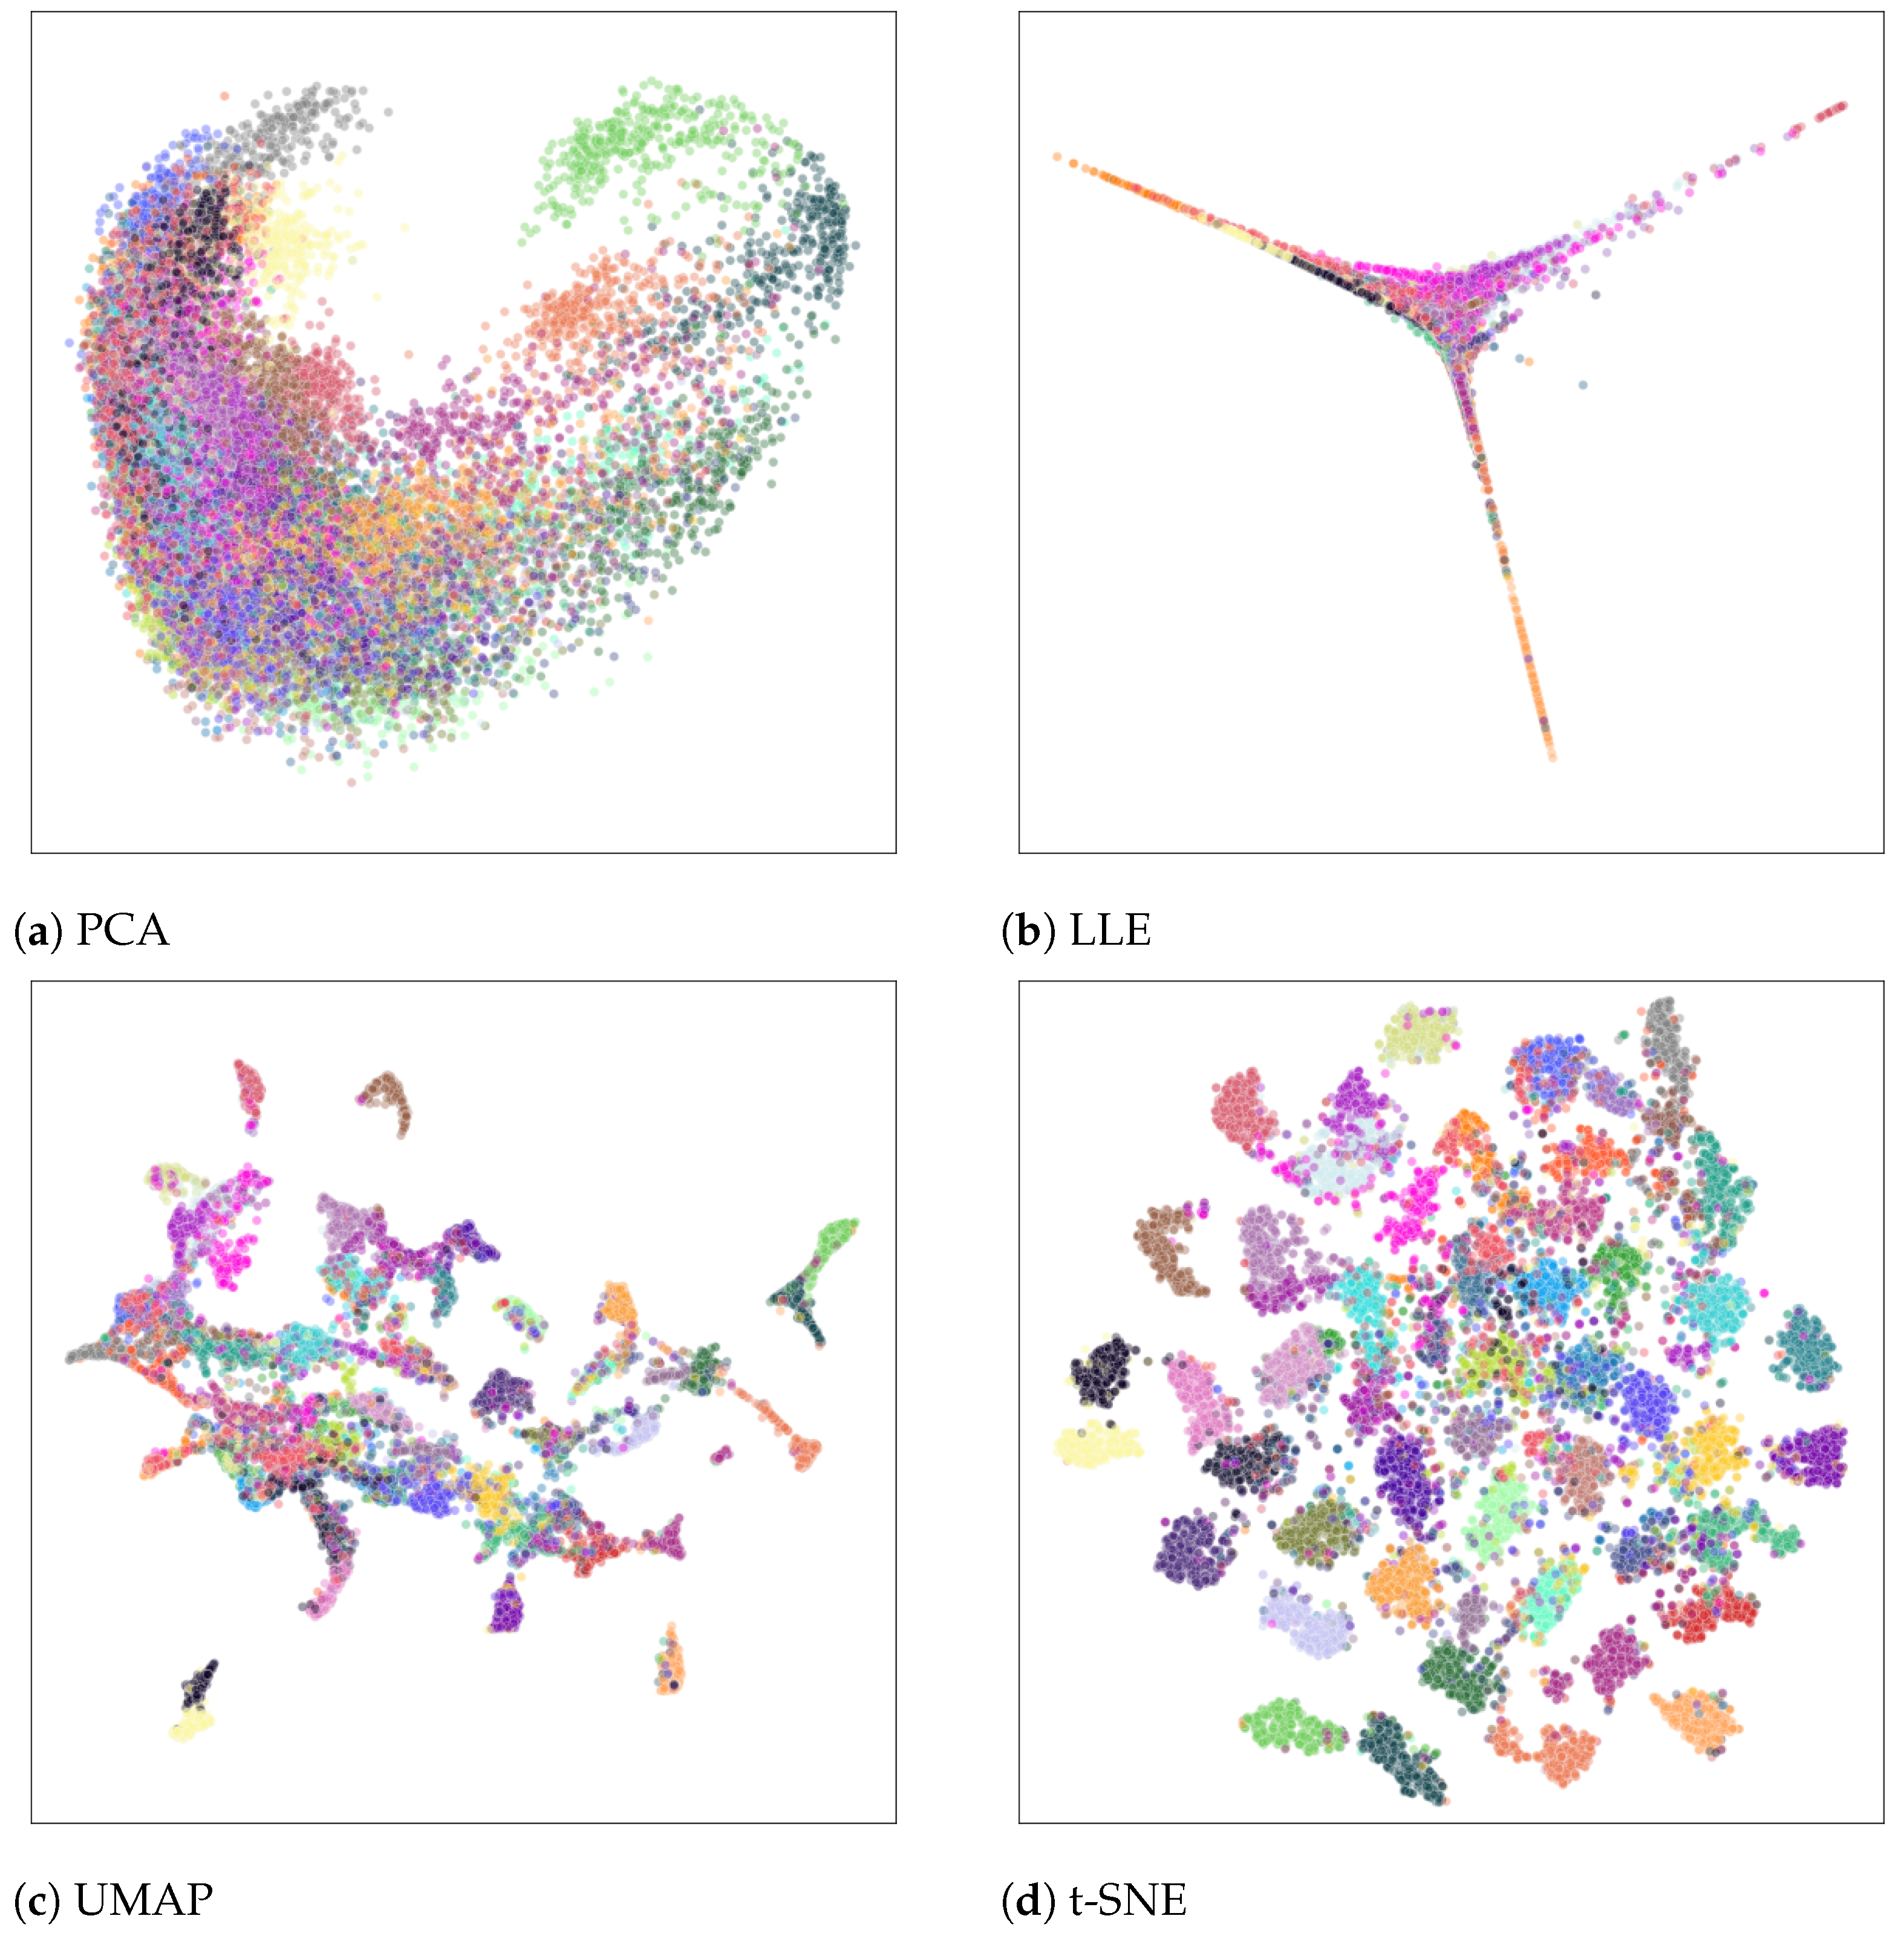
The multidimensional nature of these data makes it difficult to make appropriate decisions. Therefore, it makes sense to reduce their dimensionality in order to visualize them for convenient and fast decision-making. Dimensionality reduction techniques play a key role in uncovering meaningful patterns hidden in keystroke dynamics data that would otherwise be missed in multidimensional space. However, conventional dimensionality reduction-based visualization methods do not always reveal the structures of the data to be analyzed, especially when the data are large (see Figure 4). Such visualization results are not sufficient to provide a suitable solution to identify illegal users. In this and the following figures, we do not show the labels and units for both axes when presenting the visualization results, since we are only interested in observing the interlocations of points in 2D space.
3.3. Data Transformation
In order to exploit the potential of deep neural networks and dimensionality reduction techniques, this paper explores the integration of these solutions. A crucial preliminary step in this integration is the transformation of time series (or tabular data) into a visual format. As an example, the data described in Section 3.2 will be used to illustrate the data analysis process. This conversion facilitates the process of feature extraction by the neural network, allowing it to identify important patterns more efficiently than with textual or numerical data. By utilizing the image processing strengths of neural networks, this approach can significantly improve the extraction of relevant features to identify and authenticate users based on their unique keystroke dynamics. Thus, each sample of tabular data is converted into an image where features and their values are represented as pixels and their intensities.
There are several methods for encoding numerical or non-image data into images. Among the notable techniques are the Gramian angular summation field and the Gramian angular difference field, both of which are derived from the Gramian angular field-encoding approach [26]. These methods encode the time series data into polar coordinates, effectively capturing the temporal relationships within the time series data. The Markov transition field technique represents sequential data, such as time series, as images by transforming data points into a matrix where each element indicates transition probabilities, thus capturing sequence dynamics [29], while recurrence plots convert time-series data into images to display similarities between data points [27]. Each of these methods has its own unique advantages when encoding time series data for deep neural network training. The choice of one method over another is primarily determined by the characteristics of the available data and the specific requirements of the task.
3.4. Deep Neural Network: Siamese Neural Network with Triplet Loss
Recently, Siamese neural networks with a triplet loss function have gained attention due to their efficiency in comparing and identifying similarities between data samples, making them suitable for tasks where data are not classified into predefined classes but where it is necessary to determine the similarity or dissimilarity of the data being analyzed. The scheme presented in Figure 3 utilizes a deep neural network, specifically the Siamese architecture, known for its effectiveness in learning fine distinctions within the data, to obtain multidimensional embeddings. While the approach leverages the strengths of the Siamese network, it is important to note the flexibility of the framework, which can be easily adapted to other neural network architectures. This adaptability allows us to explore different models to solve specific problems.
A Siamese neural network is a type of deep neural network that typically consists of two or three parallel branches that share the same architecture and weighting parameters. The network processes input data samples in each branch to measure and evaluate the similarity or dissimilarity of these samples [30,31]. This general architecture allows the Siamese neural network to acquire informative representations of the input data, enabling it to make accurate comparisons and successfully perform decision-making tasks. More details on the architecture, hyperparameters, and their tuning can be found in our previous research [27,32,33].
As a result of processing the raw data on keystroke dynamics transformed into images using a Siamese neural network with triplet loss, multidimensional embeddings are extracted. These embeddings, denoted as , , represent the keystroke patterns of each user in p-dimensional space, where . Each embedding includes distinctive characteristics of the keystroke dynamics, embedding the typing behavior in the p-dimensional feature space.
3.5. Visualization of Multidimensional Embeddings
In solving the dimensionality reduction problem, we seek a final transformation that maps multidimensional embeddings to a set of points , where and , in a lower-dimensional space. This process is very important for interpreting embeddings, as it transforms complex keystroke patterns into a more convenient and visually interpretable format. By setting , we provide a graphical representation of the data, which is very important for decision support, in this case, for user authentication. Visualizing these reduced embeddings in two or three dimensions provides an intuitive view of the underlying structures and variations in keystroke dynamics, thus helping to identify genuine users and potentially illegitimate users.
4. Results
This section describes the results obtained with the proposed framework, which demonstrate the framework’s ability to extract the necessary features and visualize complex, multidimensional data representing keystroke dynamics. The CMU dataset [28] described in Section 3.2 was used in the experimental investigation. Since the data did not require any additional pre-processing, they were directly encoded into the images needed to train the deep neural network by using the GADF method. The decision to employ the GADF method was based on a thorough analysis of various non-image to image transformation techniques [32]. This analysis considered several key factors, including the ability to preserve time series characteristics and compatibility with CNN architectures. After data transformation, the Siamese neural network processed the obtained images, and training resulted in embeddings that summarized the specific typing style of each user in the multidimensional embedding space.
The experiments were conducted using public Python libraries and frameworks such as TensorFlow, Numpy, and Pandas, which are extensively employed for large-scale analysis and machine learning tasks. The computational experiments were carried out on an Apple MacBook Pro equipped with an M1 Pro chip, featuring a 10-core CPU and a 16-core GPU. While the specific duration of each experiment varied depending on the complexity of the tasks, we ensured that all experiments were conducted under controlled conditions to provide a fair comparison of the different methods evaluated.
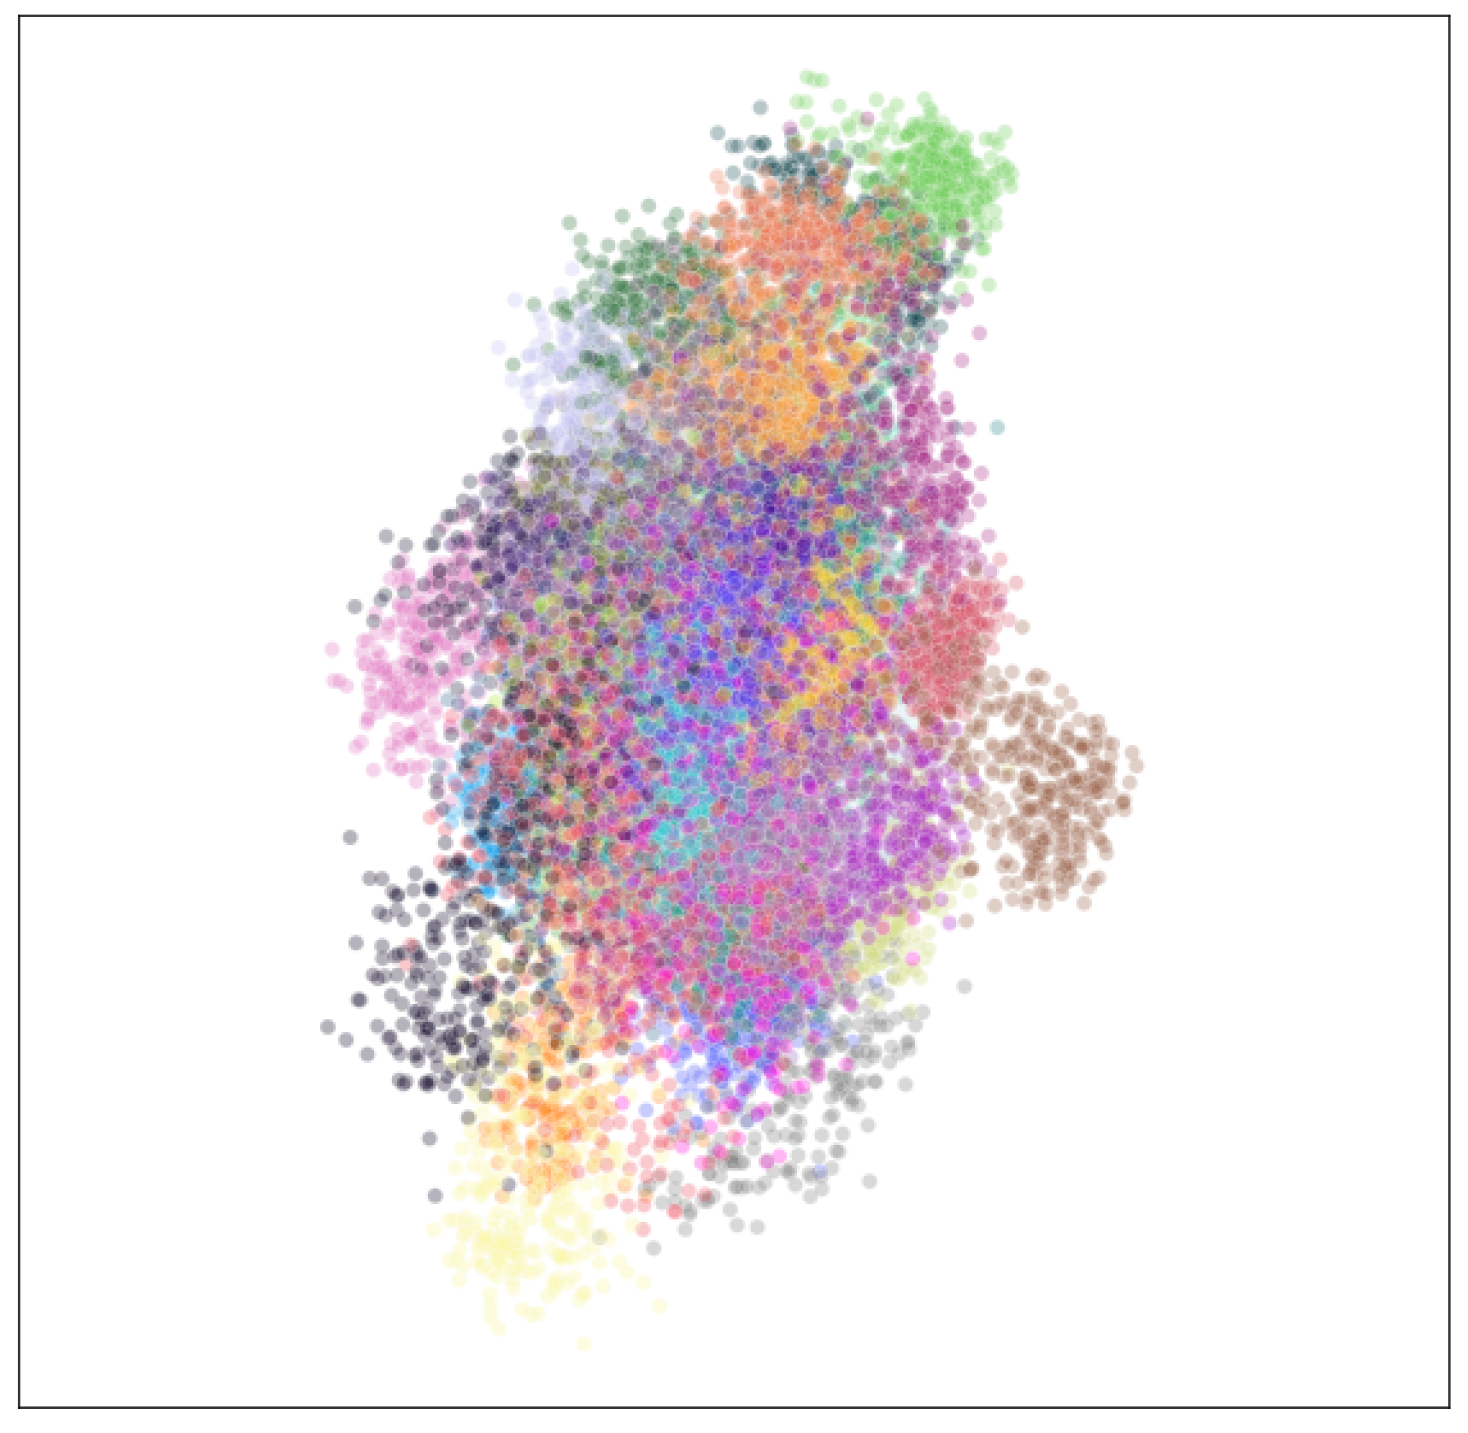
The results depicted in Figure 5 show the visualizations after applying different dimensionality reduction techniques to the embeddings obtained from the CMU dataset. Each color corresponds to a different user in the CMU dataset and represents individual behavioral profiles. This can be used to detect anomalies that may indicate unauthorized access attempts. PCA shows a wide spread of points but does not provide a clear view of the discrete clusters. LLE reveals some structure, but with a high degree of distortion. In the case of UMAP, it is possible to observe certain clusters, but the distinction between them is not sufficiently clear and obvious, which complicates the decision making and does not allow for making appropriate and reliable decisions. In contrast, t-SNE allows for a clear distinction between clusters and specifies the unique typing patterns of different users.
Figure 5 demonstrates the visualization results for embeddings with an initial dimensionality of 256. In order to test the hypothesis that the generation of multidimensional embeddings makes sense when their dimensionality is significantly higher than two (), it was decided to visualize the two-dimensional embeddings without applying any dimensionality reduction technique and to compare the resulting visualizations. The number of dimensions represents the number of outputs of the Siamese neural network. The results can be seen in Figure 6. Here, the points corresponding to the users are scattered widely, and there are no distinct clusters. A comparison of Figure 5 and Figure 6 justifies that embedding the data in a higher dimensional space using Siamese networks and visualizing the embeddings by dimensionality reduction techniques is meaningful.
In order to illustrate the performance of the proposed framework (see Section 3.1), it is meaningful to compare the visualization results of the raw multidimensional data (see Figure 4) and the multidimensional embeddings obtained by Siamese neural networks (see Figure 5). The comparison results illustrate that multidimensional embedding visualization is more suitable for decision making, as clusters corresponding to users’ keystroke dynamics patterns are better separated and more clearly visible (see Figure 5). As previously demonstrated, the employment of the t-SNE technique better reveals the structure of the patterns analyzed. Figure 4d represents the visualization of the raw keystroke dynamics data using t-SNE. The clusters appear to be slightly more diffused, with some overlapping between different colors, indicating that while distinct user patterns can be observed, the separation is not as clear-cut. This poses a challenge for decision making in user authentication, as the decision boundary between different users is not clear. As a result, a decision support system may have a higher rate of misclassification, leading to potential security vulnerabilities. Figure 5d shows the visualization of multidimensional embeddings extracted by the Siamese neural network using t-SNE. The clusters in this visualization are generally more distinct and separated from each other, with less overlap between colors. This suggests that the embeddings from the Siamese neural network provide a more refined and discriminative representation of keystroke dynamics and improve the separation between different users. Such visualization results contribute to more confident authentication decisions.
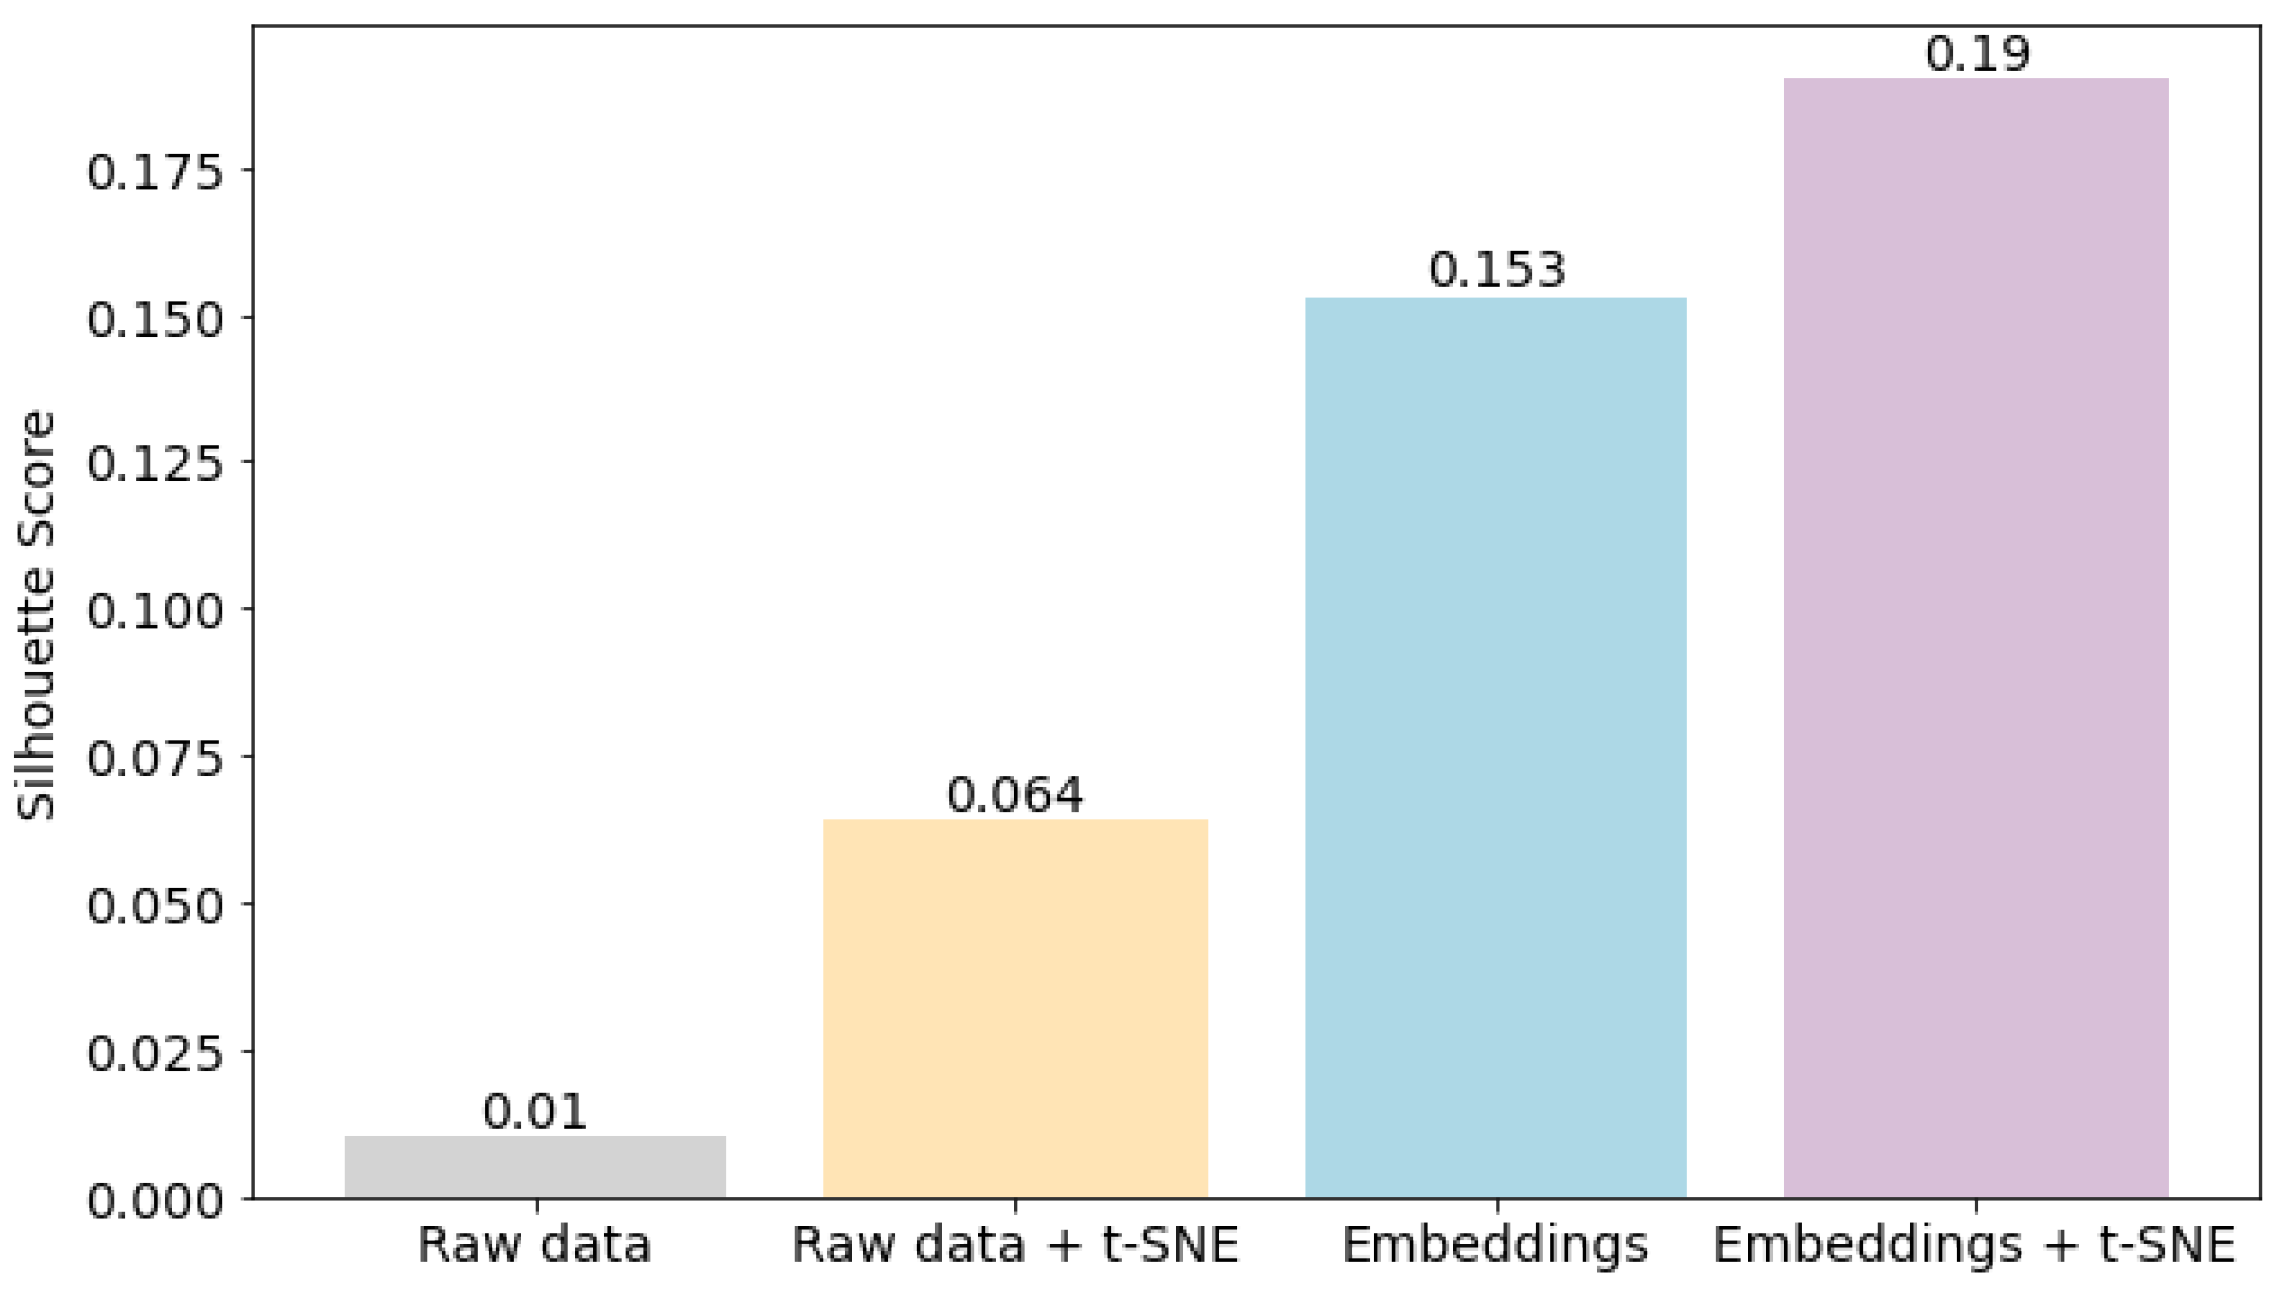
Furthermore, it is important to quantitatively evaluate how well the data in the lower-dimensional space represent the original data structure and relationships. After dimensionality reduction, data points are often clustered. The silhouette score [34] helps determine how internally cohesive and externally separated the clusters are (see Figure 7). This is important for understanding the effectiveness of the dimensionality reduction process. It provides insights into how well the data of the reduced dimensionality maintains the intrinsic clustering characteristics of the raw data, thereby helping to quantitatively assess the impact of the framework on the data structure.
As we can see in Figure 7, the lowest silhouette score of 0.01 is obtained for raw multidimensional data. It suggests that the raw data does not naturally form well-defined clusters. This could be due to high dimensionality or inherent noise and variability in the data. Applying t-SNE to the raw data results in a higher silhouette score of 0.064. This improvement indicates that t-SNE helps in revealing the some underlying structure of the data, making the clusters more distinct than in the raw data. When the raw data are transformed into images, and the resulting images are used to train a Siamese neural network, the silhouette score for the multidimensional embeddings obtained at the network outputs is 0.153, which is a significant improvement over the raw data. This suggests that the embedding process effectively captures the essential features, leading to better clustering. The highest silhouette score is observed when t-SNE is applied to the multidimensional embeddings, reaching 0.190. This indicates that the combination of embedding techniques with t-SNE results in the most distinct and well-separated clusters of all analyzed data.
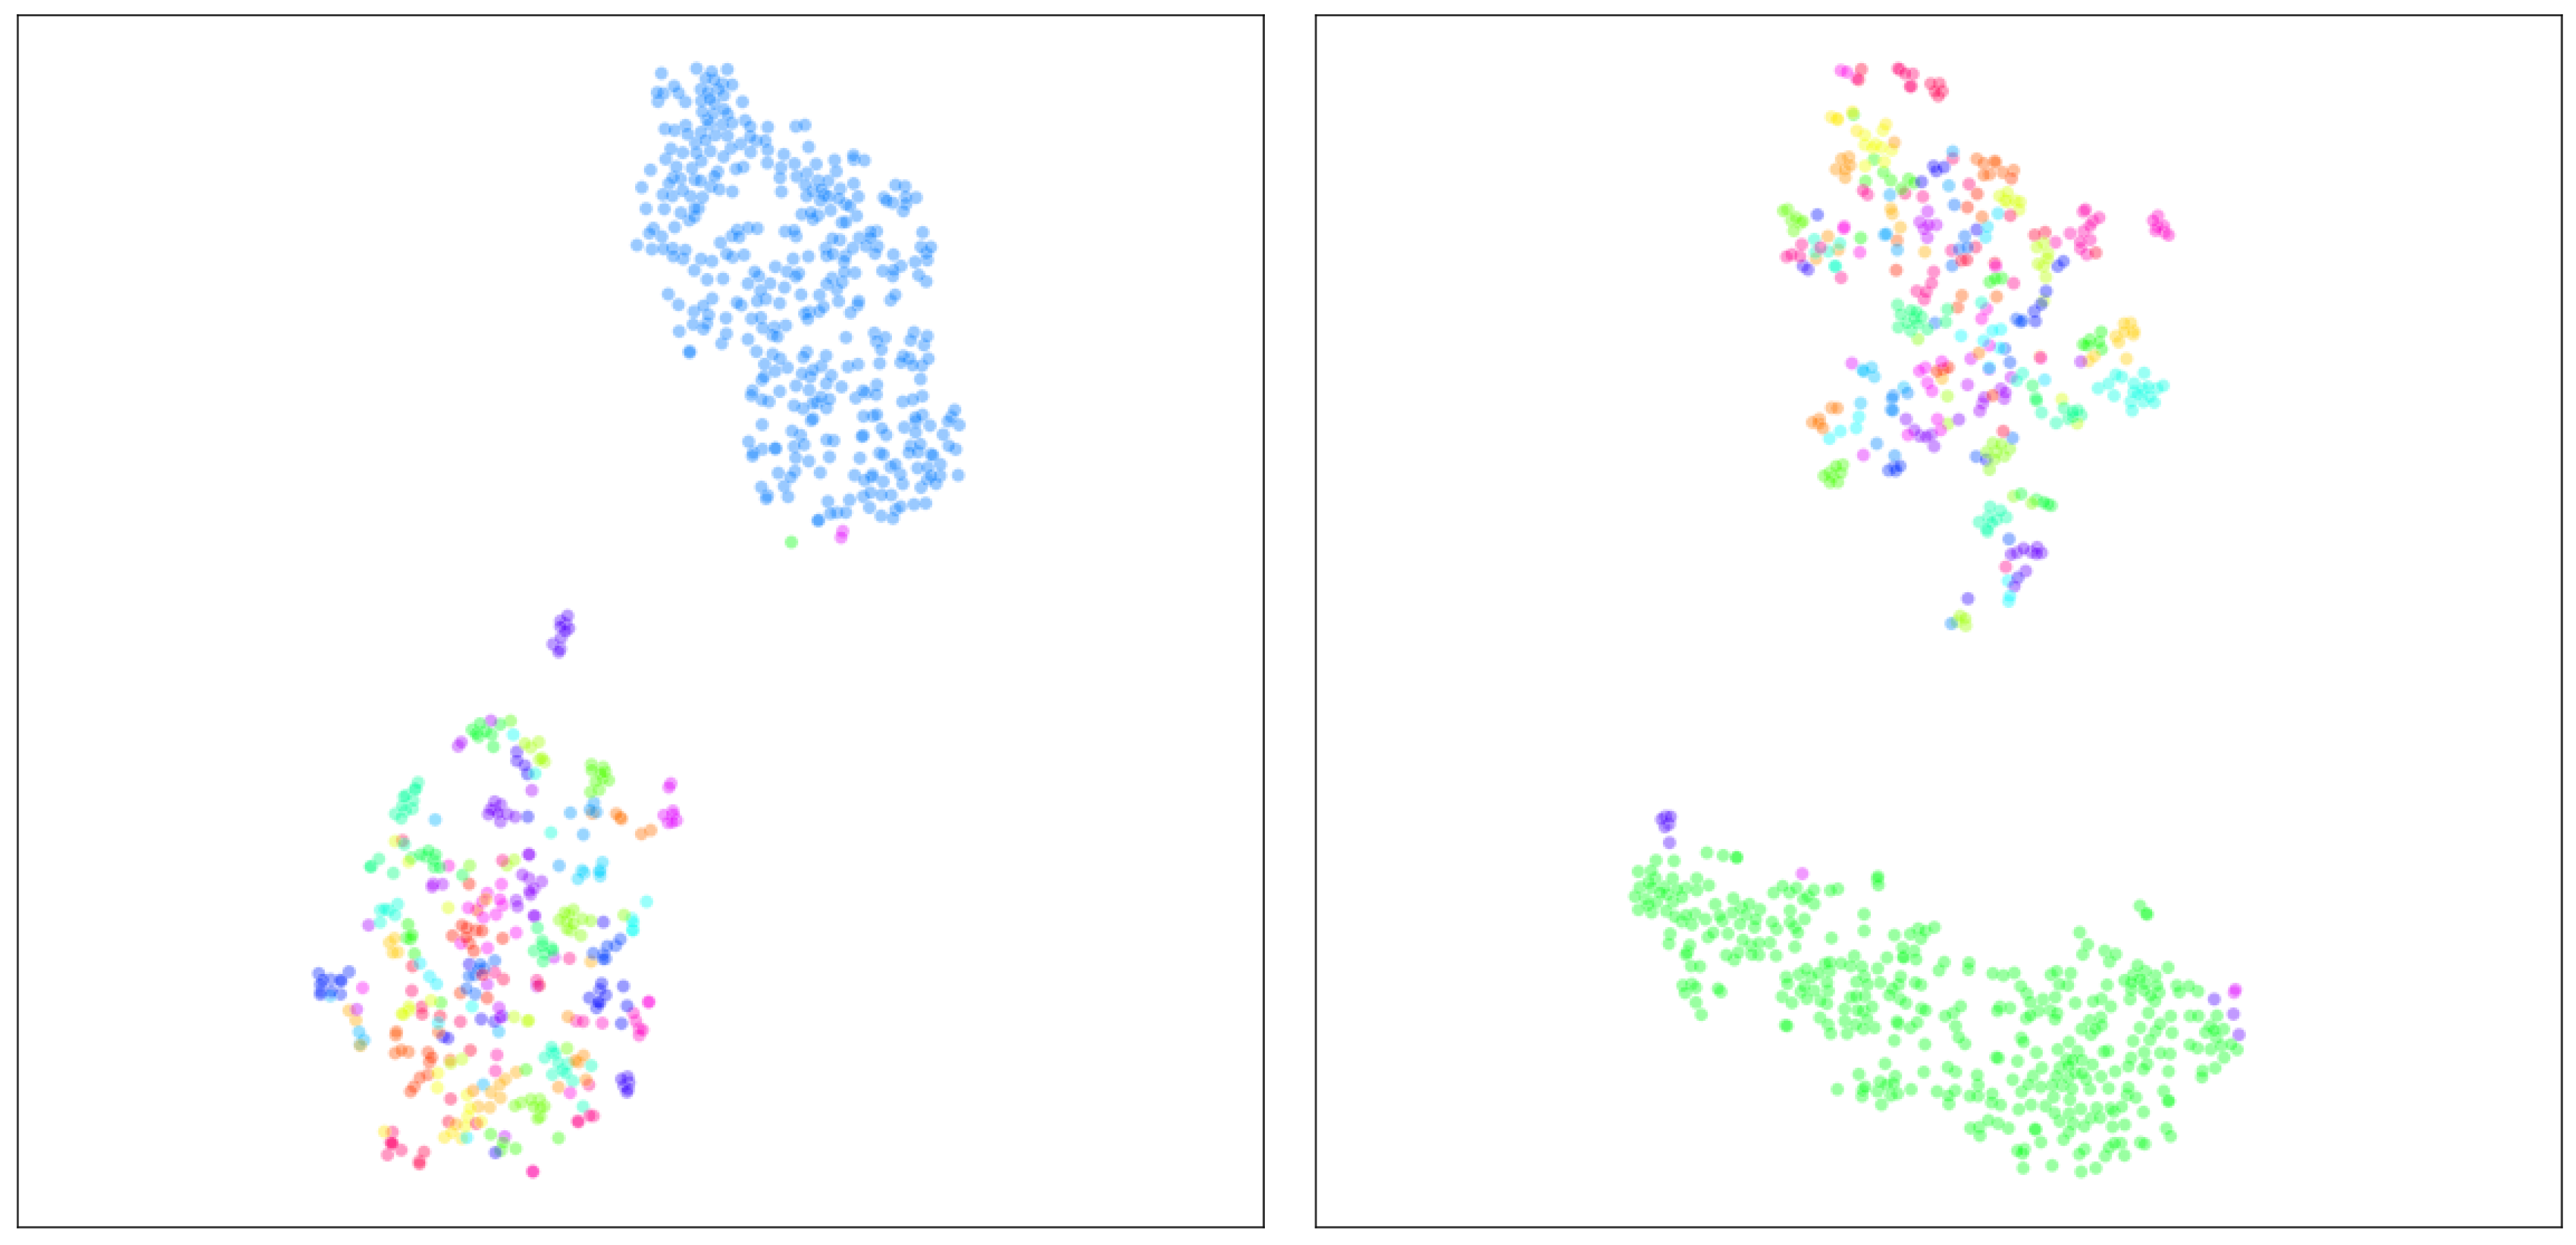
To evaluate the suitability of the proposed framework for decision making and to distinguish legitimate users from illegitimate users according to their typing behavior, we illustrate the application of this visualization process on two different examples, each representing a separate user from the CMU dataset. In each case, we visualize all the keystroke data samples of one user and compare them with 400 randomly selected samples of other users. In Figure 8, the clusters of blue points represent the multiple password attempts of the selected user, while the multicolored points represent the randomly selected attempts of other users. This separation shows the similar password behavior of the selected user, whose pattern is clearly different from the other users. The same visualization approach is applied to the second example (the green cluster). Here, the user’s data samples also form a separate cluster that is distinguishable from the other users’ samples. The consistency of the results in both examples confirms the validity of the multidimensional data visualization process. The silhouette scores of 0.690 (Figure 8, on the left) and 0.645 (Figure 8, on the right) justify the effectiveness of the visualization framework for distinguishing between legitimate and illegitimate users based on their typing patterns using the CMU keystroke dynamics dataset. This fairly clear distinction highlights the potential of using the framework to define and visualize individual typing behavior, a critical capability for detecting unauthorized access attempts.
5. Discussion and Conclusions
This paper presents a study of dimensionality reduction-based visualization techniques that embrace complex multidimensional data representations and are useful for inferences in decision support systems, such as static user authentication. We present a novel framework that uses deep neural networks to analyze multidimensional data encoded into images, transforming this data into multidimensional embeddings. The proposed framework, which combines Siamese neural networks with a triplet loss function and advanced dimensionality reduction techniques, has been successfully evaluated on the CMU dataset of keystroke dynamics. The results confirm that the framework is capable of efficiently processing and visualizing complex, high-dimensional data. By transforming tabular data into a visual format, the Siamese neural network is able to extract distinctive features by converting them into multidimensional embeddings.
By applying dimensionality reduction techniques such as PCA, LLE, UMAP, and t-SNE, multidimensional embeddings can be represented in 2D space. This representation helps to identify patterns and anomalies that may not be obvious in high-dimensional space. It also allows us to explore the relationships and clusters formed by the embeddings. Additionally, the silhouette score was used to quantitatively evaluate how well the data in the lower dimensional space represents the original data structure. The results show that the higher silhouette scores obtained when multidimensional embeddings are visualized using t-SNE as compared to the raw data highlight the importance of the proposed data visualization framework for revealing patterns and structures in complex multidimensional data.
The resulting visualizations of multidimensional embeddings have greatly enhanced the decision support capabilities in the context of user authentication using keystroke dynamics. The clearer distinction between clusters of users, provided by the proposed dimensionality reduction-based visualization of embeddings obtained through a deep neural network, allows for easier detection of anomalous behavior indicative of potential unauthorized access attempts, as compared to the classical visualization of raw multidimensional data. In addition, the integration of deep neural networks enables the visualization of new data without the need to retrain the network. This solution proves advantageous in efficiently processing and analyzing large amounts of data.
While this study has shown promising capabilities to simplify complex data analysis and increase the efficiency of decision support systems, we face several limitations related to the study. One of the main limitations is that only one specific dataset was used to validate the proposed framework. This focus may limit the generalizability of the findings to different types of multidimensional data and applications. Another limitation relates to the evaluation of the visualization results in terms of the clusters formed. The silhouette score was chosen for its capability to measure the quality of clustering, which was considered appropriate for the initial research on the effectiveness of the proposed dimensionality reduction methods. However, this metric alone may not fully reflect the superiority of different algorithms, especially in the presence of complex, multidimensional data, where many factors determine performance. Addressing these limitations provides several directions for future research. To increase the generality and applicability of the proposed solution, its validation needs to be extended to more datasets and application domains. Although the proposed framework has been successfully employed in the analysis of keystroke dynamics, its application potential extends to other domains where the visualization and interpretation of multidimensional data are of key importance in complex data analysis. Future research will aim to incorporate additional metrics to provide a more comprehensive evaluation of multidimensional embedding visualization based on dimensionality reduction.
Author Contributions
Conceptualization, O.K., A.B. and V.M.; methodology, A.B., O.K. and V.M.; software, A.B.; validation, A.B., O.K. and V.M.; formal analysis, O.K.; investigation, A.B. and V.M.; resources, A.B.; data curation, A.B.; writing—original draft preparation, O.K., A.B. and V.M.; writing—review and editing, O.K., A.B. and V.M.; visualization, V.M.; supervision, O.K. All authors have read and agreed to the published version of the manuscript.
Funding
This research received no external funding.
Institutional Review Board Statement
Not applicable.
Informed Consent Statement
Not applicable.
Data Availability Statement
Data are available on demand.
Conflicts of Interest
The authors declare no conflicts of interest.
Abbreviations
The following abbreviations are used in this manuscript:
| CNN | Convolutional Neural Network |
| CMU | Carnegie Mellon University |
| GADF | Gramian Angular Difference Field |
| GASF | Gramian Angular Summation Field |
| LLE | Local Linear Embedding |
| MDS | Multidimensional Scaling |
| PCA | Principal Component Analysis |
| t-SNE | t-Distributed Stochastic Neighbour Embedding |
| UMAP | Uniform Manifold Approximation and Projection |
References
- Fujiwara, T.; Kwon, O.H.; Ma, K.L. Supporting Analysis of Dimensionality Reduction Results with Contrastive Learning. IEEE Trans. Vis. Comput. Graph. 2020, 26, 45–55. [Google Scholar] [CrossRef] [PubMed]
- Dimara, E.; Bezerianos, A.; Dragicevic, P. Conceptual and methodological issues in evaluating multidimensional visualizations for decision support. IEEE Trans. Vis. Comput. Graph. 2017, 24, 749–759. [Google Scholar] [CrossRef] [PubMed]
- Elliot, K.; Graham, J.; Yassin, Y.; Ward, T.; Caldwell, J.; Attie, T. A comparison of machine learning algorithms in keystroke dynamics. In Proceedings of the 2019 International Conference on Computational Science and Computational Intelligence (CSCI), Las Vegas, NV, USA, 5–7 December 2019; pp. 127–132. [Google Scholar] [CrossRef]
- Murphy, K.P. Probabilistic Machine Learning: An Introduction; MIT Press: Cambridge, MA, USA, 2022. [Google Scholar]
- Zhou, Z.H. Dimensionality reduction and metric learning. In Machine Learning; Springer: Singapore, 2021; pp. 241–264. [Google Scholar] [CrossRef]
- Ray, P.; Reddy, S.S.; Banerjee, T. Various dimension reduction techniques for high dimensional data analysis: A review. Artif. Intell. Rev. 2021, 54, 3473–3515. [Google Scholar] [CrossRef]
- Jolliffe, I. Principal Component Analysis. In Encyclopedia of Statistics in Behavioral Science; John Wiley & Sons, Ltd.: Hoboken, NJ, USA, 2005. [Google Scholar] [CrossRef]
- Mardia, K.; Kent, J.; Bibby, J. Multivariate Analysis (Probability and Mathematical Statistics); Acad. Press: London, UK, 1979. [Google Scholar]
- Borg, I.; Groenen, P.J. Modern Multidimensional Scaling: Theory and Applications; Springer Science & Business Media: New York, NY, USA, 2005. [Google Scholar]
- Dzemyda, G.; Sabaliauskas, M.; Medvedev, V. Geometric MDS Performance for Large Data Dimensionality Reduction and Visualization. Informatica 2022, 33, 299–320. [Google Scholar] [CrossRef]
- Jackson, J.E. A User’s Guide to Principal Components; John Wiley & Sons: Hoboken, NJ, USA, 1991; Volume 587. [Google Scholar] [CrossRef]
- Roweis, S.T.; Saul, L.K. Nonlinear dimensionality reduction by locally linear embedding. Science 2000, 290, 2323–2326. [Google Scholar] [CrossRef] [PubMed]
- Wang, Y.; Huang, H.; Rudin, C.; Shaposhnik, Y. Understanding How Dimension Reduction Tools Work: An Empirical Approach to Deciphering t-SNE, UMAP, TriMap, and PaCMAP for Data Visualization. J. Mach. Learn. Res. 2021, 22, 1–73. [Google Scholar]
- Espadoto, M.; Martins, R.M.; Kerren, A.; Hirata, N.S.T.; Telea, A.C. Toward a Quantitative Survey of Dimension Reduction Techniques. IEEE Trans. Vis. Comput. Graph. 2021, 27, 2153–2173. [Google Scholar] [CrossRef] [PubMed]
- Van der Maaten, L.; Hinton, G. Visualizing data using t-SNE. J. Mach. Learn. Res. 2008, 9, 2579–2605. [Google Scholar]
- McInnes, L.; Healy, J.; Saul, N.; Großberger, L. UMAP: Uniform Manifold Approximation and Projection. J. Open Source Softw. 2018, 3, 861. [Google Scholar] [CrossRef]
- Dzemyda, G.; Kurasova, O.; Žilinskas, J. Multidimensional Data Visualization: Methods and Applications; Springer Optimization and its Applications; Springer: New York, NY, USA, 2013; Volume 75. [Google Scholar] [CrossRef]
- Kurasova, O.; Molyte, A. Quality of Quantization and Visualization of Vectors Obtained by Neural Gas and Self-Organizing Map. Informatica 2011, 22, 115–134. [Google Scholar] [CrossRef]
- Xu, X.; Liang, T.; Zhu, J.; Zheng, D.; Sun, T. Review of classical dimensionality reduction and sample selection methods for large-scale data processing. Neurocomputing 2019, 328, 5–15. [Google Scholar] [CrossRef]
- Rafieian, B.; Hermosilla, P.; Vázquez, P.P. Improving Dimensionality Reduction Projections for Data Visualization. Appl. Sci. 2023, 13, 9967. [Google Scholar] [CrossRef]
- Fournier, Q.; Aloise, D. Empirical comparison between autoencoders and traditional dimensionality reduction methods. In Proceedings of the 2019 IEEE Second International Conference on Artificial Intelligence and Knowledge Engineering (AIKE), Sardinia, Italy, 3–5 June 2019; pp. 211–214. [Google Scholar] [CrossRef]
- Brito, L.C.; Susto, G.A.; Brito, J.N.; Duarte, M.A.V. Fault detection of bearing: An unsupervised machine learning approach exploiting feature extraction and dimensionality reduction. Informatics 2021, 8, 85. [Google Scholar] [CrossRef]
- Abdullah, S.S.; Rostamzadeh, N.; Sedig, K.; Garg, A.X.; McArthur, E. Visual analytics for dimension reduction and cluster analysis of high dimensional electronic health records. Informatics 2020, 7, 17. [Google Scholar] [CrossRef]
- Malepathirana, T.; Senanayake, D.A.; Gautam, V.; Halgamuge, S.K. Robustness of Visualization Methods in Preserving the Continuous and Discrete Latent Structures of High-Dimensional Single-Cell Data. In Proceedings of the 2021 IEEE Conference on Computational Intelligence in Bioinformatics and Computational Biology (CIBCB), Melbourne, Australia, 13–15 October 2021; pp. 1–9. [Google Scholar] [CrossRef]
- Schneider, S.; Lee, J.H.; Mathis, M.W. Learnable latent embeddings for joint behavioural and neural analysis. Nature 2023, 617, 360–368. [Google Scholar] [CrossRef] [PubMed]
- Wang, Z.; Oates, T. Imaging time-series to improve classification and imputation. In Proceedings of the 24th International Conference on Artificial Intelligence, Buenos Aires, Argentina, 25–31 July 2015; pp. 3939–3945. [Google Scholar]
- Medvedev, V.; Budžys, A.; Kurasova, O. Enhancing Keystroke Biometric Authentication Using Deep Learning Techniques. In Proceedings of the 2023 18th Iberian Conference on Information Systems and Technologies (CISTI), Aveiro, Portugal, 20–23 June 2023; pp. 1–6. [Google Scholar] [CrossRef]
- Killourhy, K.S.; Maxion, R.A. Comparing anomaly-detection algorithms for keystroke dynamics. In Proceedings of the 2009 IEEE/IFIP International Conference on Dependable Systems & Networks, Lisbon, Portugal, 29 June–2 July 2009; pp. 125–134. [Google Scholar] [CrossRef]
- Zhao, X.; Sun, H.; Lin, B.; Zhao, H.; Niu, Y.; Zhong, X.; Wang, Y.; Zhao, Y.; Meng, F.; Ding, J.; et al. Markov Transition Fields and Deep Learning-Based Event-Classification and Vibration-Frequency Measurement for ϕ-OTDR. IEEE Sens. J. 2022, 22, 3348–3357. [Google Scholar] [CrossRef]
- Zhou, X.; Liang, W.; Shimizu, S.; Ma, J.; Jin, Q. Siamese neural network based few-shot learning for anomaly detection in industrial cyber-physical systems. IEEE Trans. Ind. Inform. 2020, 17, 5790–5798. [Google Scholar] [CrossRef]
- Schroff, F.; Kalenichenko, D.; Philbin, J. Facenet: A unified embedding for face recognition and clustering. In Proceedings of the IEEE Conference on Computer Vision and Pattern Recognition, Boston, MA, USA, 5–12 June 2015; pp. 815–823. [Google Scholar] [CrossRef]
- Budžys, A.; Kurasova, O.; Medvedev, V. Behavioral Biometrics Authentication in Critical Infrastructure Using Siamese Neural Networks. In Proceedings of the HCI for Cybersecurity, Privacy and Trust. LNCS, Copenhagen, Denmark, 23–28 July 2023; pp. 1–14. [Google Scholar] [CrossRef]
- Dong, X.; Shen, J. Triplet loss in Siamese network for object tracking. In Proceedings of the European Conference on Computer Vision (ECCV), Munich, Germany, 8–14 September 2018; pp. 459–474. [Google Scholar] [CrossRef]
- Shutaywi, M.; Kachouie, N.N. Silhouette analysis for performance evaluation in machine learning with applications to clustering. Entropy 2021, 23, 759. [Google Scholar] [CrossRef] [PubMed]
Figure 1.
Visualization techniques used to represent multidimensional data in a lower-dimensional space.
Figure 1.
Visualization techniques used to represent multidimensional data in a lower-dimensional space.

Figure 2.
Visualization of the keystroke dynamics for authentication based on an example with two users (each color represents a different user).
Figure 2.
Visualization of the keystroke dynamics for authentication based on an example with two users (each color represents a different user).

Figure 3.
The visualization framework based on dimensionality reduction for multidimensional embedding analysis in decision support.
Figure 3.
The visualization framework based on dimensionality reduction for multidimensional embedding analysis in decision support.

Figure 4.
Multidimensional data visualizations by using different dimensionality reduction techniques: (a) PCA, (b) LLE, (c) UMAP, (d) t-SNE. Each color corresponds to a different user in the CMU dataset.
Figure 4.
Multidimensional data visualizations by using different dimensionality reduction techniques: (a) PCA, (b) LLE, (c) UMAP, (d) t-SNE. Each color corresponds to a different user in the CMU dataset.

Figure 5.
Visualization of multidimensional embeddings obtained by Siamese neural network using different dimensionality reduction techniques (): (a) PCA, (b) LLE, (c) UMAP, (d) t-SNE. Each color corresponds to a different user in the CMU dataset.
Figure 5.
Visualization of multidimensional embeddings obtained by Siamese neural network using different dimensionality reduction techniques (): (a) PCA, (b) LLE, (c) UMAP, (d) t-SNE. Each color corresponds to a different user in the CMU dataset.

Figure 6.
Visualization of two-dimensional embeddings () obtained by Siamese neural network.

Figure 7.
Silhouette scores before and after applying t-SNE on raw multidimensional data and their embeddings.
Figure 7.
Silhouette scores before and after applying t-SNE on raw multidimensional data and their embeddings.

Figure 8.
Examples of visualizations that show password typing patterns of the same user and the other randomly selected users.
Figure 8.
Examples of visualizations that show password typing patterns of the same user and the other randomly selected users.


Table 1.
Comparison of dimensionality-reduction techniques.
| Techniques | Advantages | Disadvantages |
|---|---|---|
| PCA [7,8] | Efficient for linear dimensionality reduction. Fast and scalable to large datasets. | Assumes linear relationships between features. May not capture complex, nonlinear structures in data. |
| MDS [8,9,10] | Aims to preserve the pairwise distances between points in multidimensional and low-dimensional spaces. Can be used to visualize dissimilarities or similarities in data. | Can be computationally expensive and not suitable for large datasets. Performance may degrade with very high-dimensional data. Sensitive to noise. |
| LLE [12] | Maintains local relationships effectively in high-dimensional data. Uncovers underlying manifold structures. | Can produce distorted results if the data contains significant noise or outliers. Difficulties with maintaining global data relationships. |
| t-SNE [15] | Excellent at revealing local data structures and clusters. Effective for high-dimensional data visualization. | Computationally intensive, especially for large datasets. Results can vary based on hyperparameter settings. |
| Isomap [13,14] | Attempts to preserve the geodesic distances between all points. Good for datasets lying on a curved manifold. Reveals the intrinsic geometry of the data. | Computationally expensive for large datasets. Performance is sensitive to noise and outliers. The choice of neighbors can significantly affect the results. |
| UMAP [16] | Good at preserving both local and global data structures. Faster and scales better to larger datasets than t-SNE. | Hyperparameters can significantly affect the results. Less intuitive to understand and interpret compared to others. |
| Autoencoders [21] | Flexible, nonlinear dimensionality reduction. Can learn complex data structures. | Requires significant computational resources for training. Risk of overfitting to the training data. Model architecture and hyperparameters need careful tuning. |
Disclaimer/Publisher’s Note: The statements, opinions and data contained in all publications are solely those of the individual author(s) and contributor(s) and not of MDPI and/or the editor(s). MDPI and/or the editor(s) disclaim responsibility for any injury to people or property resulting from any ideas, methods, instructions or products referred to in the content. |
© 2024 by the authors. Licensee MDPI, Basel, Switzerland. This article is an open access article distributed under the terms and conditions of the Creative Commons Attribution (CC BY) license (https://creativecommons.org/licenses/by/4.0/).
Share and Cite
MDPI and ACS Style
Kurasova, O.; Budžys, A.; Medvedev, V. Exploring Multidimensional Embeddings for Decision Support Using Advanced Visualization Techniques. Informatics 2024, 11, 11. https://doi.org/10.3390/informatics11010011
AMA Style
Kurasova O, Budžys A, Medvedev V. Exploring Multidimensional Embeddings for Decision Support Using Advanced Visualization Techniques. Informatics. 2024; 11(1):11. https://doi.org/10.3390/informatics11010011
Chicago/Turabian StyleKurasova, Olga, Arnoldas Budžys, and Viktor Medvedev. 2024. "Exploring Multidimensional Embeddings for Decision Support Using Advanced Visualization Techniques" Informatics 11, no. 1: 11. https://doi.org/10.3390/informatics11010011
Note that from the first issue of 2016, this journal uses article numbers instead of page numbers. See further details here.