Evaluating Awareness and Perception of Botnet Activity within Consumer Internet-of-Things (IoT) Networks

School of Computing Science and Digital Media, Robert Gordon University, Aberdeen AB10 7GJ, UK
*
Author to whom correspondence should be addressed.
Informatics 2019, 6(1), 8; https://doi.org/10.3390/informatics6010008
Submission received: 30 November 2018
/
Revised: 31 January 2019
/
Accepted: 11 February 2019
/
Published: 18 February 2019
(This article belongs to the Special Issue Human Factors in Security and Privacy in IoT (HFSP-IoT))
Abstract
:The growth of the Internet of Things (IoT), and demand for low-cost, easy-to-deploy devices, has led to the production of swathes of insecure Internet-connected devices. Many can be exploited and leveraged to perform large-scale attacks on the Internet, such as those seen by the Mirai botnet. This paper presents a cross-sectional study of how users value and perceive security and privacy in smart devices found within the IoT. It analyzes user requirements from IoT devices, and the importance placed upon security and privacy. An experimental setup was used to assess user ability to detect threats, in the context of technical knowledge and experience. It clearly demonstrated that without any clear signs when an IoT device was infected, it was very difficult for consumers to detect and be situationally aware of threats exploiting home networks. It also demonstrated that without adequate presentation of data to users, there is no clear correlation between level of technical knowledge and ability to detect infected devices.
1. Introduction
The Internet of Things (IoT) is expected to usher in an era of increased connectivity, with an estimated 50 billion devices expected to be connected to the Internet by 2020 [1]. At its core, the aim of the IoT is to connect previously unconnected devices to the Internet [2], thus creating smart devices capable of collecting, storing and sharing data, without requiring human interaction [3,4]. Many of these IoT devices are aimed at non-technical consumers, who value low cost and ease of deployment, leading to some IoT manufacturers omitting critical security features, and producing swathes of insecure Internet connected devices, such as IP cameras and Digital Video Recorder (DVR) boxes. Such vulnerabilities and exploits are often derived and epitomized by inherent computational limitations, lack of convenient user interface, use of default credentials and insecure protocols. The rapid proliferation of insecure IoT devices and ease by which attackers can locate them using online services, such as shodan [5], provides an ever-expanding pool of attack resources. By comprising multitudes of these vulnerable IoT devices, attackers can now perform large-scale attacks such as spamming, phishing and Distributed Denial of Service (DDoS), against resources on the Internet [6].
The rise in IoT-based DDoS attacks, witnessed in recent years, will likely continue until IoT manufacturers accept responsibility and manufacture devices with security inherently built in. Until such a time, the IoT has the potential to become a new playground for future cyber-attacks and therefore presents several challenges. Since an increasing number of DDoS attacks seek to leverage consumer level IoT devices, the issues highlighted previously, coupled with a lack of technical knowledge or awareness of inherent vulnerabilities, by owners of these devices, presents a challenge and area of investigation for security researchers. This purpose of this study is to evaluate user awareness and perceptions of security and privacy challenges facing the IoT. In doing so an online survey is used to gather empirical evidence and evaluate user ability to detect if an IoT device is infected with malware. Thus, the main contributions of this paper are:
- Evaluation of user perceptions towards security and privacy within smart devices found in the IoT;
- Analysis of user situational awareness and ability to detect threats in consumer IoT networks.
The rest of the paper is organized as follows: Section 2 introduces previous studies and work, relating to human aspects of information security. Section 3 describes the experimental setup and methods used to collect empirical data, with results presented in Section 4. In Section 5 and Section 6 we discuss the findings and provide comments on the limitations of the research. Finally, in Section 7 we provide concluding remarks and suggestions for future research directions.
2. Literature Review
Many studies exist relating to human-centered security and the perception of risk. Understanding how users perceive risk, is an important consideration when attempting to evaluate and promote better situational awareness of risks relating to security and privacy.
It is increasingly acknowledged that many threats facing computer systems within an organization, can be attributed to the behavior of their users [7]. In this research the authors developed a survey Human Aspects of Information Security Questionnaire (HAIS-Q), to examine the relationship between knowledge of policy and procedures, attitude towards them, and user behavior when using a computer. They found that knowledge of policy and procedures had a stronger influence on their attitude towards policy and procedures, than self-reported behavior. They extended their work in [8] where 112 university students completed the HAIS-Q and took part in a phishing experiment. Results showed that participants who scored highly in the questionnaire performed better in the experiment, demonstrating the validity and reliability of the HASI-Q questionnaire as an instrument to measure security awareness in users. A similar study was carried out in [9] which assessed user behavior using four criteria, Risky Behavior Scale (RBS), Conservative Behavior Scale (CBS), Exposure to Offence Scale (EOS), and Risk Perception Scale (RPS). They demonstrated significant differences between user groups (academics, admin staff and students) for three of the criteria RBS, CBS, EOS, but no difference between user groups in the RPS criteria. The findings showed that the better respondents perceived threats, the more proactive their behavior became.
In [10] the authors explored consumer awareness of privacy risks relating to Smart TVs. The results of an online study of 200 participants, demonstrated a low level of general awareness, with only 16% demonstrating an awareness of associated risks. They further found that users were more likely to deploy a privacy-protection method, if the implemented measure did not reduce the functionality of the Smart TV.
An online survey was used in [11] to assess the risk perception and aversion of 1299 respondents, towards security policy compliance within a company. The level of risk an individual can tolerate versus the degree of loss they could receive was measured. When presented with a scenario of whether anti-virus software should be installed, when only a 1% risk of infection was present, 52.7% of respondents indicated the software should be installed. The motivating factors for compliance with company security policies was explored, and found happiness, peer perception, career progression, and profit to be the main motivating factors for compliance. In a similar study [12] of 3000 households in Spain, users were asked to install anti-virus software, and complete a quarterly questionnaire. Interestingly, the study found that installing the anti-virus software instilled a false perception of safety towards security risks. Many users appeared to neglect previously good security habits after installing the software, which could ultimately increase their exposure to risk. In a similar study [13] the knowledge, attitude and behavior of 203 employees towards information security was assessed. The results showed that although most employees scored highly in their knowledge of information security, suggesting good awareness, this did not always translate to good security behaviors. The authors suggested that remedial action should be directed towards training, rather than awareness building.
The use of security warnings to alert users about events that occur on their computer, that could compromise their security and privacy, was researched in [14,15,16]. In [15] the authors suggest that users tend to ignore security warnings due to a lack of attention, understanding or motivation. A survey was used to gain understanding of user perception and understanding towards security warnings. They investigated if a correlation existed between perception of risk and individual variables such as gender, education level or technical ability. They demonstrated that alerts using certain phrases or graphical icons, a relationship existed between technical ability and a user’s understanding of the warning. These individual variables were also investigated for their relationship to security awareness in [17]. Age was found to have a linear relationship with security awareness. The study also found that variables such as conscientiousness, agreeableness, emotional stability and risk-taking propensity, also had a significant impact on the variance of security awareness among users. In [16] a combined monitoring and affective feedback system is proposed to promote better general awareness of online security. On automatic detection of risky security behavior, a browser extension was used to deliver affective feedback to the user, warning users about their actions. Behaviors such as short password lengths, personal information (in a password) or malicious links on a page, were used to trigger the system and provide automatic feedback. Results showed that providing inline affective feedback improved overall awareness of security risks online, and allowed users to consider, at the time of execution, whether their online behavior could be perceived as risky.
A small-scale study was conducted in [18] to establish the views of non-expert users (NEU) on personal cyber security. Participants reported perceiving bank fraud, spam emails and malicious hyperlinks as being the greatest threats they faced, with 63% reporting they were concerned about security when using the Internet. Despite an obvious concern, they found that users had little grasp of their own security habits, and only a small percentage used tools to monitor their exposure to risk. To address the lack of awareness, they present a threat visualisation tool to better support user understanding and perception of cybersecurity concerns.
Authentication plays a vital role in user security. Eight authentication technologies were compared in [19] to assess which method(s) participants preferred, and how they perceived security relating to each. A variety of methodologies were presented namely, text password, graphical password, iris scan, facial recognition, ear shape, gesture, fingerprint, and speech, and participants instructed to use a selection of the authentication technologies to log into a system. Results showed that the largest percentage of participants preferred to use text passwords due to personal habit, simplicity and protection of their personal data. Interestingly, although this was the preferred method, it was not rated the most secure, with fingerprint perceived as being the most secure technology, due to its uniqueness and protection against forgery. Despite being rated securely, participants had concerns surrounding their personal data when using bio-metric authentication methods, suggesting a possible paradox between desired and actual security and privacy.
3. Methods and Data Collection
To collect the necessary data for the research presented in this paper, the University’s Research Ethics Policy was followed to establish and promote good ethical practice in the undertaking of this study. In doing so, consent to participate was implied when participants decided to engage in the research and complete the online survey.
A cross-sectional study design was used to allow multiple relevant variables to be compared. An online survey instrument was produced, and convenience sampling initially employed, with subjects selected due to their convenient accessibility and proximity to the author. The link to the online survey was therefore initially shared with a local student population, and later shared more widely via LinkedIn and Facebook. The online survey was split into two sections comprised of 17 questions in total. Section one collected information relating to user awareness and requirements of security and privacy in smart devices contained within the IoT. Section two evaluated user ability to identify when a smart device had been infected, and was being used to perform attacks on the Internet.
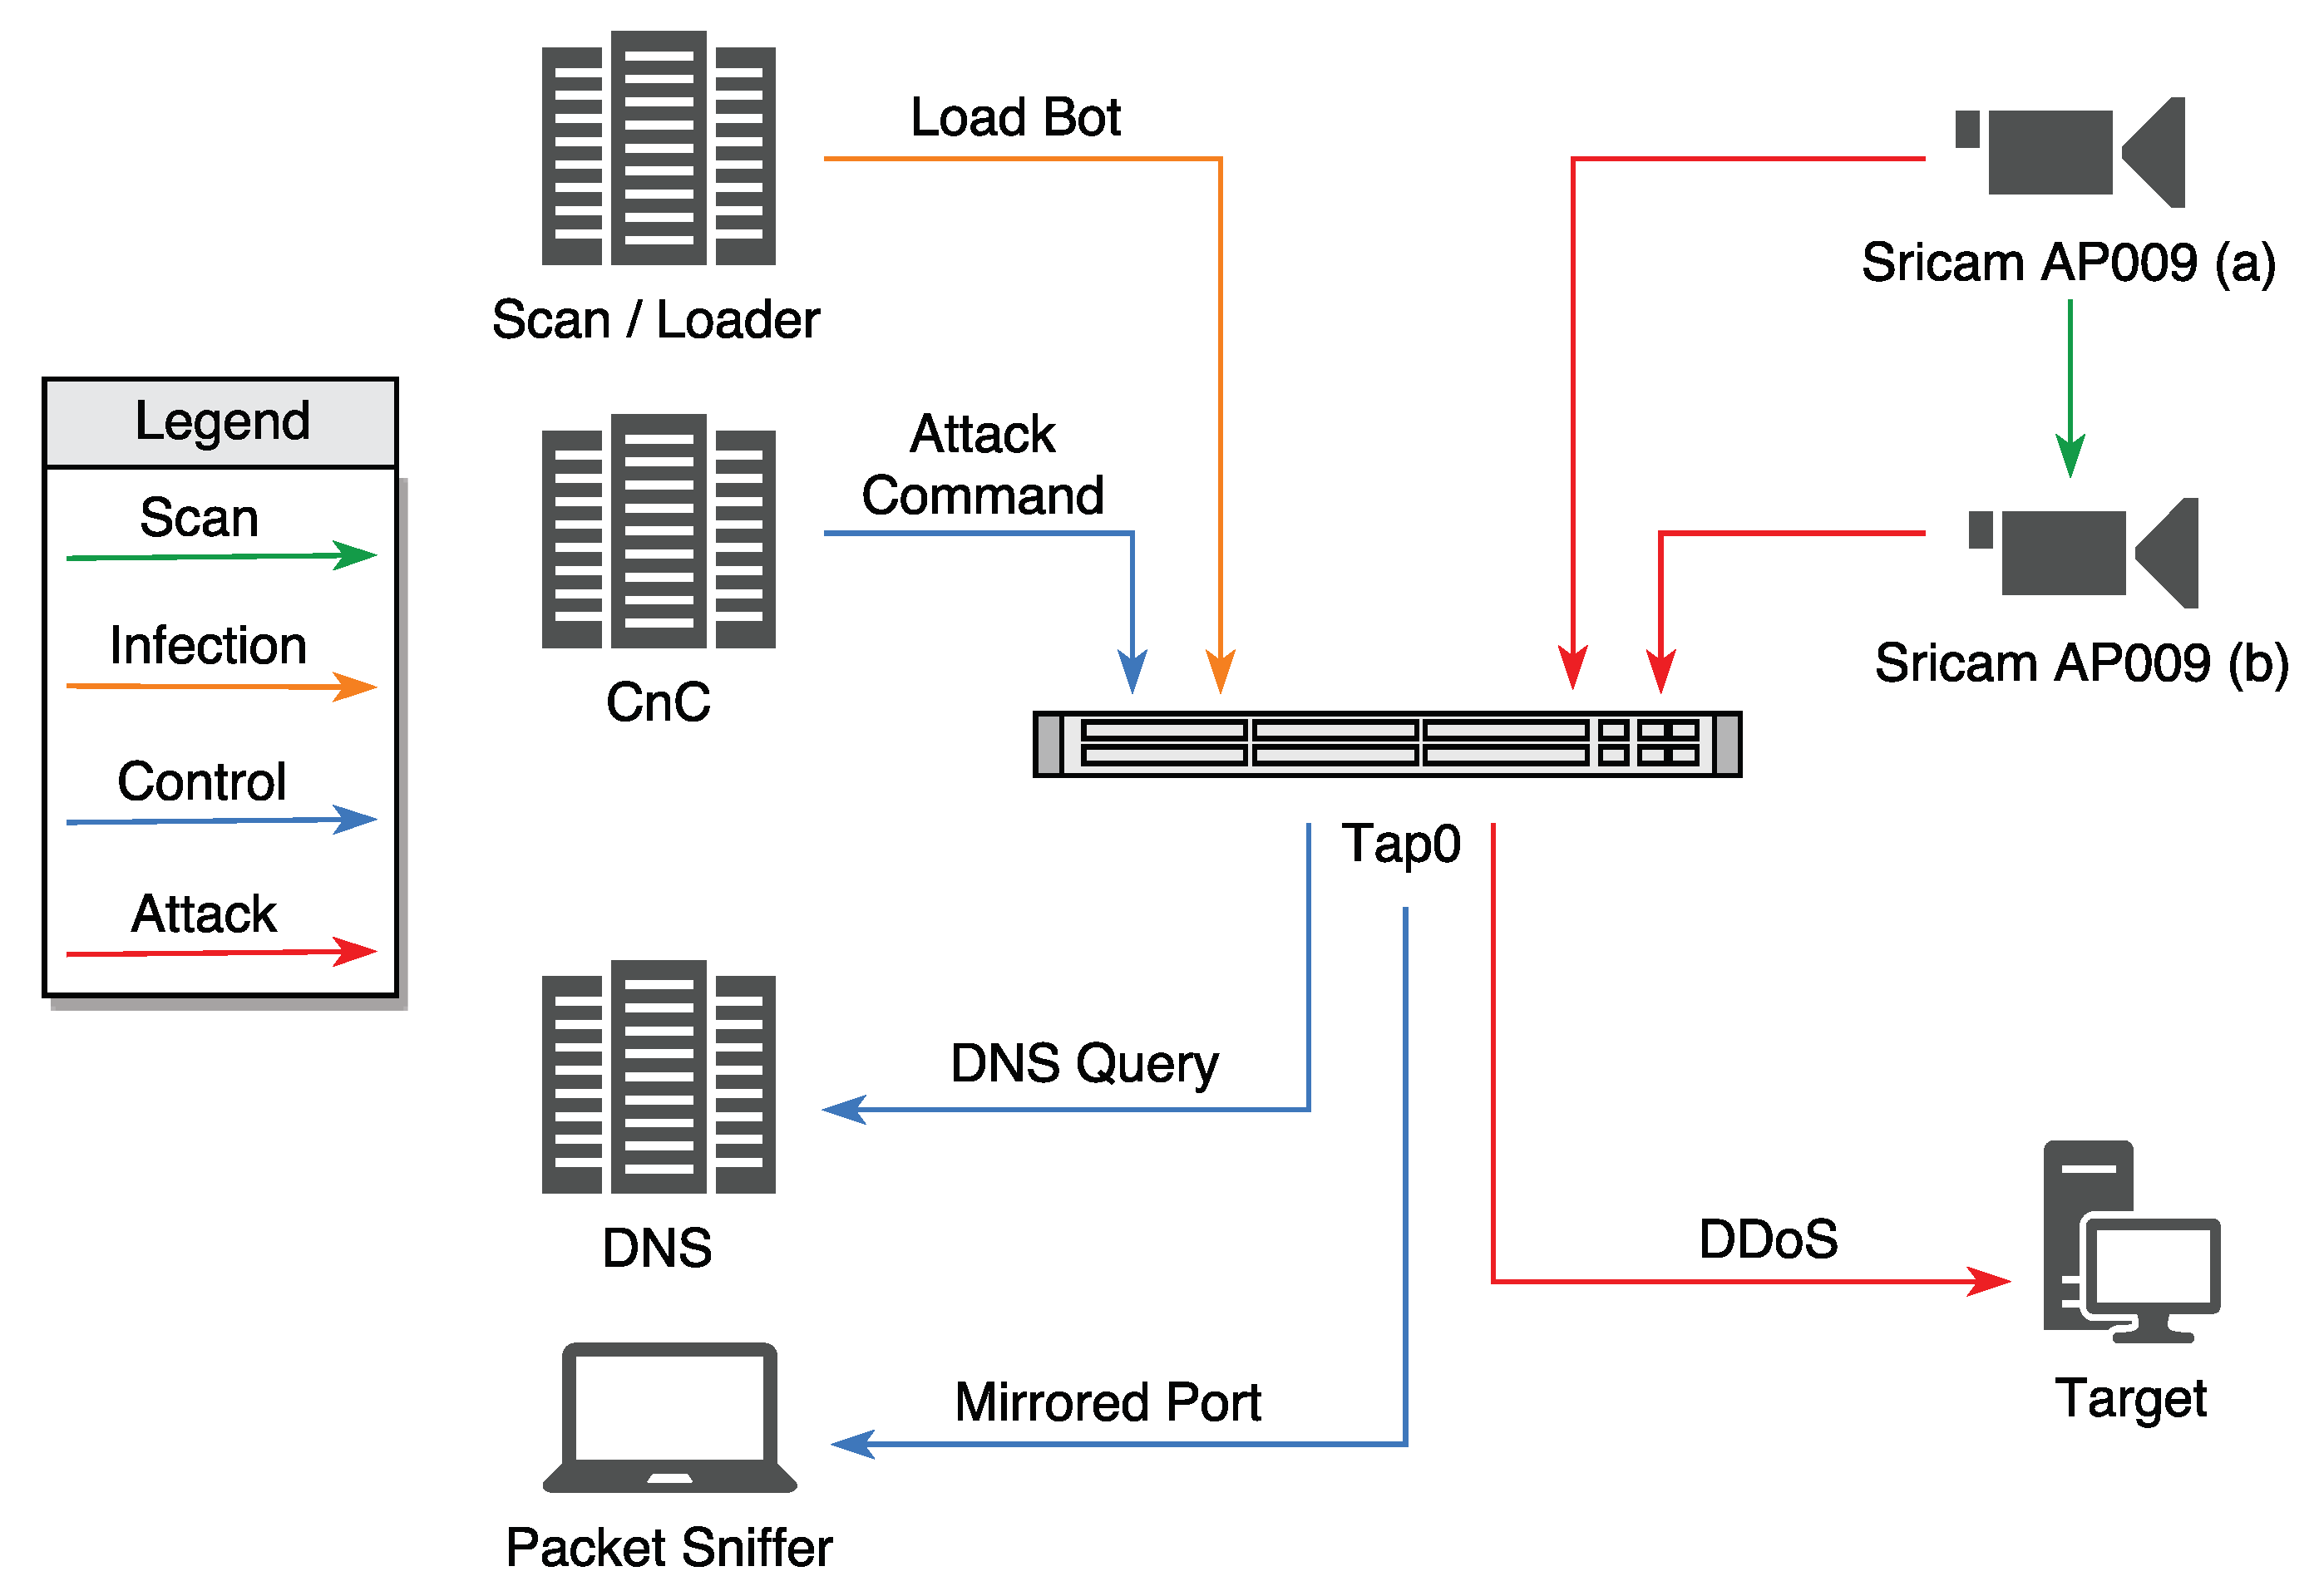
To evaluate user perception and awareness of threats facing the IoT, a secure sandboxed environment was created in section two, as shown in Figure 1. The Mirai botnet malware was downloaded from GitHub and recompiled to build a functioning botnet environment. This consisted of a command and control (C&C) server, a Scan/Loader server and an additional utilities server to handle Domain Name System (DNS) queries and reporting. A soft tap (Tap0) SPAN port was created to mirror all relevant traffic to a packet sniffing device, and allow recording of botnet activity within the network. Two Sricam AP009 IoT IP cameras running Busybox utilities were infected and used as bots to attack a target Raspberry Pi. To ensure a true representation of an infected IoT device, amendments to the Mirai source code were kept to a minimum however, some configuration changes were required to comply with ethical and legal regulations.
For our survey, four attack scenarios were created and recorded, including a DNS flood attack, Synchronize (SYN) flood attack, Generic Routing Encapsulation over IP (GREIP) flood attack, and normal traffic generated by an uninfected camera. The four recorded scenarios were presented to users and each asked to identify when an attack had taken place.
A representative sample (n = 158) of users across a varied range of ages and levels of technical knowledge and experience was achieved. Univariate statistics was initially employed and categorical data summarized using frequency distributions. Bivariate analysis was employed to crosstabulate categories and look for possible associations. Chi square tests were used to investigate whether distributions of categorical variables differ from one another, and if a positive association exists between the knowledge level of a user and their ability to detect infected IoT devices. Data was analyzed using MS Excel and Minitab, with p-values < 0.05 considered statistically significant.
4. Results
A representative sample (n = 158) of users responded; 17 (11%) aged [under 18], 52 (33%) aged [18–24], 54 (34%) aged [25–39], 29 (18%) aged [40–59], and 6 (4%) aged [60+]. When asked to indicate their level of technical knowledge 23 (15%) self-identified as [Novice], 70 (40%) as [Intermediate], 57 (36%) as [Advanced], and 8 (5%) as [Expert]. Participants had a varying range of computing experience with 42 (27%) currently working within a computing related environment, 86 (54%) currently studying, and 30 (19%) not currently studying or working within a computing related environment.
Results presented in this study are considered statistically significant since clear differences in detection rates between the four tested scenarios are demonstrated within each technical knowledge group: Novice (p < 0.001), Intermediate (p < 0.001), Advanced (p < 0.001) and Expert (p < 0.05) (see Table 1).
4.1. Section One Results
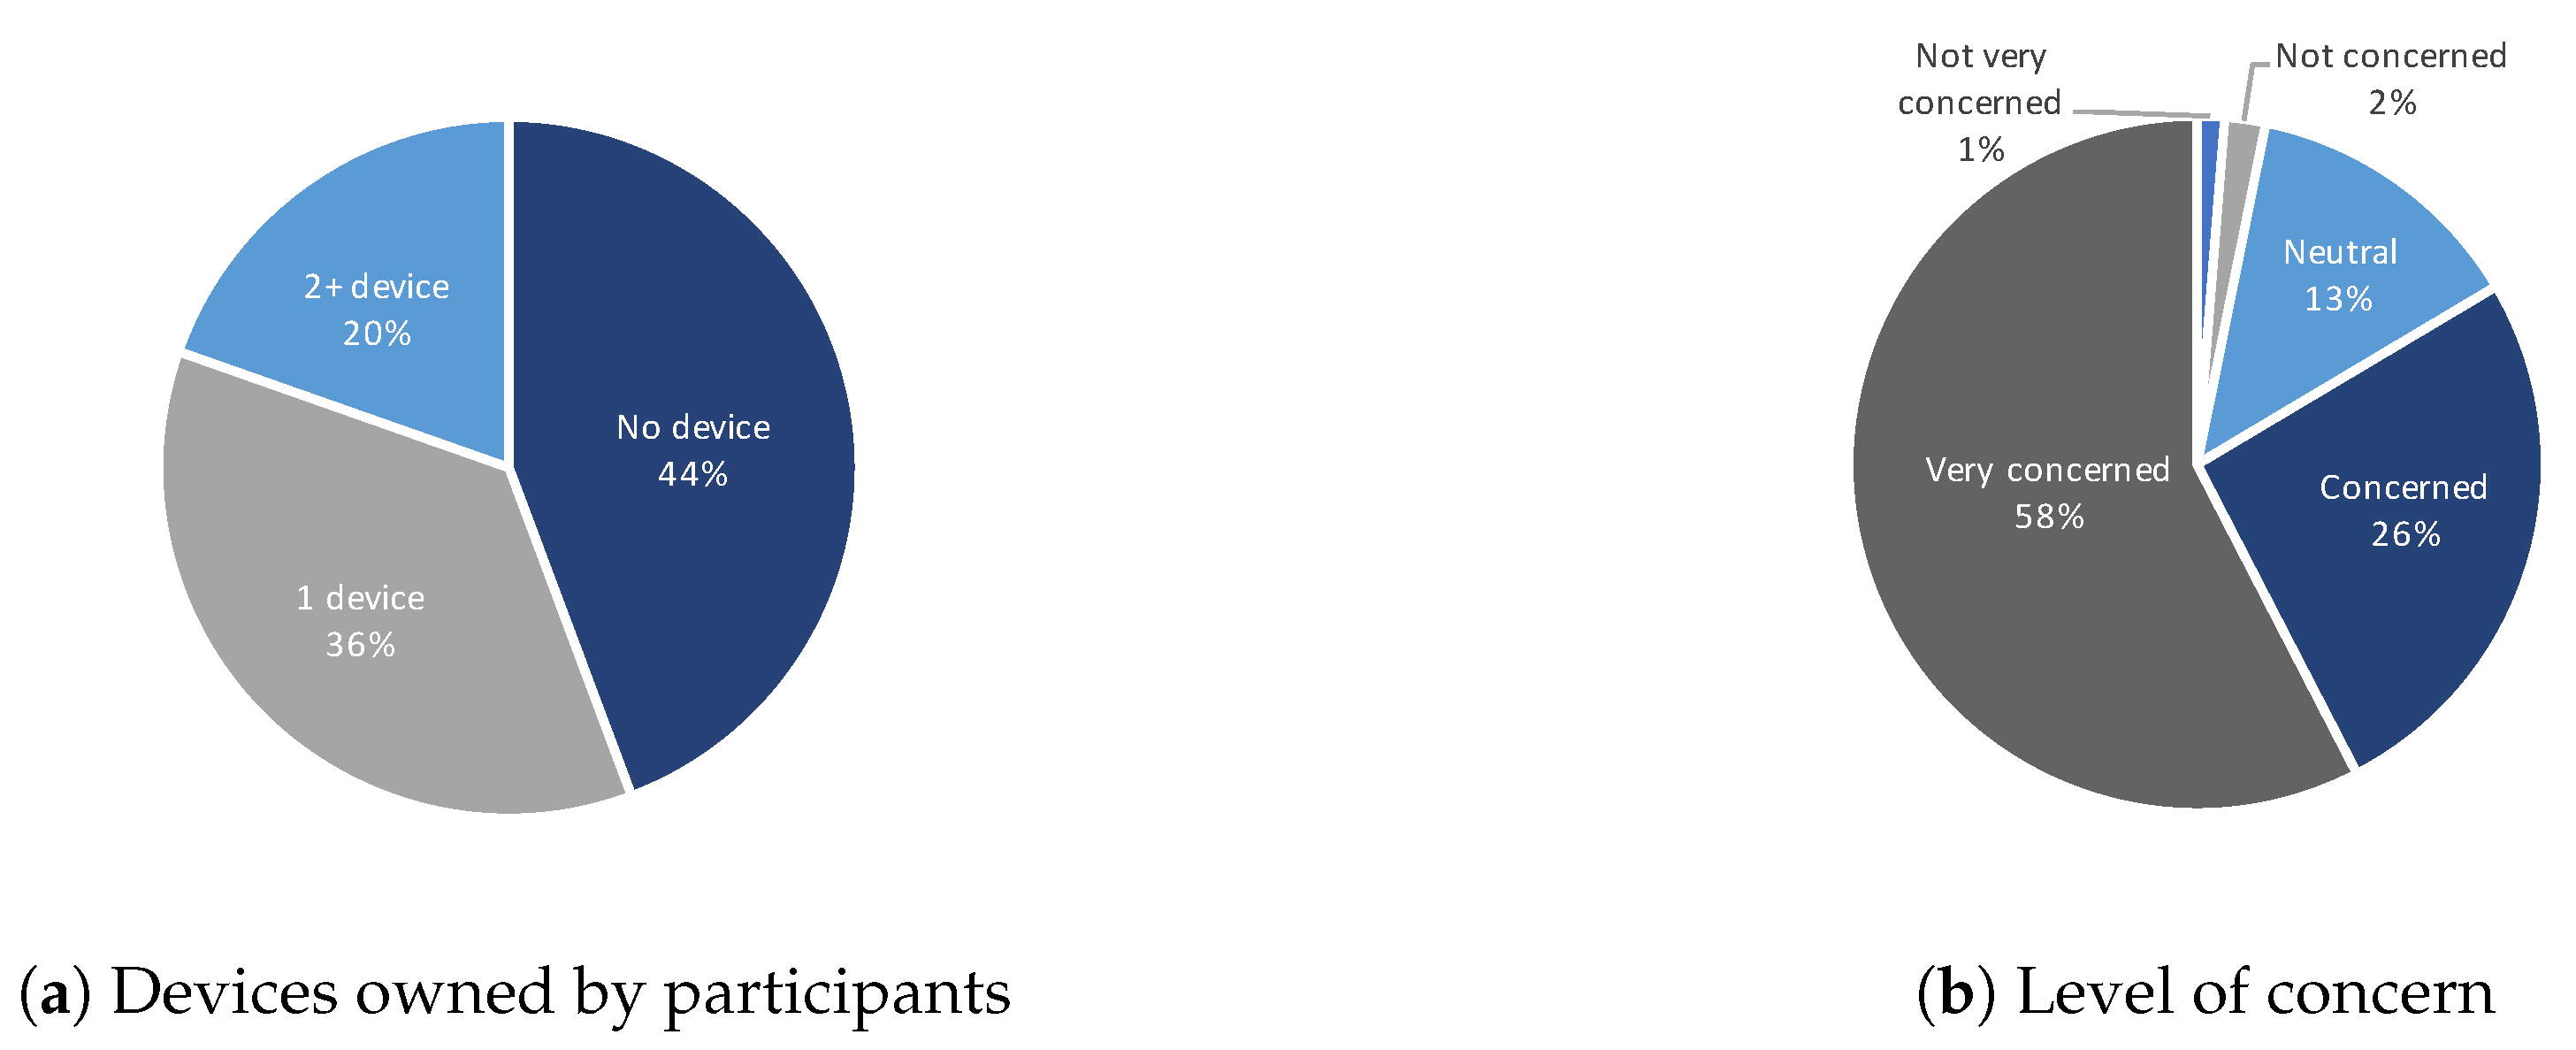
In Section one of the online survey participants were asked a series of questions relating to their awareness and perception of security and privacy considerations and requirements in IoT devices. Firstly, as shown in Figure 2a, participants were asked if they owned any IoT devices; 70 (44%) responded that they did not own any IoT devices, 57 (36%) owned one device, with Amazon Echo being the most popular with 47 (30%) respondents. 31 (20%) respondents indicated they owned two or more IoT devices.
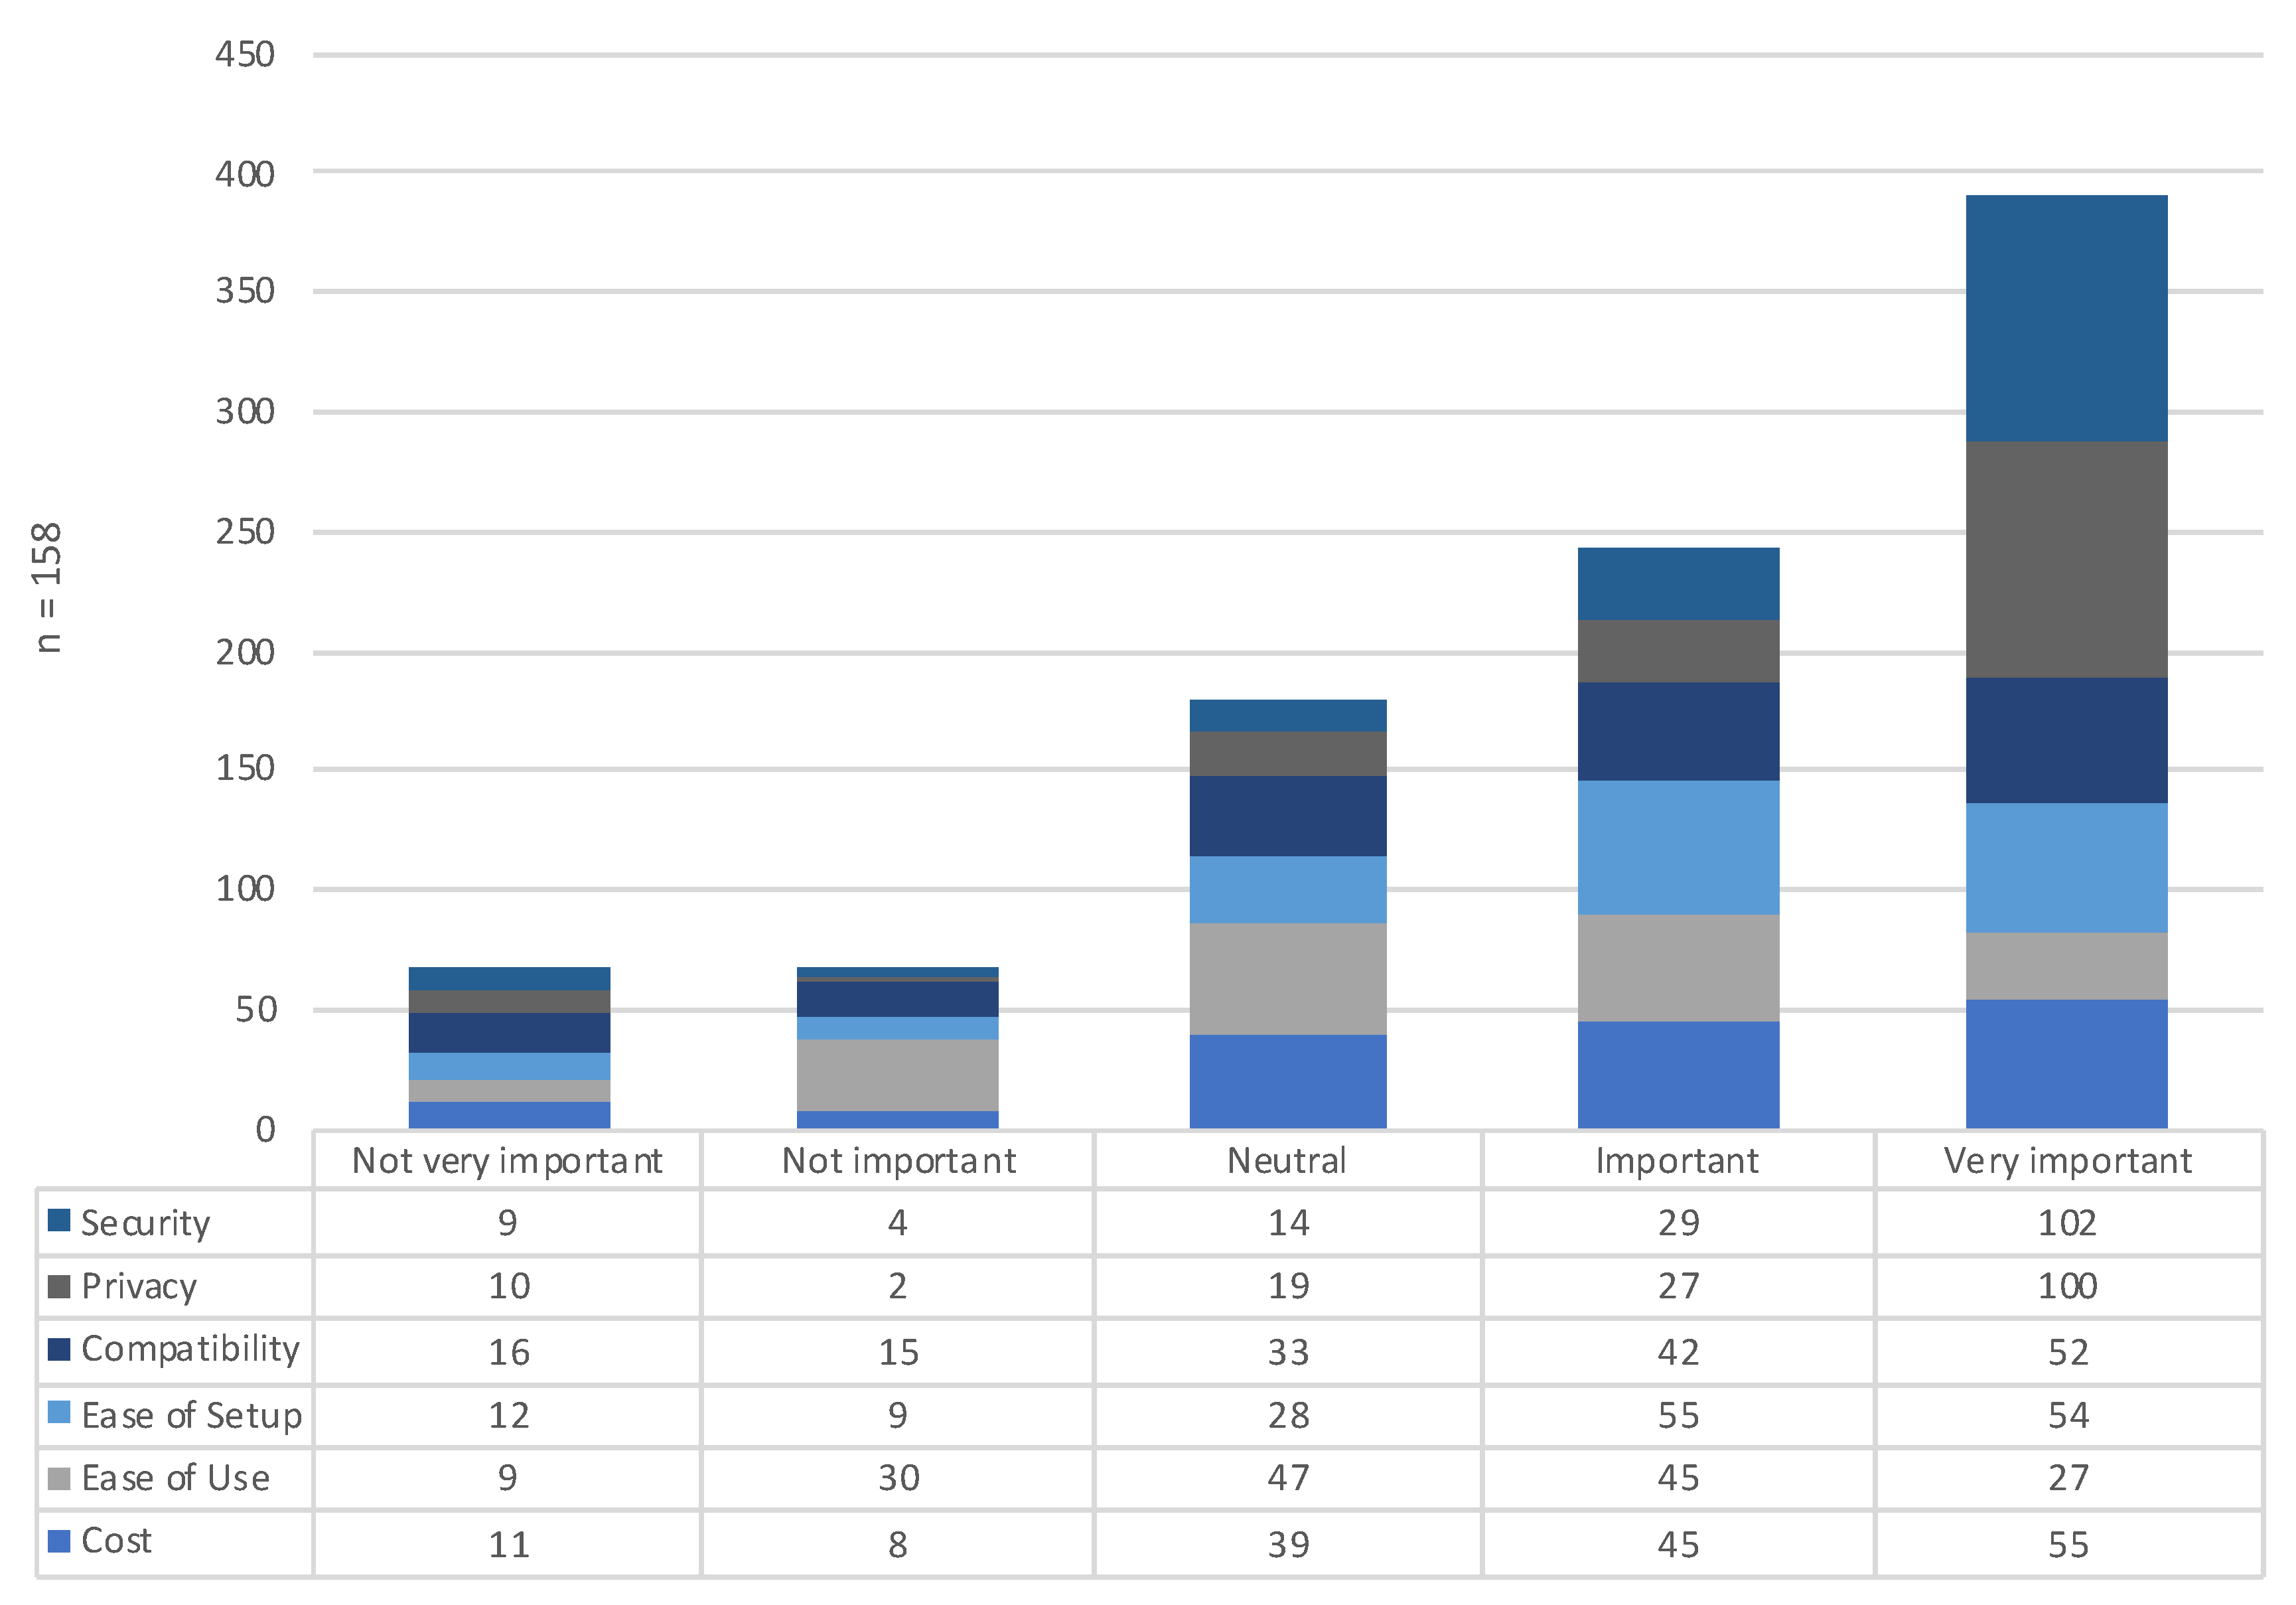
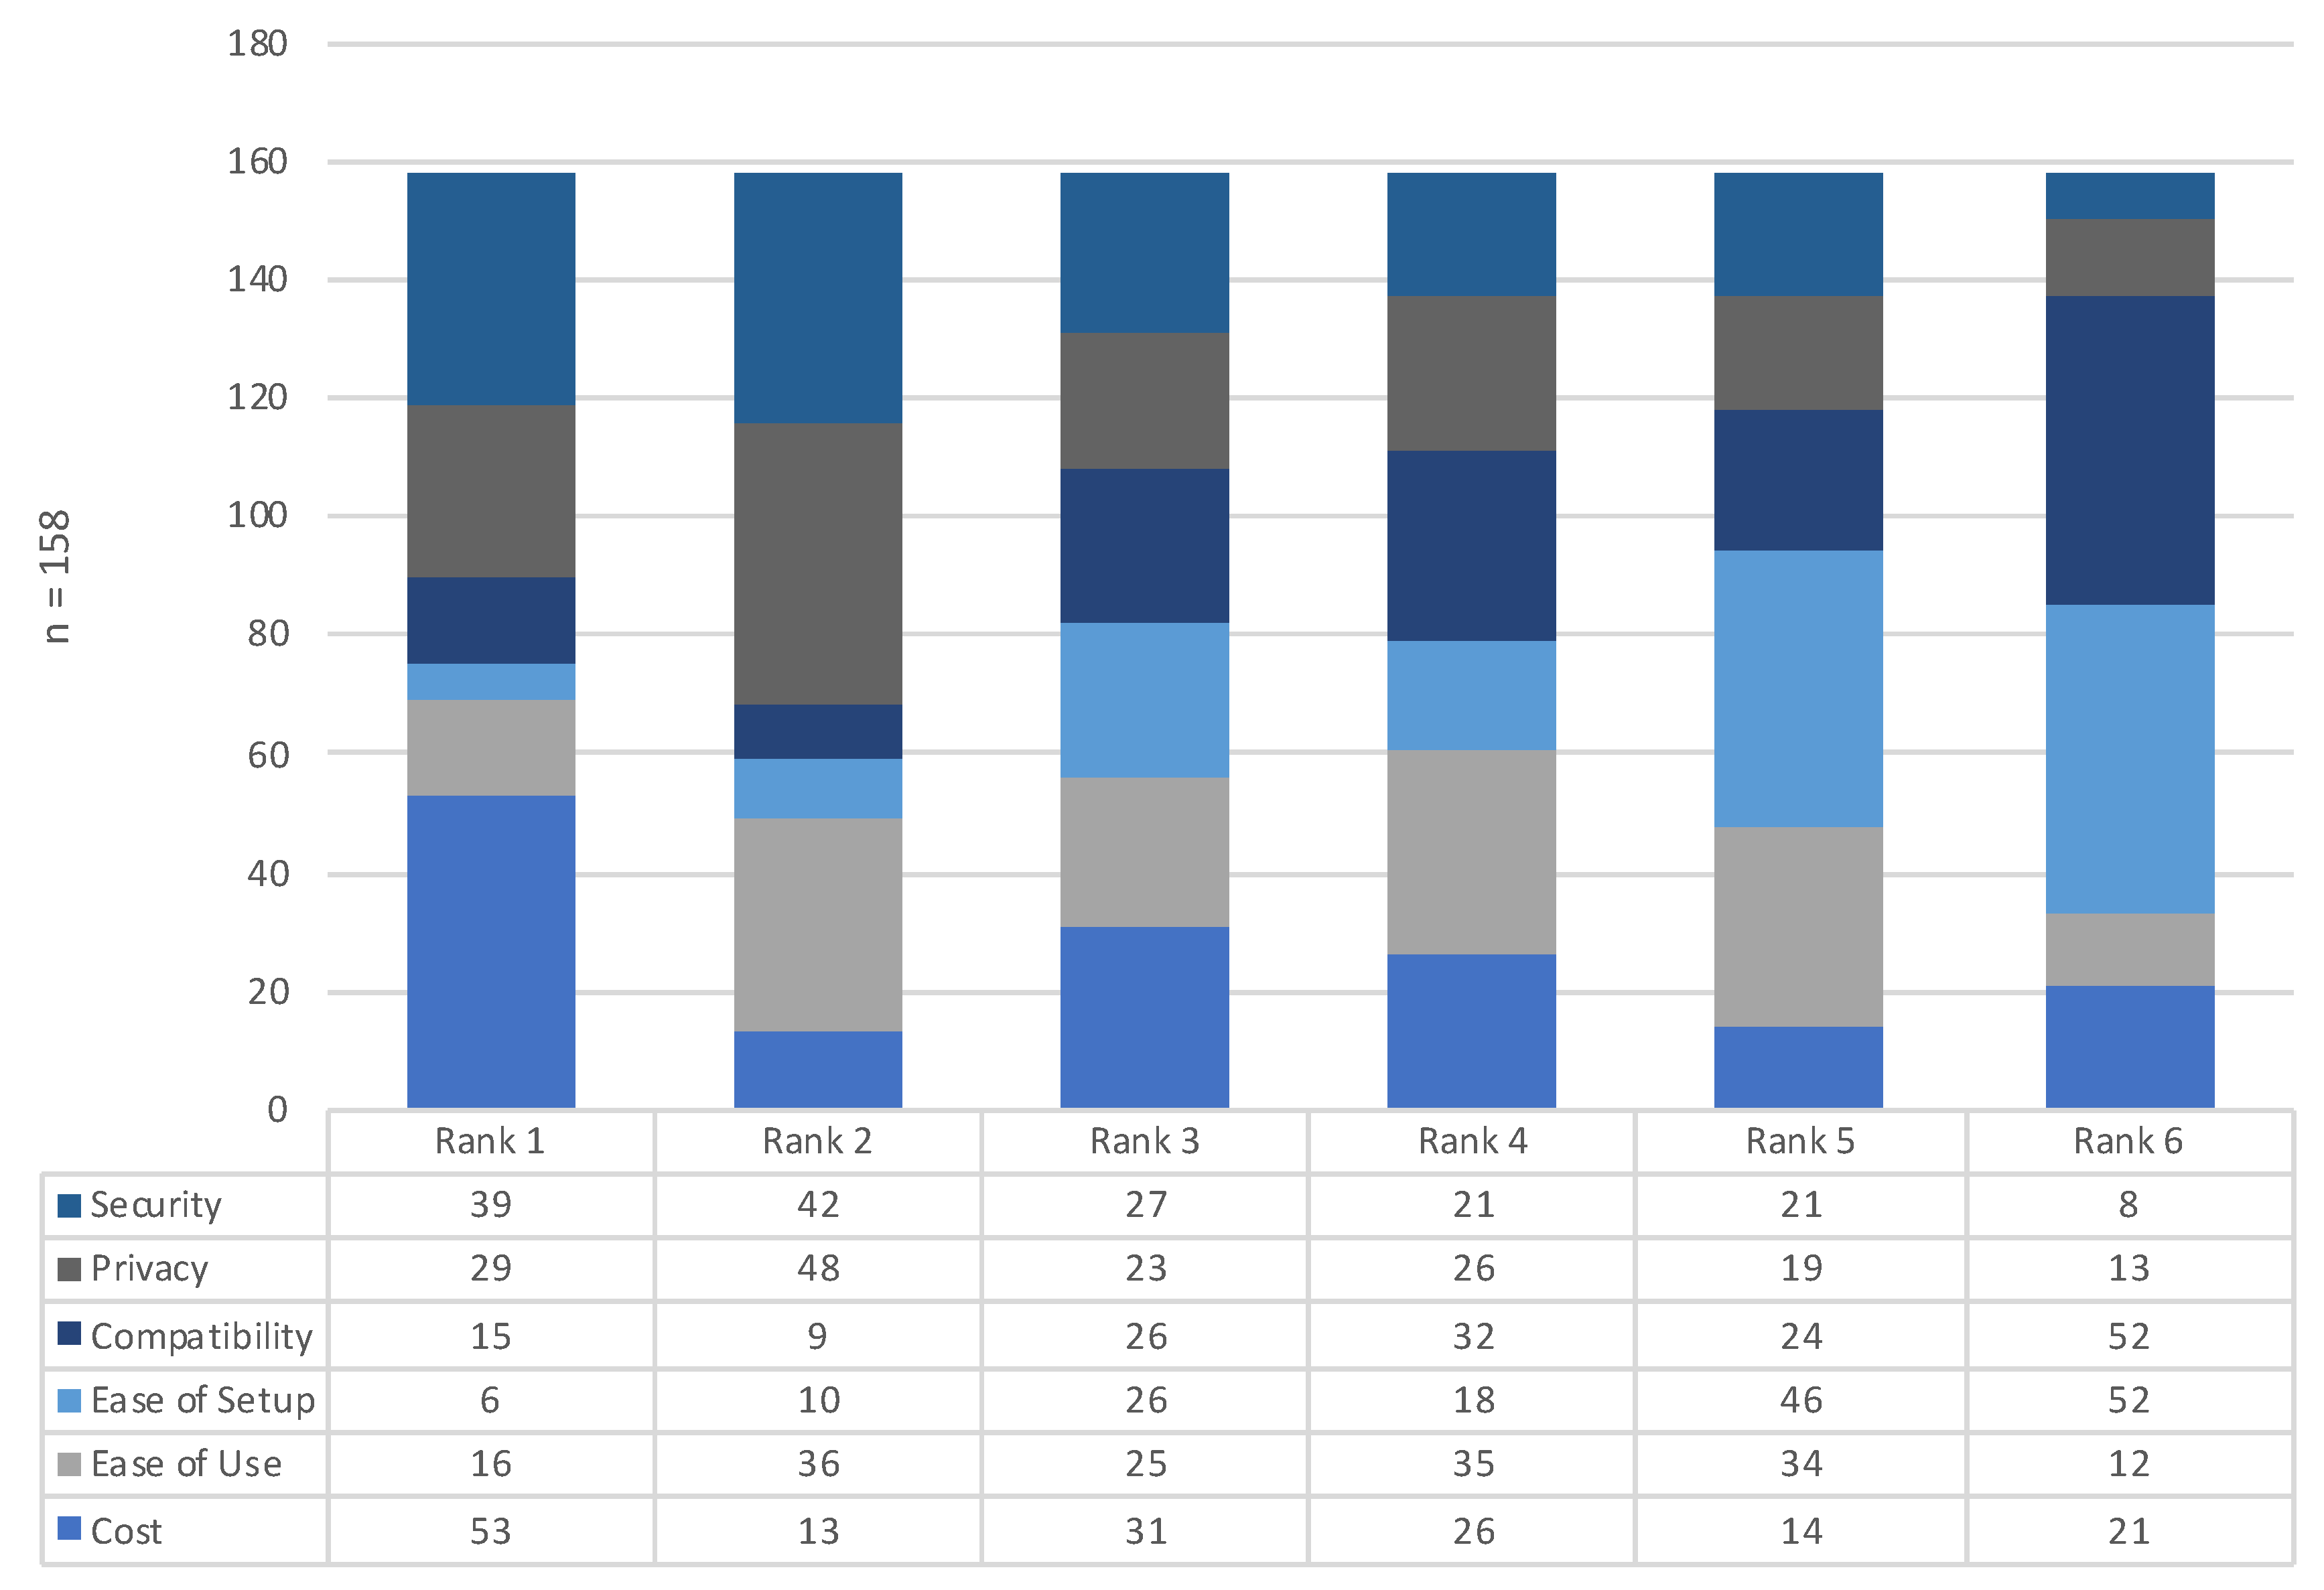
To measure perception and importance placed on security and privacy, respondents were asked to rate the importance of various features related to IoT devices. As shown in Figure 3 security 102 (65%) and privacy 100 (63%) were clearly considered very important features by a large percentage of the population. However, interestingly when asked to rank the features in order of priority, cost was ranked higher than both security and privacy by the largest percentage of respondents 53 (34%) (see Figure 4). Although compatibility and ease of setup were considered very important features as shown in Figure 3, again when asked to rank features in order of priority they were very clearly ranked less important (see Figure 4).
To assess whether respondents ranked security and privacy highly in theory, but not in practice, respondents were asked how concerned they would be if a smart device they owned was infected with a virus, but was still functioning as expected. Figure 2b shows that over three quarters of respondents 91 (58%) and 41 (26%) respectively said they would be very concerned or concerned.
4.2. Section Two Results
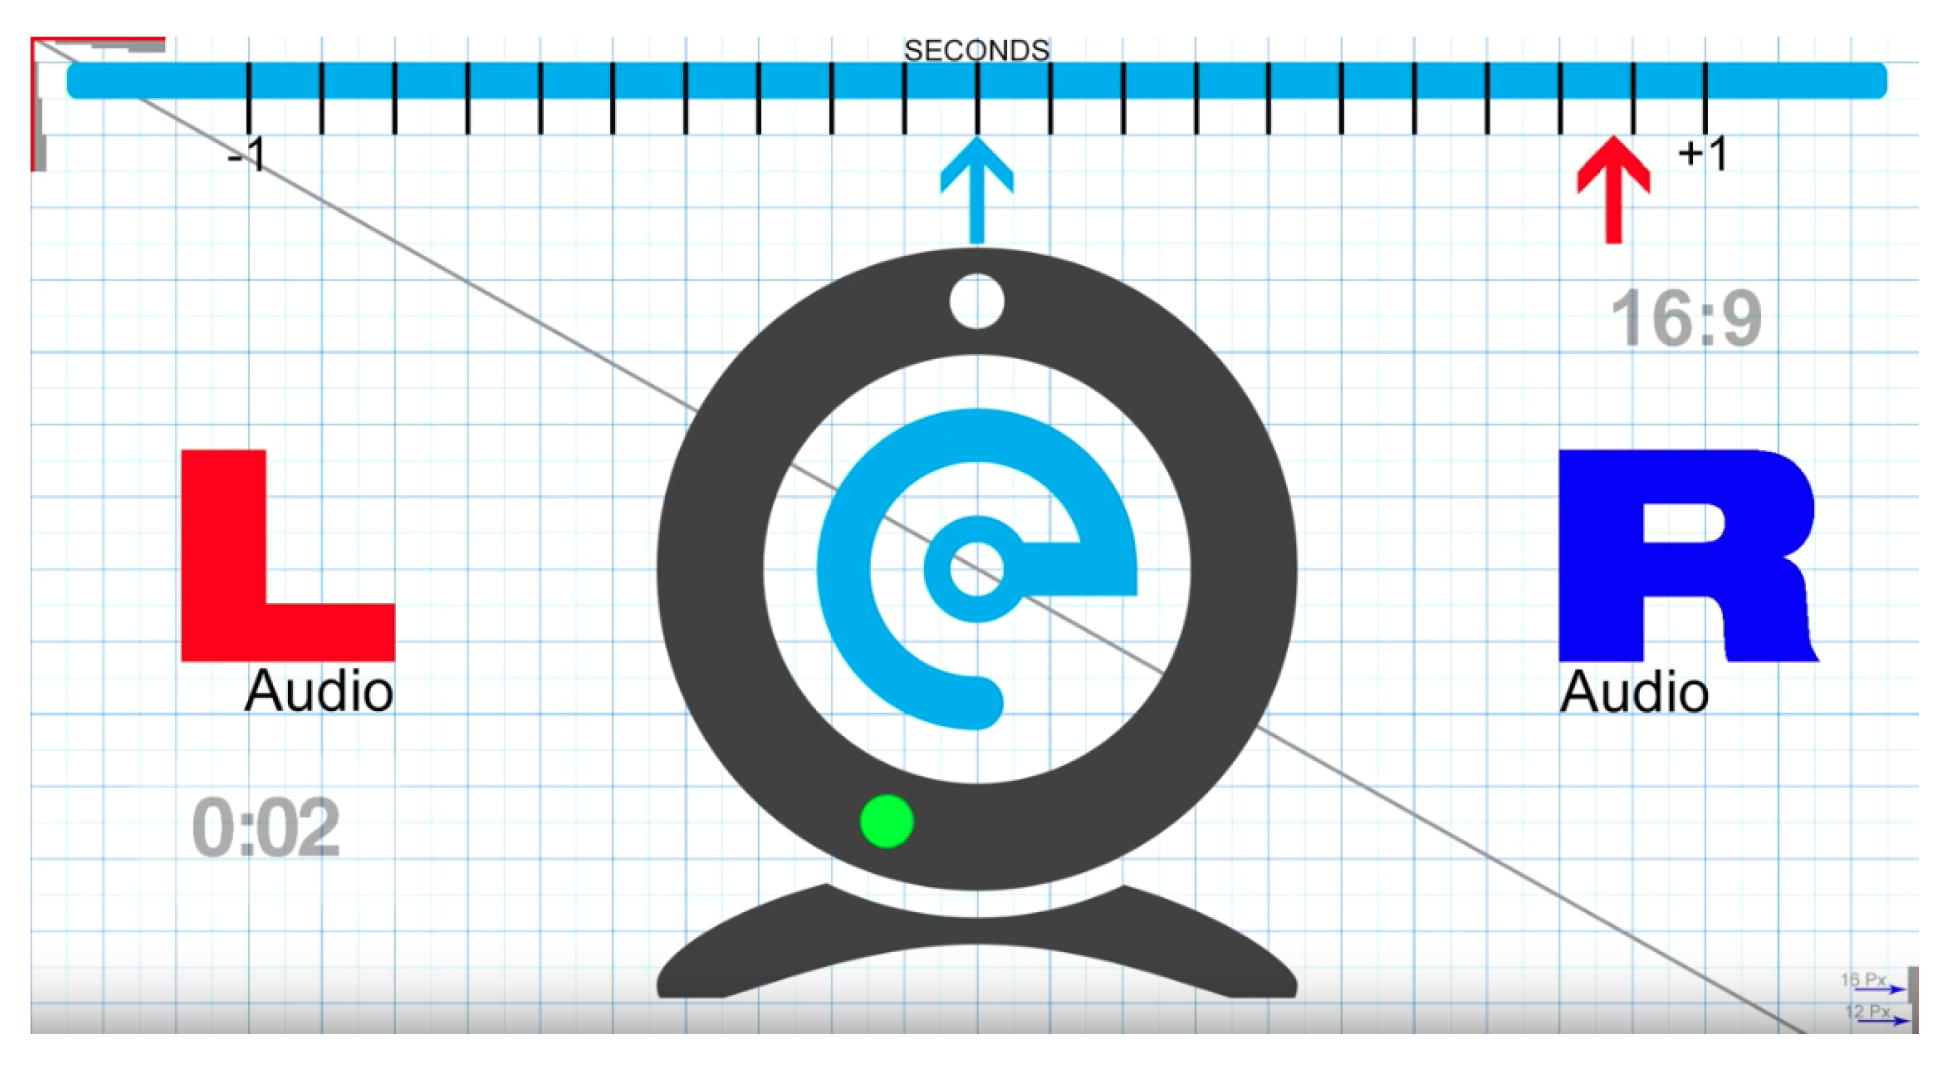
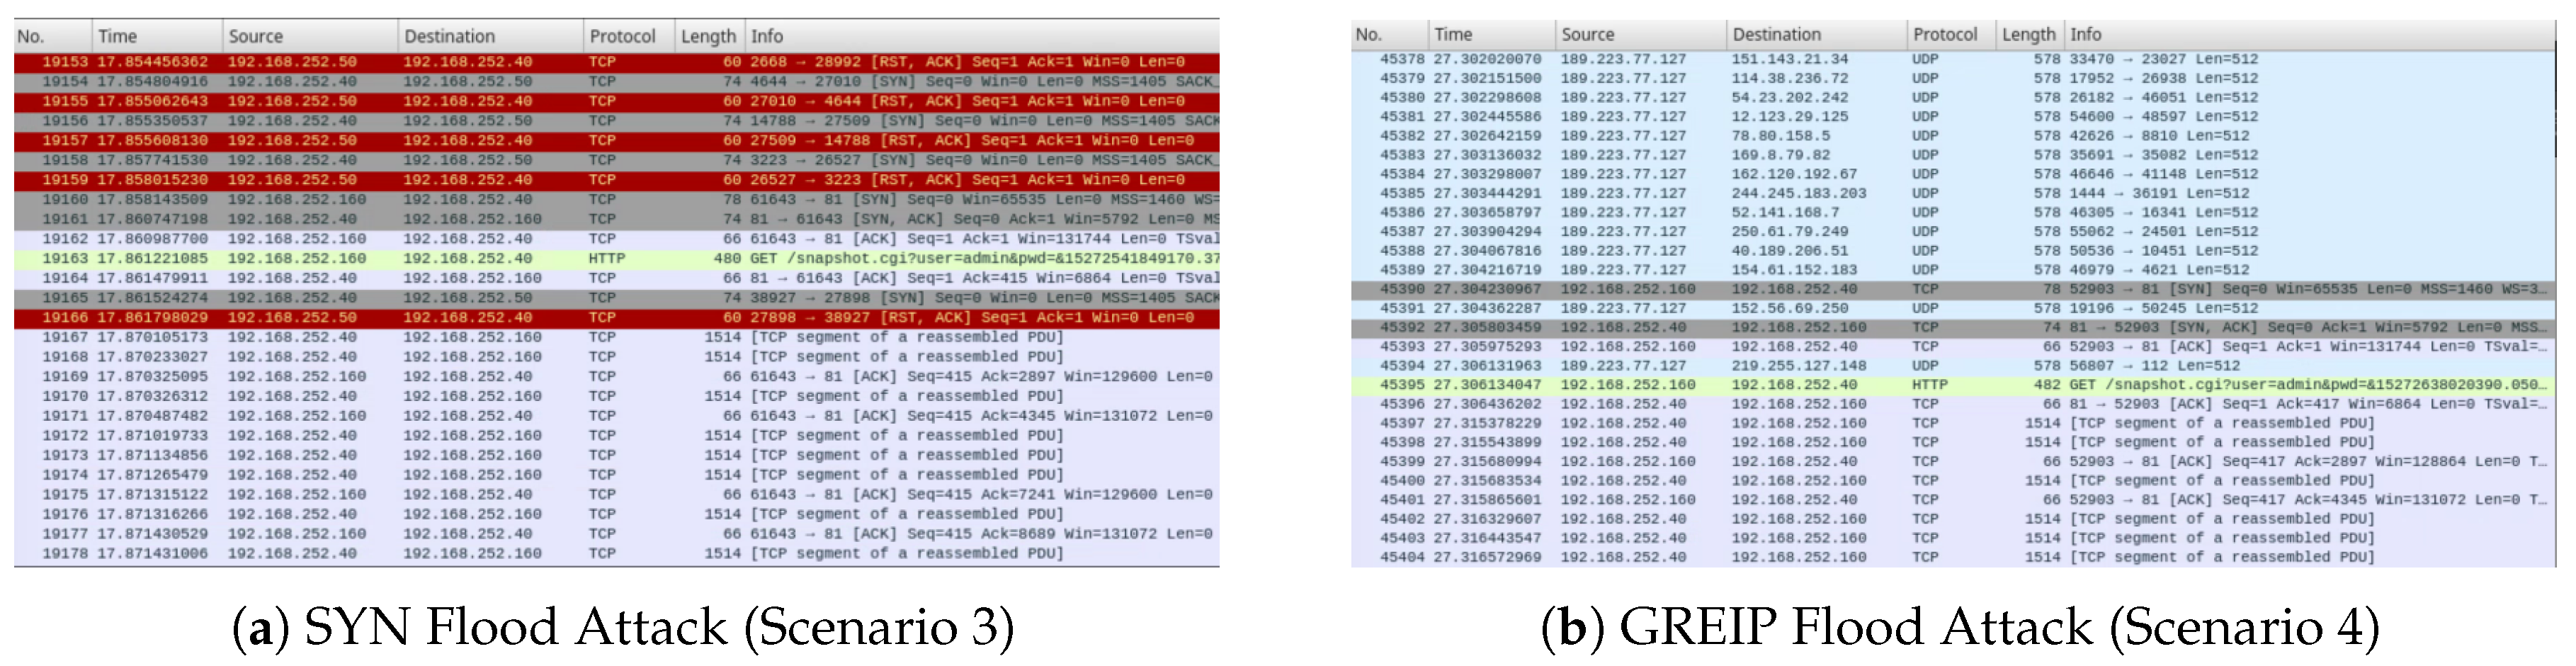
In section two of the online survey respondents were presented with the four recorded scenarios in Section 3. Scenario 1 and 2 were presented as live video feeds from an IoT IP camera. In scenario 1 the camera was not infected, and no attack was performed. In scenario 2 the camera was infected and performed a DNS flood attack against a victim device in the sandboxed environment (see Figure 5). Scenario 3 and 4 were presented as recorded outputs from a popular packet capture tool (wireshark). In scenario 3 the camera was infected and performed a SYN flood attack against a victim device in the sandboxed environment. In scenario 4 the camera was infected and performed a GREIP flood attack (see Figure 6).
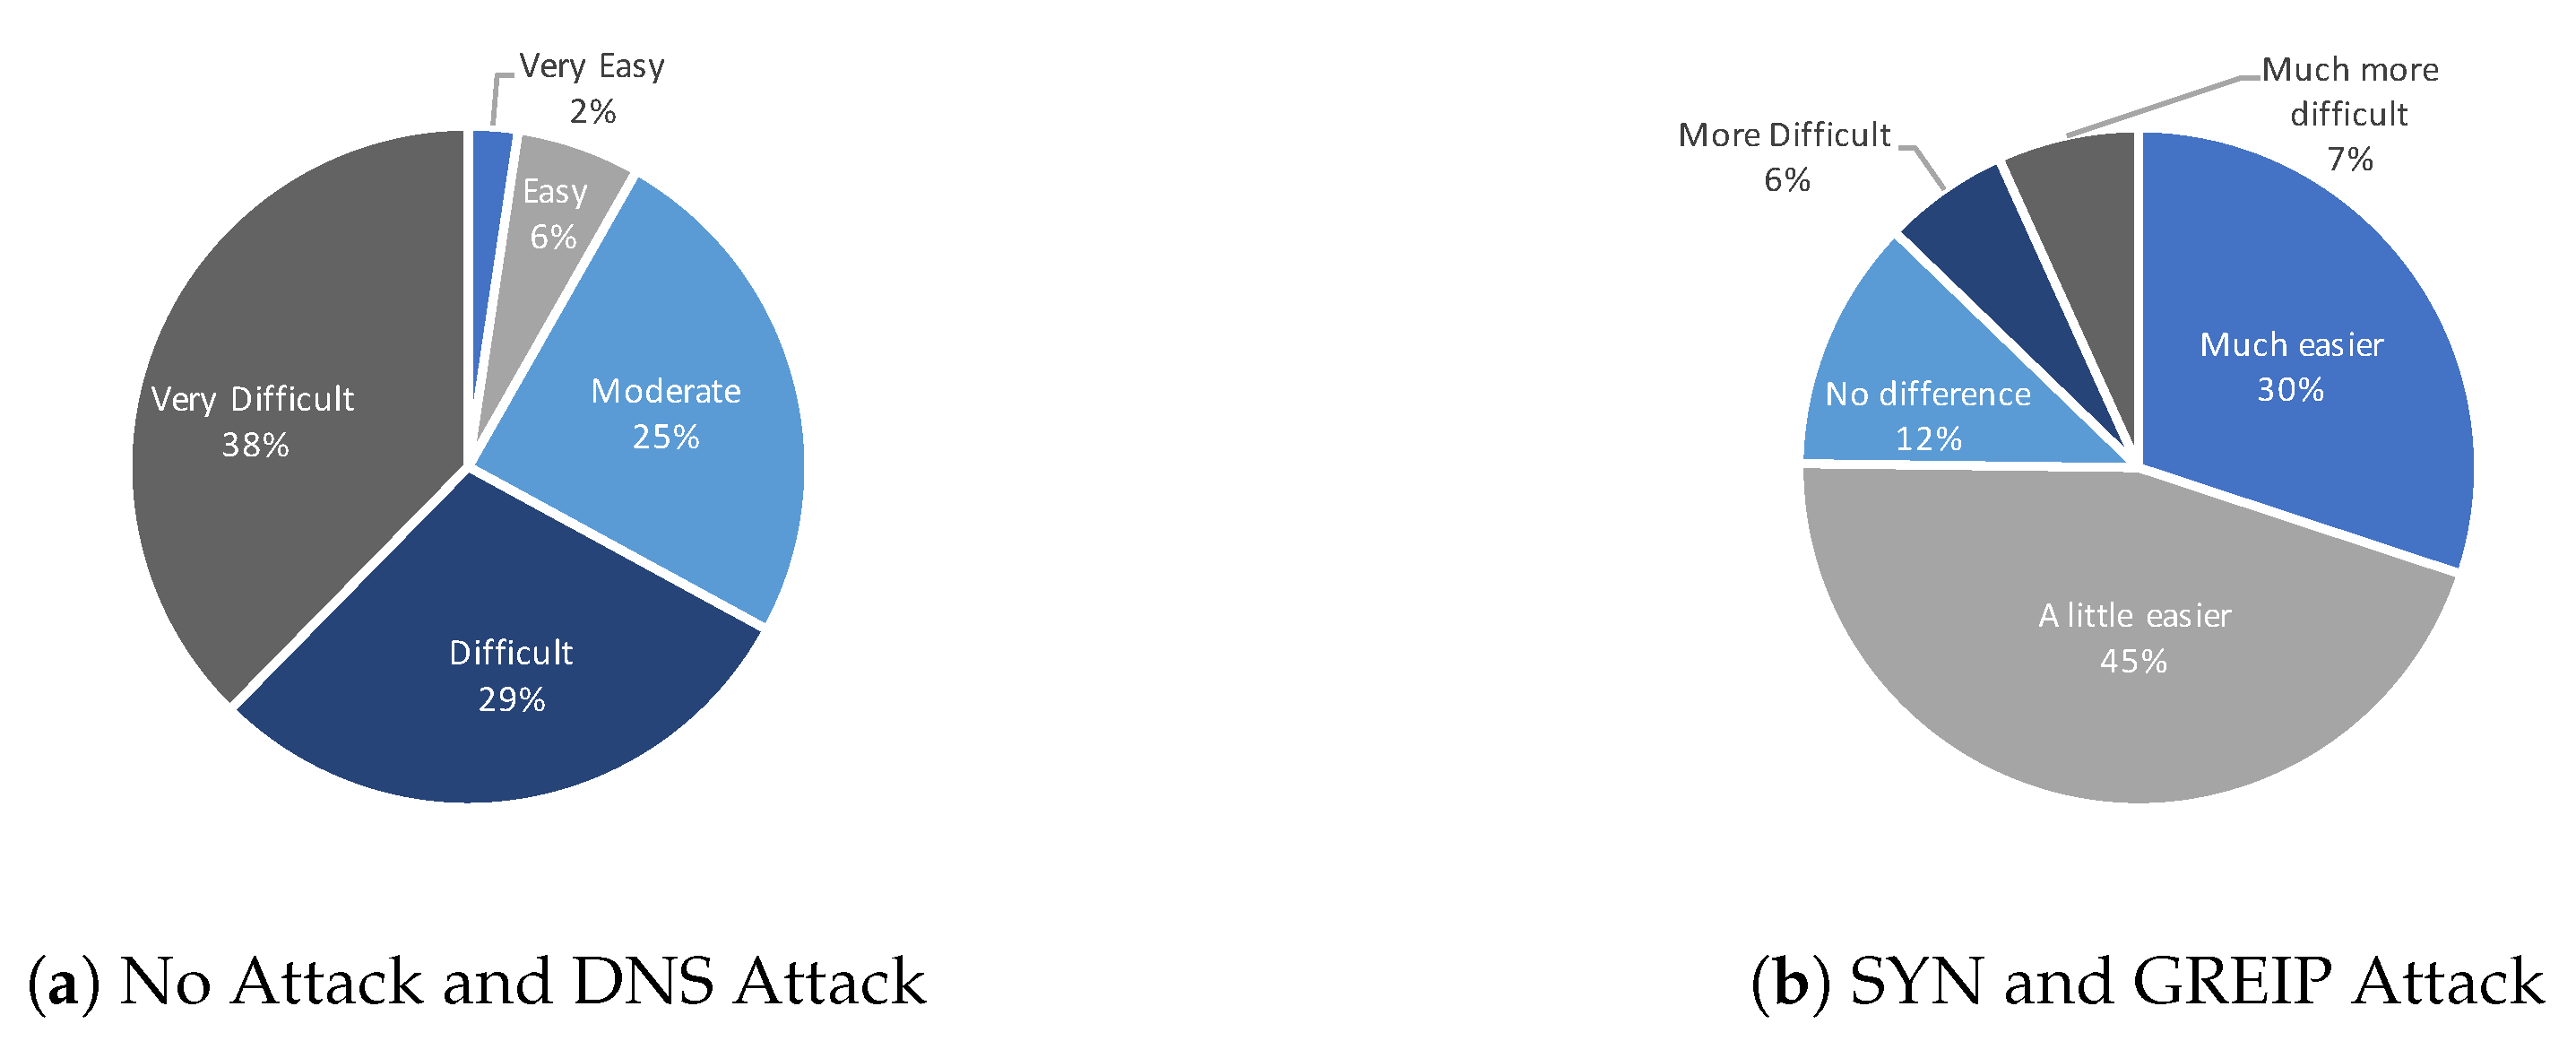
Results for the four scenarios are presented in Table 2, Table 3, Table 4 and Table 5 with time periods highlighted bold indicating when the associated attack took place. In scenario 1 97 (61%) of respondents indicated they could not tell if the IoT IP camera was infected and an attack took place (see Table 2). Respondent responses were consistent across all time periods. In scenario 2 an attack took place during time period [31–50 s]. Again, most respondents 94 (59%) indicated they could not tell if the IoT IP camera was infected and an attack took place. Respondent responses were again consistent across all time periods. When asked how easy it was to identify when the IoT IP camera was infected, 32 (38%) indicated very difficult, 25 (29%) difficult (see Figure 7a), indicating that it was not easy to detect if the device was infected from the presented live video feed shown in Figure 5. This was consistent with our own observations that during the infection process and attacks, the camera did not display any adverse symptoms of infection, and continued to function as expected. Remote access to the device was still possible, and performance did not appear to be degraded. Live video streaming continued to be as responsiveness as prior to the attacks. Therefore, without any clear signs of an infection it was confirmed that detection or awareness or botnet activity proved very difficult within consumer networks.
In scenario 3 an attack took place during time period [11–30 s] and participants were shown the recorded wireshark output (see Figure 6a). The use of the packet capture tool significantly improved detection of the infected IoT IP camera with 120 (76%) of respondents now indicating they knew when an attack took place. Results in Table 4 confirm this, with 76 (48%) [11–20 s] and 92 (58%) [21–30 s] correctly identifying the time period when the attack took place. In scenario 4 an attack took place during time period [21–40 s] and participants were shown the recorded wireshark output (see Figure 6b). In this scenario the packet capture tool did not appear to improve detection, as results presented in Table 5 show respondent responses were varied across all time periods. The number of respondents who indicated they knew when the attack took place dropped with 93 (59%) of respondents now indicating they knew when an attack took place.
Bivariate analysis was employed to cross tabulate between variables and look for possible associations. To determine if an association exists between level of knowledge and ability to detect an attack, a cross tabulation between these variables was undertaken. Frequency distributions were calculated and are presented in Table 6, Table 7, Table 8 and Table 9. Scenario 1 was used as a control, however since users were not informed of this, attempts were still made and are presented in Table 6. Since an attack did not exist, if a user selected ’No’ against each time scale and indicated they ’Don’t Know’ if the device was infected, this was used as evidence of a correct detection. It was not possible to analyze whether an association existed between knowledge level and the ability to detect an infected device, for this scenario. In scenario 2, a dns attack was performed, but a clear association between level of knowledge and ability to detect an infected device, was not evident. In scenario 3, a syn attack was performed, and participants were shown output from a packet capture tool wireshark (see Figure 6a). Detection rates across all knowledge levels increased substantially and a positive association was evident between knowledge level and a user’s ability to detect an attack. Finally, in scenario 4, a greip attack was performed, and participants were shown output from a packet capture tool wireshark (see Figure 6b). Although there appeared to be a positive trend, frequency distributions in Table 9 again do not indicate a clear association between the level of knowledge and a user’s ability to detect attacks. Except for scenario 3, the results do not demonstrate a clear and obvious positive association between knowledge level and a user’s ability to detect an infected IoT device.
5. Discussion
This study was undertaken to investigate user awareness and perception of security and privacy within the IoT. In addition, with reference to this study, the problem of botnet activity and proliferation within the IoT will be discussed. This discussion emphasizes the difficulty of making users situationally aware of threats facing consumer level IoT devices.
5.1. Botnets in the Internet of Things
Some of the most extensive and destructive cyber-attacks deployed on the Internet have been DDoS attacks. Several of these attacks, some the largest ever to be recorded, occurred in the second half of 2016, fueled in full or part by the IoT. During this time, attacks of over 100 Gbps were up by 140%, with three attacks reaching over 300 Gbps. The severity of the attacks continued in 2017, evidenced in Verisign’s annual DDoS Trends report, which reported that 82% of recorded DDoS attacks in quarter 4 of 2017, also now employed a multi-vector attack strategy [20]. The evidence would suggest IoT botnets are becoming increasingly more sophisticated in their effectiveness and ability to exploit basic security vulnerabilities, and obfuscate their activity. In [21] the authors present MalwareMustDie as a botnet example which uses iptables rules to protect its infected devices, while Hajime uses fully distributed communications and makes use of the BitTorrent protocol for peer discovery. BrickerBot was also presented, which leverages SSH default credentials to perform a permanent denial-of-service (PDoS) attack. However, one of the most prominent examples of a DDoS attack emanating from the IoT in recent times, is presented in [22,23,24]. Mirai is a piece of malware that attempts to find and infect IoT devices to establish and propagate a network of robots (botnet) consisting of the infected IoT devices (bots). An attacker (botmaster) then uses a command and control (C&C) server to remotely control the bots, forcing them to participate in DDoS attacks against targets on the Internet. On 20 September 2016, the Mirai botnet was used to perform an unprecedented 620 Gbps DDoS attack on security journalist Brian Krebs website krebsonsecurity.com [25]. Shortly after it was also responsible for a series of additional DDoS attacks peaking at over 1.2 Tbps against French hosting company OVH and DNS provider DYN, who estimated that up to 100,000 infected IoT devices (bots) were involved in the attack. The severity of the DYN attack was sufficient to cause major disruption on the Internet, and render several high-profile websites such as GitHub, Twitter, Reddit, Netflix, inaccessible.
Since the Mirai malware predominately targeted consumer IoT devices, it was chosen for use in our experimental setup. In the process of building the experimental setup shown in Figure 1 it became clear how easily botnet malware can spread, and new variants and mutations of existing botnets appear on the Internet. Indeed, this is evident in [26,27] where satori, masuta, wicked, and JenX are presented as new variants of the original Mirai botnet. Sharing the original basecode with Mirai, these new variants are enhanced to allow direct control of compromised devices, making other malicious actions possible, including running trojan viruses, redirecting traffic for man-in-the-middle attacks, and delivering other viruses to devices on the network by proxy. The last point being particularly concerning, since devices which were not originally vulnerable, could now be infected. In our study, 56% of respondents indicated they owned an IoT device, with 20% owning one more device. The study found the Amazon Echo to be the most popular IoT device (30%); however, many IoT devices leveraged by the above botnets, such as smart lightbulbs (16%) and IP cameras (8%), were also popular. Despite IP cameras only accounting for 8% of devices, if they could be leveraged and used as a proxy to infect other devices in home networks, the potential impact from IoT botnets, could be significantly greater than already experienced. Clearly, early detection and mitigation of such attacks is vital. This has led to much research in the area of botnet detection, which will be discussed in the next section.
5.2. Situational Awareness of Threats Facing the IoT
The first contribution of this paper is a study of attitudes towards security and privacy in the IoT. To assess whether respondents ranked security and privacy highly in theory, but not in practice, respondents were asked how concerned they would be if a smart device they owned was infected with a virus, but was still functioning as expected. In asking this question, the aim was to assess whether the well documented phenomenon known as the Privacy Paradox, was evident in the context of attitudes towards IoT devices. The privacy paradox has been well documented in papers such as [28,29], and although mainly in the context of online security, demonstrates that user attitudes towards security and privacy, often differ from the actions they take or decisions they make. Indeed, this has been highlighted in studies such as [10,13] discussed in Section 2. In our study, Figure 2b shows that given a scenario where a device was infected with malware, but still functioning normally, over three quarters of respondents indicated that they would still be very concerned. When asked to rate the importance of various features related to IoT devices (as shown in Figure 3), security 102 (65%) and privacy 100 (63%) were clearly considered very important features. However, interestingly when asked to rank the features in order of priority, cost was ranked higher than both security and privacy by the largest percentage of respondents 53 (34%) (see Figure 4). In [30] it is suggested, while many users show theoretical interest in their privacy and maintain a positive attitude towards privacy-protection behavior, this rarely translates into actual protective behavior. Our results could confirm this, and suggest a possible dichotomy between privacy attitudes and actual behavior, in terms of procurement of IoT devices.
The second contribution of this paper is the evaluation of user ability to detect threats in consumer IoT networks. In doing so, a sandboxed botnet environment was used to infect an IoT IP camera, and leverage it to perform four attacks against a target. Respondents of the online survey were presented with video recordings of the four recorded attack scenarios, and their situational awareness and ability to detect infections recorded. Situational Awareness (SA) can be defined as “the state of being aware of circumstances that exist around us, especially those that are particularly relevant to us and which we are interested about” [31]. Applied in a cyber context the author further presents an adapted SA model comprised of four levels where perception, deals with evidence gathering of situations in the network. Comprehension refers to the analysis of evidence to deduce threat level, type and associated risk. Projection deals with predictive measures to address future incidents, and resolution deals with controls to repair, recover and resolve network situations [32]. Our study evaluates the first of these levels (perception), and clearly demonstrates the difficulty users face in detecting threats found in IoT consumer networks. In scenario 1 and 2 users were presented with video recordings as shown in Figure 5. During the infection process and attacks, participants indicated that the camera did not display any adverse symptoms of infection, and continued to function as expected. This was evident from the results in Table 2 and Table 3 where 61% and 59% of respondents reported not being able to detect any unusual activity in the video. Comments from respondents included:
“There wasn’t any clear evidence”(Advanced Respondent)
“I could not tell at all if the camera was infected”(Intermediate Respondent)
In [32] the author suggests that perception in the context of Cyber SA also refers to knowledge of the elements in the network, and awareness of alerts such as those reported by intrusion detection systems, firewall logs, and scan reports. However, while this is true of security analysts, this information is likely not available in consumer networks, therefore would not be a contributing factor in achieving SA in consumer networks. In these environments the user would only have information displayed by the IoT device, in the case of scenarios 1 and 2 in our study that would be the live video feed. Since there were no adverse symptoms of infection, and the IP camera continued to function as expected, it is understandable that 32 (38%) indicated it was very difficult, and 25 (29%) difficult, to detect the device was infected from the presented live video feed.
In scenarios 3 and 4 users were presented with recorded outputs from a popular packet capture tool (wireshark) as shown in Figure 6. The use of the packet capture tool significantly improved detection in scenario 3 with 120 (76%) of respondents now indicating they knew when an attack took place. Results in Table 4 confirm this, with 76 (48%) [11–20 s] and 92 (58%) [21–30 s] correctly identifying the time period when the attack took place. However, in scenario 4 the packet capture tool did not appear to improve detection, as results presented in Table 5 show respondent responses were varied across all time periods. The number of respondents who indicated they knew when the attack took place also dropped to 93 (59%).
In [33] the author presents the need for greater online awareness and protection for NEUs. The author undertook a study to establish the views of NEUs on personal cyber security and suggests a lack of technical knowledge and ability to explore network communication, results in little or no awareness of security issues. To test this statement, we derive a null and alternate hypothesis as follows:
Hypothesis 1.
Accuracy of detecting IoT botnets in consumer networks increases as technical knowledge increases.
Hypothesis 2.
Accuracy of detecting IoT botnets in consumer networks does not increase as technical knowledge increases.
Previous studies such as [15] have demonstrated relationships between the technical ability of a user, and the ability to be perceive and be aware of risks. To our knowledge, this paper presents the first study to assess the ability of users to perceive and detect threats (botnets) facing the IoT. The results in Table 6 show that for scenario 1, where no attack was performed, detection accuracy across the four knowledge levels did not demonstrate any association between knowledge level and ability to detect an infected device. Novice (83%) and Expert (88%) demonstrated similar accuracy, and better than that of both Intermediate (56%) and Advanced (53%). The results are considered significant (p = 0.026) and the null hypothesis is rejected. In Table 7, the results for scenario 2 again show that detection accuracy across the four knowledge levels did not demonstrate any association between knowledge level and ability to detect an infected device. The evidence is considered weak (p = 0.054) but again the null hypothesis is rejected. For both these tests the alternate hypothesis is accepted Accuracy of detecting IoT botnets in consumer networks does not increase as technical knowledge increases.
The results in Table 8 do however demonstrate an association between knowledge level and ability to detect an infected device. As technical knowledge increases from Novice to Expert, so does the ability to detect an infected device: Novice (48%), Intermediate (59%), Advanced (65%) and Expert (75%). Presenting network communication as shown in Figure 6a to participants appeared to greatly improve SA of a threat, and the ability to correctly detect when an attack took place. Comments from respondents included:
"Program code went red", "Bulk black lines appeared", "Maybe the black bits with red writing may be something bad?"(Novice Respondents)
"yes wire shark made it easier to see that it was infected by all the random traffic", "there were red warnings on the screen", "Vast number of red highlighted addresses"(Intermediate Respondents)
"On the first the red warning messages were visible", "I saw a lot of areas highlighted in red, red highlights usually denotes a problem, so by deduction, those were errors", "Red text black blocks"(Expert Respondents)
It was clear from respondent comments that the way information is presented, and importantly the colors used, helped to aid better detection. This was evident even among Novice participants, who appeared not to fully understand what the information was showing, but were able to use it to become more situationally aware of what was happening with the IoT device. There is no evidence (p = 0.423) to disprove the null hypothesis, therefore it is accepted.
In scenario 4, participants were again shown network communication as shown in Figure 6b; however, the results in Table 9 again do not demonstrate an association between knowledge level and ability to detect an infected device. Although a positive trend is evident, the evidence against the null hypothesis is statistically strong (p = 0.013), therefore the null is rejected. Data presentation differed from the network traffic in scenario 3, and appeared to be a contributing factor in detection rates, particularly within the Novice knowledge group where the detection rate significantly dropped to (9%). We can therefore conclude that the authors assertion in [33] that “a lack of technical knowledge, and the ability to explore network communication, results in little or no awareness of security issues”, is true in part. The results in this study show that a lack of network communication can result in little or no awareness of security issues; however, if presented with data, SA can be improved. Presentation of the data is however also vitally important, otherwise the presence of the additional data, can have little impact. This point is recognized by the author and a security visualization framework is proposed to support NEUs to engage with network traffic analysis to better support their perception and comprehension of cyber security concerns. The work is extended in [18] where the visualization tool is further developed and used to assess participant ability across two case studies involving malware identification and home network monitoring. Participant feedback was positive, although the results were limited since only a single radial visual representation was used, leaving room for future research in the area.
6. Limitations
On conclusion of this study several limitations have been identified. Firstly, the study is limited by the use of self-report data. Since respondents undertook the survey without researcher interference, bias could be present. Socially desirable knowledge, skills and attitudes towards IoT security and privacy many have been provided and socially undesirable equivalents under reported. Ranking security and privacy highly because it is generally accepted as important, rather than because they believe it, could have introduced bias. The initial use of convenience sampling may have contributed to an over representation of student respondents (54%) in the total sample population. Since many were also studying a computing related course, this may also have contributed to the largest samples of technical knowledge levels being Intermediate (44%) and Advanced (36%). Finally, only one type of malware has been investigated. The use of other malware types may return different results, and provide a basis for further research in this area.
7. Conclusions
This paper presents a cross-sectional study of how users value and perceive security and privacy in smart devices found within the IoT. It analyzed which features users value most important in an IoT device, and where security and privacy rank within this list. An experimental setup was used in the context of technical knowledge and experience, to assess user ability to detect threats facing the IoT. It clearly demonstrated that due to the limited information users can extract from many IoT devices, and without any adverse symptoms of infection, a device can be infected and continue to function as expected. Without any clear signs when an IoT device is infected, it was very difficult for users to detect and be situationally aware of threats exploiting home networks. The paper also explored the relationship between technical knowledge and the ability to detect threats in IoT devices. It demonstrated that presenting users with additional information such as network communication could improve SA of IoT threats, but only if adequate presentation of the additional data was performed. Without this, there was no clear correlation between the level of technical knowledge and ability to detect infected devices. This study has provided a snapshot of user awareness and perception of security and privacy with the IoT. The results have provided evidence that further research is required in this area. Future research could address the limitations of this study, in particular the self-report nature of the online survey, and use of only one malware sample. The study could be repeated with other malware types and IoT devices, within a wider cross section of consumer backgrounds.
Author Contributions
This paper describes research undertaken by C.D.M. towards the award of Doctor of Philosophy, under the supervision of J.P.I. at Robert Gordon University. Data collection, analysis, and formulation of research paper was undertaken by C.D.M. J.P.I. supervised research methodology and reviewed paper formulation. A.V.P. also provided supervision and reviewed paper formulation.
Funding
This research received no external funding.
Conflicts of Interest
The authors declare no conflict of interest.
Abbreviations
The following abbreviations are used in this manuscript:
| IoT | Internet of Things |
| NEU | Non-Expert Users |
| SA | Situational Awareness |
| DDoS | Distributed Denial of Service |
| DNS | Domain Name Service |
| SYN | Synchronize flood attack |
| GREIP | Generic Routing Encapsulation over IP |
References
- Aazam, M.; St-Hilaire, M.; Lung, C.H.; Lambadaris, I.; Huh, E.N. IoT Resource Estimation Challenges and Modeling in Fog; Springer International Publishing: Cham, Switzerland, 2018. [Google Scholar]
- Atzori, L.; Iera, A.; Morabito, G. The Internet of Things: A survey. Comput. Netw. 2010, 54, 2787–2805. [Google Scholar] [CrossRef]
- Mosenia, A.; Jha, N.K. A Comprehensive Study of Security of Internet-of-Things. IEEE Trans. Emerg. Top. Comput. 2017, 5, 586–602. [Google Scholar] [CrossRef]
- McDermott, C.D.; Petrovski, A.V. Investigation of Computational Intelligence Techniques for Intrusion Detection in Wireless Sensor Networks. Int. J. Comput. Netw. Commun. (IJCNC) 2017, 9, 45–56. [Google Scholar] [CrossRef] [Green Version]
- Shodan. 2018. Available online: https://www.shodan.io/ (accessed on 28 November 2018).
- Moganedi, S.; Mtsweni, J. Beyond the convenience of the internet of things: Security and privacy concerns. In Proceedings of the IST-Africa Week Conference (IST-Africa), Windhoek, Namibia, 30 May–2 June 2017; pp. 1–10. [Google Scholar]
- Parsons, K.; McCormac, A.; Butavicius, M.; Pattinson, M.; Jerram, C. Determining employee awareness using the Human Aspects of Information Security Questionnaire (HAIS-Q). Comput. Secur. 2014, 42, 165–176. [Google Scholar] [CrossRef]
- Parsons, K.; Calic, D.; Pattinson, M.; Butavicius, M.; McCormac, A.; Zwaans, T. The Human Aspects of Information Security Questionnaire (HAIS-Q): Two further validation studies. Comput. Secur. 2017, 66, 40–51. [Google Scholar] [CrossRef]
- Öğütçü, G.; Özlem, M.T.; Chouseinoglou, O. Analysis of personal information security behavior and awareness. Comput. Secur. 2016, 56, 83–93. [Google Scholar] [CrossRef]
- Ghiglieri, M.; Volkamer, M.; Renaud, K. Exploring Consumers’ Attitudes of Smart TV Related Privacy Risks. In Human Aspects of Information Security, Privacy and Trust; Tryfonas, T., Ed.; Springer International Publishing: Cham, Switzerland, 2017; pp. 656–674. [Google Scholar]
- Takemura, T. Empirical Analysis of Behavior on Information Security. In Proceedings of the International Conference on Internet of Things and 4th International Conference on Cyber, Physical and Social Computing, Dalian, China, 19–22 October 2011; pp. 358–363. [Google Scholar]
- San-José, P.P.; de la Fuente Rodriguez, S. Study on Information Security and e-Trust in Spanish Households. In Proceedings of the First Workshop on Building Analysis Datasets and Gathering Experience Returns for Security, Salzburg, Austria, 10 April 2011; pp. 1–6. [Google Scholar]
- Parsons, K.; McCormac, A.; Pattison, M.; Butavicius, M.; Jerram, C. An Analysis of Information Security Vulnerabilities at Three Australian Government Organisations. In Proceedings of the European Information Security Multi-Conference, Lisbon, Portugal, 8–10 May 2013; Springer International Publishing: Cham, Switzerland, 2013; pp. 34–44. [Google Scholar]
- Zaaba, Z.F.; Furnell, S.M.; Dowland, P.S. A study on improving security warnings. In Proceedings of the 5th International Conference on Information and Communication Technology for the Muslim World (ICT4M), Kuching, Malaysia, 17–18 November 2014; pp. 1–5. [Google Scholar]
- Amran, A.; Zaaba, Z.F.; Singh, M.M.; Marashdih, A.W. Usable Security: Revealing End-Users Comprehensions on Security Warnings. Procedia Comput. Sci. 2017, 124, 624–631. [Google Scholar] [CrossRef]
- Shepherd, L.A.; Archibald, J.; Ferguson, R.I. Assessing the Impact of Affective Feedback on End-User Security Awareness. In Human Aspects of Information Security, Privacy and Trust; Springer International Publishing: Cham, Switzerland, 2017; pp. 143–159. [Google Scholar]
- McCormac, A.; Zwaans, T.; Parsons, K.; Calic, D.; Butavicius, M.; Pattinson, M. Individual differences and Information Security Awareness. Comput. Hum. Behav. 2017, 69, 151–156. [Google Scholar] [CrossRef]
- Legg, P.A. Enhancing cyber situation awareness for Non-Expert Users using visual analytics. In Proceedings of the International Conference on Cyber Situational Awareness, Data Analytics and Assessment (CyberSA), London, UK, 13–14 June 2016; pp. 1–8. [Google Scholar]
- Zimmermann, V.; Gerber, N. “If it Wasn’t Secure, They Would Not Use It in the Movies”—Security Perceptions and User Acceptance of Authentication Technologies. In Human Aspects of Information Security, Privacy and Trust; Springer International Publishing: Cham, Switzerland, 2017; pp. 265–283. [Google Scholar]
- Verisign. Verisign Distributed Denial of Service Trends Report. Comput. Netw. 2017, 4, 3–6. [Google Scholar]
- Kolias, C.; Kambourakis, G.; Stavrou, A.; Voas, J. DDoS in the IoT: Mirai and Other Botnets. Computer 2017, 50, 80–84. [Google Scholar] [CrossRef]
- McDermott, C.D.; Majdani, F.; Petrovski, A.V. Botnet Detection in the Internet of Things using Deep Learning Approaches. In Proceedings of the International Joint Conference on Neural Networks (IJCNN), Rio de Janeiro, Brazil, 8–13 July 2018; pp. 1–8. [Google Scholar]
- Jerkins, J.A. Motivating a market or regulatory solution to IoT insecurity with the Mirai botnet code. In Proceedings of the IEEE 7th Annual Computing and Communication Workshop and Conference (CCWC), Las Vegas, NV, USA, 9–11 January 2017; pp. 1–5. [Google Scholar]
- Sinanović, H.; Mrdovic, S. Analysis of Mirai malicious software. In Proceedings of the 25th International Conference on Software, Telecommunications and Computer Networks (SoftCOM), Split, Croatia, 21–23 September 2017; pp. 1–5. [Google Scholar]
- Krebs, B. KrebsOnSecurity Hit with Record DDoS. 2016. Available online: https://tinyurl.com/jfkk7yp (accessed on 28 November 2018).
- Cooley, L. The Evolution of Mirai Botnet Source Code Presents Increased Risk of Large-Scale DDoS Attacks. 2018. Available online: http://www.mondaq.com/unitedstates/x/732962/ (accessed on 28 November 2018).
- Pierluigi Paganini. Mirai Botnet Evolution Since Its Source Code Is Available Online. 2018. Available online: https://resources.infosecinstitute.com (accessed on 28 November 2018).
- Dienlin, T.; Trepte, S. Is the privacy paradox a relic of the past? An in-depth analysis of privacy attitudes and privacy behaviors. Eur. J. Soc. Psychol. 2015, 45, 285–297. [Google Scholar] [CrossRef]
- Barth, S.; De Jong, M. The Privacy Paradox—Investigating Discrepancies between Expressed Privacy Concerns and Actual Online Behavior—A Systematic Literature Review. Telemat. Inform. 2017, 34, 1038–1058. [Google Scholar] [CrossRef]
- Potzsch, S. Privacy Awareness: A Means to Solve the Privacy Paradox? In The Future of Identity in the Information Society; Springer: Berlin/Heidelberg, Germany, 2009; pp. 226–236. [Google Scholar]
- Onwubiko, C.; Owens, T. Review of Situational Awareness for Computer Network Defense. In Situational Awareness in Computer Network Defense: Principles, Methods and Applications; IGI Global: Hershey, PA, USA, 2012. [Google Scholar]
- Onwubiko, C.; Owens, T. Functional Requirements of Situational Awareness in Computer Network Security. In Proceedings of the IEEE International Conference on Intelligence and Security Informatics, Dallas, TX, USA, 8–11 June 2009; pp. 209–213. [Google Scholar]
- Legg, P.A. Visualizing the insider threat: Challenges and tools for identifying malicious user activity. In Proceedings of the IEEE Symposium on Visualization for Cyber Security (VizSec), Chicago, IL, USA, 25 October 2015; pp. 1–7. [Google Scholar]
Figure 1.
Botnet experimental setup.

Figure 2.
Exposure to IoT devices and level of security concern.

Figure 3.
IoT device feature importance.

Figure 4.
IoT device feature rank.

Figure 5.
IoT IP Camera Video Feed (scenario one and two).

Figure 6.
IoT Camera Video Feed (scenario three and four).

Figure 7.
User perception of detection difficulty.


Table 1.
Detection accuracy within knowledge level (all scenarios).
| Knowledge | Scenario 1 (no) | Scenario 2 (dns) | Scenario 3 (syn) | Scenario 4 (greip) | |
|---|---|---|---|---|---|
| n (%) | n (%) | n (%) | n (%) | p | |
| Novice | 19 (83) | 0 (0) | 11 (48) | 2 (9) | <0.001 |
| Intermediate | 39 (56) | 15 (21) | 41 (59) | 28 (40) | <0.001 |
| Advanced | 30 (53) | 15 (26) | 37 (65) | 23 (40) | <0.001 |
| Expert | 7 (88) | 1 (13) | 6 (75) | 5 (63) | <0.050 |
Table 2.
Scenario one detection rate (no attack).
| Detected | 0–10 s | 11–20 s | 21–30 s | 31–40 s | 41-50 s | 51–60 s | Dont Know |
|---|---|---|---|---|---|---|---|
| n (%) | n (%) | n (%) | n (%) | n (%) | n (%) | n (%) | |
| Yes | 22 (14) | 24 (15) | 26 (16) | 23 (15) | 24 (15) | 13 (8) | 97 (61) |
| No | 136 (86) | 134 (85) | 132 (84) | 135 (85) | 134 (85) | 145 (92) | 61 (39) |
Table 3.
Scenario two detection rate (dns attack).
| Detected | 0–10 s | 11–20 s | 21–30 s | 31–40 s | 41–50 s | 51–60 s | Dont Know |
|---|---|---|---|---|---|---|---|
| n (%) | n (%) | n (%) | n (%) | n (%) | n (%) | n (%) | |
| Yes | 35 (22) | 26 (16) | 33 (21) | 29 (18) | 30 (19) | 23 (15) | 94 (59) |
| No | 123 (78) | 132 (84) | 125 (79) | 129 (82) | 128 (81) | 135 (85) | 64 (41) |
Table 4.
Scenario three detection rate (syn attack).
| Detected | 0–10 s | 11–20 s | 21–30 s | 31–40 s | 41–50 s | 51–60 s | Dont Know |
|---|---|---|---|---|---|---|---|
| n (%) | n (%) | n (%) | n (%) | n (%) | n (%) | n (%) | |
| Yes | 36 (23) | 76 (48) | 92 (58) | 53 (34) | 30 (19) | 27 (17) | 38 (24) |
| No | 122 (77) | 82 (52) | 66 (42) | 105 (66) | 128 (81) | 131 (83) | 120 (76) |
Table 5.
Scenario four detection rate (greip attack).
| Detected | 0–10 s | 11–20 s | 21–30 s | 31–40 s | 41–50 s | 51–60 s | Dont Know |
|---|---|---|---|---|---|---|---|
| n (%) | n (%) | n (%) | n (%) | n (%) | n (%) | n (%) | |
| Yes | 44 (28) | 34 (22) | 39 (25) | 47 (30) | 51 (32) | 30 (19) | 65 (41) |
| No | 114 (72) | 124 (78) | 119 (75) | 111 (70) | 107 (68) | 128 (81) | 93 (59) |
Table 6.
Detection accuracy by knowledge level (no attack).
| Knowledge | Novice | Intermediate | Advanced | Expert |
|---|---|---|---|---|
| n (%) | n (%) | n (%) | n (%) | |
| Yes | 19 (83) | 39 (56) | 30 (53) | 7 (88) |
| No | 4 (17) | 31 (44) | 27 (47) | 1 (13) |
| n = 158, p = 0.026 | ||||
Table 7.
Detection accuracy by knowledge level (dns attack).
| Knowledge | Novice | Intermediate | Advanced | Expert |
|---|---|---|---|---|
| n (%) | n (%) | n (%) | n (%) | |
| Yes | 0 (0) | 15 (21) | 15 (26) | 1 (13) |
| No | 23 (100) | 55 (79) | 42 (74) | 7 (88) |
| n = 158, p = 0.054 | ||||
Table 8.
Detection accuracy by knowledge level (syn attack).
| Knowledge | Novice | Intermediate | Advanced | Expert |
|---|---|---|---|---|
| n (%) | n (%) | n (%) | n (%) | |
| Yes | 11 (48) | 41 (59) | 37 (65) | 6 (75) |
| No | 12 (52) | 29 (41) | 20 (35) | 2 (25) |
| n = 158, p = 0.423 | ||||
Table 9.
Detection accuracy by knowledge level (greip attack).
| Knowledge | Novice | Intermediate | Advanced | Expert |
|---|---|---|---|---|
| n (%) | n (%) | n (%) | n (%) | |
| Yes | 2 (9) | 28 (40) | 23 (40) | 5 (63) |
| No | 21 (91) | 42 (60) | 34 (60) | 3 (38) |
| n = 158, p = 0.013 | ||||
© 2019 by the authors. Licensee MDPI, Basel, Switzerland. This article is an open access article distributed under the terms and conditions of the Creative Commons Attribution (CC BY) license (http://creativecommons.org/licenses/by/4.0/).
Share and Cite
MDPI and ACS Style
McDermott, C.D.; Isaacs, J.P.; Petrovski, A.V. Evaluating Awareness and Perception of Botnet Activity within Consumer Internet-of-Things (IoT) Networks. Informatics 2019, 6, 8. https://doi.org/10.3390/informatics6010008
AMA Style
McDermott CD, Isaacs JP, Petrovski AV. Evaluating Awareness and Perception of Botnet Activity within Consumer Internet-of-Things (IoT) Networks. Informatics. 2019; 6(1):8. https://doi.org/10.3390/informatics6010008
Chicago/Turabian StyleMcDermott, Christopher D., John P. Isaacs, and Andrei V. Petrovski. 2019. "Evaluating Awareness and Perception of Botnet Activity within Consumer Internet-of-Things (IoT) Networks" Informatics 6, no. 1: 8. https://doi.org/10.3390/informatics6010008
Note that from the first issue of 2016, this journal uses article numbers instead of page numbers. See further details here.